


Introduction
Glaciers with extensive mantles of supraglacial debris on their ablation areas are widely present in many high mountain ranges including the Himalaya (e.g. Reference Scherler, Bookhagen and StreckerScherler and others, 2011; Reference BolchBolch and others, 2012; Reference Frey, Paul and StrozziFrey and others, 2012). In this region, an expansion of sediment- and rock-covered areas has been observed in recent decades due to glacier surface-lowering and unstable adjacent slopes, processes that are likely associated with climate change (Reference Bolch, Buchroithner, Pieczonka and KunertBolch and others, 2008; Reference Schmidt and NüsserSchmidt and Nüsser, 2009; Reference Shukla, Gupta and AroraShukla and others, 2009; Reference Bhambri, Bolch, Chaujar and KulshreshthaBhambri and others, 2011). Improved knowledge of debris-covered glaciers and their response to climate change is not only interesting from a scientific perspective focused on process understanding, but also essential for the quantification of glacier runoff, as well as for present and future water availability (Reference WagnonWagnon and others, 2007; Reference Brock, Mihalcea, Kirkbride, Diolauiuti, Cutler and SmiragliaBrock and others, 2010; Reference Zhang, Fujita, Liu, Liu and NuimuraZhang and others, 2011; Reference Reid, Carenzo, Pellicciotti and BrockReid and others, 2012; Reference Juen, Mayer, Lambrecht, Han and LiuJuen and others, 2014). Several studies (Reference ÖstremÖstrem, 1959; Reference Nakawo and YoungNakawo and Young, 1981; Reference Mattson, Gardner and YoungMattson and others, 1993; Reference Kayastha, Takeuchi, Nakawo and AgetaKayastha and others, 2000; Reference Mihalcea, Mayer, Diolaiuti, Lambrecht, Smiraglia and TartariMihalcea and others, 2006; Reference Nicholson and BennNicholson and Benn, 2006; Reference Brock, Mihalcea, Kirkbride, Diolauiuti, Cutler and SmiragliaBrock and others, 2010; Reference Reid and BrockReid and Brock, 2010; Reference LambrechtLambrecht and others, 2011) have shown relations between debris thickness and ablation rates of the ice beneath. Where ice is covered with very thin debris (1–2 cm), melt is enhanced compared with clean ice as a result of increased absorption of solar radiation and the related rapid heat transfer. On the other hand, melt rates are reduced compared with those of clean ice if debris is thicker than a few centimetres as less surface heat will be conducted through the debris layer and transferred to the ice. Hence, from a hydrological perspective, it is crucial to know where debris is thin enough to enhance melt and where it is above a critical thickness to reduce melt. This is why both, debris-covered area and debris thickness, are critical variables for melt. While the extent of debris can be delineated manually using satellite images (Reference Frey, Paul and StrozziFrey and others, 2012; Reference PaulPaul and others, 2013), thickness estimations are difficult to achieve over larger areas. At the local scale, in situ measurements of debris thickness have been conducted on several glaciers at individual points: Haut Glacier d’Arolla (Swiss Alps; Reference Reid, Carenzo, Pellicciotti and BrockReid and others, 2012), Pasterze glacier (Austrian Alps; Reference Kellerer-Pirklbauer, Lieb, Avian and GspurningKellerer-Pirklbauer and others, 2008), Miage glacier (Italian Alps; Reference MihalceaMihalcea and others, 2008a), Hailuogou Glacier (Tibetan Plateau; Reference Zhang, Fujita, Liu, Liu and NuimuraZhang and others, 2011), Koxkar Glacier (central Tien Shan; Reference Juen, Mayer, Lambrecht, Han and LiuJuen and others, 2014), Lirung Glacier (Nepalese Himalaya; Reference Petersen, Schauwecker, Brock, Immerzeel and PellicciottiPetersen and others, 2013), Khumbu Glacier (Nepalese Himalaya; Reference Nakawo, Iwata, Watanabe and YoshidaNakawo and others, 1986) and Imja-Lhotse Shar Glacier (Nepalese Himalaya; Reference Rounce and McKinneyRounce and McKinney 2014).
Recent studies have confirmed a good correlation between debris thickness d and surface temperature T s for values of d ranging between 1 and 40 cm (Reference MihalceaMihalcea and others, 2008a) and therefore confirmed the feasibility of estimating debris thickness based on surface temperature. Empirical relationships have been developed to map d based on thermal band imagery for glaciers for which extensive field measurements exist (Reference MihalceaMihalcea and others, 2008a,b). Since these models account for a known relationship between d and T s, extensive field measurements of debris thickness and surface temperature are needed for the date on which the satellite image was taken. The transferability to other images or glaciers is therefore limited.
To overcome the limitations of empirical relationships, Reference Foster, Brock, Cutler and DiotriFoster and others (2012) developed an energy-balance model approach to map debris thickness on Miage glacier using meteorological data in conjunction with Advanced Spaceborne Thermal Emission and Reflection Radiometer (ASTER) thermal band imagery. Methods such as these, which are based on satellite imagery along with climate reanalysis data, have the advantage of mapping debris thickness of remote glaciers without the need for detailed in situ data. They provide valuable tools for distributed ablation modelling, since in situ debris thickness measurements are very time-consuming and the sites are often difficult to access. In fact for large debris-covered glaciers it is often impossible to measure debris thickness directly by extensive in situ measurements (e.g. in a 90 m × 90 m grid). The approach (Reference Foster, Brock, Cutler and DiotriFoster and others, 2012) was applied to an alpine glacier. The method was further developed by Reference Rounce and McKinneyRounce and McKinney (2014) and applied to a glacier in the Khumbu region, with meteorological data from a nearby meteorological station. It showed promising results for mapping debris thickness without detailed field measurements. A common limitation of the energy-balance model approach is underestimation of mapped supraglacial sediment (e.g. Reference Suzuki, Fujita and AgetaSuzuki and others, 2007; Reference SchauweckerSchauwecker, 2012; Reference Petersen, Schauwecker, Brock, Immerzeel and PellicciottiPetersen and others, 2013; Reference Rounce and McKinneyRounce and McKinney, 2014), and hence there is a need for further research. The underestimation has been related in some cases to the mixed-pixel effect of poor-resolution digital elevation models (DEMs) (Reference Suzuki, Fujita and AgetaSuzuki and others, 2007; Reference Rounce and McKinneyRounce and McKinney, 2014), and will be discussed here in view of the single energy-balance components. A further limitation arises from unknown meteorological conditions on widely debris-covered tongues, here assessed through testing the performance of reanalysis data and parameterizations.
The main aim of this study is to further develop the approach of Reference Foster, Brock, Cutler and DiotriFoster and others (2012) in view of applying it in the Himalaya, by evaluating the performance and uncertainty that arises when applying the approach to a debris-covered glacier where detailed field measurements are sparse. The evaluation is performed by (1) assessing the spatial distribution of surface temperature for different satellite scenes and sensors, (2) estimating introduced uncertainty by single input parameters for debris properties, meteorological variables from reanalysis data and parameterizations of energy fluxes and (3) mapping debris thickness and discussing the underestimation and uncertainty arising through the use of different assumptions.
Study Site
Bara Shigri Glacier (32.21° N, 77.63° E) is the largest glacier in the Indian state of Himachal Pradesh (Fig. 1). About 16% of the glacier area in this region is covered by debris (Reference Frey, Paul and StrozziFrey and others, 2012). The glacierized area of Bara Shigri Glacier extends from 3920 m a.s.l. at the terminus to ∼6000 m a.s.l., comprising an area of ∼131 km2 in 2002 and a length of 28 km. The glacier flows in a northwest direction and is fed by several tributaries. The Bara Shigri glacial stream feeds its waters into the Chandra River ∼3 km below the present-day glacier terminus. About 14% of the total glacier surface of Bara Shigri is extensively debris-covered. At ∼4900 m a.s.l., where the main glacier tributaries confluence (‘Konkordiaplatz’), debris appears in the form of medial moraines. Further down, the glacier tongue is continuously covered by moraine material. Reference Tiwari, Gupta, Gens and PrakashTiwari and others (2012) characterized the tongue of Bara Shigri as covered by widespread and fine-grained debris with variable water content. Various lakes between 20 and 170 m in diameter have been identified using optical-thermal images (ASTER) and radar (Reference Tiwari, Gupta, Gens and PrakashTiwari and others, 2012). Based on manual digitization of a Satellite Pour l’Observation de la Terre (SPOT) image taken in June 2014, we identified ∼60–70 supraglacial lakes with area >500 m2 on the lower part of the glacier tongue (Fig. 1).
(a) Location of the study area and the two meteorological stations: Keylong (India, 3119 m a.s.l.) and Pyramid (Nepal, 5050 m a.s.l.). (b) Overview map with Bara Shigri Glacier and the adjacent benchmark Chhota Shigri Glacier to the west (Reference WagnonWagnon and others, 2007). Debris outlines were provided by Reference Frey, Paul and StrozziFrey and others (2012) and glacier outlines are made available by GLIMS (Reference Raup, Racoviteanu, Khalsa, Helm, Armstrong and ArnaudRaup and others, 2007). Supraglacial ponds on the lower part of the glacier tongue (below black dotted curve) are manually digitized based on a SPOT image taken in June 2014.

Bara Shigri Glacier lies on the northern slopes of the main Pir Panjal range, a crystalline axis composed mostly of metamorphites, migmatites and gneisses (Reference Kumar, Rai, Purohit, Rawat and MundepiKumar and others, 1987). Reference DuttDutt (1961) reported that the bedrock and moraines of Bara Shigri are mainly dark-brown mica schist with occasional Haimanta (Cambrian) conglomerates. Further up-glacier and over a distance of several kilometres bedrock is formed by granite, gneiss, muscovite-quartzite and schist (Reference Singh, Ramanathan and KuriakoseSingh and others, 2015).
Data
The method applied in this study requires a combination of remotely sensed estimates of surface temperature, other meteorological data and data on debris properties.
ASTER surface kinetic temperature images (AST08) were acquired from the Land Processes Distributed Active Archive Center (LPDAAC). For most scenes, surface temperature can be derived within an accuracy and precision of ± 1.5 K (Reference Gillespie, Rokugawa, Matsunaga, Cothern, Hook and KahleGillespie and others, 1998) and a spatial resolution of 90 m. From the Landsat 7 Enhanced Thematic Mapper Plus (ETM+) satellite imagery, we used the thermal band (band 6), which is acquired at 60 m resolution and automatically processed to 30 m pixels. Surface temperature is derived according to NASA (http://landsathandbook.gsfc.nasa.gov/). Seven ASTER and six Landsat 7 images were analysed for clear-sky days during the dry season (September–November) with snow-free ablation areas (Table 1). For the estimation of debris thickness, only images with >10% debris-covered area exceeding 0°C were considered, since the model used cannot map debris thickness for cells with negative surface temperature values. On homogeneous areas, in situ thermistor measurements and ASTER surface temperature estimations have been found to correlate well (Reference MihalceaMihalcea and others, 2008a, fig. 3).
Date, time and percent of debris-covered area with surface temperature below 0°C for 13 acquired satellite images. Only images with <10% debris-covered area below 0°C were used for the estimation of debris thickness

Reanalysis data for air temperature T a, wind speed u, relative humidity rh and precipitable water pw are used as inputs for the estimation of local meteorological variables. We compare temperature and wind speed from reanalysis data with measurements from two meteorological stations to estimate the accuracy of the gridded climate data in the Himalayan region. The first meteorological station Keylong (32.57° N, 77.03° E) is part of the automated network maintained by the India Meteorological Department (IMD). The station is located close to a small village, about 70 km northwest of the study site at an elevation of 3119 m a.s.l. Pyramid station (27.958° N, 86.813° E) is located at an elevation of 5050 m a.s.l. in the Khumbu valley (Nepal). We used the two most widely used reanalysis products, namely the NCEP/NCAR (National Centers for Environmental Prediction/National Center for Atmospheric Research) (Reference KalnayKalnay and others, 1996) and ERA-Interim (European Centre for Medium-Range Weather Forecasts Interim Re-analysis) (Reference DeeDee and others, 2011) datasets. Comparison of reanalysis data with meteorological field data was performed for clear-sky days of the dry season (September–November) at 06:00 UTC, the approximate time of the satellite overpass at Bara Shigri Glacier. We used data for 700 hPa (∼3100 m a.s.l.) and 500 hPa (∼5800 m a.s.l.) for comparison with the observed meteorological records. For debris thickness estimation, reanalysis values for air temperature and relative humidity from NCEP/NCAR were used for the 600 hPa level (∼4360 m a.s.l.).
Parameter values for albedo α, thermal conductivity K, emissivity ε and surface roughness z 0 are taken from field measurements and published literature on Himalayan and alpine glaciers (Table 2; Reference Conway and RasmussenConway and Rasmussen, 2000; Reference Takeuchi, Kayastha and NakawoTakeuchi and others, 2000; Reference Brock, Mihalcea, Kirkbride, Diolauiuti, Cutler and SmiragliaBrock and others, 2010; Reference Foster, Brock, Cutler and DiotriFoster and others, 2012; Reference SchauweckerSchauwecker, 2012; Reference Lejeune, Bertrand, Wagnon and MorinLejeune and others, 2013; Reference Nicholson and BennNicholson and Benn, 2013; Reference Petersen, Schauwecker, Brock, Immerzeel and PellicciottiPetersen and others, 2013; Reference Rounce and McKinneyRounce and McKinney, 2014). Glacier and debris masks were used to restrict debris thickness maps to the debris-covered areas of the glacier. The outline of debris extent was reconstructed based on debris outlines compiled from satellite data for a glacier inventory for the western Himalaya (Reference Frey, Paul and StrozziFrey and others, 2012). Glacier outlines were obtained from the Global Land and Ice Measurements from Space (GLIMS).
Values from the literature for albedo, thermal conductivity, emissivity, surface roughness and parameters a and b from Eqn (6)

Methods
Energy balance to compute debris thickness (model F12)
The F12 approach is described briefly below, as it was used and further developed in view of its application to Himalayan glaciers. Debris thickness d is mapped for every pixel of the spaceborne debris surface temperature T s by solving the energy balance for the debris-covered glacier surface with d as a residual. The energy-balance equation describes that the change in heat stored within a defined volume of debris is equal to the sum of all fluxes towards the debris volume, given by

where ΔD is the rate of change in heat stored within debris, S net is net shortwave radiation, L net is net longwave radiation, H is the sensible turbulent heat flux and G is the conductive heat flux. Energy contributions provided by rain and latent heat are neglected, assuming that the debris layer is dry at the time of satellite image acquisition (Reference Brock, Rivera, Casassa, Bown and AcuñaBrock and others, 2007, Reference Brock, Mihalcea, Kirkbride, Diolauiuti, Cutler and Smiraglia2010). Fluxes are considered positive when directed towards the debris layer.
Energy transfer within debris is reduced here to conductive heat flux G, neglecting other transfer energy sources and sinks (e.g. convection, advection, phase changes or ventilation). The one-dimensional conductive heat flux G is estimated from Fourier’s law as a function of the effective conductivity K of the debris material and the temperature gradient within the layer dT/dz. Assuming a linear temperature gradient within the debris surface, and temperature of the ice–debris interface to be at melting point,

where T s is debris surface temperature and d is debris thickness. Conductivity K is strongly influenced by the moisture content of the debris surface. Here we assume that the uppermost level of the debris layer is dry and use a spatially constant value for the conductivity of dry material.
The rate of change in heat stored, ΔD, at the time of the image acquisition results from the morning warming of the debris layer. This heat flux depends on the density and specific heat of the debris layer, the rate of temperature change and debris thickness. Stored heat cannot be determined precisely in this approach as satellite thermal band imagery has a daily resolution and does not represent a sequence of images. Reference Foster, Brock, Cutler and DiotriFoster and others (2012) therefore assumed that the rate of change in heat stored is a fraction F (hereafter referred to as ‘stored heat factor F’) of the conductive heat flux in the form

Using these assumptions, debris thickness is given by

Net shortwave radiation S net is calculated from S in(1 − albedo), using a spatially constant value for albedo, according to Reference Rounce and McKinneyRounce and McKinney (2014). Reference Foster, Brock, Cutler and DiotriFoster and others (2012) proposed taking a spatially constant value for albedo for Miage glacier due to minor measured spatial variation (Reference Brock, Mihalcea, Kirkbride, Diolauiuti, Cutler and SmiragliaBrock and others, 2010). Incoming shortwave radiation S in is computed using the equations of Reference Strasser, Corripio, Pellicciotti, Burlando, Brock and FunkStrasser and others (2004) for a clear-sky situation. Incoming longwave radiation can be estimated through parameterizations as described by Reference BruntBrunt (1932) or Reference BrutsaertBrutsaert (1975). Outgoing longwave radiation L out is computed based on the Stefan–Boltzmann law, using surface temperature T s from the satellite images and spatially constant emissivity. The sensible heat flux H is calculated using the bulk aerodynamic approach

where u is wind speed, T a and T s are air and debris surface temperatures, respectively, and D is a bulk exchange coefficient. D can be calculated using a stability correction based on the bulk Richardson number (Reference BrutsaertBrutsaert, 1975; Reference OkeOke, 1987).
Air temperature T a distribution over glaciers is commonly extrapolated from station data by applying a spatially constant lapse rate, which may not hold for debris-covered glaciers. Reference Foster, Brock, Cutler and DiotriFoster and others (2012) proposed that air temperature is strongly related to surface temperature T s in the morning, with strong insolation and low wind speed. At this time of the day, under strong insolation, above debris-covered surfaces, sensible as well as longwave heat fluxes are directed upwards transferring heat to the near-surface air (Reference Reid and BrockReid and Brock, 2010). Based on data from Miage glacier, Reference Foster, Brock, Cutler and DiotriFoster and others (2012) computed an empirical relationship in the form

where T a is air temperature, T s is surface temperature and a and b are empirical parameters that can be derived based on measurements of air temperature and surface temperature on debris-covered glaciers. Table 2 shows values for the linear regression of air temperature against surface temperature for three sites in the European Alps and the Himalaya with different elevation and debris cover. Here we take values from Lirung and Miage glaciers to extrapolate air temperature across the glacier surface.
Extension of the F12 approach
In view of the different regional context and comparably limited number of existing field-based data, we modified the F12 approach to make it applicable to an extensively debris-covered glacier in the Indian Himalaya. The modifications, illustrated schematically in Figure 2, are mainly related to: (1) the vertical temperature gradient within the debris layer, which is possibly not linear within the debris layer in the morning; and (2) the energy balance, which has been closed in this application for the uppermost layer (uppermost 10%) rather than for the entire debris cover.
Schematic view of changes added to the F12 approach presented by Reference Foster, Brock, Cutler and DiotriFoster and others (2012) to map debris thickness with reanalysis data and thermal band surface temperature. Additions to the original approach are highlighted in red.

Observations have shown that temperature gradients within a debris layer are not linear at ∼10.00–12.00 local time, as illustrated in Figure 3 (Reference Conway and RasmussenConway and Rasmussen, 2000; Reference Han, Ding and LiuHan and others, 2006; Reference Nicholson and BennNicholson and Benn, 2006; Reference Reid and BrockReid and Brock, 2010; Reference Lejeune, Bertrand, Wagnon and MorinLejeune and others, 2013). Taking a linear gradient within the entire debris leads to a large underestimation of debris thickness. Recently published results by Reference Rounce and McKinneyRounce and McKinney (2014) also indicate that accounting for a nonlinear temperature gradient is crucial. Here instead of taking a linear gradient, we estimate the depth d 0 at which the linear temperature gradient would reach 0°C. Based on field measurements, the 0°C depth is estimated to be half of the total debris depth (d 0 = i d · d). Conductive heat flux is then computed by

where T 0 is 0°C and the factor i d is 0.5.
Temperature profiles within the supraglacial debris at about noon local time as published in the literature.

We assume that F is a function of debris thickness and thus should be represented by a dependent stored heat factor F(d). For a thin debris cover, we assume that the surface is close to an equilibrium temperature and is not warming strongly in the morning. The energy from the surface is conducted through the debris layer and melts the ice beneath, leading to a linear temperature gradient and a small F (small fraction ΔD/G). Where debris is thick, the diurnal temperature maxima of the debris surface increases. Energy from the surface is used to heat the debris layer, resulting in a larger F (large fraction ΔD/G). Based on data found in the literature (Reference Conway and RasmussenConway and Rasmussen, 2000; Reference Nicholson and BennNicholson and Benn, 2006; Reference Reid and BrockReid and Brock, 2010; Reference Foster, Brock, Cutler and DiotriFoster and others, 2012; Reference Lejeune, Bertrand, Wagnon and MorinLejeune and others, 2013) this relationship can be expressed by a polynomial function of the order 2 with R 2 = 0.97 (Fig. 4). However, we found that the iterated result converges to 0 for F < 1. Therefore, the assumption of a linear relationship with F = 1 where d = 0 is necessary. Debris thickness d is finally derived by rearranging the energy balance and Fourier’s law in order to get the result by iteration:

Stored heat factor F for the upper ∼10–50% of the debris layer at about noon as a function of debris thickness using vertical temperature profiles published in the literature. Note that F increases with increasing debris thickness.

Here the parameters m and n are taken from the linear regression in Figure 4. The debris thickness d is evaluated iteratively; it is first evaluated for a neutral F, this value is used to make an initial estimate of F, which is then used to recalculate d; the procedure is repeated until the value of d converges.
Model Application
Satellite-derived surface temperatures
The F12 model is transferable in time (applicable to different satellite images), given that the pattern and distribution of computed d are consistent for different satellite images. Since d is calculated as a function of T s, with increasing computed debris thickness for warmer surfaces, spatial patterns of T s are also required to be consistent among different satellite images. Hence an important test for the model performance and transferability involves comparing the spatial distribution of remotely sensed surface temperatures between different satellite scenes.
Figures 5 and 6 show that the distribution and pattern of the standardized surface temperatures are highly consistent for different scenes and sensors (ASTER and Landsat 7), despite differences in mean surface temperature. Relatively high surface temperatures are observed for the medium moraine and the eastern edge of the glacier tongue, as well as across the lowest part of the tongue. Figure 7 shows that mean surface temperature is clearly correlated with modelled incoming shortwave radiation at the time of satellite image acquisition, with R 2 = 0.75, and to air temperature from reanalysis data (for 32.5° N, 77.5° E at 600 hPa), with R 2 = 0.74.
Histograms of surface temperature and standardized surface temperature for the debris-covered area of Bara Shigri Glacier, based on seven ASTER and six Landsat 7 satellite images taken in dry season conditions between 1999 and 2012 on clear-sky days. Date format is dd.mm.yyyy.

Maps of standardized surface temperature for Bara Shigri Glacier based on three ASTER thermal band satellite images. Relatively high surface temperatures are observed for the medium moraine and the eastern edge of the glacier tongue, as well as across the lowermost part of the tongue. Date format is dd.mm.yyyy.

Incoming shortwave radiation (using the approach described by Reference Strasser, Corripio, Pellicciotti, Burlando, Brock and FunkStrasser and others, 2004) and NCEP/NCAR air temperature versus mean ASTER (open symbols) and Landsat 7 (solid symbols) surface temperature of the debris-covered glacier area of Bara Shigri Glacier.

Reanalysis data versus station data
Reanalysis data, including wind speed, air temperature, relative humidity and precipitable water, are used to compute shortwave and longwave radiation and turbulent sensible heat flux. We compare reanalysis data for wind speed and air temperature from both ERA-Interim and NCEP/NCAR with the Keylong station data to check their representativeness within the Himalayan region.
700 hPa level air temperature from NCEP/NCAR and ERA-Interim has been used for the computation of downwelling longwave radiation and correlates well with measured air temperature from Keylong station (Fig. 8a). Reanalysis data tend to slightly underestimate local values for air temperature, probably because they represent free atmosphere and do not consider boundary layer effects.
Reanalysis (ERA-Interim and NCEP/NCAR) 700 hPa level data versus station measurements at Keylong for (a) air temperature and (b) wind speed.

Wind speed from reanalysis data, used for the computation of turbulent fluxes, is not correlated with measurements from meteorological stations (Fig. 8b). To overcome the low quality in input variables for wind speed, we conducted a statistical analysis of the Keylong and Pyramid station data. The analysis shows that wind speed for clear-sky days from September to November at 06.00 UTC is mostly 1–4 m s−1 for Keylong station (Fig. 9a) and 3–7 m s−1 for Pyramid station (Fig. 9b), whereas the distribution is much more scattered for the entire period including all time steps. Given the lack of correlation between reanalysis and measured wind speed, we used measured wind speed at the adjacent station and assumed that wind speed on Bara Shigri is close to 3 m s−1 at the time of satellite overpass.
Histograms of wind speed measured at (a) Keylong and (b) Pyramid meteorological stations during all seasons and times (grey bars) as well as for September–November from 05.00 to 07.00 UTC for clear-sky conditions with incoming shortwave radiation >800 W m−2 (black bars).

Parameterization of radiative fluxes
Longwave radiation fluxes are computed for the Khumbu region using the empirical relationships introduced by Reference BruntBrunt (1932) and Reference BrutsaertBrutsaert (1975). The parameterization by Reference BruntBrunt (1932) relates clear-sky emissivity to screen-level measurements of air temperature and humidity, using empirically determined coefficients. Reference BrutsaertBrutsaert (1975) developed a more physically based approach based on Schwarzschild’s transfer equations for simple atmospheric profiles of a certain air temperature and vapour pressure. Parameterizations of downwelling longwave radiation L in are compared with meteorological data from Pyramid station under clear-sky conditions (S in > 800 W m−2) from September to November at about noon. In addition, we compared ERA-Interim downwelling longwave radiation to the station measurements. ERA-Interim overestimates incoming longwave radiation by an average of ∼60 W m−2 compared with station measurements (Fig. 10a). Both parameterizations are accurate for measured longwave radiation below ∼230 W m−2, whereas an underestimation is found for the higher end of measured high longwave radiation. For the purpose of this study, the method of Reference BrutsaertBrutsaert (1975) seems to be more accurate, with a root-mean-square error (RMSE) of 5.9 W m−2 (compared with RMSE = 11.2 W m−2) for situations with measured incoming longwave radiation below 230 W m−2.
Modelled versus measured radiation fluxes for Pyramid station at 06.00 UTC between September and November 2002–08 where incoming shortwave radiation was above 800 W m−2: (a) downwelling longwave radiation and (b) incoming shortwave radiation. For longwave radiation, RMSE and R 2 are given for measured incoming longwave radiation below 230 W m−2.

Shortwave radiation was computed using the parameterization proposed by Reference Strasser, Corripio, Pellicciotti, Burlando, Brock and FunkStrasser and others (2004) accounting for the total transmittance of the atmosphere, given as the product of the individual transmittances. Precipitable water is taken from ERA-Interim reanalysis data, and a spatially constant value for incoming shortwave radiation is assumed. Direct solar radiation under clear-sky conditions is assumed to vary only slightly within the elevation range ∼3900–5000 m a.s.l. for Bara Shigri. In addition, the surface of debris-covered glacier tongues is assumed to be flat, as any improvement in model performance including the slope proved to be questionable, at least for the European Alps (Reference Foster, Brock, Cutler and DiotriFoster and others, 2012). As the local time of image acquisition is almost midday, spatial variations due to horizon obstruction and reflections are neglected. The parameterization of incoming shortwave radiation is compared with the Pyramid data for September–November for 06.00 UTC in order to validate the approach developed by Reference Strasser, Corripio, Pellicciotti, Burlando, Brock and FunkStrasser and others (2004) for clear-sky conditions at about noon in the Himalaya. As can be seen from Figure 10b, the parameterization of shortwave radiation in some cases tends to strongly over- or underestimate measured values. Nevertheless, the performance proves to be good (RMSE = 77.4, R 2 =0.56) for the range of measured shortwave radiation of 800–1300 W m−2 and corresponds to the approximate range of clear-sky situations.
Sensitivity analysis
In a next step we introduce a sensitivity analysis to see how the uncertainty of modelled debris thickness can be apportioned to energy fluxes, input variables and parameters. We therefore run the model 103 times for each variable and parameter by varying one parameter while keeping the others constant. Input variables for wind speed were assumed to be normally distributed. Parameters were varied uniformly within a range of plausible values taken from the literature or normally distributed with estimated mean values and standard deviations (Table 3). Long- and shortwave radiation fluxes were computed with the parameterizations introduced by Reference BrutsaertBrutsaert (1975) and Reference Strasser, Corripio, Pellicciotti, Burlando, Brock and FunkStrasser and others (2004), respectively, and varied by the standard deviation, which was derived by comparing computations with station data. The sensitivity analysis was based on the satellite image taken on 23 September 2012, assuming that the uncertainty of the parameters and variables is transferable to other images. The uncertainty of the results is evaluated as a function of debris thickness.
Standard deviation of estimated heat fluxes and ranges of input parameters and variables used for the sensitivity analysis. The right column explains for which energy-balance components the input values and parameters are used

The parameters introducing most uncertainty are related to the unknown temperature profile within the debris at the time of satellite image acquisition (Fig. 11a). The highest uncertainty is introduced by estimation of a linear temperature gradient within the debris (expressed by the 0°C depth factor i d) and the relation of stored heat to conducted heat (expressed by the stored heat factor F). Moreover, thermal conductivity introduces considerable uncertainty, followed by surface temperature T s. In this context, surface temperature estimation T s from the satellite image leads to notable uncertainties for low debris thickness.
Coefficient of variation of modelled debris thickness as a function of surface temperature T s (a) for different parameters (0°C depth factor i d, stored heat factor F, conductivity K, surface temperature T s) and (b) for different heat fluxes (incoming and outgoing shortwave (S in, S out) and longwave radiation (L in, L out) and turbulent sensible heat flux H).
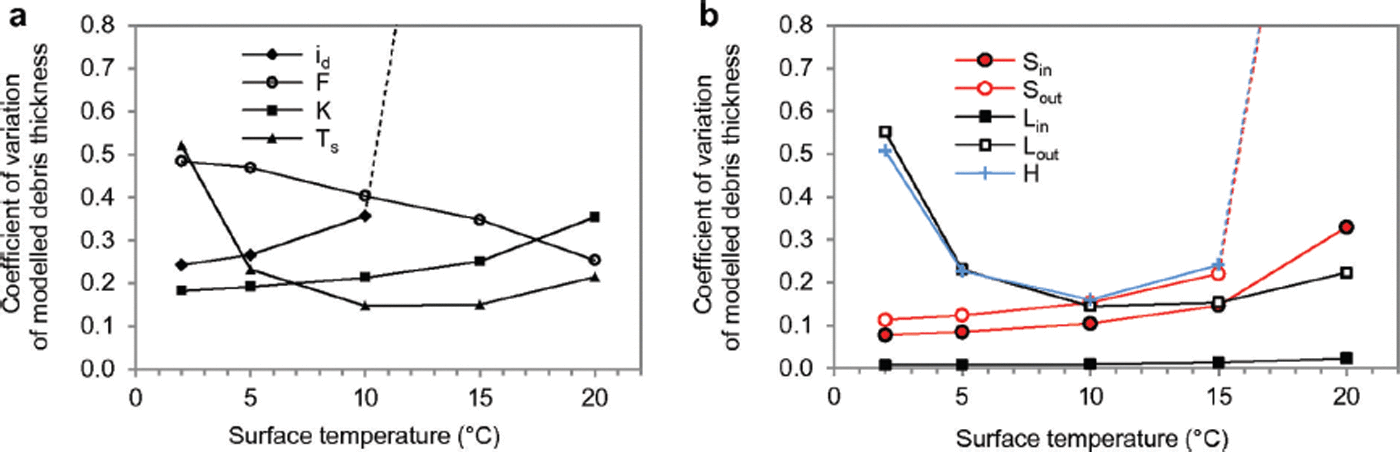
Generally, the single energy fluxes present smaller uncertainty than the characteristics of the debris (Fig. 11). For low temperatures, L out and H are important, whereas H and S out (through albedo) are important for warm surfaces. For warm surfaces, the uncertainty of H becomes very high, mainly due to the unknown air temperature, followed by surface roughness z 0 and wind speed u.
Debris thickness
The total uncertainty of model results that arises in estimating physical parameters and taking meteorological variables from reanalysis data was assessed by running the model several times and by varying randomly and simultaneously input variables and parameters. Figure 12 shows that uncertainty is small for cool surfaces but it increases significantly with increasing surface temperature, especially for temperature above ∼10°C for which debris thickness cannot be estimated with reasonable certainty. Even though i d and F were held constant in Figure 12, the uncertainties are considerable. It seems that above ∼10°C, the method cannot be relied upon to give accurate results, although it should correctly identify the pixel as relatively thick debris. The spread in results is small for relatively cool surfaces, which means that thin debris can be identified with a lower uncertainty.
Distribution of the modelled debris thickness (varying the energy fluxes, input parameters and variables) for different surface temperatures as analysed for the ASTER scene taken on 23 September 2012 assuming constant 0°C depth (i d = 0.5) and stored heat factor (F = 3).

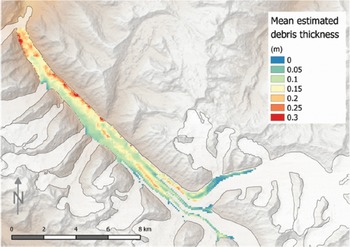
A final debris thickness map was calculated for the entire debris-covered area, including each of the satellite imagery scenes (Fig. 13). The final debris thickness values of every pixel represent the mean of six satellite images, whereas the values of every image are from the median value of the 103 runs. In their work conducted in the Alps and based on extensive field data, Reference Foster, Brock, Cutler and DiotriFoster and others (2012) concluded that the F12 model is able to properly identify areas with thick debris cover (>50 cm). By analogy and assuming comparable system behaviour, we can assume that debris cover passes this threshold at the medial moraine of the heavily debris-covered tongue of Bara Shigri, by visual inspection of SPOT satellite imagery and the analysis of photographs taken of the glacier tongue. However, the debris thickness values computed here remain below 30 cm in most cells and the model thus seems to underestimate debris thickness. The modelled result reveals relatively thick debris on medial moraines, the eastern edge and the lower tongue. The thick debris on the eastern edge is probably deposited from the steep slopes in the east, with likely greater erosion activity than on the opposite slopes. Thin debris of a few centimetres in depth is observed at the edges of the medial moraines, at the confluence and on the western edge of the tongue.
Mean debris thickness from three ASTER and three Landsat 7 scenes.
Discussion
In this study we have applied an approach developed for debris thickness analysis in the European Alps and further developed it to be used in data-scarce environments such as the Indian Himalaya. As a consequence of working in such remote and data-scarce areas, a number of simplifying assumptions about energy fluxes and debris properties must be made, which leads to higher uncertainties in the final results. Below we evaluate some of the emerging limitations of the method, which may partly explain the underestimation of debris thickness found in this study. The discussion is divided into subsections where we assess separately the uncertainties associated with the different elements of F12.
Surface temperature
The aim of the energy-balance method is to account for all effects determining surface temperature so as to consider exclusively the effect of debris thickness. Figure 7 shows that mean surface temperature is clearly correlated with modelled incoming shortwave radiation and air temperature from reanalysis data. This finding is in line with previous work in the Alps where T s was shown to correlate well with global radiation on debris-covered areas (Reference Mihalcea, Mayer, Diolaiuti, Lambrecht, Smiraglia and TartariMihalcea and others, 2006). For instance the effect of air temperatures and incoming shortwave radiation on surface temperature should be considered and subtracted by the energy-balance approach. It is controlled by the denominator of Eqn (8) via S in, L in and H. For situations with low air temperature and low solar radiation, the denominator is lower, thus resulting in higher debris thickness for a pixel of a certain surface temperature T s than for a situation with high temperatures and high radiation. The high correlation between T s and shortwave radiation, as well as T s and air temperature, thus supports the use of an energy-balance approach to estimate debris thickness based on remote sensing.
The spaceborne surface temperature is provided, with a spatial resolution of 90 and 30 m for ASTER and Landsat 7 imagery, respectively, and every pixel represents a mean temperature over an assumable inhomogeneous surface. The surface temperature at a certain point depends on various factors that are neglected in the model (e.g. shading, aspect, elevation, humidity of debris material, snow cover on debris, cooling during the night and influence of supraglacial ponds and ice cliffs). Where debris is patchy or characterized by a mix of fine material and large boulders, pixels will yield a mean temperature, which may not be representative of adequate heterogeneous surface conditions. However, for large glaciers with continuous debris cover such as Bara Shigri, spaceborne satellite data may well represent surface conditions.
Where the surface temperature of debris is below 0°C, the F12 approach cannot be applied properly, as pixels with negative surface temperatures will be classified as debris-free. The presence of snow or morning shadows as well as the strong cooling during the night may lead to relatively low surface temperatures at the time of overflight and therefore to an underestimation of debris thickness. It is therefore important to consider only satellite images with clearly positive surface temperatures across the debris-covered area.
Parameterizations of radiative fluxes
The computation of downwelling longwave radiation is based on an input value for air temperature. The parameterization of incoming longwave radiation as defined by Reference BrutsaertBrutsaert (1975) performs well and shows higher correlation than the values derived from the approach of Reference BruntBrunt (1932) or the ERA-Interim data. The underestimation of longwave radiation by these two parameterizations for situations with relatively high downwelling longwave radiation is probably due to variations in cloudiness. In the Bara Shigri region and elsewhere in the Indian Himalaya, convective clouds typically form around noon, thereby leading to increased downwelling longwave radiation. Without measurements of cloud cover, it is not possible to model the increase in radiation due to cloudiness. Nevertheless, at the time of satellite image acquisition and the scenes selected, the sky is cloud-free and we can expect longwave and shortwave radiation to be modelled reasonably. The uncertainty in outgoing longwave radiation was higher than for downwelling longwave radiation, which stems from the error in surface temperature as derived from satellite imagery and estimated to be in the order of 1–1.5 K.
The uncertainty introduced through the parameterizations of incoming shortwave radiation is larger than for downwelling longwave radiation. Outgoing shortwave radiation is a function of surface albedo, which adds additional uncertainty to this heat flux. We conclude that for a large glacier like Bara Shigri the spatial variable value for albedo adds uncertainty to the model result and should be assessed in more detail using for example multispectral Landsat Thematic Mapper (TM) satellite data or geological maps.
Turbulent sensible heat flux
Reference Brock, Mihalcea, Kirkbride, Diolauiuti, Cutler and SmiragliaBrock and others (2010) showed that turbulent sensible heat flux is a very large and crucial component of the surface energy balance of a debris-covered glacier and should not be neglected. We suggest that sensible heat flux may be the most uncertain component of the energy balance and constitutes an important source of model error. Uncertainty is mainly due to the uncertainties in surface temperature for surfaces close to 0°C and uncertainties in estimated 2 m air temperature, followed by surface roughness and wind speed. Whereas Reference Foster, Brock, Cutler and DiotriFoster and others (2012) found that model results are sensitive to surface roughness, we found that the uncertainty introduced as a result of unknown surface roughness is relatively small.
For the estimation of turbulent sensible fluxes, a spatial extrapolation of air temperature is needed. Reference Foster, Brock, Cutler and DiotriFoster and others (2012) showed that the relationship between surface temperature and 2 m air temperature is well correlated. This correlation was confirmed by measurements on Haut Glacier d’Arolla and Lirung Glacier. The value of b in Eqn (6) is similar for all glaciers, whereas the value of a is much lower for Haut Glacier d’Arolla. Miage and Lirung glaciers are both extensively debris-covered, whereas Haut Glacier d’Arolla is only partially debris-covered. Based on the results of this study, we assume that the relation of air temperature to surface temperature may depend on the degree of debris cover of the glacier surface. Where a glacier surface is only partially debris-covered, air temperature is less governed by heating of the debris surface, which would be expressed by a lower parameter a in Eqn (6), as measured for Haut Glacier d’Arolla. On this glacier, air temperature might by influenced strongly by katabatic winds associated with low ice surface temperatures, which may explain the relatively low value for a. Since data only exist for one Himalayan glacier, clearly more measurements are needed to determine this relationship at other debris-covered glaciers and to understand how this relation is influenced by for example wind speed and direction, as well as the degree of debris cover.
Moreover, wind speed is an important input value for turbulent sensible heat flux. Reanalysis data are not correlated with local wind speed estimations, calling for improved near-surface wind speed estimations as input values to the model. Reference ZouZou and others (2008) observed that the wind over the debris-covered tongue of Rongbuk Glacier is dominated by thermally developed winds (i.e. valley and mountain winds) or katabatic winds. Local wind systems over glaciers in this region may be poorly influenced by synoptic winds as a result of topographic shielding effects. We therefore suggest that wind speed over Bara Shigri is dominated by local valley mountain winds in the morning on clear-sky days, rather than by synoptic-scale meteorology. As a consequence, the quality of input data for wind speed could be improved considerably by taking statistically derived wind speed instead of reanalysis data, and by selecting clear-sky situations in the morning from September to November. As we did not have in situ wind data from at least one nearby station, the application of the F12 approach can be seen as limited in this particular respect.
Vertical profile of temperature and rate of change in heat stored
Temperature gradients are assumed to be linear in the uppermost debris layers, with a gradient defined by the 0°C depth of 50% of the total debris thickness, which can be confirmed by data found in the literature and the results of Reference Rounce and McKinneyRounce and McKinney (2014). Also the assumption that the fraction F is dependent on d is supported by in situ data from other glaciers. Without these new assumptions, the estimated debris thickness would result in much lower values and consequently be strongly underestimated. However, the unknown local vertical gradient as well as the rate of change in heat stored (ΔD) lead to considerable uncertainties in model results, which cannot be improved unless field data of vertical temperature gradients become available for heavily debris-covered glaciers such as Bara Shigri.
Thermal conductivity
Conductivity depends on several factors such as debris composition, lithology, water saturation and density. Both the increase of water saturation or density of the material will result in increased thermal conductivity. As these characteristics are spatially heterogeneous across the glacier, conductivity may be highly variable in space, and a single value does not represent well the conditions of supraglacial debris. As the model does not account for the spatial variability of thermal conductivity K, we assessed the uncertainty of the model result introduced by the assumption of a spatially constant K. We found that uncertainty is important but is smaller than uncertainties caused by the unknown temperature profile of the debris. Again, field measurements are needed to assess the spatial distribution of thermal conductivity on a Himalayan glacier.
Conclusions
In this paper we further developed and applied the F12 approach of Reference Foster, Brock, Cutler and DiotriFoster and others (2012) to a heavily debris-covered glacier in the Himalaya using satellite thermal band imagery and reanalysis data. Without the further developed elements, the method would strongly underestimate the thickness of the supraglacial sediment.
The spatial pattern of surface temperature was found to be consistent among different satellite images, which is an important requirement for debris thickness estimation based on remote sensing. Mean surface temperature correlates well with estimated incoming shortwave radiation and air temperature at the time of image acquisition, thus supporting the assumption of estimating debris thickness based on a surface energy balance. We suggest that an energy-balance approach (considering shortwave, longwave and sensible heat fluxes) is a valuable tool with which to remove the effects of, for example, radiative fluxes or air temperature on surface temperature, in order to derive debris thickness as a function of surface temperature.
Incoming shortwave and downwelling and outgoing longwave radiation fluxes were estimated with reasonable accuracy in this study by taking parameterizations and input values from reanalysis data, whereas turbulent sensible heat flux is associated with more uncertainty. The distribution, evolution and driving forces of local wind systems over debris-covered glaciers are mostly dominated by thermally developed winds, the ‘mountain valley wind’ and ‘glacier wind’ (Reference ZouZou and others, 2008) for fair weather situations. This is why wind estimations from reanalysis data for the free atmosphere are not correlated with local wind speed measured by meteorological stations in the Himalaya. We therefore present a novel approach to estimating wind speed based on the analysis of meteorological data from a nearby station.
The energy-balance approach probably underestimates debris thickness, which is in line with results from other studies. We suggest that this underestimation is mainly due to the unknown vertical temperature profile and the rate of heat stored, and the uncertain turbulent sensible heat flux. Within the upper debris layers, both the vertical gradient of debris temperature and the rate of change of heat stored in the debris are likely much higher than assumed, thus leading to an underestimation of debris. Only detailed debris temperature measurements at different depths would help to improve knowledge of the thermal processes within the supraglacial debris. As mentioned by Reference Rounce and McKinneyRounce and McKinney (2014), mixed-pixel effects may also lead to an underestimation of debris thickness; however, they would probably not explain the overall underestimation across the tongue.
Thermal conductivity and surface albedo are also associated with large uncertainties, since values from measurements on other glaciers span wide ranges and a spatially constant value is assumed for a likely very heterogeneous surface. Uncertainties increase strongly with higher surface temperatures, hampering the estimation of debris thickness or total debris volume with reasonable accuracy. Thin debris is related to much lower uncertainties than thick debris, which is a promising result from a hydrological perspective. For hydrological modelling, it is important to map thin debris of 1–2 cm, where ablation is enhanced, and critical debris thickness (up to 5 cm), beyond which ablation decreases. This could be observed for the upper tongue on the edges of the medial moraines where the main glacier tributaries confluence. On the lower tongue, debris may be thick enough to insulate the glacier, causing the ablation rate to decrease in comparison with a bare-ice surface. However, other factors like thermokarst, absorbed heat of supraglacial ponds or ice cliffs could lead to very high downwasting rates despite insulation by debris cover (e.g. Reference Bolch, Buchroithner, Pieczonka and KunertBolch and others, 2008; Reference Kääb, Berthier, Nuth, Gardelle and ArnaudKääb and others, 2012).
We suggest that selected field measurements on a glacier at representative sites with different debris thickness and at a nearby meteorological station would greatly improve the model results. Nevertheless, although selected field measurements are needed, remotely sensed data still represent an important source of information for mapping variability in debris thickness of large and heavily debris-covered glaciers. The high spatial resolution of the consistent surface temperature estimations from thermal band images cannot be achieved by measurements in the field. In particular for large debris-covered glaciers such as Bara Shigri, where extensive debris measurements are almost impossible to realize, the improved F12 approach presented here could provide important information.
Future studies will need to assess in more detail the factors governing surface temperature, such as net short-wave radiation (via albedo, aspect, shading), supraglacial ponds and ice cliffs, and also the meteorological variables, such as air temperature or wind. Only a method capable of estimating and subtracting all the factors controlling surface temperature may reliably relate debris thickness to surface temperature. If all the effects except for debris thickness can be eliminated, the remaining pattern of surface temperature is thus governed by debris thickness and might be a good indicator for the depth of the supraglacial sediment.
Acknowledgements
This study was funded by the Swiss Agency for Development and Cooperation (SDC) under the Indian Himalayas Climate Adaptation Programme (http://ihcap.in). We are grateful to the Ev-K2-CNR committee and the SHARE project for providing open meteorological data from the Pyramid Observatory Laboratory, Khumbu valley, Nepal. We acknowledge the use of station data provided by IMD. NCEP/NCAR reanalysis data were obtained from US National Oceanic and Atmospheric Administration/Office of Oceanic and Atmospheric Research/Earth and Space Research Laboratory/Physical Sciences Division (NOAA/OAR/ESRL/PSD), Boulder, CO, USA. ERA-Interim data were provided by European Centre for Medium-Range Weather Forecasts (ECMWF), and GLIMS data from the US National Snow and Ice Data Center (NSIDC). F. Paul and two anonymous reviewers provided helpful comments that greatly improved the manuscript.



