

Smoking remains a serious public health problem. Briefly, tobacco is the second major cause of death in the world, killing seven million people each year (World Health Organization, 2018). In the United States, cigarettes are estimated to be responsible for a third of all cancer deaths (>85% of lung cancer deaths) and a third of deaths from cardiovascular disease (U.S. Department of Health and Human Services, 2010). In Australia, tobacco smoking increases the risk of cardiovascular disease incidence by between two- and four-fold (Scollo & Winstanley, Reference Scollo and Winstanley2015). Smoking harms nearly every organ in the body, causing many diseases and reducing health in general (U.S. Department of Health and Human Services, 2010). The economic costs of tobacco use are equally devastating.
Considerable evidence exists that genetic and environmental factors play a significant role in the liability to smoking initiation (SI) (see Maes & Neale, Reference Maes, Neale, Swan, Baker, Chassin, Conti, Lerman and Perkins2009, for a review). Other reviews of this literature have been published by Sullivan and Kendler (Reference Sullivan and Kendler1997), Heath et al. (Reference Heath, Madden and Martin1998), Li (Reference Li2003), and Kaprio (Reference Kaprio2009). The evidence primarily stems from twin and adoption studies. In summary, of the more than 15 published adult twin studies of lifetime or current use of tobacco products (which we will term SI), originating from seven different countries, estimates of the heritability (h 2) of SI were generally high, with most values falling between 40% and 70% (Mdn = 57%). The unweighted mean (±SD) estimate of h 2 for the 26 adult samples (males and females considered separately) was 0.56 ±.14. Estimates of the proportion of variance in liability due to shared environmental effects (c 2) were more variable, with most ranging from 0% to 50%, and the unweighted mean (±SD) estimate was 0.22 ±.18. The unweighted mean estimate for individual-specific environmental effects (e 2) was 0.22 (±.13). These conclusions are also supported by studies of twins reared apart and adoption studies of smoking (Eaves & Eysenck, Reference Eaves and Eysenck1980, Kendler et al., Reference Kendler, Karkowski and Pedersen2000). Two studies compared heritability estimates across a range of ages/birth cohorts, gender, and cultures (Australia, Sweden and Finland: Madden et al., Reference Madden, Pedersen, Kaprio, Koskenvuo and Martin2004; United States and Australia: Heath et al., Reference Heath, Cates, Martin, Meyer, Hewitt, Neale and Eaves1993). While the early study found some significant differences in heritability across cultures, the second reported remarkable consistency of estimates. To our knowledge, no other study including twins and other relatives has undertaken a cross-cultural comparison of average smoking habits and the role of genes and environment in individual differences.
Although a number of studies have reported associations between the SI of parents and that of their children, these studies typically are not informative about the relative contributions of genes and environment. One study used a twin-parent model for smoking to estimate the degree of assortment and the role of genetic versus cultural transmission (Boomsma et al., Reference Boomsma, Koopmans, Van Doornen and Orlebeke1994). They found that the correlation between spouses for ‘ever smoked’ was rather low (0.18) and that the parent–offspring resemblance could be accounted for completely by their genetic relatedness. Another study included correlations for twins and their parents (including a spousal correlation of 0.42) but did not model them explicitly (Kaprio et al., Reference Kaprio, Boomsma, Heikkilä, Koskenvuo, Romanov, Rose, Winter, Woodford, Davignon and Sniderman1995). An earlier report on analyses of the Virginia 30,000 sample used the extended twin (ET) kinship model (Maes et al., Reference Maes, Neale, Kendler, Martin, Heath and Eaves2006) to analyze data collected on twins, their spouses, and first-degree relatives. This ET design allows the simultaneous testing of additive and non-additive genetic, shared and individual-specific environmental factors, as well as sex differences in the expression of genes and environment in the presence of assortative mating and combined genetic and cultural transmission.
In this paper, we will attempt to replicate these results using an ET design in a comparably large sample from Australia, and compare the role of genetic and environmental factors for SI with those in the Virginia sample. First, we estimated the correlations between relatives and consider their overall pattern across the different types of relative. Second, we fit a model to the data for the purpose of formal hypothesis testing. These analyses are undertaken for both the U.S. and Australian sample separately, as well as for the combined sample, to test the equality of the estimates across samples.
Materials and Methods
The data used in this study come from two large epidemiological samples: the United States sample comprises 25,861 respondents and the Australian sample comprises 24,457 respondents who completed a self-report mailed questionnaire and answered questions about smoking behavior. Both samples are based on twins, and include their spouses and their first-degree relatives (i.e., parents, siblings, and offspring). Within the ET family structure in this study there are 88 unique sex-specific biological and social relationships. Zygosity of twins was determined on the basis of responses to standard questions about similarity and the degree to which others confused them in both samples. This method has been shown to give at least 95% agreement with diagnosis based on extensive blood typing (Eaves et al., Reference Eaves, Eysenck and Martin1989; Martin & Martin, Reference Martin and Martin1975; Ooki et al., Reference Ooki, Yamada, Asaka and Hayakawa1990).
The ‘Virginia 30,000’
The Virginia sample contains data from 14,763 twins, ascertained from two sources (Eaves et al., Reference Eaves, Heath, Martin, Neale, Meyer, Silberg, Walters and Cloninger1999; Truett et al., Reference Truett, Eaves, Walters, Heath, Hewitt, Meyer and Kendler1994). Public birth records and other public records in the Commonwealth of Virginia were used to obtain current address information for twins born in Virginia between 1915 and 1971, with questionnaires mailed to twins who had returned at least one questionnaire in previous surveys. A second group of twins was identified through their response to a letter published in the newsletter of the American Association of Retired Persons (AARP, 9,476 individuals). Twins participating in the study were mailed a 16-page ‘Health and Lifestyles’ questionnaire and asked to supply the names and addresses of their spouses, siblings, parents, and children for the follow-up study of relatives of twins. Completed questionnaires were obtained from 69.8% of twins invited to participate in the study, which was carried out between 1986 and 1989. The original twin questionnaire was modified slightly to provide two additional forms, one appropriate for the parents of twins and another for the spouses, children, and siblings of twins. Modifications affected only those aspects of the questionnaire related to twinning. The response rate from relatives (44.7%) was much lower than that from the twins. Of the complete sample of 28,492 individuals (from 8,567 extended kinships), 58% were female, with 50% of respondents under 50 years of age.
The ‘Australian 25,000’
The Australian sample was ascertained through two cohorts of twins. The first cohort was recruited in 1980–82 from a sampling frame that comprised 5,967 twin pairs aged 18 years or older (born 1893–1964) then enrolled in the Australian Twin Registry (ATR). Responses were obtained from 3,808 complete pairs (64%; Jardine et al., Reference Jardine, Martin and Henderson1984) and these were followed up with a second mailed questionnaire in 1988–90 with responses from 2,708 complete pairs (Heath et al., Reference Heath and Martin1994) and 337 incomplete pairs (81% of those still contactable). In this follow-up questionnaire, twins were asked to provide the names of parents, siblings, spouses, and children who would be prepared to answer similar mailed questionnaires. The second cohort of twins, born 1964–71, were recruited from the ATR in 1989 and were mailed similar questionnaires in 1989–91, with responses from 3,769 individuals from 4,269 eligible pairs. This cohort was also asked to provide names of relatives who were prepared to fill in questionnaires. In total, names of 14,421 relatives were provided for Cohort 1, and 4,999 names for Cohort 2. A suitably modified version of the questionnaire was prepared for parents, and another version for siblings, spouses, and children of twins. These were mailed out during the period 1989–91 and, respectively, 8,601 (60%) and 2,799 (56%) of relatives from Cohorts 1 and 2 returned questionnaires (response rates varied with type of relative, from 65% for mothers to 56% for siblings). There was vigorous follow-up of non-responding twins (up to five phone calls) but somewhat less assiduous follow-up of relatives (up to two phone calls).
Table 1 breaks down the sample sizes for SI by type of relative and sex, as well as by zygosity for the twins only. There are some differences in the breakdown between the two samples. The United States sample has proportionally fewer parents and siblings and more spouses and offspring than the Australian sample, probably reflecting the older age of the U.S. sample.
Age-Adjusted Prevalence Rates for Smoking Initiation and Sample Sizes by Sex and Type of Relative

Measures
Participants in both studies completed a questionnaire covering a range of health and lifestyle issues and including almost identical questions about their smoking behavior. Self-report data on smoking were obtained from three items. Respondents were asked to indicate the number corresponding to the frequency that best described their smoking habits during their lifetime. The four possible response values were: never smoked, used to smoke but gave it up, smoked on and off, smoked most of your life. Smoking quantity was measured as the number that expressed their best estimate of the DAILY cigarette consumption (or equivalent in pipefuls or cigars) during their lifetime, with six response categories: never, 1–5 per day, 5–10 per day, 11–20 per day, 21–40 per day, and >40 per day. Age of onset was recorded as the age at which they started smoking. Based on these three variables, we created a dichotomous variable, ‘smoking initiation’, reflecting whether they had ever smoked or not. If they responded ‘never smoked’ to the smoking frequency question and ‘never’ to the smoking quantity question and did not report an age of onset for smoking, they were coded zero on the dichotomous smoking variable. If on the other hand, they reported any of the other three response categories for smoking frequency OR any of the other five categories for smoking quantity OR an age of onset, they were coded 1. Responses were consistent across the three variables for >85% of the sample. About 10% of the sample was coded a smoker based on two out of three variables. In less than 1% of the sample was someone coded a smoker on the basis of only one of these three variables. Another ~1% were assigned missing values for the dichotomous smoking variable.
Statistical Methods
Structural modeling of the data was undertaken using methods described in Eaves et al. (Reference Eaves, Heath, Martin, Neale, Meyer, Silberg, Walters and Cloninger1999), Truett et al. (Reference Truett, Eaves, Walters, Heath, Hewitt, Meyer and Kendler1994) and Lake et al. (Reference Lake, Eaves, Maes, Heath and Martin2000), which assess the contributions of genetic and environmental effects in the presence of assortative mating. The ET model, which is an extension of the ACE model (Neale & Cardon, Reference Neale and Cardon1992) is described in more detail in Maes et al. (Reference Maes, Neale, Kendler, Martin, Heath and Eaves2006). Briefly, genetic effects can be either (1) additive or (2) dominant. Besides unique environmental factors, three sources of shared environmental influences can be distinguished: (1) shared (sibling) environment, (2) twin environment, and (3) cultural transmission. The latter is modeled as vertical cultural transmission from parent to child, and reflects the non-genetic impact of the parent's phenotype on the environment of their children. The correlation between spouses is assumed to result from phenotypic assortment, which occurs when mate selection is based at least partly on the trait being studied. The contribution of the genetic and environmental factors may be dependent upon sex, both in their magnitude and nature. Figure 1 presents a path diagram of the ET model. Note that only two generations are shown, as all the model parameters can be depicted with drawing just an opposite-sex pair of twins and their parents. The model was implemented in the statistical modeling package Mx (Neale et al., Reference Neale, Boker, Xie and Maes2006) and OpenMx (Boker et al., Reference Boker, Neale, Maes, Wilde, Spiegel, Brick and Fox2010; Neale et al., Reference Neale, Hunter, Pritikin, Zahery, Brick, Kirkpatrick and Boker2017) and fit to the raw ordinal data to obtain maximum likelihood estimates of the model parameters, allowing the inclusion of covariates such as age to the model. We included age regression on the thresholds by sex based on results from prior analyses of the U.S. sample (Maes et al., Reference Maes, Neale, Kendler, Martin, Heath and Eaves2006). As a result of the additional complexity of the model, we opted to include a maximum of two siblings and children of twins, leading to a minor reduction of the total sample size by about 1%. A detailed description of the Mx specification of the ET model is given in Maes et al. (Reference Maes, Neale, Martin, Heath and Eaves1999).
Full extended family resemblance model for opposite-sex DZ twins and their parents. Path coefficients are the same in both generations, and gene-gene and gene-environment correlations occur in both generations (dominance, shared environment, and twin environment not shown for the parental generation). Note: af = gender-common additive genes—females, am = gender-common additive genes––males, b = male-specific additive genes—males, r = induced correlation between gender-common and male-specific additive genetic effects, df = non-additive genes—females, dm = non-additive genetic parameter—males, rd = correlation between male and female non-additive genetic effects, cf = common environment—females, cm = common environment parameter—males, rc = correlation between male and female common environment, tf = special twin environment—females, tm = special twin environment parameter—males, rt = correlation between male and female special twin environmental effects, n = maternal cultural transmission—females, m = maternal cultural transmission—males, o = paternal cultural transmission—females, p = paternal cultural transmission—males, ef = specific environment parameter—females, em = specific environment parameter—males, i = assortative mating parameter, sf = correlation between gender-common additive genetic effects and environment—females, sm = correlation between gender-common additive genetic effects and environment—males, vf = correlation between male-specific additive genetic effects and environment—females, vm = correlation between male-specific additive genetic effects and environment—males.

Prior to the fitting the ET model to the data of the two samples, the thresholds for each of the relatives and the correlations for the 88 sex-specific relationships were estimated in OpenMx by maximum likelihood. Using this approach, we obtain unbiased estimates of the parameters if missing observations are missing at random (Little & Rubin, Reference Little and Rubin1987). We evaluated whether the thresholds could be equated across twin order, generation, and gender. Furthermore, we tested gender heterogeneity of the correlations within each category of social and biological relatedness, both separately and combined. OpenMx scripts are available upon request.
Results
Response Frequencies
Prevalence rates for SI are presented in Table 1, by sex, country, and type of relative. We systematically tested the equality of thresholds across twin order, zygosity, generation, sex, and country, while allowing age as a covariate. Prevalence rates for the two members of twin pairs, for the spouses of the two twins, and the children of twins could be equated within each sample, as could rates for first-degree relatives (e.g., fathers and brothers) across zygosity. However, rates could not be equated for twins and spouses across zygosity, or for relatives within generations (twins, spouses, and siblings) or across generations (parents, twins, and children of twins) without significant loss of fit (results not shown). Furthermore, prevalence rates were significantly different between the two samples, but not consistently in one direction. This might be due to the relatively large sample sizes to test for threshold (mean) differences. However, the marked difference between SI of men and women was consistent with higher prevalence rates in men for all types of relative except the children of twins. Finally, a decrease in prevalence of SI over three generations (fathers vs. twins/husbands/brothers vs. sons) was apparent for males, but not females, consistent with reported epidemiological trends for SI in males and females.
Maximum Likelihood Estimation of Thresholds and Correlations
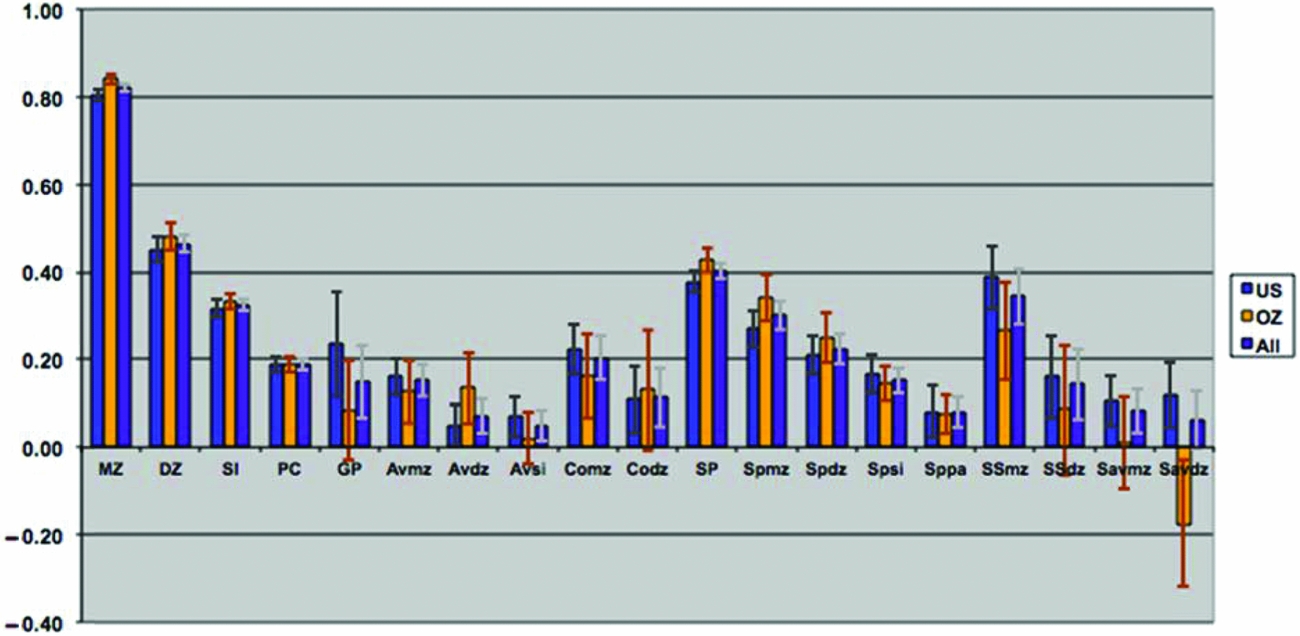
Tetrachoric correlations for all the 88 sex-specific relationships were estimated by maximum likelihood, properly accounting for the dependency of the observations of relatives. Figure 2 shows the maximum likelihood estimates of the tetrachoric correlations separately for each sample, as well as a combined estimate by equating the correlations within category of biological/social relationship across sample. Confidence intervals were obtained by calculating the standard errors of the z-transformed values. The respective 88 correlations could be constrained across the two samples (-2LL for United States = 30,022.48; for Australia = 26,997.31; and United States = Australia = 57,090.71) without loss of fit (χ288 = 70.92, p = .91) when allowing the thresholds to differ by sample, which is remarkable given the power associated with the large sample sizes. In the combined analyses, 4 out of 18 gender heterogeneity tests were significant, including the parent–offspring pairs, siblings, and DZ twins (see Table 2). This appeared to be primarily driven by lower correlations between opposite-sex pairings than between same-sex pairings, which could be indicative of sex limitation. Note that these were the categories with the largest number of pairs of relatives.
Maximum likelihood correlations for smoking initiation in the VA30,000 and OZ25k, grouped by degree of genetic and environmental similarity, constrained to be equal across sex.
Comparision of FIML Correlations for Smoking Initiation in the U.S. and Australian Samples
Bold type indicates significant difference in correlations by sex.
The observed pattern of correlations for SI was consistent with additive genetic influences, with no evidence for dominance effects. The correlations further suggested small contributions of non-parental shared environmental factors and, possibly, special twin environment, due to the elevated DZ correlation compared to the sibling correlation. There was no evidence for cultural transmission; on the contrary, the pattern of correlations might be more consistent with negative cultural transmission because parent–offspring correlations were smaller (rather than greater) than might be expected from genetic factors alone. The spousal correlation for SI was highly significant, suggesting some form of assortment. The pattern of correlations through marriage observed for SI was consistent with both a genetic contribution to SI and assortative mating.
Maximum Likelihood Estimation of Genetic and Environmental Contributions
We fitted the full ET model first, separately to each of the samples (United States and Australia) and then to both samples simultaneously, constraining the genetic and environmental parameters across the samples while allowing the thresholds to differ between the samples. The minus twice the log-likelihood of the data was 30107.73 for the U.S. sample, 27072.37 for the Australian sample, and 57195.25 for the combined analyses, indicating a non-significant result for the cross-cultural comparison (χ229 = 15.15, p = .98).
The full ET model allows for both qualitative (different factors in males and females, also referred to as non-scalar sex limitation) and quantitative (different magnitude of effects in males and females, also referred to as scalar sex limitation) sex differences of all the sources of variance. Although separately none of the individual tests for qualitative sex differences in variance components were significant (additive genetic, dominance genetic, shared environment, twin environment, and cultural transmission between opposite sexes from father or mother) the combined test was just significant (χ26 = 13.4, p = .04). Similarly, none of the individual tests for quantitative sex differences was significant, nor was the combined test for all the genetic parameters or all the environmental parameters when allowing qualitative sex differences. However, some of these tests became significant after eliminating all qualitative sex differences, except cultural transmission sex differences). The overall test for sex differences in genetic and environmental parameters was highly significant (χ212 = 80.6, p = .00).
This set of results suggested that the model might be overparameterized with highly correlated parameters. Eliminating whole sets of parameters (i.e., male and female non-parental shared environmental parameters and male-female shared environmental correlation) resulted in very comparable results across samples (see Table 3). Non-parental shared environment, special twin environment, and assortment could not be dropped without significant loss of fit. On the other hand, cultural transmission, additive genetic factors, or dominance factors by themselves could be dropped. However, test for overall genetic effects (additive and dominance; χ26 = 85.6, p = .00) or overall shared environmental effects (non-parental shared environment, special twin environment, and cultural transmission; χ210 = 69.8, p = .00) were highly significant, as was the test for familial resemblance (χ216 = 1,654.9, p = .00). When dominance parameters were constrained to zero, and the male–female genetic (rd and rg) correlations were fixed to 1 (the latter by dropping the male-specific additive genetic parameters), results for the two samples were remarkably close. Furthermore, additive genetic factors and cultural transmission were then significant (see also Table 3).
Model Fitting Results for Fitting the Extended Twin (ET) Model and Sub-models to Smoking Initiation in the U.S. and Australian Samples
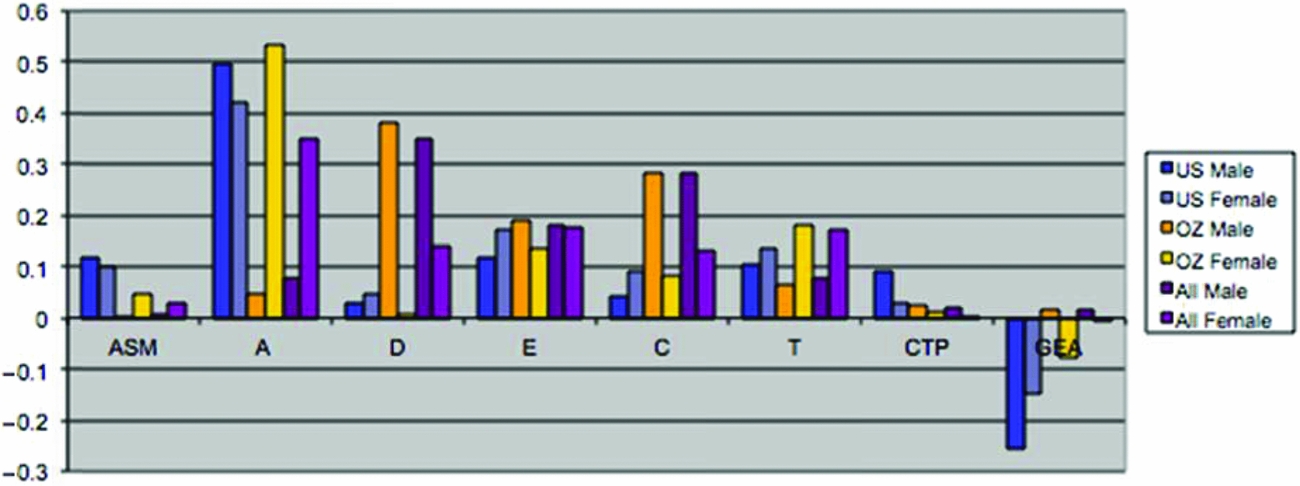
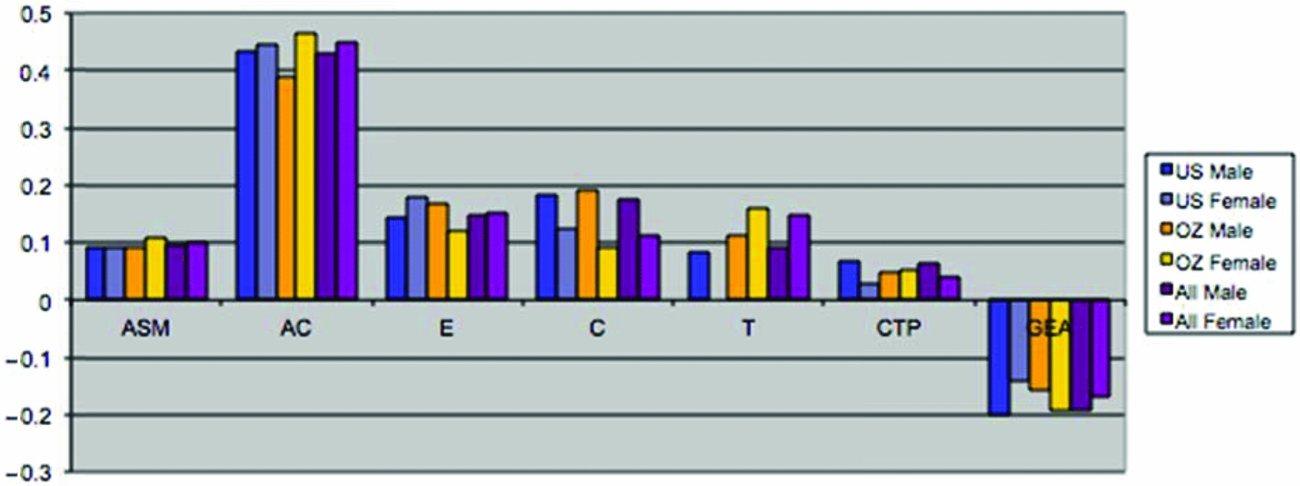
Maximum likelihood estimates of the genetic and environmental parameters under the ET model and the derived proportions of variance for the genetic and environmental effects on SI from the analysis of individual observations of both samples combined are shown in Table 4 & Figure 3. Additive genetic effects accounted for 53% of the variance in smoking in males and 55% in females. These proportions included the effects due to assortative mating (about 10%), consistent with the highly significant spousal correlation r = 0.40. The contribution of genetic dominance was negligible. The shared environmental effects on smoking arose from non-parental sources, special twin environment, and cultural transmission. In males, these sources explained 17%, 9%, and 6% of the variance, respectively. The corresponding proportions for females were 11%, 15%, and 4%. Genotype-environment covariance was estimated to be negative for males and females, which would result in negative contribution of this source of variance, if included in the calculation of variance components. Individual specific environmental factors made up the remainder of the variance (15% in males and females). The correlations between the non-parental and twin shared environments in males and females were estimated at 0.20 and 0.74, respectively, suggesting that partly different shared environmental factors account for similarity in SI in males and females. This is not surprising, since the opposite-sex twin and sibling correlations are considerably lower than their respective same-sex correlations. Given the large number of estimated parameters and the ordinal data input, estimating confidence intervals in OpenMx using the method of Neale and Miller (Reference Neale and Miller1997) would require an impractical amount of computer time. Therefore, we opted to fit a range of sub-models, which allows us to test the significance of individual parameters or a group of parameters simultaneously (see Table 3).
Parameter Estimates and Variance Components from the ET Model for Smoking Initiation
MF = male–-female; genotype–environment correlation a: between common additive genetic factors and environment; genotype-environment correlation b: between male-specific genetic factors and environment.
(a) Maximum likelihood estimates of parameters for the full extended family resemblance model for smoking initiation in the VA30,000 and OZ25k. (b) Maximum likelihood estimates of parameters for the extended family resemblance model for smoking initiation in the VA30,000 and OZ25k, not estimating dominance variance.
Discussion
To our knowledge, the combined U.S. and Australian samples comprising 50,318 adult individuals from 88 distinct biological and social relationships constitute the largest and most informative study of the inheritance of SI to date. Our results add considerable weight to previous findings that genetic factors contribute significantly to family resemblance in SI. The overall contribution of genetic factors to individual differences was similar for females and males (broad heritability 55%), consistent with previous large twin and family studies (Madden et al., Reference Madden, Pedersen, Kaprio, Koskenvuo and Martin2004). However, in contrast with these previous studies, we have explicitly modeled the effects of assortative mating and environmental transmission, as both the design and the power allow us to detect more complex patterns of causation, if they exist (Eaves et al., Reference Eaves, Last, Martin and Jinks1977, Reference Eaves, Eysenck and Martin1989; Fulker, Reference Fulker, Weir, Eisen, Goodman and Namkoong1988; Heath & Eaves, Reference Heath and Eaves1985; Heath et al., Reference Heath, Kendler, Eaves and Markell1985; Martin et al., Reference Martin, Eaves, Kearsey and Davies1978). As such, the analyses of the Australian sample constitutes a replication of the results of the U.S. sample alone (Maes et al., Reference Maes, Neale, Kendler, Martin, Heath and Eaves2006), which was formally tested by analyzing both samples simultaneously and testing the equality of the familial parameters. Most remarkably, the estimates of the 88 unique correlations in the Australian sample were very close to those in the U.S. sample, and consequently, the estimates of the genetic and environmental parameters were extremely close.
Results for the ET kinship analyses demonstrated not only that genetic factors play a significant role in the liability to SI, they also confirmed the role of assortative mating, shared sibling environment, twin environment (which could mask gene × age interaction), cultural transmission, and resulting genotype-environment covariance on individual differences in SI. The overall heritability in the combined data was estimated to be 55% in males and females. Note that this estimate of heritability is lower than in Maes et al. (Reference Maes, Neale, Kendler, Martin, Heath and Eaves2006) as it is calculated here as the proportion of variance, not including the (negative) genotype-environment (GE) covariance, such that all the variance components except for GE covariance add up to 1. This provides a better comparison with other twin studies that cannot distinguish GE covariance. The combined U.S.–Australian heritability estimate was very close to the unweighted mean (56% for males, 50% for females) calculated from published reports on adult Scandinavian, Australian, and U.S. samples (Prescott et al., Reference Prescott, Maes, Kendler, Kendler and Eaves2005). Note that the U.S. samples are mostly overlapping with the Virginia 30,000. The estimates of the specific environmental variance, including measurement error, were consistent across the current analyses (15%) and published reports (18%).
If substantial assortment exists for the phenotype of interest, the estimates of the genetic and environmental parameters from twin studies will be biased if assortment is not taken into account. The spousal correlation was estimated at 0.38 in the U.S. sample and 0.42 in the Australian sample, respectively, both of which are in line with published spousal correlations for SI, which range mostly from 0.18 to 0.43, based on U.S., Swedish, Dutch, and Finnish samples (Boomsma et al., Reference Boomsma, Koopmans, Van Doornen and Orlebeke1994; Kaprio et al., Reference Kaprio, Boomsma, Heikkilä, Koskenvuo, Romanov, Rose, Winter, Woodford, Davignon and Sniderman1995; Price & Vandenberg, Reference Price and Vandenberg1980). Thus, results from the Australian sample confirmed that about 10% of the total variance in SI was due to the genetic consequences of assortative mating.
Twin studies have consistently reported significant contributions of the shared environment to the liability to SI, the unweighted mean from published reports of adult samples being 24–28%. The U.S. and Australian samples both suggested that 30–35% of the variance can be accounted for by the combined effects of all sources of shared environment (sibling, twin, and cultural transmission), which is not far from previous estimates. The advantage of the extended kinship design is that it allows us to distinguish between the environmental effects shared with co-twins, siblings, and peers versus those shared with their parents. The results from the analysis of the Australian data confirmed significant contributions of non-parental shared environment (factors shared with siblings, and possibly additional factors shared with co-twins) and of cultural transmission observed in the U.S. sample, with similar proportions of variance accounted for by each source. The additional similarity in twins could be due to lingering effects of the intra-uterine environment or greater socialization with people of similar age. In both samples, the shared environmental variance component was greater in males, and the special twin environmental component slightly greater in females. Furthermore, it appeared that the shared environmental factors were different in males and females in both samples, indicated by the significantly lower opposite sex versus same sex correlations. This observation is in line with previously reported correlations between the shared environmental factors of males and females (r c) less than 1 for SI (Boomsma et al., Reference Boomsma, Koopmans, Van Doornen and Orlebeke1994; Heath et al., Reference Heath, Cates, Martin, Meyer, Hewitt, Neale and Eaves1993, Maes et al., Reference Maes, Prom-Wormley, Eaves, Rhee, Hewitt, Young, Corley, McGue, Iacono, Legrand, Samek, Murrelle, Silberg, Miles, Schieken, Beunen, Thomis, Rose, Dick, Boomsma, Bartels, Vink, Lichtenstein, White, Kaprio and Neale2017). However, it is also consistent with different sets of genes expressed in males and females, supported by the significant estimate of the male-specific genetic effects.
The finding of borderline significant contributions of parental shared environmental factors (or cultural transmission) was replicated in the Australian data, and they accounted for a similarly small proportion of the total variance (around 5%) as in the U.S. data. Furthermore, the paths from parents to children's environment were also estimated to be negative, suggesting that parents have inhibiting or promoting effects on their children's SI. These results are consistent with the only other available twin-parent data, which also showed negative, but non-significant, cultural transmission (Boomsma et al., Reference Boomsma, Koopmans, Van Doornen and Orlebeke1994). In fact, these results are also consistent with the vast epidemiological literature on parental smoking as a risk factor for adolescent smoking (Li et al., Reference Li, Pentz and Chou2002; Peterson et al., Reference Peterson, Leroux, Bricker, Kealey, Marek, Sarason and Andersen2005; Shakib et al., Reference Shakib, Mouttapa, Johnson, Ritt-Olson, Trinidad, Gallaher and Unger2003; Vitaro et al., Reference Vitaro, Wannera, Brendgena, Gosselinb and Gendreaua2004) and parental non-smoking or smoking cessation as a protective factor (Andersen et al., Reference Andersen, Leroux, Bricker, Rajan and Peterson2004; Bricker et al., Reference Bricker, Rajan, Andersen and Peterson2005; den Exter Blokland et al., Reference den Exter Blokland, Engels, Hale, Meeus and Willemsen2004), derived from the moderate phenotypic correlations between parents and children or adolescents. Based on the heritability estimates from twin studies, parent–offspring correlations would be expected to be larger than they are. A possible explanation is that the environmental transmission is negative, while the genetic transmission is positive. Thus, the availability of a genetically informative design, with different types of relatives, is more informative than a nuclear family design, which does not allow for the separation of the genetic effects of parents on their children from the environmental influences. Furthermore, the marginal significance of cultural transmission compared to the non-parental shared environmental sources of variance corresponds to the finding that adolescent smoking is more strongly associated with friends’ and siblings’ smoking than parents’ smoking (de Vries et al., Reference de Vries, Engels, Kremers, Wetzels and Mudde2003; Rose et al., Reference Rose, Viken, Dick, Bates, Pulkkinen and Kaprio2003; Simons-Morton et al., Reference Simons-Morton, Chen, Abroms and Haynie2004, Vink, Willemsen, & Boomsma, Reference Vink, Willemsen and Boomsma2003; Vink, Willemsen, Engels et al., Reference Vink, Willemsen, Engels and Boomsma2003). Thus, it appears that the environmental impact on SI is age dependent, such that the influence of the parents on their offspring SI is limited and the observed parent–child association is primarily accounted for by shared genes.
Other possible genetic explanations for the lower than expected parent–offspring than sibling correlations are genetic dominance or gene × age interaction. Unlike the classical twin study, the ET kinship design allows us to disentangle the combined effects of additive genetic, dominance, and shared environmental factors. The results from fitting the full model showed no evidence for dominance. In effect, the dominance variance was estimated very close to zero in both samples. The alternative explanation of gene × age interaction implies that the genetic variance changes as a function of age and/or that different genes account for variability at different ages (Eaves et al., Reference Eaves, Last, Young and Martin1978), sometimes called reduced genetic transmission. Although the study was cross-sectional, we previously examined the change in genetic variance with age in two ways in the Virginia sample and concluded that the impact of age on the genetic architecture of SI is limited (Maes et al., Reference Maes, Neale, Kendler, Martin, Heath and Eaves2006). Madden et al. (Reference Madden, Pedersen, Kaprio, Koskenvuo and Martin2004) also reported no change in additive genetic variance across three age groups between age 18 and 46, as well as three countries (Australia, Sweden, and Finland), in women and in men. The issue of gene × age interaction could be further explored by moderating the correlation between relatives of different ages by their age difference (Verhulst et al., Reference Verhulst, Eaves and Neale2014).
On the other hand, age significantly influenced the prevalence of SI in males in the U.S. sample, but the effect was not significant for females or for either sex in the Australian sample. Given the estimates of genetic and environmental parameters would be slightly biased if ignored, age regression on the prevalence was modeled. However, cohort and age effects may be confounded. Although prevalence of tobacco use has decreased in both males and females since the data were collected, the estimates of the contribution of genetic and environmental factors are consistent with estimates from more recently collected samples. Given the prevalence of smoking decreased more rapidly with age in the cohorts captured in the Virginia 30,000 and the Australian 25,000 sample than data collected since then, results are expected to be influenced only to a limited extent.
In summary, the data on a wide range of biological and social relationships from two large samples on different continents confirmed that genetic factors accounted for the majority of individual differences in liability to SI, with a small proportion resulting from the consequences of assortative mating. Shared environmental factors do play a significant role, but were primarily due to within-generational influences; for example, siblings and co-twins. The association between SI in parents and their children could be most likely accounted for by their genetic relatedness, with limited negative environmental influence. It is important to note that the estimates obtained here were not just based on twin data, but on a wide range of relatives with different degrees of genetic similarity and shared environments. Furthermore, our estimates were obtained from taking the effects of sex, assortment, genotype × environment covariance, and age regression of the prevalence into account.
Limitations
Given the complexity of the model and the large number of estimated parameters, caution is needed in the interpretation of the results. Even with two large samples, information may be limited to estimate some parameters, especially those that are highly correlated or only identified by one or a few relationships. Second, the sample was entirely Caucasian, and we do not know whether the pattern of results holds for other ethnic groups. Third, the sample of twins and relatives is a volunteer sample, thus, the possibility of response bias exists. Response bias is principally a concern if missingness is related to the response variable (Little & Rubin, Reference Little and Rubin1987) and with relatives we are in the fortunate situation that we have information about non-responding relatives through the relatives who did respond (Neale & Eaves, Reference Neale and Eaves1993). The fortunate consequence of maximum likelihood estimation with single relatives jointly with complete pairs is to correct the bias in mean and variance of the former toward their true population values (Little & Rubin, Reference Little and Rubin1987; Muthén et al., Reference Muthén, Kaplan and Hollis1987).
Acknowledgments
This research has been supported by Grants AG04954, GM30250, GM32732, AA06781, AA07728, AA07535, and MH40828 from NIH, Grants 941177 and 971232 from the NH&MRC, a gift from R.J.R. Nabisco and grants from the JM Templeton Foundation. The authors would also like to thank the twins and their families on both continents for their participation in this project. Hermine H. Maes is supported by Grants HL60688, MH45268, DA016977, MH068521, DA018673, DA025109, DA030005 and the Virginia Tobacco Youth Project.


