





Introduction
Electoral systems are arguably the most important institutional mechanism shaping politics in representative democracies. They transform voters’ voices into seats and, in so doing, determine who is represented, who holds power, and to whom that power is accountable. Electoral systems consist of a broad set of pieces, such as the electoral formula and the legal threshold. One particularly important piece of the system, affecting a variety of political outcomes, is district magnitude, the number of seats per district. District magnitude shapes the incentives and considerations of key actors who vote or compete and represent in the district: voters and candidates/representatives and, consequently, affects political outcomes. Political scientists have established a wide variety of outcomes affected by district magnitude, such as the policy formation process (Lijphart Reference Lijphart1999), disproportionality in representation (Gallagher Reference Gallagher1991), congruence between voters and representatives (Huber and Powell Reference Huber and Powell1994; Powell Reference Powell2000; Powell and Vanberg Reference Powell and Vanberg2000), and income redistribution (Iversen and Soskice Reference Iversen and Soskice2006). It is therefore well established that district magnitude is a particularly consequential characteristic of electoral systems.
In light of these established effects, it is particularly surprising that the conceptualization and measurement of district magnitude have been almost entirely overlooked. Most democracies divide their electorate into districts, often of different magnitudes. And while district magnitude is inherently a district-level feature, cross-national analyses require this information to be collapsed into a single, country-level score. This step of deriving a national measure of district magnitude is rarely the focus of theoretical or methodological scrutiny. Instead, it is often treated as a routine data-processing task or a preliminary step researchers must complete before engaging with the investigation itself. However, this seemingly mundane technical choice has far-reaching implications. In this article, we contend and demonstrate that the way district magnitude is conceptualized and measured at the country level can shape inferences about electoral politics. Overlooking this stage risks mischaracterizing electoral systems and drawing misguided conclusions about the political dynamics they structure. Specifically, drawing on two outcomes central to numerous studies in comparative politics – female parliamentary representation (Matland Reference Matland1993) and strategic voting (Cox Reference Cox1997; Duverger Reference Duverger1963) – we discuss how the conceptualization and measurement of district magnitude affects inference about its effect. Drawing on a third, party-system fragmentation (Clark and Golder Reference Clark and Golder2006; Neto and Cox Reference Neto and Cox1997), we empirically show its importance for our understanding of electoral processes. We show that the inferred relationship depends on the unit of analysis employed to measure and summarize district magnitude.
The mechanism by which district magnitude affects outcomes, we argue, should be reflected in the way in which it is conceptualized and measured. In this study, we lift the hood over the excruciatingly important and – we contend, mistakenly – non-glorious stage of conceptualizing and measuring district magnitude at the national level, the aggregation process generating a country-level score, which serves as the data for cross-country analysis. We ask two questions: (i) How should one summarize district magnitudes to a single national score? And (ii) what are the implications of different practices of generating that score for comparative cross-country analyses?
Our paper makes three contributions. First, we theorize about the units by which district magnitude should be measured at the national level. We propose two alternatives to the naïve aggregation: weighing districts by representatives or by voters. We explain why, for key questions in comparative politics, such as the number of female candidates mentioned above, some units are more relevant than others. We argue that the common practice of equally weighing all districts is misleading and provide analytic guidance on how district magnitude should be measured in different contexts.
Second, we empirically identify the conditions under which the measurement of district magnitude that draws on different units of analysis results in different scores at the national level. Specifically, variation in district magnitude (common in European democracies) and malapportionment (common in Latin America) lead to substantial discrepancies between characterizations of electoral systems based on different units. Third, we show how the conceptualization and measurement of district magnitude matter for our inferences about electoral politics. We demonstrate that countries that would be considered to possess similar political properties when their districts are characterized based on some units will differ based on others. Similarly, we show that countries whose districting scheme is often considered to reduce party-system fragmentation in parliament are considered to be substantially more susceptible to having a large number of parties when summarized by a different unit.
Before we delve into the analysis, an illustration of the aggregation problem might be in order. In countries where all districts have the same number of seats (e.g., the UK with single-member districts, Malta with five seats per district), coming up with an aggregate score is straightforward. Many countries, however, are characterized by a range of magnitudes: within the same country, different districts have different numbers of seats, with the gap between small and large sometimes reaching a gap of several to several dozen.Footnote 1 The common practice (see our review of the literature below) is to equally weigh all districts. We refer to this practice as a ‘naïve’ aggregation to the national level. Under this practice, if a hypothetical country has two districts, one of 49 seats and one of 51, its national score based on the average districtFootnote 2 is 50. Such is also the case for a country whose two districts are of 1 and 99 seats, respectively. But is fifty really the best way to characterize both of these countries? Is a country in which 99% of its representatives and the vast majority of its voters represent and cast their ballots respectively in a district of 99 seats well characterized by an aggregate score of 50? How such countries should be characterized in a cross-country comparative analysis is the problem of aggregation we address.
The paper continues as follows. The next section lays out the common practice in the literature, as well as two alternative units by which district magnitude can be measured. The following section identifies the circumstances under which the three measures converge and diverge. The next section empirically applies the three alternative measures to a cross-section of democracies, identifying factors that affect their divergence. In the following section, we reflect on the question of when the different units of analysis should be used. The next section provides two empirical examples of how the use of different units of analysis matters for characterization of electoral systems and for inference. The final section concludes.
Three alternative measures of district magnitude
One might wonder how a given districting structure can result in empirically different measurements. After all, a seat is a seat, and at any given time, there is only one partition to districts per country. Our answer is simple: there is one partition but two separate units that are assigned to districts – candidates/representatives and voters. Along with districts themselves, these are three different ways to conceptualize and measure the partition into districts, and they often differ from one another. A stylized illustration may shed light on this issue. Consider a parliament of 11 seats and three districts: D1 and D2 have a single seat each, and D3 has nine seats, a distribution of magnitudes that resembles in its shape that of many countries (e.g., Norway, Cyprus, and Poland) and is even modestly skewed compared to others (e.g., Brazil). Three national-level measures can describe the partition of this electoral system to districts. We next turn to presenting them.
Equally weighing all districts
The seemingly most obvious unit by which to summarize the partition into three districts, and indeed the most prevalently utilized one in the literature, is the districts themselves. This practice is akin to equally weighing all districts, small or large. We thus refer to it as the naïve practice in producing a national-level score of district magnitude per country. Drawing on this unit, one can utilize various statistics such as the mode, the median, or the average of the districts. In the analysis that follows, we utilize the mean. Our argument, however, is about the choice of unit of analysis drawn upon rather than the choice of summary statistic employed. As we will show, it holds regardless of the particular statistic employed. Formally: Let the number of seats in district $i\;\;\left( {i = 1, \ldots, n} \right)$
be denoted as s
i
such that overall there are
$i\;\;\left( {i = 1, \ldots, n} \right)$
be denoted as s
i
such that overall there are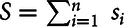 $S = \mathop \sum \nolimits_{i = 1}^n \;{s_i}$
seats in parliament. The average magnitude weighing all districts equally is then
$S = \mathop \sum \nolimits_{i = 1}^n \;{s_i}$
seats in parliament. The average magnitude weighing all districts equally is then $\overline {{M_E}} = \sum_{i = 1}^n \; {1 \over n}{s_i} = {1 \over n}\sum_{i = 1}^n \; {s_i}$
In this case, $i = \left( {1, \ldots, 3} \right)$
,
$i = \left( {1, \ldots, 3} \right)$
, $S = 11$
, and
$S = 11$
, and ${s_i} = \left( {1,1,9} \right)$
, and therefore:
${s_i} = \left( {1,1,9} \right)$
, and therefore: $\overline {{M_E}} = {1 \over 3}\left( {1 + 1 + 9} \right) = 3.67.$
Districts, however, are merely the vessel into which representatives and voters are assigned. The mechanisms by which districts are consequential to political outcomes are those affecting the key political actors in the districts: candidates or representatives and voters. District magnitude, we hold, affects the incentives the districts provide to voters casting their ballots in them and to candidates competing or representatives representing them. It is these actors that the incentives and limitations posed by the number of seats in a district are relevant for. We might want to measure district magnitude, therefore, as it pertains to these actors. The allocation of actors – elites or voters – to these vessels, rather than the vessels themselves, is what we focus on next.
Weighing districts by representatives
How candidates/representatives are allocated to districts is at the heart of the second measure. The underlying assumption here is that a representative’s incentive structure is affected by the magnitude of the districts in which they are elected. If this is the case, we might be interested in the number of candidates/representatives faced with particular incentives, rather than the number of districts that exhibit them.
In line with the statistic employed above, let $\overline {{M_R}} $
be the district magnitude of the average representative, such that:
$\overline {{M_R}} $
be the district magnitude of the average representative, such that: $\;\overline {{M_R}} = \sum_{i = 1}^n \; {{{s_i}} \over S}{s_i} = {1 \over S}\sum_{i = 1}^n \; {s_i}^2$
In the electoral system above, two of the eleven representatives are elected in districts of a single seat and nine in a district of nine seats, such that $\overline {{M_R}} = {{1 \times 1 + 1 \times 1 + 9 \times 9} \over {11}} = {{83} \over {11}} = 7.54$
Given the large number of representatives elected in a large district, it is not surprising that the magnitude of the district electing the average representative is substantially greater than that of the average district.
Weighing districts by voters
The second group of actors allocated to districts is voters. Voters decide whether to cast their ballot or to abstain, and if they do the former, they decide whom to support among those competing in their district. These decisions are affected, among other things, by incentives shaped by the number of seats in their district. Thus, an alternative prism for thinking about district magnitude is the allocation of voters to districts.
Let the number of eligible voters in district i be denoted by ${v_i}$
such that in the entire country, the number of eligible voters,
${v_i}$
such that in the entire country, the number of eligible voters,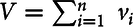 $V = \mathop \sum \nolimits_{i = 1}^n \;{v_i}$
. The district magnitude of the average voter
$V = \mathop \sum \nolimits_{i = 1}^n \;{v_i}$
. The district magnitude of the average voter $\overline {{M_V}} $
is then:
$\overline {{M_V}} $
is then: $\;\overline {{M_V}} = \sum_{i = 1}^n \; {{{v_i}} \over V}{s_i} = {1 \over V}\sum_{i = 1}^n \; {v_i}{s_i}.$
Suppose that in the country above $V = 11,000$
, and suppose further that it is malapportioned such that 700 eligible voters reside in D1 and D2 each, and 9600 in D3. In this case, the average voter casts her ballot in a district of 7.98 seats:
$V = 11,000$
, and suppose further that it is malapportioned such that 700 eligible voters reside in D1 and D2 each, and 9600 in D3. In this case, the average voter casts her ballot in a district of 7.98 seats: $\overline {{M_V}} = {{700 \times 1 + 700 \times 1 + 9600 \times 9} \over {11,000}} = 7.98$
Note that the score is slightly higher than that of representatives, consistent with the fact that the share of voters casting their ballots in a larger district is higher than the share of representatives in that district.
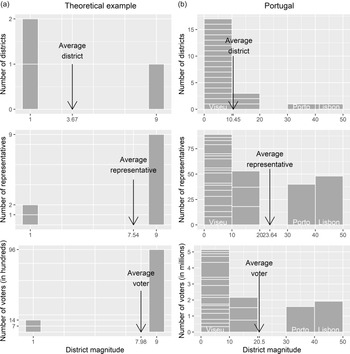
Figure 1a presents the three measures of this hypothetical electoral system. On the horizontal axis is district magnitude, and on the vertical one is the unit by which it is measured. The top panel presents the electoral system by its districts, hence giving each district an equal weight regardless of its magnitude. The second summarizes the electoral system by representatives, and the bottom panel summarizes the electoral system by voters. In this electoral system, two-thirds of the districts embody the majoritarian model of democracy, but only 0.18 of representatives are represented in them, and 0.13 of voters cast their ballots in them. This simple exercise demonstrates that each of the three units can result in a different score of district magnitude once aggregated up to the national level.Footnote 3
Three summaries of electoral systems.
Note: The figure presents the number of districts (top), representatives (middle), and voters (bottom) by their district magnitude. It does so for our hypothetical example and for Portugal 2022.

The three units yield different scores in many electoral systems beyond this hypothetical example. Figure 1b presents an empirical version of the hypothetical example above, focusing on Portugal’s 22-district, 230-seat parliament. The top panel draws on districts to present the system. The average district is of 10.5 seats. Note that given the equal weight of each district under this characterization, the districts of Porto and Lisbon combined consist of 0.09 (2/22) of the districts, just like any other two. The second panel draws on representatives as the relevant unit. The average representative is elected in a district of 23.6 seats – more than twice as large as the average district. By this count, Porto and Lisbon, with 40 and 48 representatives, respectively, consist of 0.38 (88/230) of the parliament. Lastly, the bottom panel draws on voters as the relevant unit. The average voter casts her ballot in a district of 20.5 seats. Note that unlike the hypothetical example, in Portugal, the average voter casts her ballot in a district smaller than that in which the average representative is elected.Footnote 4
How district magnitude is usually measured
While in this paper we take up the challenge of cross-country comparisons, it is worth noting that district magnitude is first and foremost a district-level property. As such, it is most appropriate for analyses of district- rather than national-level outcomes. A key example of such an outcome is the legislative and electoral fragmentation in the district. Identifying a causal relationship through a mechanism of seat allocation in the Argentine legislature, Lucardi (Reference Lucardi2019) finds that within Argentina, larger districts lead to lower disproportionality, greater vote share for small parties, and greater legislative fragmentation. Similarly, analyzing changes in the allocation of seats in a cross-section of about 3700 districts in 20 countries, Singer and Gershman (Reference Singer and Gershman2018) find that additional seats per district are associated with a greater number of parties running for election and greater electoral as well as legislative fragmentation. Analyses of voter-party congruence at the district level, too, show differences by magnitude. In particular, in a cross-country study of 12 countries, Best (Reference Best2023) finds that due to limited electoral options in small districts, congruence is higher in larger districts than in small ones, leading to a higher penalty of poor congruence for left-leaning voters who tend to be a minority in small, rural districts.
Although a district-level property, district magnitude is, nonetheless, often applied to the national level. One might wonder how it is measured in the vast cross-country electoral literature. Curiously, the literature offers little discussion on the unit of analysis that should be utilized.Footnote 5 Most commonly, it employs the naïve measure, equally weighing districts to summarize a country’s district magnitude, a practice we challenge below. Within this framework, studies offer different alternatives, varying both the functional form and the statistic employed. Some studies employ the average district (e.g., Rae Reference Rae1967), while others employ the average of the logged district (e.g., Ordeshook and Shvetsova Reference Ordeshook and Shvetsova1994; Mozaffar et al. Reference Mozaffar, Scarritt and Galaich2003; Clark and Golder Reference Clark and Golder2006; De Miguel Reference De Miguel2017;Footnote 6 Bunker and Negretto Reference Bunker and Negretto2023). Others opt for the median rather than the average district, and here, too, various functional forms are found: while some utilize the inverse of the median district (Carey and Hix Reference Carey and Hix2011), others calculate the logged median district (Stoll Reference Stoll2008). Yet, other studies employ measures based on districts and additional factors. One prominent example is the seat product (Shugart and Taagepera Reference Shugart and Taagepera2017), which makes use of both the average district and the assembly size.
A review of a decade of publications (2011–2021) in four leading journals in the discipline, both general and comparative (American Journal of Political Science, British Journal of Political Science, Comparative Political Studies, and Electoral Studies), finds that among 52 studies that summarize district magnitude at the national level, 42 do so drawing on districts as the unit by which the electoral system is characterized. Only five of the studies explicitly summarize the districting structure by drawing on representatives as the relevant unit.Footnote 7
An exception we are aware of is Cox (Reference Cox1997). In his book, Cox departs from the common practice and instead weighs districts by representatives. He illustrates the point by presenting a stylized example of an electoral system with two districts, one electing a single representative and the other electing a hundred, and explains that equally weighing the two districts, such that the average district magnitude is 50.5, might lead us astray (Reference Cox1997, 208–209; see also Neto and Cox Reference Neto and Cox1997). This important comment, however, is not further developed in the book.
Admittedly, each of the three measures we discuss requires different data to be gathered, with some somewhat more taxing than others. While for the calculation of the average district magnitude it suffices to know the number of districts and the total number of seats in the parliament, the calculation of the magnitude of the average representative requires data on the number of districts as well as the magnitude of each. Lastly, the calculation of the magnitude of the average voter requires the number of districts, their respective magnitudes, and the number of voters casting their ballot in each.
When the three measures converge. And when they don’t
What is the relationship between the three measures? Under what circumstances do they converge to the same score, and when do they differ? We demonstrate that two factors affect the degree to which the three characterizations empirically diverge: variation in district magnitude and malapportionment. In this section, we explain these links. In the following section, we demonstrate them empirically.
Variation in magnitude. When all districts are of the same number of seats, weighing districts equally is empirically equivalent to weighing them by the number of representatives in each. This is intuitive but can also be seen by examining Equations (1) and (2) above. Since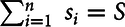 $\mathop \sum \nolimits_{i = 1}^n \;{s_i} = S$
, Equation (1) can be reduced to
$\mathop \sum \nolimits_{i = 1}^n \;{s_i} = S$
, Equation (1) can be reduced to $\overline {{M_D}} = {S \over n}.$
Since
$\overline {{M_D}} = {S \over n}.$
Since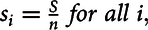 ${s_i} = {S \over n}\;for\;all\;i,\;$
Equation (2) can be rewritten as
${s_i} = {S \over n}\;for\;all\;i,\;$
Equation (2) can be rewritten as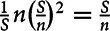 ${1 \over S}n{\left( {{S \over n}} \right)^2} = {S \over n}$
as well.
${1 \over S}n{\left( {{S \over n}} \right)^2} = {S \over n}$
as well.
Malapportionment. In the presence of malapportionment, the ratio of eligible voters to representatives assigned to a district varies across districts (Kamahara, Wada, and Kasuya Reference Kamahara, Wada and Kasuya2021; Lust-Okar Reference Lust-Okar2006; Samuels and Snyder Reference Samuels and Snyder2001). Where the country is perfectly apportioned such that voters residing in different districts are equally represented in parliament, weighing each district by its share of voters is empirically equivalent to weighing it by its share of representatives.
Consider Equations (2) and (3): If ${{{v_i}} \over V} = {{{s_i}} \over S}$
, the two measures equal one another. This can also be seen in the example above. If the country above is perfectly apportioned such that 1000 voters reside in D1 and D2 each, and 9000 reside in D3, the average voter casts her ballot in a district of 7.5 seats, just like the district in which the average representative is elected:
${{{v_i}} \over V} = {{{s_i}} \over S}$
, the two measures equal one another. This can also be seen in the example above. If the country above is perfectly apportioned such that 1000 voters reside in D1 and D2 each, and 9000 reside in D3, the average voter casts her ballot in a district of 7.5 seats, just like the district in which the average representative is elected: $\overline {{M_V}} = {{1000 \times 1 + 1000 \times 1 + 9000 \times 9} \over {11,000}} = 7.54$
In summary, under the particular circumstances of an equal number of seats per district, measuring magnitude by weighing districts equally is equivalent to weighing them by representatives. Similarly, under perfect apportionment, weighing districts by representatives is equivalent to weighing them by voters. In the next section, we examine the three measures and the relationships between them on a cross-section of cases.
Measuring district magnitude at the national level: an empirical illustration
How do countries score on the three measures, and how often do they score differently? We draw on district-level data assembled by CLEA (Kollman et al. Reference Kollman2024) from elections in all democracies employing different models of proportional representation with districts (Bormann and Golder Reference Bormann and Golder2022) that scored 8 or higher on Polity V in 2018 (Marshall, Jaggers, and Gurr Reference Marshall, Jaggers and Gurr2019) (we exclude PR with a single national district as well as linked, mixed-member proportional systems). We also include Iceland and Malta, which are not included in Polity V due to their small population size, and Turkey 2011, the most recent election in which its Polity score was 8 or greater. We exclude South Africa due to its unusually high share of upper-tier national seats.
For each country, we draw on the most recent data of district magnitude and number of eligible voters per district provided by CLEA (as long as it is no earlier than 2014).Footnote 8 This leaves four missing cases (Austria, Luxembourg, Indonesia, and Uruguay) for which we draw on official sources.Footnote 9 Altogether, we are left with 37 election/year cases (see online appendix table).Footnote 10
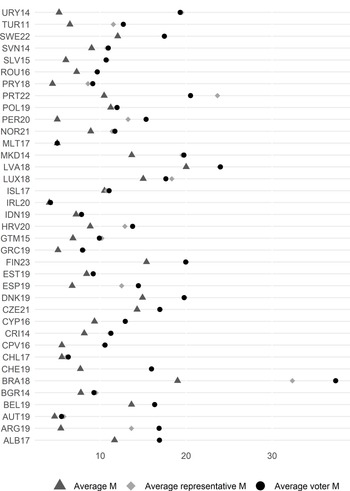
Figure 2 presents the 37 cases reported above. On the horizontal axis are the means of the three units for each country: the magnitudes of the average district ( $\overline {{M_E}} $
marked by triangles), the magnitude of the district electing the average representative (
$\overline {{M_E}} $
marked by triangles), the magnitude of the district electing the average representative ( $\overline {{M_R}} $
, diamonds), and that of the district in which the average voter casts her ballot (
$\overline {{M_R}} $
, diamonds), and that of the district in which the average voter casts her ballot ( $\overline {{M_V}}, \;$
circles). Most notably, the figure demonstrates that the scores of the three measures do not exhibit a uniform pattern. In fact, they vary substantially with no seemingly systematic pattern. In some countries the three are similar or even identical (e.g., Chile, Iceland), while in others they differ substantially (e.g., Argentina, Spain). Further analysis reveals that the three also differ in their center of gravity. Weighing all districts equally produces a mean magnitude of 9.2 across countries, while weighing by representatives and voters produces mean magnitudes of 13.5 and 13.8, respectively.
$\overline {{M_V}}, \;$
circles). Most notably, the figure demonstrates that the scores of the three measures do not exhibit a uniform pattern. In fact, they vary substantially with no seemingly systematic pattern. In some countries the three are similar or even identical (e.g., Chile, Iceland), while in others they differ substantially (e.g., Argentina, Spain). Further analysis reveals that the three also differ in their center of gravity. Weighing all districts equally produces a mean magnitude of 9.2 across countries, while weighing by representatives and voters produces mean magnitudes of 13.5 and 13.8, respectively.
Three measures of district magnitude.
Note: The figure presents the scores per each of the three measures.

Variation in district magnitude
In the last decade, political scientists have paid considerable attention to proportional representation with districts and, in particular, to within-country variation in district magnitude (e.g., Lago and Lobo Reference Lago and Lobo2014; Kedar, Harsgor, and Sheinerman Reference Kedar, Harsgor and Sheinerman2016; Kedar, Harsgor, and Tuttnauer Reference Kedar, Harsgor and Tuttnauer2021; Best Reference Best2023). When weighing each district by its number of representatives, the large districts pull the average up substantially more so than when weighing each district equally. Therefore, the greater the variation in magnitude, the larger the discrepancy between equally weighing districts ( ${M_E}$
) and weighing them by the number of representatives per district (
${M_E}$
) and weighing them by the number of representatives per district ( ${M_R})$
.
${M_R})$
.
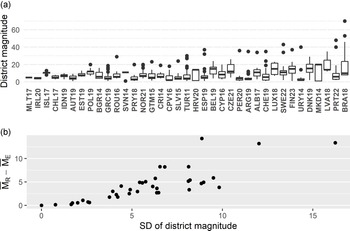
Figure 3a presents the median and interquartile range (hereafter IQR) of district magnitudes in each of the 37 cases employing PR with districts. It also presents the range of districts between 1.5 IQR above the 75th percentile and 1.5 IQR below the 25th percentile (marked by whiskers) along with the individual outlier districts beyond that range. Countries are organized by ascending order of their standard deviation of district magnitudes. While in some of the countries, there is no or little variation in magnitude across districts, in others, there is a substantial one. Turkey (2011) is an example of the latter. The median province elects four of the 550-seat Grand National Assembly, yet the three largest provinces (three regions of Istanbul) elect 27, 28, and 30 members, respectively. Portugal (2022), described above, is yet another such example. Overall, in many of the cases the median magnitude is substantially smaller, sometimes by 30 or even 60 seats, than the largest ones (e.g., Sweden, Brazil), and the distribution of districts often has a long upper tail.
District magnitude: variation and measures.
Note: Panel a presents the range (IQR) of district magnitude within each of the 37 democracies employing districted PR. Panel b presents the relationship between variation in magnitude and the gap between $\overline {{M_E}} $
and
$\overline {{M_E}} $
and $\overline {{M_R}} $
for these cases.
$\overline {{M_R}} $
for these cases.

Panel b of the figure presents the relationship between variation in magnitude (on the horizontal axis) and the discrepancy between magnitude measured by equally weighted districts ( ${M_E}$
) and that measured as weighted by the number of representatives per district (
${M_E}$
) and that measured as weighted by the number of representatives per district ( ${M_R})$
(on the vertical one). As the figure shows, in all cases, the score based on representatives is no smaller than the one based on districts (mean discrepancy = 4). As predicted above, there is a positive correlation between within-country variation in magnitude and the discrepancy between the two measures (r = 0.82, p-value < 0.01), with the latter reaching five, eight, and even more seats (e.g., Sweden, Switzerland, and Portugal, respectively). The maximal discrepancy is in Uruguay, which has a gap of 14.3 between the two measures. The vast majority of Uruguay’s seats have fewer than three representatives, while Montevideo has 41 seats. Overall, the more varied the district magnitudes in a country, the greater the divergence between
${M_R})$
(on the vertical one). As the figure shows, in all cases, the score based on representatives is no smaller than the one based on districts (mean discrepancy = 4). As predicted above, there is a positive correlation between within-country variation in magnitude and the discrepancy between the two measures (r = 0.82, p-value < 0.01), with the latter reaching five, eight, and even more seats (e.g., Sweden, Switzerland, and Portugal, respectively). The maximal discrepancy is in Uruguay, which has a gap of 14.3 between the two measures. The vast majority of Uruguay’s seats have fewer than three representatives, while Montevideo has 41 seats. Overall, the more varied the district magnitudes in a country, the greater the divergence between $\overline {{M_E}} $
and
$\overline {{M_E}} $
and $\overline {{M_R}} $
.
$\overline {{M_R}} $
.
Malapportionment
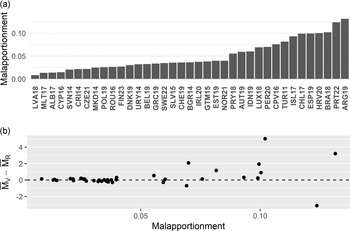
We follow Samuels and Snyder’s measure of malapportionment, which adds the absolute gaps between the proportion of seats and the proportion of the population (or eligible voters) across districts (Reference Samuels and Snyder2001, p. 655).Footnote 11 Panel 4a presents the malapportionment in the same set of democracies employing districted PR as above. The figure shows substantial malapportionment in general, with fourteen countries having more than five percent of their parliamentary seats allotted to districts that would not have had these seats otherwise. The figure also shows substantial variation across countries, with some (e.g., Malta, Latvia) being close to perfectly apportioned and others (e.g., Brazil, Portugal, Argentina) quite far from it.
Panel b of the figure presents the relationship between malapportionment (on the horizontal axis) and the discrepancy between the two measures – weighing districts by representatives ( ${M_R})$
and weighing them by voters (MV) (on the vertical axis). Compared to the discrepancies above, the discrepancy between the two units is modest (mean = 0.6), with Brazil exhibiting the largest one (5 seats). The cases where the discrepancy hovers around zero are cases in which voters and representatives are similarly assigned to districts, and thus malapportionment is limited. In the vast majority of cases, the difference is greater than zero (e.g., Spain, Turkey), indicating that the average voter casts her ballot in a district greater than that of the average representative. These are cases in which small districts are overrepresented in parliament and get more than the share of representatives they would have gotten by population alone. And although malapportionment is measured in absolute values, additional analysis shows that where small (large) districts are overrepresented, the weighing of districts by voters results in a larger (smaller) score than that of representatives. Overall, as expected, the greater the malapportionment, the greater the divergence (in absolute value) between the two measures (r = 0.73, p-value < 0.01).
${M_R})$
and weighing them by voters (MV) (on the vertical axis). Compared to the discrepancies above, the discrepancy between the two units is modest (mean = 0.6), with Brazil exhibiting the largest one (5 seats). The cases where the discrepancy hovers around zero are cases in which voters and representatives are similarly assigned to districts, and thus malapportionment is limited. In the vast majority of cases, the difference is greater than zero (e.g., Spain, Turkey), indicating that the average voter casts her ballot in a district greater than that of the average representative. These are cases in which small districts are overrepresented in parliament and get more than the share of representatives they would have gotten by population alone. And although malapportionment is measured in absolute values, additional analysis shows that where small (large) districts are overrepresented, the weighing of districts by voters results in a larger (smaller) score than that of representatives. Overall, as expected, the greater the malapportionment, the greater the divergence (in absolute value) between the two measures (r = 0.73, p-value < 0.01).
Districts, representatives, or voters?
The dramatic discrepancy between the district-based measure and the other two, as well as the modest one between the representative- and the voters-based measures, begs the question: What is the appropriate measure of district magnitude at the national level? The distinctions described above have clear implications for the way we ought to go about investigating substantive questions in electoral politics. Different measures, we contend, are called for, depending on the substantive question at hand. We hold that for most questions in comparative politics, weighing each district equally is misleading. The hypothetical electoral system described above demonstrates this point: although two-thirds of its districts are of a single member and are thus governed by majoritarian logic, the vast majority of actors in this system – both candidates/representatives and voters – operate in a multi-member district environment and under the logic of proportional representation.
We propose measuring district magnitude by focusing on the assignment, in fact the ‘districting’, of either elites or voters to districts, depending on the research question at hand. This calls for the incorporation of the way the institution pertains to the relevant actors: elites or voters. Electoral puzzles are numerous, and their accounts are varied. Some accounts have at their core elite incentives or behavior, such as incentives for representatives, the context in which candidates compete, and the like. In these cases, the measure of district magnitude ought to reflect the distribution of representatives/candidates across districts, and thus a representative-weighted measure is the way forward. Other explanations focus on the behavior of voters, highlighting factors such as their choice, considerations, and context. There, we hold, the most relevant measure ought to reflect the distribution of voters across districts and thus weigh districts by the respective figure of eligible voters casting their ballots in them. We follow below with two examples that illustrate this call. The first is the number of female candidates in legislative elections, and the second is the prevalence of strategic voting.
Candidates and representatives
The number of female candidates in political campaigns has been the focus of attention of numerous studies. Scholars have proposed different accounts for the generally limited number of female candidates; among them are voters’ biases (Sanbonmatsu Reference Sanbonmatsu2002), the gender gap in political ambition (Fox and Lawless Reference Fox and Lawless2014), and the recruitment gap between female and male candidates (Fox and Lawless Reference Fox and Lawless2004). An additional explanation highlights intra-party competition (Matland Reference Matland1993). Its thesis holds that other things equal, the number of female candidates has to do with within-party competition for viable candidacy spots. The likelihood of keeping any single candidate out when a new (female) candidate is inserted to the list is increased when districts (and parties) are smaller, thereby raising the prospective costs for party leaders who face opposition from candidates who are pushed to a lower position on the list.Footnote 12 This argument is therefore about candidates and the context in which they compete: the larger the districts, the lower the within-party cost of inserting a woman to the list. Thus, the more candidates compete in large districts, the greater will be the number of women in viable spots. To examine this argument, there is little value in measuring district magnitude by weighing districts equally – the number of districts that have women in viable spots is of limited information – nor in weighing them by the number of voters in them. Rather, one might seek to know the number of candidates competing in small or large districts, the magnitude of the district of the average candidate, and the like. Simply put, the hypothesized mechanism in this example is neither about districts nor about voters. It is about the districts in which candidates compete, and thus the measure of district magnitude should be candidate-centered.
Voters
Duverger’s law and hypothesis have been the focus of numerous studies. As the familiar argument goes, single-member district, first-past-the-post electoral systems favor two-party systems, and more generally, the number of parties declines with limitations on the permissiveness of the electoral system. One mechanism akin to votes-to-seats strategic voting and leading to this result is the inclination of voters to shy away from nonviable parties and rally their support around the least unacceptable among the two leading parties when the system is characterized by low permissiveness (Blais and Carty Reference Blais and Carty1991). Political scientists ask in turn: How prevalent is votes-to-seats strategic voting under different systems?
To analyze the prevalence of strategic voting, one needs to identify (a) the voters who are in a position to vote strategically: voters who cast their ballots in small-magnitude or even single-member districts and (b) those voters whose most preferred party is a non-viable winner in their district (e.g., Alvarez, Boehmke, and Nagler Reference Alvarez, Boehmke and Nagler2006). Thus, comparing the prevalence of strategic voting under different electoral systems or different contexts in general requires identifying the number of voters casting their ballots in districts of different magnitudes and under different viability conditions. This research question is neither about districts nor about representatives. Rather, it is about the number of voters whose electoral choice is made under particular circumstances. It is voters, therefore, that are the relevant unit of analysis by which district magnitude should be measured to analyze this question.
Measurement of district magnitude: how it matters
One might argue that the distinction among the three alternative measures is of limited consequence empirically. Indeed, the measures based on the three units are strongly and positively correlated: the average district correlates with the district of the average representative at 0.8 and with the district of the average voter at 0.77. The correlation between the district of the average representative and that of the average voter is almost 1.Footnote 13 This is not surprising: as is evident in Figure 3b, generally, where the average district is large, the average representative is elected in a large or very large district, and where the average district is small, the district of the average representative may be small or larger. The representative and voter measures are particularly strongly correlated. As is evident in Figure 4b, where the district of the average representative is large, the district of the average voter is often large.
Malapportionment and measures of district magnitude.
Note: Panel a presents malapportionment in 37 democracies employing districted PR. Panel b presents the relationship between malapportionment and the discrepancy between $\overline {{M_V}} $
and
$\overline {{M_V}} $
and $\overline {{M_R}} $
for these cases.
$\overline {{M_R}} $
for these cases.

It is precisely these correlations that might mistakenly lead researchers to the conclusion that the measures are empirically interchangeable. Yet the distinction matters not only theoretically but also empirically. First, as we show in the same figures, the gaps between the measures are almost entirely in one direction. Second, the gaps have a systematic component. How closely the two covary depends on the variation in magnitude (Figure 3b) or on malapportionment (Figure 4b).
In the analysis below, we provide two empirical examples of how the distinction we make matters. First, we show that systems that are similar by some measures are different by others (Table 1 below). Second, we demonstrate that the measures differ in their coefficients predicting political outcomes (Table 2 and Figure 5 below).
Units of measurement and the sweet spot

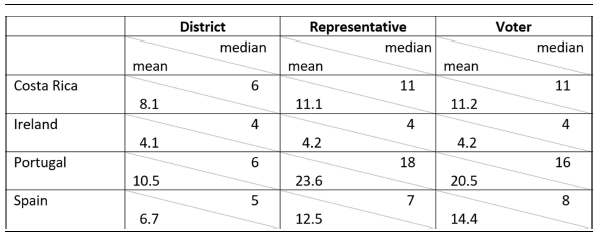
Note: Measures of district magnitude in four electoral systems.
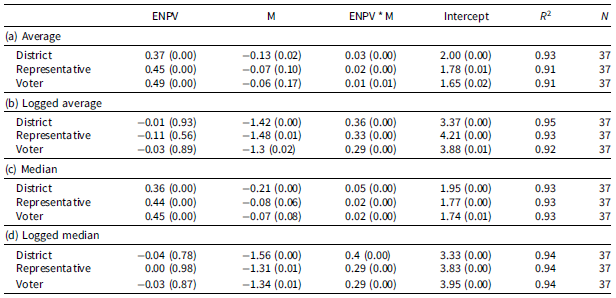
Legislative fragmentation and district magnitude
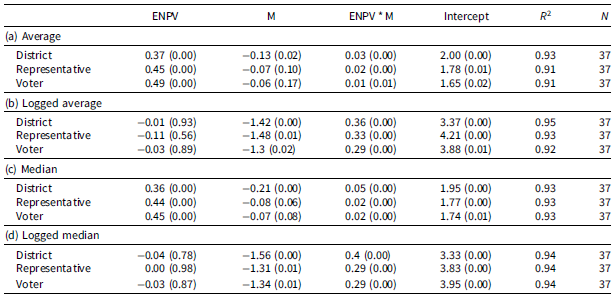
Note: p-values in parentheses.
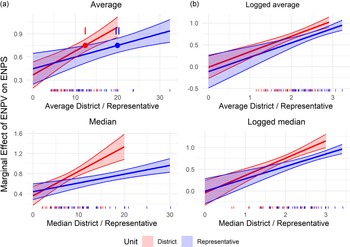
Legislative fragmentation.

The electoral sweet spot
In their seminal article, Carey and Hix (Reference Carey and Hix2011) analyze the tradeoffs of different electoral rules, focusing on representation of voters on the one hand and accountability on the other. The authors show the benefit of analyzing the tradeoff as non-linear rather than as one in which every unit gain on one dimension is accompanied by a constant loss on the other. They conclude that electoral systems employing low-magnitude multi-member districts – districts of 3–8 seats – are at a particularly advantageous spot: they score high on representation while sacrificing little on accountability (p. 393). This range has since become a benchmark of a sweet spot, straddling the advantages of both the proportional and the majoritarian worlds. Among the countries that the authors identify in the sweet-spot range are Costa Rica, Ireland, Portugal, and Spain (p. 384).
Table 1 presents the four cases. As can be seen in the upper section of the first column, weighing districts equally, each of the four indeed has a median district magnitude in the relevant range. When examining the same cases by representatives (column 2, upper section), however, the four drift apart: while Ireland with its limited variation in magnitude (SD = 0.8) has an identical score drawing on either unit, Costa Rica (SD = 5.3), Spain (SD = 6.3), and particularly Portugal (SD = 12) have substantially larger representative scores: 11 (compared to 6), 7 (compared to 5), and 18 (compared to 6!), respectively, far beyond the sweet spot. Reviewing the same cases by voters (column 3, upper section) produces similar scores to those by representatives in Costa Rica and Ireland and somewhat (albeit not dramatically) different ones in Portugal and Spain: the median voter casts her ballot in a district of 8 seats compared to 7 in Spain and 16 compared to 18 in Portugal. This is consistent with the higher malapportionment in the latter compared to the former two (see Figure 4). Ireland and Spain, therefore, are within the range of the sweet spot regardless of the unit of analysis drawn upon to measure district magnitude. Costa Rica and Portugal are within the sweet spot only when weighing districts equally.
In the lower section of each cell, we repeat this exercise, drawing on the mean rather than the median.Footnote 14 The results further demonstrate our point. Although the figures are, as expected, greater than the respective medians, the general patterns are similar to the ones above, and in some cases, the gaps across units are even larger once drawing on the mean rather than the median.
The similarity of the four electoral systems when measured by some units of analysis but not others is analogous to having the number of feet per meter vary across countries. Some countries will be similar when measured by meters but different when measured by feet. Correspondingly, our predictions regarding political outcomes in these countries (e.g., level of accountability, degree of representativeness, parliamentary fragmentation) will be similar when their magnitude is measured by one unit, but different when measured by another. The unit of measurement, as we show above, ought to be theoretically relevant for the question at hand.
Votes to seats
Having demonstrated the differences between our measures across cases, we turn to examining how the different units of analysis provide different predictions for political outcomes. To this effect, we analyze how legislative fragmentation, a commonly used measure of accountability (e.g., Carey and Hix Reference Carey and Hix2011: 388; Tavits Reference Tavits2007: 223), is related to the fragmentation of the party system at the electoral arena. Often referred to as the mechanical effect of Duverger’s hypothesis (Clark and Golder Reference Clark and Golder2006), this is the process by which the party system in the electorate is mapped onto the parliament in a fashion mediated by the proportionality of the electoral system. Thus, when the electoral system is proportional, the expectation is that the parliamentary party system will closely reflect that in the electorate. Conversely, when proportionality is hampered by the electoral system, the former does not accurately reflect the latter. While proportionality is a product of multiple institutional factors (e.g., threshold, upper-tier seats) alongside district magnitude, our focus is not so much on explaining proportionality but rather on the discrepancy between different measures of district magnitude. We thus estimate a standard model whereby: $ENPS = {\beta _0} + {\beta _1}ENPV + {\beta _2}M + {\beta _3}ENPV \times M + \varepsilon $
such that ENPS is the effective number of legislative parties (measued in seats), M is district magnitude (more on this below), and ENPV is the effective number of electoral parties (measured in votes). Our quantity of interest is the mapping of ENPV onto ENPS: ${{\partial ENPS} \over {\partial ENPV}} = {\beta _1} + {\beta _3}M.$
We measure M, district magnitude, by each of the three units of analysis: the original measure of equally weighting districts and the two alternative ones, representative-weighted and voter-weighted magnitudes, and draw on Gallagher (Reference Gallagher2024) for data on ENPS and ENPV. We ran the analysis for each of the three units in four specifications: two different functional forms (linear and logged) and two different statistics (average and median). The results of this analysis are presented in Table 2. We interpret the results below, but for now, note that while the coefficients of the constitutive terms vary somewhat in their direction and statistical significance across all four specifications, the interaction coefficient of the electoral fragmentation and district magnitude is positive.
Before analyzing substantive effects, let us reflect on the choice of measure of magnitude for the question at hand. At face value, one might think that given that we analyze the conversion of votes (electoral parties) to seats (legislative parties), districts are the appropriate unit of analysis. If this is the case, one might seek to know how many districts are small and how many are large, or, in terms of the average, what is the magnitude of the average district.
Upon further reflection, however, not all districts are equally consequential for the degree of legislative fragmentation. Large ones matter more than small ones, and thus weighing districts equally – as the district measure does – might lead us astray (Cox Reference Cox1997: 208–209). It is actually representatives rather than districts that are the relevant unit of analysis, and thus weighing districts by the number of seats (representatives) in them better fits the question at hand. When analyzing the conversion of a party system in votes to that in seats, it is the distribution (or some statistic of it) of seats/representatives across district magnitudes rather than the distribution of districts themselves that matters. One might ask how many of the parliamentary seats to be filled are part of small districts where the conversion is hampered by poor proportionality or large districts where the conversion is more accurate, what the magnitude of the district of which the average seat is part is, and the like. Whatever ends up being the statistic employed to capture the distribution, given that the investigated mechanism is about the composition of parliament, it is a statistic of the distribution of seats/representatives rather than districts.
Revisiting the hypothetical electoral system at the outset of the paper and applying the average to it can serve to illustrate this point. Recall that with two districts of a single seat and a third district of nine, weighing the three districts equally, the average district of that system is 3.67 seats. Yet while 2/11 of the parliamentary seats are elected in single-member districts characterized by poor conversion of votes to seats, 9/11 of the parliament is elected in relatively large and permissible districts. Thus, for predicting accountability, the effective number of legislative parties, the degree to which the legislative party system reflects the electoral one, and the magnitude of the district electing the average representative (7.54 seats) rather than that of the average district are the relevant units.
Figure 5 presents the substantive effect of the four specifications. The figure presents our quantity of interest per Equation (5) above, such that on the vertical axis is the conversion of ENPV (the electoral party system) to ENPS (the legislative party system), and on the horizontal one is district magnitude. Each panel of the figure corresponds with a section of the table and presents a different measure. For ease of presentation, and because of the empirical similarity between our two proposed measures, we include in each panel the district measure (red) and the representative one (blue) and omit the voter measure.
As the figure shows, in all specifications, the district measure predicts a closer mirroring (stronger effect, or better conversion) compared to the representative one. The discrepancy in the prediction is particularly large for the linear specifications regardless of the statistic employed (a and c) and is somewhat weaker, yet still clear in the logged ones (b and d). For illustration, we mark points I and II in panel (a), both with a conversion of 0.75, such that four effective parties in the electorate translate into three in parliament. Note that while a conversion of 0.75 is achieved in an average district of 12.4 seats, the average representative has to be elected in a district of no fewer than 20 seats to reach that same level of conversion. This discrepancy is consistent with the fact that for almost all countries the representative measure is greater than the district one (see the vertical axis of Figure 3b above): when the average district is of magnitude M0, the average representative is elected in a district whose magnitude is M1 > M0.
In summary, this illustration shows, first, that measuring M by representatives is the appropriate theoretical approach for the question at hand and, second, that employing different units of analysis leads to empirical discrepancy in the inferences drawn regarding electoral politics.
Conclusion: taking districts seriously
Districts are a ubiquitous and highly consequential component of electoral systems. Although district magnitude is a district-level property, in cross-country research it is summarized to a national score, which then serves as a key explanatory variable in a vast array of studies. This article showed that the summarization to a national-level score, commonly treated as a mechanical pre-research step, matters for substantive questions in comparative politics. The common practice, which equally weighs all districts, small or large, often leads to a misguided characterization of electoral systems and, in turn, affects inferences about the effect of district magnitude on political outcomes. Giving each district equal weight in the aggregation to the national level ignores the fact that, for most political implications, what we actually care about are not the districts, but rather the actors whose behavior is shaped by district magnitude.
To address this problem, we reconceptualized and remeasured district magnitude at the national level and proposed two alternative approaches to the common practice. These approaches take into account the number of either voters or representatives that face the conditions set by district magnitude across districts in a country. We showed that within-country variation in magnitude and malapportionment, common in different parts of the world, affects the degree to which the three approaches differ and offered analytic guidance on which measure to use in different circumstances. In a nutshell, the unit drawn upon to characterize an electoral system ought to be the unit relevant for answering the research question at hand.
While to the best of our knowledge, this is the first time the distinction between different conceptualizations of districting is systematically made in political science, analogous distinctions about other quantities are common in other fields. In the field of education, for example, scholars have observed that the average class in a college can be either the class taken by the average student or the class taught by the average faculty, two quantities that almost always differ. The unit of analysis that should be drawn upon to measure class size – students or faculty members – depends on whether it is the learning or teaching experience that one is interested in (Feld and Grofman Reference Feld and Grofman1977).
The insight that district magnitude should be conceptualized and measured by the way it pertains to representatives or voters and that the common practice of equally weighing districts should be set aside has implications for future research in comparative politics. First, students of electoral politics might wish to reconsider the way they characterize different electoral systems, particularly ones with a large variation in the number of seats per district. Because the gap between the national score based on an equal weighing of districts and that based on representatives or voters is not constant, the discrepancy in characterization is modest in some cases but substantial in others, per Figure 3 above. This, in turn, calls for revisiting analyses of the effect of district magnitude on various political outcomes. We demonstrated above that the inferred relationship between district magnitude and legislative fragmentation is altered once magnitude is measured by different units. Future study might find this to be the case for other political outcomes as well.
Supplementary material
The supplementary material for this article can be found at https://doi.org/10.1017/S1475676525100054.
Data availability statement
The data that support the findings of this study are openly available in the Constituency Level Elections Archive (CLEA) at https://electiondataarchive.org/data-and-documentation/clea-lower-chamber-elections-archive/.
Acknowledgements
We are grateful to Maayan Mor for her contribution to earlier versions of this project.
Funding statement
The work was supported by the ERC-SG 263630 and the ISF research grant 1766/15.
Competing interests
The authors declare none.






 Open access

