


While people can generally communicate through speech successfully, the processes underlying speech production are not always smooth and effortless. As a result, the stream of words people produce is typically punctuated by a range of different disfluencies, such as short pauses, stuttered repetitions and repairs, and filler words like uh and um. These disfluencies sometimes arise because speakers are having trouble figuring out how exactly to formulate or articulate an utterance. Second-language (L2) learners know well how the flow of their speech can be disrupted when they know what they want to communicate but struggle to express their intended message using the less familiar grammar and vocabulary of their L2. Still, even when speaking in their first language (L1), people often hesitate because they are trying to decide what it is that they want to convey in the first place. In this case, the problem lies not with linguistic encoding but with conceptualizing, or generating the content of a message for speech (Levelt, Reference Levelt1989).
Though the causes of particular types of disfluencies in speech are still not fully understood, some researchers (e.g., Fraundorf & Watson, Reference Fraundorf and Watson2013) have proposed that they may reflect problems at different levels of processing in speech production. This would mean that patterns of disfluency caused by linguistic encoding difficulties, such as performing syntactic operations or retrieving words from the mental lexicon, may differ from disfluency patterns linked to conceptual planning difficulties, such as deciding on the content of a message. Some recent studies have experimentally manipulated difficulty at one specific language production stage, such as lexical access (Hartsuiker & Notebaert, Reference Hartsuiker and Notebaert2010) or morphosyntactic encoding (Mirdamadi & De Jong, Reference Mirdamadi and De Jong2015), to determine if processing difficulties at different production stages lead to distinct patterns of disfluency. However, the link between specific disfluency patterns and conceptual planning has not yet been fully established, as no studies to date have sufficiently isolated conceptualizing from the later speech production stages. Moreover, it is not yet known if conceptualizing difficulty has the same influence on fluency in L1 and L2, given that speaking in an L2 already places higher demands on attentional and processing resources (Kormos, Reference Kormos2006). By exploring the relationship between conceptualizing and fluency in both L1 and L2 speech production, the present study aims to clarify how conceptual difficulty in the very first stage of speech planning impacts the fluency of speech output in two cases: when the subsequent stages of linguistic encoding are relatively fast and automatic (as in L1) and when they are slower and more effortful (as in L2). This information may shed light on the extent to which the conceptualizing and the later linguistic encoding stages in speech production draw on common cognitive resources, which would in turn have both theoretical implications for L2 speech processing and practical implications for the use of fluency measures in L2 proficiency tests.
FLUENCY IN RELATION TO L1 AND L2 SPEECH PRODUCTION MODELS
One of the most comprehensive psycholinguistic models of speech production is the blueprint of the speaker developed by Levelt (Reference Levelt1989, Reference Levelt1999) and Levelt, Roelofs, and Meyer (Reference Levelt, Roelofs and Meyer1999). In this model, information flows forward incrementally through a series of processing stages that are grouped into three modules: the conceptualizer, the formulator, and the articulator. The conceptualizer generates a preverbal message through the two steps of macroplanning and microplanning. In macroplanning, the speaker selects and orders the information to be expressed that will satisfy a particular communicative intention. In microplanning, the preverbal message is further specified for focus and perspective, semantic relations, and conceptual features that are obligatorily expressed in the language being used. The conceptualizer’s output enters the formulator, where the appropriate lemmas from the mental lexicon are activated and placed into a syntactic surface structure through the process of grammatical encoding. The formulator also carries out morphophonological and phonetic encoding. When the articulator executes the phonetic plan, overt speech is produced. These basic steps of activating concepts, retrieving linguistic forms, and articulating speech are also central to connectionist models of speech production, such as those of Dell, Schwartz, Martin, Saffran, and Gagnon (Reference Dell, Schwartz, Martin, Saffran and Gagnon1997).
Both Levelt’s blueprint of the speaker and Dell’s connectionist models can account for disfluencies in L1 speech production in several ways. According to Levelt’s model, problems in both inner speech and overt speech can be detected by the self-monitor via perceptual feedback loops. In connectionist models (e.g., Nozari, Dell, & Schwartz Reference Nozari, Dell and Schwartz2011), error detection occurs not through a comprehension-based monitor but rather through a process of conflict monitoring by a domain-general executive center. Regardless of how errors are detected and corrected, both types of models would predict that the subsequent replanning of speech requires additional processing time, potentially leading to pausing. Error detection and correction are not the only source of disfluencies, however. Disfluencies can also result from processing difficulties at any point in the speech production process when one step takes too much time and the subsequent step is consequently delayed.
Speaking in a second language is typically more challenging than speaking in one’s native language, in large part due to incomplete linguistic knowledge of the L2 as well as having to inhibit the L1. According to Kormos (Reference Kormos2006), the linguistic encoding processes of formulating and articulating in a second language are less automatic and often require conscious effort and attentional control, which leads them to run serially rather than in parallel. This contrasts with L1 speech production, where conscious attention and control are usually only required for conceptualizing. Furthermore, L2 speech is often characterized by more disfluencies than L1 speech (e.g., De Jong, Groenhout, Schoonen, & Hulstijn, Reference De Jong, Groenhout, Schoonen and Hulstijn2015; Derwing, Munro, Thomson, & Rossiter, Reference Derwing, Munro, Thomson and Rossiter2009; Towell, Hawkins, & Bazergui, Reference Towell, Hawkins and Bazergui1996). To explain this observation, we should consider L2-specific speech production models.
While Levelt’s model was developed to explain monolingual speech production, more recent models have expanded this framework to cover speech production in bilingual or L2 speakers (De Bot, Reference De Bot1992, Segalowitz, Reference Segalowitz2010). De Bot’s and Segalowitz’s models both assume that the same basic psycholinguistic mechanisms underlie L1 and L2 speech production. According to De Bot, the first process in bilingual speech production, the macroplanning stage of conceptualizing, is language general, meaning it works the same way regardless of the language the utterance will ultimately be produced in. He posits that the subsequent microplanning stage is language specific, however, as different conceptual features need to be specified depending on which language is to be spoken. Segalowitz’s (Reference Segalowitz2010) model is designed to show how L2 speech is vulnerable to disfluencies at many points in the speech production process because of the additional processing load imposed by devoting attention and effort to processes that occur more automatically in L1. Following De Bot’s reasoning about macroplanning being language general, Segalowitz does not predict that macroplanning demands should pose any additional L2-specific processing difficulties. In contrast, the later stages of microplanning, formulating, and articulating are predicted to lead to L2-specific disfluencies because of deficits in L2 linguistic knowledge and less automatized processing.
HOW CONCEPTUALIZING DIFFICULTY INFLUENCES FLUENCY
Given that speaking in an L2 increases cognitive processing demands in the later stages of speech production, but not necessarily in macroplanning, it remains an open question how a processing slowdown in that initial stage would impact fluency in L2 relative to in L1. In the L1 speech production literature, there has been some debate about whether the same attentional resources are drawn on by both macroplanning and microplanning (Greene & Capella, Reference Greene and Cappella1986; Levelt, Reference Levelt1989; Roberts & Kirsner, Reference Roberts and Kirsner2000). If that were the case, an increase in macroplanning activity should also slow down microplanning and ultimately decrease fluency as the conceptualizer produces less material for the formulator in a given period of time. Studies examining temporal cycles of alternating fluency and hesitancy in monologues have provided some evidence that the conceptualizer’s generation of new speech plans requires significant attentional resources. Greene and Capella (Reference Greene and Cappella1986) theorized that in spontaneous speech, transitioning between subgoals or “moves” in discourse planning would place increased demands on central processing capacity. Therefore, they predicted that there would be more pausing at boundaries between ideas in the discourse, during which speakers would be engaged in planning their next move. A time series analysis revealed that most idea boundaries were associated with an increase in silent pausing. When speakers were given guidelines beforehand to structure their discourse, the tendency for idea boundaries to be associated with silent pausing was greatly reduced. That is, when conceptual planning demands were reduced, the disfluency at transitions between ideas was attenuated.
More recently, Roberts and Kirsner (Reference Roberts and Kirsner2000) analyzed spontaneous speech samples and statistically verified the existence of temporal cycles of fluency. They found a strong and consistent tendency for topic shifts to be followed by greater fluency but preceded by more disfluency, using measures that combined silent and filled pauses. They interpreted their findings as supporting models in which macroplanning competes with other levels of speech production for a common pool of limited cognitive resources. In this sense, macroplanning could be a “cognitive bottleneck” that ties up cognitive processing resources and causes other levels of production to run less efficiently until it has finished.
Periods of relative disfluency coinciding with topic shifts in spontaneous speech may reflect the cognitive processing load involved in conceptualizing. However, experiments that actively manipulate the conceptualizing difficulty of speech can show its effects on fluency directly. Early psycholinguistic studies investigated how fluency was affected by how many possible alternative responses could be made to a given stimulus. Siegman and Pope (Reference Siegman and Pope1966) found that when people orally described cards printed with ambiguous scenes, the pictures with more possible interpretations elicited speech with a higher proportion of filled pauses and repairs. Goldman-Eisler (Reference Goldman-Eisler1968) compared the simple task of describing comic strips with the more conceptually complex task of interpreting the same comic strips’ meaning, and she found that the proportion of silent pausing to total speech time was nearly twice as large when interpreting the comics as when merely describing them. Lay and Paivio (Reference Lay and Paivio1969) also compared fluency across multiple speaking tasks of differing cognitive difficulty and demonstrated that various types of disfluencies increased with increasing task difficulty. Although these studies all support the notion that conceptualizing difficulty increases certain kinds of speech disfluencies, it is hard to discern whether the reported fluency differences across experimental conditions were exclusively due to conceptualizing demands. Because the various speaking tasks may have differed from each other in factors such as lexical difficulty, syntactic complexity, and sentence length, the difficulty of the formulating and articulating stages of speech production also likely varied between conditions.
More recently, researchers interested in how conceptualizing is linked to disfluencies have designed experiments with more controlled manipulations where the content of elicited speech is more comparable across conditions. For instance, Christenfeld (Reference Christenfeld1994) tested the theory that the number of options a speaker is contemplating when deciding what to say contributes to the production of filled pauses. His participants had to describe the correct path through three different mazes: one with a single path from start to finish, one with choice points between two possible paths, and one with choice points among three possible paths. As predicted, the number of filled pauses per minute of speech increased as the maze complexity increased, and the number of filled pauses produced at choice points also increased when there were more path options. This experiment likely elicited speech that was relatively similar in vocabulary and structure across the three experimental conditions. However, as the analysis of disfluencies was limited to filled pauses, the effect of increased options for conceptualizing on other types of disfluencies remains an open question.
Another recent study that explored conceptual and planning-based factors related to fluency in speech production is that of Schnadt and Corley (Reference Schnadt and Corley2006), who employed network description tasks. In their experiments, participants viewed networks of interconnected objects on a computer screen. Their task was to describe the route taken by a marker that moved along the network of paths connecting the objects. Each pair of adjacent objects was connected by one, two, or three lines, so participants sometimes had to specify which of the multiple possible paths the marker took. It turned out that when there were more paths to choose from, people produced more filled pauses, prolongations, and repairs. One potential confounding factor in this experiment is that whenever there were multiple path options, the description also required a greater number of words (i.e., to specify whether to take the left path, right path, or middle path). Therefore, the increase in disfluencies with more path options could still have been partly due to the processing demands of formulating to produce more linguistic output, in addition to the heavier conceptualizing load.
Of existing studies on conceptualizing and speech production, the one that best controls linguistic output is that of Melinger and Kita (Reference Melinger and Kita2007), who looked at the link between conceptualization processing load and the gesture production rate. Their participants described deterministic or nondeterministic networks of colored circles. Partway through the description of a given network, they were interrupted by one of two secondary tasks: either a spatial task that generated interference in spatial working memory or a task that used different cognitive resources. The former task was assumed to make subsequent macroplanning more difficult. The experiment was designed so that the content of the speech required after the secondary task was the same in both conditions. As predicted, subjects produced more gestures upon resuming their description of the network after the spatial task than the nonspatial task. Though Melinger and Kita’s (Reference Melinger and Kita2007) study was focused on the production of gestures, rather than speech disfluencies, their experimental design illustrates an effective method of varying conceptualizing demands while holding speech output constant.
RESEARCH QUESTIONS AND HYPOTHESES
On the whole, the research discussed above suggests that the increased processing load imposed by greater conceptualizing difficulty is likely to have a negative effect on fluency, at least in L1 speech production. However, there has been inconsistency in the degree to which the process of conceptualizing has been successfully isolated from later speech production stages, which makes it hard to draw clear conclusions about its unique impact on fluency. The present study aims to experimentally manipulate macroplanning difficulty in a controlled way, to examine a wide range of utterance fluency measures separately, and to clarify the link between conceptualizing and fluency in both L1 and L2 speech production. Two main research questions are addressed. First, what is the effect of macroplanning difficulty on utterance fluency in spontaneous speech production? Second, does increased conceptualizing difficulty cause the same or different patterns of disfluencies in L1 and L2 speech? In other words, is there an interaction between conceptualizing difficulty and language such that an increase in macroplanning demands will have a larger effect on disfluencies in L2 than in L1?
Regarding the first question, we hypothesize that when macroplanning is made more difficult, speech will become less fluent. We expect increased conceptual planning demands to induce more filled pauses, a result that has been previously reported in studies using experiments with different levels of conceptual or cognitive difficulty (e.g., Christenfeld, Reference Christenfeld1994; Lay & Paivio, Reference Lay and Paivio1969; Schnadt & Corley, Reference Schnadt and Corley2006; Siegman & Pope, Reference Siegman and Pope1966). This finding would support the view that filled pauses are the type of disfluency most closely linked to the process of generating message-level plans (Fraundorf & Watson, Reference Fraundorf and Watson2013). We also predict that increased macroplanning difficulty will cause more silent pauses, in line with the results of previous studies comparing speech tasks of varying difficulty (e.g., Goldman-Eisler, Reference Goldman-Eisler1968) and studies analyzing silent pauses surrounding idea boundaries in spontaneous speech (e.g., Greene & Capella, Reference Greene and Cappella1986). If conceptualizing difficulty affects not only breakdown fluency but also repair fluency, then we would also expect that higher macroplanning difficulty would increase the occurrence of repetitions and repairs, in line with previous studies (e.g., Lay & Paivio, Reference Lay and Paivio1969; Schnadt & Corley, Reference Schnadt and Corley2006). Finally, we expect that greater macroplanning difficulty will lead to more lengthenings of syllables, such as “the” pronounced like “thee,” as these types of prolongations have also been associated with planning problems in speech production (e.g., Fox Tree & Clark, Reference Fox Tree and Clark1997). Of course, we cannot directly pinpoint the cause of any one disfluency, but our aim is to determine which of the abovementioned types of disfluency are influenced by changes in conceptualizing difficulty when the formulating and articulating processes are held constant by constraining the linguistic output.
With regard to the second research question, we predict that when conceptualizing difficulty is increased, this will have a negative effect on fluency in L1 and L2, in terms of both types of disfluencies and how many more disfluencies will be produced. Overall, we predict that L2 speech will be less fluent than L1 speech, which can be explained by any number of L2-specific difficulties in formulating and articulating (Segalowitz, Reference Segalowitz2010). Moreover, just as psycholinguistic research has shown that conceptualizing difficulty may be linked to various kinds of disfluencies in L1 speech production, it has been shown in the L2 acquisition literature that highly demanding speaking tasks with a greater level of cognitive complexity result in less fluent L2 speech (e.g., Ellis, Reference Ellis2009; Levkina & Gilabert, Reference Levkina and Gilabert2012; Robinson, Reference Robinson2001; Skehan & Foster, Reference Skehan and Foster1997). However, it is not entirely clear whether we should expect to find the same pattern and magnitude of conceptualizing-related disfluencies in both language conditions. On the one hand, we might predict that the patterns of disfluency will be the same in L1 and L2 as macroplanning, unlike some later stages in speech production, is theorized to be a language-independent process (De Bot, Reference De Bot1992). On the other hand, based on Robert and Kirsner’s (Reference Roberts and Kirsner2000) cognitive bottleneck account, we would expect to find at least some interaction effects between language and conceptual difficulty. This is because an increased macroplanning load would temporarily tie up resources needed by the formulator and articulator, and as these operate less efficiently in L2, it would be even harder in L2 for the whole speech production system to catch up again, leading to disproportionately more disfluencies as a result.
OVERVIEW OF THE PRESENT STUDY
The present study comprises two experiments that systematically manipulated the difficulty of macroplanning in both L1 and L2 speech in order to determine the effect of this manipulation on a range of disfluency types. Both experiments were network description tasks, similar to those used by Schnadt and Corley (Reference Schnadt and Corley2006). Like Christenfeld (Reference Christenfeld1994), we operationalized macroplanning difficulty as the number of choices or alternative paths that participants had to consider at each node in the network. The experiments were designed such that the required speech output was identical regardless of the level of macroplanning difficulty. This way, the processes of formulating and articulating were constant across conditions, and comparing the fluency of speech across conditions could clarify which disfluency patterns were specifically related to conceptualizing difficulties.
Inspired by previous studies using online changes in visual stimuli to interrupt speech planning (e.g., Hartsuiker, Catchpole, De Jong, & Pickering Reference Hartsuiker, Catchpole, De Jong and Pickering2008), our experiments implemented online changes in the networks in order to make participants plan their speech anew at certain steps along the path. We used eye-tracking technology to track participants’ gaze while they were speaking. The online changes were triggered when their eyes fixated on certain objects at predetermined points in the network. This procedure was based on the assumption that people’s gaze follows the objects they are speaking about and that gaze duration is related to the time it takes for speakers to retrieve the phonological form of an object’s name (Griffin & Bock, Reference Griffin and Bock2000; Van der Meulen, Reference Van der Meulen2001).
EXPERIMENT 1: APPEARING PATHS
In this experiment, participants had to describe paths in networks of pictures in which the target paths between the pictures only appeared onscreen one step at a time. This meant that participants had to continuously generate new speech plans. Macroplanning difficulty was operationalized as the number of distractor paths at each choice point in the network. Steps could appear in one of two conditions: easy when there was one target path and one distractor path and difficult when there was one target path and two or three distractors. The target path was always the same across both conditions, so the content of speech was identical regardless of the level of macroplanning difficulty.
Method
Participants
The participants were 25 students (18 female, 7 male) with a mean age of 22 years, who were recruited and tested at Utrecht University in the Netherlands. All were L1 speakers of Dutch with an intermediate to advanced level of L2 English proficiency. All participants had received at least 6 years of formal English training in high school, but none had ever enrolled as (BA or MA) students of English language and culture. Participants filled out the LexTALE task for English (Lemhöfer & Broersma, Reference Lemhöfer and Broersma2012) and performed on average 72 points (SD=18), equivalent to around the B2 level of English proficiency.Footnote 1
Materials.
PICTURE STIMULI
This experiment used 54 pictures taken from the International Picture Naming Project (Bates et al., Reference Bates, D’Amico, Jacobsen, Szekely, Andonova, Devescovi and Tzeng2003; Severens, van Lommel, Ratinckx, & Hartsuiker, Reference Severens, van Lommel, Ratinckx and Hartsuiker2005), which has norms for these pictures in Dutch and English. Pictures were chosen such that name agreement was 96% or higher in Dutch (Severens et al., Reference Severens, van Lommel, Ratinckx and Hartsuiker2005) and English (Bates et al., Reference Bates, D’Amico, Jacobsen, Szekely, Andonova, Devescovi and Tzeng2003). Distractor pictures for individual networks were chosen randomly. The picture stimuli fit into different semantic categories such as animals, food, human-made objects, and leisure.
NETWORK STIMULI
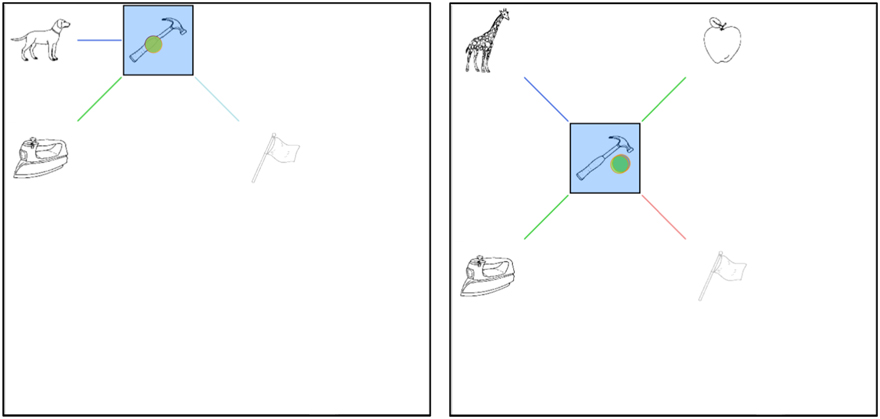
Each network consisted of 16 picture slots on a 4×4 grid. The slots were connected by colored lines representing the paths in the network. Target paths were semantically related and consisted of six items. Each step along the path except the first and last counted as a single trial, so each network consisted of four trials, each of which could be easy or difficult. The first item on the path was marked with an “A” and the last item with a “B.” Figure 1 shows an example of two consecutive steps in an Appearing Paths network.
Two consecutive steps in one network in the Appearing Paths experiment. The green dot, not visible to the participant, indicates the eye fixation location. When the hammer is fixated, the key from the previous step fades out (left frame), and when the match is fixated, the hammer from the previous step fades out (right frame).

There were a total of 20 networks, each paired with a so-called mirror version in which each step on the network appeared in the opposite difficulty condition as in the original network. Thus, items that appeared in the easy condition in the first network would appear in the difficult condition in the mirror network, and vice versa. Figure 2 displays an example of the same item as it was presented in the easy and difficult conditions. The target paths were identical between the two versions, so the content of the required speech was the same. Two experimental lists were used, one containing the original networks and one containing the mirror networks. Participants received one list for their L1 and the other list for their L2.
A comparison of a single step in an Appearing Paths network—through the green line to the iron—presented in one list in the easy condition and in the other list (left frame) and in the difficult condition (right frame). In both cases, the previous step from the flag is faded out and no longer an option. The green dot, not visible to the participant, indicates the eye fixation location.
Procedures
The experiment was conducted in L1 and L2 in two separate sessions held approximately 1 week apart. The procedure was identical for both sessions. Participants were familiarized with the set of 54 pictures in a self-paced picture-naming task. If participants did not know the name for an object, the name was provided to them. After familiarization, the network description task began. Participants were instructed that for each network, their objective was to describe a path between items that were semantically related to each other. For example, if the first item that appeared in a network was a turtle, the correct path might eventually include an owl, a zebra, a lion, a giraffe, and a pig, with human-made objects on distractor paths. Participants were told that their description should always include the name of the picture to which they were moving and the line color of the path they were taking. They received one example network before beginning the main test phase.
For each individual network, the procedure was as follows. Each time the participant fixated on a target item, the item was highlighted in blue and new paths pictures branching out from the item appeared. At the same time, the previous target item and path faded to a light gray, while previous distractor paths and items disappeared entirely. A gaze duration of 500 ms on the target item was used to trigger these changes, because this duration had been shown to work best in pilot testing. If the participants chose the wrong path and fixated on a distractor object, the lack of any visual changes alerted them to their error. Throughout the task, participants’ speech was recorded.
Measures
As the experimental manipulation was the difficulty in describing the path from one item to the next, the speech recordings were divided into segments that each represented the description of a single step in the path (e.g., “from the red line to the turtle”). Each of the 20 networks contained three speech segments to be analyzed: the descriptions of the paths from the second to the third item, from the third to the fourth item, and from the fourth to the fifth item. The description of the very first path step was excluded from analysis because at that stage participants were still figuring out the semantic theme of the correct path for the first time. The last step was also excluded from analysis because participants did not have to consider any distractor paths there, given that the end target picture was always labeled as such. For each speech segment, we measured fluency in two ways: counting the presence of overt disfluencies and taking measures of speaking time. While taking these measurements, the annotator was blind to the experimental condition in which the speech segment was produced.
DISCRETE DISFLUENCIES
The following discrete disfluencies were annotated: filled pauses, silent pauses, lengthenings, repetitions, and repairs. Filled pauses were defined as instances of filler words indicating hesitation, such as “uh” and “um.” Silent pauses were defined as pauses lasting longer than 150 ms. This is a shorter criterion than sometimes used in the L2 speech production literature (e.g., 200 ms defined by Kormos, Reference Kormos2006, or 250 ms as advised by De Jong & Bosker, Reference De Jong and Bosker2013). This shorter criterion was chosen because pauses were always counted within (rather than between) the already short path-step utterances, and because we wanted to use the same threshold for L1 and L2 pauses. Lengthenings were defined as instances of syllables that the annotator judged to have a noticeably drawn-out duration relative to the speaker’s typical pronunciation (e.g., “the” pronounced as “theee” or “thuuhh”). Repetitions were instances when a word or phoneme was quickly repeated without its identity being modified (e.g., “the b-blue line”). Repairs were instances when the speaker made an immediate self-correction, whether to correct a mispronounced word (e.g., “zèbra— zebra”) or to correct a wrong word (e.g., “the rrr-yellow line”).
SPEAKING TIME MEASURES
Two measurements related to speaking time were calculated only for the subset of trials without any overt disfluencies, which allowed for speaking time to be assessed independently. First, the length of each utterance as measured from the onset of the first syllable to the coda of the last syllable was taken as a measure of total speech duration for each segment. Second, for each utterance, the length of time from the moment of fixation on the critical object (as measured by the eye tracker) to the moment when the speaker began to pronounce the color of the path to that object was recorded. This measurement reflects the time it took for the speaker to commit to a choice about which path to follow at that step, because the colors of the different lines the participants had to choose from were always different. This duration includes any silent time before the speaker began describing that step of the path, and it may include speech from a previous utterance that was still unfolding when the fixation was measured. The “time from fixation to color name” measure is thus informative on top of the “total speech duration” measure because it more closely encapsulates the timeframe during which conceptualizing for that trial must have been occurring, including any conceptual planning time before the utterance. As this second measure relied on fixation data from the eye tracker, it was only calculated for trials where people’s eye movements were closely aligned to the items they were talking about. Thus, for this measure, we excluded trials where participants’ gaze was actually a step ahead of the item they were currently describing.
Results
Across both the L1 and L2 conditions for all networks and all participants, we began with 3,000 critical speech segments to analyze. Based on a visual inspection of the histogram of segment durations, we decided to exclude all trials in which the total speaking time to describe a path step was longer than 5 s, as this point reflected the beginning of the flat right-sided tail. Utterances longer than this cutoff point typically indicated substantial confusion or distraction on the part of the participant, and we only wanted to analyze trials with the expected speech output. In addition, we excluded all trials in which the speaker erred by taking the wrong path or when technical problems with the eye tracker disrupted the experiment temporarily. This resulted in 2,871 usable trials (95.7% of the total trials).
Presence of disfluencies
For the Appearing Paths experiment, Table 1 shows the proportion of utterances in each condition that contained at least one occurrence of the given types of disfluencies.
Appearing Paths: Percentage of utterances containing disfluencies across conditions

To determine if the differences between the two conditions were significant, we constructed generalized linear mixed-effects models for each disfluency type (Baayen, Davidson, & Bates Reference Baayen, Davidson and Bates2008; Quené & van den Bergh, Reference Quené and van den Bergh2008). In each model, the presence (vs. absence) of the disfluency was the dependent variable. The models’ fixed effects included the condition of each trial (easy or difficult choice), the language (L1 or L2), and the interaction between condition and language, and the random effects included participant and item number. When random slopes were added to the models, there were no significant improvements in model fit nor changes in the interpretation of results, so here we report the models with nonrandom slopes. These models therefore assume that the effect of conceptualizing difficulty on fluency does not differ across participants. The results of these models, with the easy choice condition taken as the intercept, are shown in Table 2. There were no main effects of conceptualizing difficulty on any of the disfluencies, nor were there any significant interaction effects between conceptualizing difficulty and language. However, there was one main effect of language: lengthenings occurred more often in L2 than in L1.
Appearing Paths: Generalized linear mixed-effects models for predicting different disfluency types

Note: Intercept represents the easy choice and L1 condition. *p<.001.
Speaking time measures
In addition to examining measures of breakdown and repair fluency, we examined speech fluency by comparing the speech time variables across the two levels of macroplanning difficulty and the two language conditions. Both speech time variables were only calculated for the subset of trials without disfluencies in order to examine speech time independently. However, the mean time from fixation to color name almost always spanned the last part of the preceding utterance and the first part of the current (target) utterance, and therefore it always included whatever silent pause came between the two utterances. Note that the latter measure was only calculated for fluent trials in which the participants’ speech kept pace with their eye movements, as discussed in Measures above. These descriptive statistics are presented in Table 3.
Appearing Paths: Speaking time measures calculated for fluent trials

Next, as shown in Table 4, we used linear mixed-effects models to explain the speech time variables by setting the macroplanning difficulty, language conditions, and their interaction as the fixed effects and participant and item number as random effects. The easy choice condition was again treated as the baseline (intercept). The p values for each predictor in the models were calculated from the t statistics according to the conservative method described in Hox (Reference Hox2010, p. 46), which calculates the degrees of freedom as the number of second-level units (here 25 participants) minus the number of explanatory variables in the model (here six, counting the two random effects, three fixed effects, and intercept) minus one. Based on these models, the total utterance duration did not differ significantly as a function of the conceptual difficulty or whether the speech was in L1 or L2. However, the time from fixation to color naming was longer in the more difficult choice condition. For the total speaking time and for the time from fixation to color naming, there were no interaction effects between language and conceptualizing difficulty.
Appearing Paths: Linear mixed-effects models for predicting speaking time measures

Note: Intercept represents the easy choice and L1 condition. *p<.01.
Discussion
The Appearing Paths experiment showed that an increase in macroplanning difficulty slowed down speech during the timeframe when conceptualizing was taking place, as reflected in the time from fixation to color name measure. However, conceptual difficulty did not lead to a significant increase in the five disfluency types we measured, despite some numerical trends in that direction. In other words, people did take slightly more time to speak while the conceptualizing demands were higher, but they managed to avoid interrupting the flow of their speech to do so. This could be because the difference in difficulty between the easy and difficult conditions (one distractor path vs. two or three distractor paths) did not increase conceptualizing demands enough for their effect on disfluencies to be shown. Here there was a practical limit to the number of paths we could require participants to choose from, whereas in everyday life speakers are faced with a far greater range of choices every time they generate a speech plan. In the next experiment, we compared three different levels of macroplanning difficulty in a more cognitively demanding task.
EXPERIMENT 2: CHANGING PATHS
In this experiment, participants were required to find and describe the shortest path between two pictures in a series of networks. During their path description, the network of paths would sometimes change at a predetermined point, forcing participants to revise their original speech plan. Macroplanning difficulty was operationalized as the number of distractor paths at the critical nodes where the network changed. The easy change condition was when there was one target path and one distractor path after the change, and the difficult change condition was when there was one target path and two or three distractors after the change. In the no-change condition, which served as a baseline, the network did not change during the participant’s path description. Because the correct path after the critical node was identical across the three conditions, the content of speech following the change was identical across conditions.
Method
Participants
The participants were the same people as those in Appearing Paths (see Experiment 1).
Materials.
PICTURE STIMULI
Forty-eight of the 54 pictures from Appearing Paths were used in this experiment. Pictures for the individual networks were chosen randomly, without regard for semantic categories.
NETWORK STIMULI
Each network consisted of 16 pictures connected by colored lines on a 4×4 grid. Two pictures were marked with the letters “A” and “B,” which signified the start and end points of the path. In each network, there was one target picture at which the change would occur. The target path was always between four and six steps, and the target picture could be located on either the first, second, or third step. Both before and after the change, each network had only one correct path that was the shortest route toward Point B.
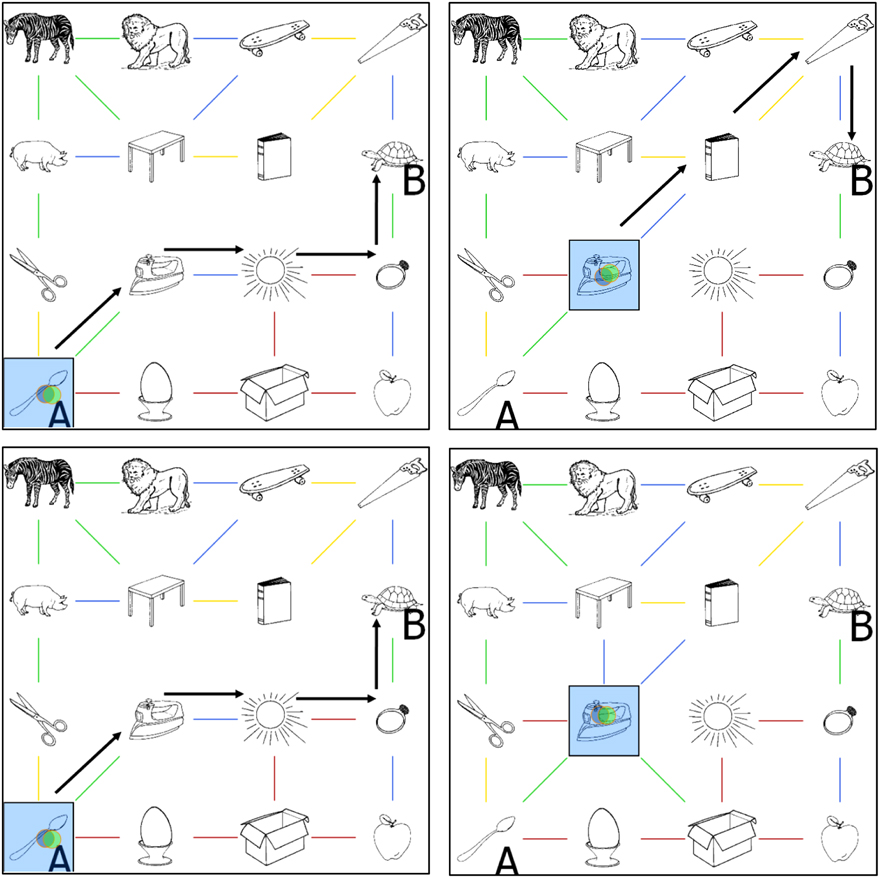
There were 54 networks, each of which had a no-change, an easy change, and a difficult change version. The target path was identical across the three versions of a network. Three experimental lists were used, and each list contained 18 networks in the easy condition, 18 networks in the difficult condition, and 18 networks in the no-change condition. Figure 3 shows an example of a network before and after the change in the easy change versus the difficult change condition. Lists were matched such that networks appeared in the different conditions across lists rather than within lists. Thus, if a network appeared in List 1 in the easy condition, it would appear in List 2 in the difficult condition and in List 3 in the no-change condition. Participants received one list for their L1 and another list for their L2.
A Changing Paths network configuration before (left panels) and after (right panels) an easy change (top row) and before and after a difficult change (bottom row), which is triggered when the participant fixates the target object, here the iron. In the no-change condition, not pictured, the network was always identical to the after-easy-change version. The black arrows, shown here for illustration purposes only, indicate the target path.
Procedures
As before, the experiment was conducted in L1 and L2 with identical procedures but in two separate sessions a week apart. Familiarization with the pictures was already completed for the Appearing Paths experiment and was therefore not repeated here. Participants were instructed that their task was to describe the shortest path between the points labeled A and B in each network, again by naming both the picture and the line color for each step in the path. At the beginning of each network, they could take as much time as necessary to examine the whole network and choose their path. Once they were ready, they could press the space bar and begin their verbal description. At this point, the eye tracker began counting gaze durations to make changes in the network. Every time the next item on the target path was fixated, it lit up in blue until the participant’s gaze moved on to the next object. Only items along the target path could light up, and they would only light up in the correct order. In this way, the blue box acted as feedback that helped participants to position themselves in the network. When the target picture for a given network was fixated for 500 ms, the available paths would change, except in the no-change condition. The main test phase was preceded by three example networks so participants could get used to the procedure.
Measures
As in the previous experiment, the recorded speech was divided into segments that represented the description of a single path step. Each of the 54 networks contained one critical speech segment to be analyzed: the description of the next step in the path immediately after the change in the network structure occurred, which was always the step toward the third, fourth, or fifth item in the path. The exact same measures of discrete disfluencies and speaking time were made as for Appearing Paths (see Experiment 1).
Results
Across both the L1 and L2 conditions for all participants, we began with 2,700 critical speech segments to analyze. As before, we excluded trials in which the total speaking time was longer than 5 s, when the speaker made an error, or where there were technical problems with eye tracking. This resulted in 2,440 usable trials (90.4%).
Presence of disfluencies
The percentage of trials containing any instance of each of the five disfluency types for each condition of language and conceptualizing difficulty is displayed in Table 5. To further examine these differences in disfluency production across conditions, we employed generalized linear mixed-effects models in the same way as in Experiment 1. For each model, we set the presence (vs. absence) of the disfluency as the dependent variable. The condition of each trial (no change, easy change, or difficult change), the language (L1 and L2), and the Condition×Language interactions were fixed effects, and participant and item number were random effects with nonrandom slopes. We employed an orthogonal contrast coding scheme to be able to compare both the easy and the difficult change conditions to the no-change baseline and to each other within the same model.
Changing Paths: Percentage of utterances containing disfluencies across conditions

Table 6 presents the models created for each of the five discrete disfluency types. The models show that participants were more likely to produce filled pauses, silent pauses, and lengthenings in the change conditions than in the no-change condition. The presence of these disfluency types did not, however, differ between the easy and difficult change conditions (all ps>.05). Repairs were significantly more likely in the difficult change condition relative to the easy change condition, but not more likely in the change conditions taken together against the no-change baseline. Repetitions were not affected by the change condition.
Changing Paths: Generalized linear mixed-effects models for predicting different disfluency types

Note: Intercept represents the grand mean across the three levels of change in L1. **p<.01. ***p<.001.
In addition to the effects of conceptualizing difficulty on fluency, the models in Table 6 show one main effect of language: lengthenings occurred significantly more often in L2 than in L1. Filled pauses were also more frequent in L2 than in L1, but with only marginal significance (p=.052). For lengthenings, in addition, there was a significant interaction between the change condition and language: the effect of macroplanning difficulty on lengthenings was smaller in L2 than in L1.
Speaking time measures
As in Experiment 1, we compared the speaking time measures across the three levels of macroplanning difficulty and the two language conditions, again restricting the analysis to trials without disfluencies (except for between-utterance silent pausing in the time from fixation to color name measure). As before, this second measure was only calculated for the subset of trials in which the participants’ gaze tracked the object they were speaking about. Table 7 displays a summary of these variables per condition and language.
Changing Paths: Speaking time measures calculated for fluent trials

Using the same statistical procedures as for Experiment 1, we used linear mixed-effects models to determine how well the timing variables could be explained by the level of macroplanning difficulty and the language condition. The results of the models are shown in Table 8. For mean speech duration, there was a main effect of conceptual difficulty: speech was significantly slower in the change conditions, taken together, than in the no-change condition. It was not, however, slower in the difficult change condition relative to the easy change condition. There was a main effect of language on speaking time: speech was significantly slower in L2 than in L1. There was no interaction effect between conceptual difficulty and language, however.
Changing Paths: Linear mixed-effects models for predicting speaking time measures

Note: Intercept represents the grand mean across the three levels of change in L1. *p<.05. **p<.01. ***p<.001.
If we focus on the speaking part that leads up to the choice, that is, the time from fixation to color name, then there are more main effects of conceptualizing: speech is slower in the change conditions relative to the no-change condition, and it is slower in the difficult change condition relative to the easy change condition. There is also a significant interaction between conceptualizing difficulty and language: the increase in speaking time between the easy and difficult change conditions is greater in L2. In other words, the effect of conceptualizing difficulty on speech rate for this measure is larger in L2 than in L1.
Discussion
The Changing Paths experiment demonstrated that when conceptualizing was made more difficult, there was an increase in four types of disfluencies: silent pauses, filled pauses, lengthenings, and repairs. The first three of these disfluency types increased whenever the network changed, but the magnitude of the increase did not differ depending on whether the new path was easy or difficult to find. The same pattern was present in the two measures of speaking time, which increased to the same extent for the easy and difficult network changes. Thus, it appears that having to drop an existing speech plan and generate a new one on the fly has a greater impact on fluency than the number of options there are when coming up with that new speech plan, at least in such a controlled context as this experiment.
With respect to language, this experiment showed two interaction effects that went in opposite directions. First, the increase in lengthenings due to macroplanning difficulty was smaller in L2 than in L1. This is because the occurrence of lengthenings was already considerably higher in L2 than in L1 in the no-change baseline condition (10.4% vs. 2.5%). The second interaction effect was found in the measure of speaking time during conceptualizing, that is, from fixation to color name. For this measure, while the difficult change condition slowed down speaking time in both languages, it did so more in L2 than in L1.
General Discussion
The present study aimed to isolate the conceptualizing stage of speech production and determine the influence of macroplanning difficulty on fluency in L1 and L2. By holding the speech output constant and varying the difficulty of conceptualizing across conditions, the Appearing Paths and Changing Paths experiments were able to demonstrate which aspects of fluency are specifically affected by conceptualizing difficulty in both languages. To do this, the macroplanning aspect of conceptualizing was manipulated in two separate network description tasks by increasing the number of paths to choose from (Appearing Paths) and by making speakers have to recalculate the correct path and regenerate their speech plans in response to shifting network configurations (Changing Paths).
The first major finding was that higher conceptualizing demands increased the presence of silent pauses, filled pauses, lengthenings, and repairs. Moreover, conceptual difficulty made speech slower even in the absence of discrete disfluencies that interrupt the speech flow, as reflected in the speaking time measures. Though we did not make a direct statistical comparison between the effects found in the Appearing Paths and Changing Paths experiments, as their different numbers of conditions were not collapsible, we observed more effects of conceptual difficulty in the latter experiment. Therefore, task difficulty may be an important factor in determining when conceptualizing-related disfluencies will arise. In Changing Paths, participants had to respond to a change at an unpredictable moment along their path description and then replan their whole utterance, which may have been more challenging and disruptive than planning to speak at predictable moments along each step of Appearing Paths networks. Moreover, to replan their speech in Changing Paths, participants had to look ahead multiple steps in the network, which likely made the task of choosing even more cognitively demanding. Thus, the difficult change condition of Changing Paths may have led to more disfluencies because replanning speech in response to a difficult changing network effectively increased the cognitive load of conceptualizing, whereas the difference in difficulty between the other experimental conditions was too subtle to have a significant effect on the conceptualizer. Future research could investigate more systematically what task-related variables affect the difficulty of conceptualizing for speech and resultant disfluencies.
As it stands, our general pattern of results suggests that the conceptualizer may be more burdened by having to regenerate a speech plan than by a small linear increase in the number of options to choose from. This contrasts with the findings of Christenfeld (Reference Christenfeld1994), who showed that people made significantly more filled pauses when describing paths through mazes with more alternative paths. It could be that the addition of new paths in our experiment simply did not increase the effort required to make a choice as much as the additional maze options did in Christenfeld’s task, given that his maze stimuli were more visually complex. His maze-solving task may have also increased working memory demands more than the network description task of our first experiment, and this heavier cognitive load would have been more disruptive to speech production. It should be noted that in everyday communication, speakers typically have to choose between far more than the two to four options afforded by our network description tasks, so it is quite plausible that macroplanning difficulty linked to contemplating more options causes disfluencies more than our experiments could show.
The second research question concerned the effects of conceptualizing difficulty on fluency in both a first and a second language. For most of the disfluency measures across the two experiments, we found that the effect of conceptualizing difficulty was the same in L1 and L2, supporting De Bot’s (Reference De Bot1992) proposal that the macroplanning stage of speech production is language general rather than language specific. This finding is consistent with recent research (e.g., Ito, Corley, & Pickering, Reference Ito, Corley and Pickering2017) in which an increased cognitive load slowed down predictive language processing to the same extent in L1 and L2. However, it is worth remembering that in the present study, our participants all had a high L2 proficiency level, and their L2 English is very typologically similar to their L1 Dutch. Moreover, the linguistic output required by our tasks was not syntactically complex, nor did it involve low-frequency lexical items. Thus, the general absence of L1-L2 differences observed could have arisen in part from the fact that in our study, using an L2 did not increase the processing demands while speaking substantially enough.
Nevertheless, our study did reveal a significant interaction between language and conceptualizing difficulty in one of the speaking-time measures, suggesting that conceptual difficulty actually posed an additional burden in L2, where formulating and articulating are more cognitively demanding. Recall that this measure was the time it took from the moment speakers fixated the target object, when conceptual planning was beginning, up until the moment they began to articulate the color of the path to that object, at which point the decision between paths was made and thus the conceptualizing for the whole utterance must have been finished. This measure was perhaps most sensitive to our manipulation because it was the most time-locked to the conceptualizing process, incorporating not only the duration of the speech itself but also the time pausing between the fixation moment and the start of the utterance. Therefore, it reflects how the whole speech production system slows down while conceptualizing for an utterance is still ongoing. In other words, whether due to longer pausing or slower articulation rate, the same speech output took more time to produce.
The interaction effect we found suggests that the conceptualizing process draws from the same limited pool of cognitive resources as later stages of speech production, as proposed by Levelt (Reference Levelt1989) and elaborated by Roberts and Kirsner (Reference Roberts and Kirsner2000). For L2 speech production, which already involves more effortful, conscious, and serial processing (Kormos, Reference Kormos2006), this implies that even language-general conceptual planning can have language-specific effects on fluency. When formulating and articulating demands are elevated, as when speaking a nonnative language, fewer cognitive resources are left over to handle conceptualizing. This means that in an L2 speaking context, even the process of coming up with what to say can take more time, and speaking while simultaneously conceptualizing will be slower. When interpreted in terms of bidirectional connectionist speech production models (e.g., Dell et al., Reference Dell, Schwartz, Martin, Saffran and Gagnon1997; Nozari, Dell, & Schwartz, Reference Nozari, Dell and Schwartz2011), our observed language-conceptualizing interaction effect could alternatively be explained by the fact that speaking in an L2 increases the chance that incorrect phoneme- or word-level nodes will be activated. When this happens, unhelpful feedback can spread up to the higher level semantic nodes, leading to increased competition at the conceptual level that will take longer to resolve, especially when semantic node selection is already challenging. Both the modular stages framework and the connectionist model can thus explain how L2-related difficulties at lower levels of the speech production process can interfere with higher level conceptual processing, leading to disproportionately more disfluencies when the message for speech is conceptually complex.
Our findings lead to some practical implications for the use of fluency measures in language proficiency tests. There is already much evidence that when L2 learners perform more cognitively demanding speaking tasks, their fluency suffers (e.g., Ellis, Reference Ellis2009; Levkina & Gilabert, Reference Levkina and Gilabert2012; Robinson, Reference Robinson2001; Skehan & Foster, Reference Skehan and Foster1997). Some of this decrease in fluency would be expected to occur even in the L1, but our second experiment supports the theory that some conceptualizing-related disfluency may actually be L2 specific. As fluency is recognized as one of the central components of L2 proficiency (Housen, Kuiken, & Vedder, Reference Housen, Kuiken and Vedder2012), language testers should take into account the cognitive load involved in tasks with high conceptual difficulty. If they are mainly interested in testing the automaticity of linguistic formulating and articulating processes, they may wish to limit the conceptual demands of a task to reduce conceptualizing-related disfluencies. Moreover, they should be aware that the same increase in macroplanning demands may cause more slowdown of speech in L2 than it would in a native language, where the later stages of speech production are more automatized. If tasks with higher macroplanning demands reduce the fluency of L2 speech disproportionately, then it is important to recognize that some observed L2 disfluencies may reflect processing limitations of the whole speech production system rather than deficits in L2-specific knowledge and skills.
ACKNOWLEDGMENTS
The authors wish to thank Pearson Education and Utrecht University for (partly) funding this research; Theo Veenker for his invaluable help in making our wild ideas for the experiment become real; all students for their participation, especially those during piloting for their patience; and finally, the reviewers for their helpful comments.


 Open access