

Introduction
In order to make optimum use of the wealth of data from remote observations in studies of surface energy balance and climate it is necessary to have information on the spectral distribution of solar radiation reaching the Earth’s surface and on the amount of this radiation which is absorbed by the surface. In the Arctic and Antarctic, the use of remote sensing is important particularly where a large network of manned stations is not practicable and wide area coverage can be provided on a regular basis only by satellite imagery. Whilst satellite photographs provide a high-resolution map of the relative brightnesses of surface and cloud features at a few wavelengths, the interpretation of these images in terms of short-wave energy totals at the ground requires a knowledge of the wavelength dependence of the incident radiation and of the optical properties of the surface. Since 50 to 60% of the solar energy reaching the Earth’s surface on a clear day lies in the wavelength range 700 to 2500 nm, the infrared contribution to the energy balance is very important.
A major problem in the polar regions during the summer is the presence of a persistent cloud cover which obscures the surface from remote observation. Clouds also modify the spectral distribution of sunlight reaching the ground. Thus, using visible and/or near-infrared satellite data under these conditions to determine the short-wave energy balance requires a knowledge of how much radiation penetrates the different types of clouds. The transmission properties of Arctic stratus have been studied using wide-band radiometers (Reference WeaverWeaver, 1970; Reference HermanHerman, 1977), but detailed spectral data are not available.
For both sea-ice and snow the optical properties show considerable variation in response to changes in environmental conditions (Reference Grenfell and MaykutGrenfell and Maykut, 1977; Reference O′Brien and MunisO′Brien and Munis, 1975). At present some information is available at infrared wavelengths on the optical properties of snow, but almost none is available for sea ice. For fresh and aged snow and one case of sea ice, Reference Kuhn and SiogasKuhn and Siogas (1978) report albedos from 400 to 1500 nm; and one albedo curve for snow is given by Reference DirmhirnDirmhirn (1961) from 400 nm to about 1700 nm. These field results are consistent with reflectances measured by O′Brien and Munis, but they include only a few surface types. In addition, the wavelength ranges covered by these observations end where the albedos decrease sharply and hence do not include the region where the snow and presumably sea ice absorbs most strongly.
In order to investigate these problems, a scanning photometer has been constructed which would operate in an Arctic environment. It can be transported and set up easily to facilitate the measurement of the incident and reflected spectral irradiance for many different surface types and cloud conditions.
Description
The instrument consists of an aluminum cylinder 20 cm in diameter and 20 cm in height which contains the optical and electronic systems, a remote control paddle (15 × 15 ×20 cm3) with two built-in digital voltmeters, and a mounting tripod. A schematic diagram is shown in Figure 1. The instrument stands about 0.8 m off the ground on its tripod, this was found to be high enough for any shadowing effects to be small. Power is supplied by a battery pack mounted on the bottom of the cylinder which contains 18 D-size sealed rechargeable lead-acid batteries. At an ambient temperature of −15°C the instrument runs for 5 h on a single charge. The mass of the entire instrument including the tripod is less than 16 kg.
Schematic diagram of the infrared scanning photometer. The insert at the upper right shows the instrument mounted on its tripod positioned to measure downwelling irradiance. The arrows indicate the rotation used to re-orient the instrument to observe upwelling irradiance (A: circular variable filter; B: interference filter; C: chopper; D: cosine collector; E: detector amplifier; F: stepping motors; G: driver electronics for F; H: collimator lens; J: field lens and detector housing ; K: control paddle; L: precision potentiometer ; M: battery pack).

Spectral resolution is provided by a circular variable filter (CVF) obtained from OCLI, Inc. together with twelve single-wavelength interference filters. The CVF consists of two halves bonded together. One half scans visible wavelengths and the other half covers the near infrared from 700 to 1375 nm. The wavelength range is extended to 2450 nm by the single-wavelength filters. All the filters are mounted on an aluminum wheel (Fig. 1) with the CVF in the center and the individual filters around the outside. To ensure accurate wavelength selection, a stepping motor is used to rotate the filter wheel through the optical path of the detectors. The detectors include a low-leakage blue-enhanced silicon photodiode (Vactec VTB 5041) for visible and near-infrared wavelengths and two lead sulfide cells (Infrared Industries) for the infrared. The detectors record simultaneously, and continuous spectra or discrete values can be selected at the user′s option.
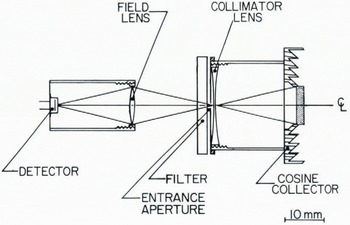
The optical system, shown in Figure 2, is used for all three detectors. It employs a “cosine collector” adapted to this instrument from a design provided by Dr R. C. Smith which records irradiance directly. The inside surface of the diffuser turret of the cosine collector is at the virtual focus of a double convex lens which collimates the light passing through the circular entrance aperture and the CVF. Finally, the entrance aperture is imaged onto the detector by a field lens to maximize the effective aperture. The light falling on the lead sulfide cells is chopped at 150 Hz to eliminate detector drift.
Schematic diagram of the optical system. Identical systems are used for each of the three detectors.
Light leakage
Tests carried out using a high-intensity lamp showed that no unwanted light penetrated the outer casing. Although all inside surfaces of the instrument were painted flat black or black anodized, a small amount of internal scattering from the PbS2 field lens was scattered into the PbS1 optical train and was detectable at the maximum gain setting. The scattered light was rendered undetectable by the insertion of light baffles between the two optical paths. The CVF transmission outside the band being recorded is rated at less than 0.1% and represents a lower limit to light leakage in the system.
Electronics
The photodiode is operated as a current source at o V bias to optimize linearity at low light levels. Feedback resistors in the amplifier circuit, switched remotely at the paddle by activating high-impedance reed relays, provide gain settings from 10−4 V/nA to 10 V/nA in decade steps. The upper limit in sensitivity is set by requiring a circuit response time of O.I.S.
Each lead sulfide detector operates as a photoresistor at a bias of 22.4 V in a fixed-gain preamplifier circuit. The chopped signal passes through a variable gain a.c. amplifier, a synchronous demodulator, and a low-pass filter. Johnson noise in the electronics, mainly from the PbS cell and a 1 MΩ wire-wound resistor, determines the upper limit to the detectivity of the system.
Calibration
Wavelength calibration was carried out using a set of interference filters with known transmission wavelengths together with the manufacturer′s specifications for the CVF (Fig. 3). Calibrations were carried out at different ambient temperatures from −15° C to 23° C and were found to be independent of temperature to within 1%. A temperature drift was present in the LED display voltmeters of the paddle, however, which is taken into account in the reduction of field data. The output voltage of the potentiometer is linear with wavelength, but the slope is different for the two sides of the CVF. The break in slope at 400 nm is a property of the CVF.
Wavelength calibration curves for the two channels (Si photodiode and PbS cell) using the circular variable filter.

Spectral resolving power shown in Figure 4 is defined as the wavelength divided by the full bandwidth at half maximum transmission (Δλ½). The entrance aperture has been chosen to be small enough (1.0 mm) that the resolving power is determined by the natural bandwidth of the filter itself. The resolving power ranges from a minimum of 23 at 380 nm to a maximum of 46 at 1000 nm dropping slightly at longer wavelengths. Also shown in Figure 4 is the resolving power of the fixed-wavelength filters. Although their spectral resolution is from four to five times lower above 1400 nm, they provide overlapping coverage out to 2500 nm. This is indicated by the horizontal bars which give Δλ½ for each filter.
Spectral resolving power (λ/Δλ½) for the visible and near-infrared halves of the CVF and for the fixed wavelength filters. The horizontal bars give Δλ½ for each of the fixed-wavelength filters.

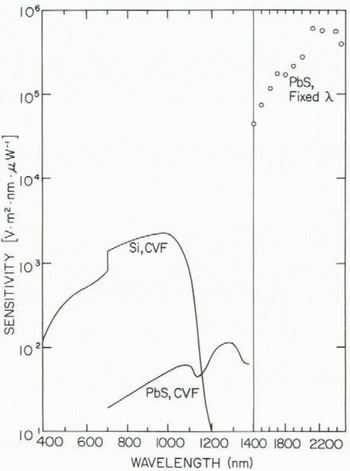
Absolute intensity calibration was established by recording the output of a quartz halogen lamp calibrated by Eppley Laboratories (EPI–1656) and traceable to calibrations by the National Bureau of Standards. Plotted in Figure 5 are the spectral sensitivity curves at maximum gain for each of the detectors over the wavelengths of practical application. The sensitivity of the PbS detector at visible wavelengths was unexpectedly high and provided redundancy at short wavelengths. The dip at 1150 nm and the decrease between 1300 and 1375 nm are due to absorption bands of “Plexiglas”. The sensitivity of the PbS detectors continues to increase to a maximum near 2200 nm but the precise wavelength is masked as a result of differences in the bandwidths of the interference filters.
Absolute sensitivity at maximum gain of each optical channel versus wavelength.
Field Test
The photometer was field tested during the spring and early summer at Point Barrow. Each day it was carried from shore about 2 km out onto the ice to the observation site. Measurements were made by stepping through the spectrum and recording data by hand at discrete wavelengths. Representative spectral albedos of snow and sea ice with the snow removed are shown in Figure 6. The measurements were made in mid-May at an air temperature of −11° C. The snow results are compared with O’Brien and Munis’s curve for cold, sifted, “sugary” snow with a density of 0.357 Mg/m3 The two cases show the same spectral features, but the albedos beyond 1200 nm are somewhat higher than the reflectances. Since the sample observed by O′Brien and Munis was sifted so that the natural snow particle size distribution was modified, it is not unreasonable to expect differences between the optical properties of the two snow types. At longer wavelengths, which may approach the size of the smallest snow particles, Mie scattering becomes important and scattering depends on the size distribution. The curve for cold first-year ice is somewhat higher than the results of Kuhn and Siogas (1978). This is probably well within the limits of variability for spring sea ice; however, the peak they found at 1400 nm was not observed for our case. The reason is not clear at present.
Measured spectral albedos of dry packed snow (density = 0.33 Mg/m3, grain diameter = 0.2−0.3 mm Tair = −11°C, α = 0.81) and first-year ice with the overlying snow removed (Tair = −5.5°C, α = 0.52), where α is the albedo for integrated solar radiation. The solid curve shows the spectral reflectivity of cold sifted snow (ρ = 0.36 Mg/m3) measured by O′Brien and Munis.

Conclusions
The photometer is a good wide-band intermediate-resolution instrument which has performed very well in initial testing. Although it was specifically designed for polar applications, it could also be used at lower latitudes for a variety of studies, for example, infrared albedos of different types of ground cover or monitoring Co2 absorption by the atmosphere. Commercial production of this instrument is not planned at present; however, interested parties should contact the author.
Acknowledgements
My special thanks are due to Mr Peter Kauffman who designed and constructed the electronic circuitry and to Mr Donald Perovich who assisted with the field program. I am indebted to Dr Raymond C. Smith for supplying me with plans for the cosine collectors. I wish to thank the Naval Arctic Research Laboratory for the use of its facilities at Point Barrow, This work was made possible by continued support from the U.S. Office of Naval Research, Arctic Program under Contract N00014–76–C–0234.


