


Impending global crises and US demographic changes require the United States to develop its intellectual capital fully, especially in science and engineering, in order to maintain its global leadership and economic strength. As US population demographic changes continue and make their way through our educational system, they will directly affect thinking and practices regarding science and engineering education in the United States, the future of science and engineering professions, and the need for diversity in the science and engineering workforce. It is essential to measure and understand the demographics of science and engineering students who will be available to the workforce in the near future, and their same-gender and same-race role models and mentors.
Of five traditional race categories in the United States (Caucasian, Black, Hispanic, Asian, and Native American), Native Americans are lowest in population. Native Americans are the indigenous people of the United States, with pure-blood Native Americans being about 1.2% of the total population in the 2012 US Census. Although they are usually the most underrepresented race, their representation is rarely determined or reported by surveys collecting data samples by race/ethnicity due to their small numbers. These numbers also do not survive the statistical treatment (i.e., error analysis), which must be applied to data from samples. This means that the degree of underrepresentation of Native Americans is largely unknown. For this reason, we focus on Native Americans in this article.
Data used herein on Native Americans are from the Nelson Diversity Surveys (NDSs),1–Reference Britt6 which quantify the representation of women and minorities among tenured and tenure-track faculty in 15 STEM disciplines at research universities. The NDSs consist of four data sets compiled during fiscal years (FYs) 2002, 2005, 2007, and 2012. Many of the disciplines surveyed are closely related to materials science and engineering (MS&E): chemistry, mathematics, computer science, astronomy, physics, chemical engineering, civil engineering, electrical engineering, mechanical engineering, economics, sociology, political science, biological sciences, psychology, and earth sciences. However, comparing how chemistry and engineering disciplines are faring versus other disciplines, such as social sciences and life sciences, also provides an approximation to how MS&E is faring, compared to those disciplines. The data pertain to whole populations that do not require statistics to be applied for analysis, such as data that result from collecting samples. NDS data are disaggregated by race, rank, and gender, making them powerful and accurate for even the smallest underrepresented groups.
Methodology
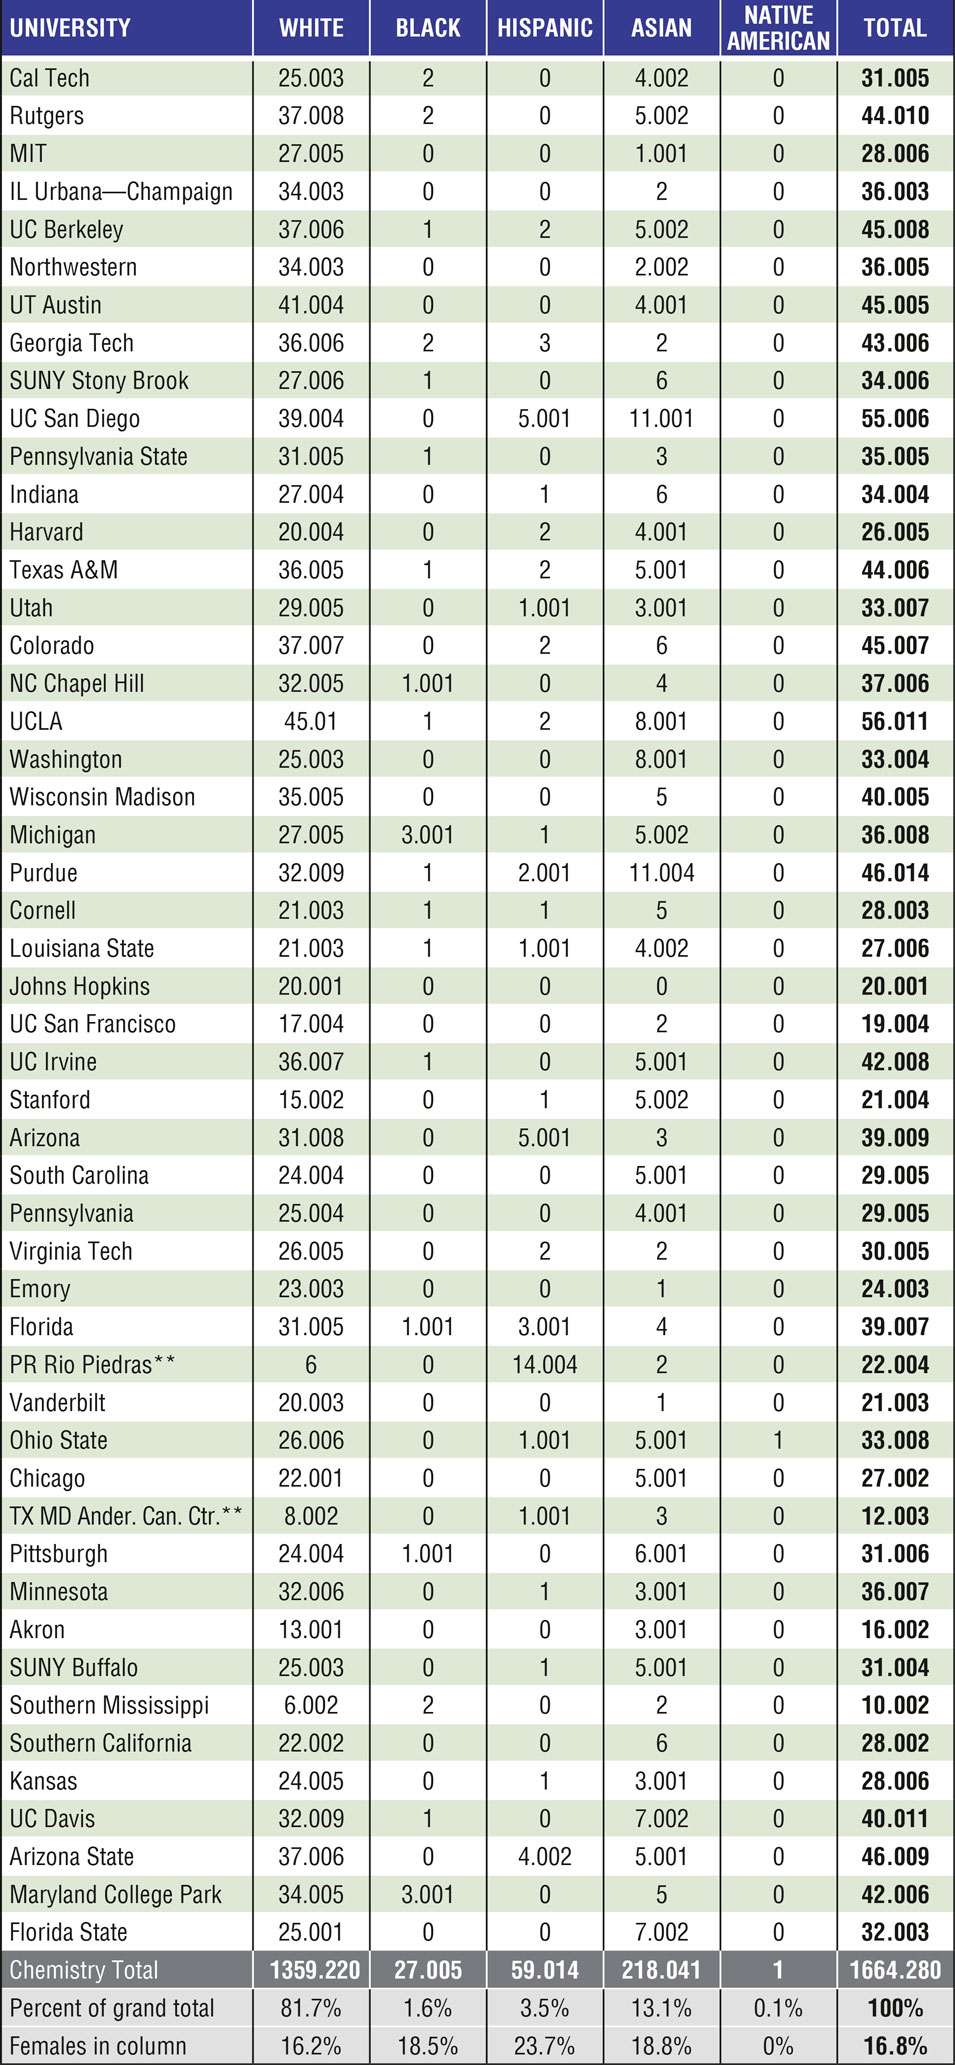
In order to investigate the race/ethnicity, rank, and gender of faculty, we surveyed the top research departments of 15 science and engineering disciplines. Our data were gathered by surveying the top 100 departments in each of the disciplines, as ranked by the National Science Foundation (NSF) according to research funds expended for the most recent year preceding each NDS. For each of the top 100 departments in research expenditures, department chairs were asked to report the race/ethnicity (Asian, Black, White, Hispanic, and Native American), rank (assistant, associate, and professor), and gender of tenured and tenure-track faculty in his/her department for the fiscal year of the survey. In a limited number of instances, data were unavailable from department chairs and were collected instead from other sources, such as department websites and published directories. Data were entered into tables, such as Table I, for each discipline, which are provided in the Appendices of each final report.Reference Nelson3–Reference Britt6 Although data for the top 100 departments are available in each of the 15 disciplines,Reference Nelson3–Reference Britt6 only data for the top 50 departments in each discipline are used. More than 90% of the departments in our sample are located in universities classified as either Doctoral/Research Universities–Extensive category or Doctoral/Research Universities–Intensive category of the Carnegie Classification of Institutions of Higher Education.
Tenured/tenure-track faculty at the top 50 chemistry departments in the United States by race, ethnicity, rank, and gender (fiscal year 2012).*
To view additional information, see https://doi.org/10.1557/mrs.2018.108.
* By chemical research expenditures fiscal year 2009;Reference Britt6 numbers after decimals designate females.
** Some data are from sources other than department chairs.Reference Nelson7
If a university had both a mathematics department and a department of statistics or applied mathematics, then we included both departments. These additional departments were sufficiently few that we were able to gather data for the full population in mathematics. In biological sciences and in earth sciences, we surveyed all pertinent departments of each university (sometimes more than 15 departments per university.
NSF-grouped engineering disciplines and social sciences disciplines, and the research expenditures of the group were used to rank the top 100 universities. This caused an occasional subdisciplinary department to be included among the top 100, even though it had no research expenditures reported (or might not exist). We omitted those departments. Therefore, although it was still possible to sort and rank research funding expenditures by subdiscipline, some subdisciplines had fewer than 100 departments in some surveys.
NDSs were administered four times from 2002 to 2012, so their data can be used to reveal changes over time. These changes are shown in bar graphs and discussed later in the text.
Results
The category Native Americans includes Alaska Natives, Native Hawaiians, and Pacific Islanders, in addition to those in the contiguous 48 United States. Native Americans generally have the lowest representation compared to all other races throughout all the NDSs. Table I for chemistry in FY 2012 is an example.
Table II summarizes the representation of Native American students and faculty in the top 50 departments in the 15 disciplines in the FY 2012 survey. Among students, Native American representation rarely matched the overall US population (about 1.2%). In all disci plines, Native Americans follow the general trend observed for Blacks and Hispanics, in which representation among BS degree recipients is greater than or equal to their representation among PhD degree recipients. Comparing the past two decades of PhD degree attainment reveals that their representation did not decrease in any discipline.
Native Americans among professors by rank and discipline at top 50 departments.Reference Nelson7
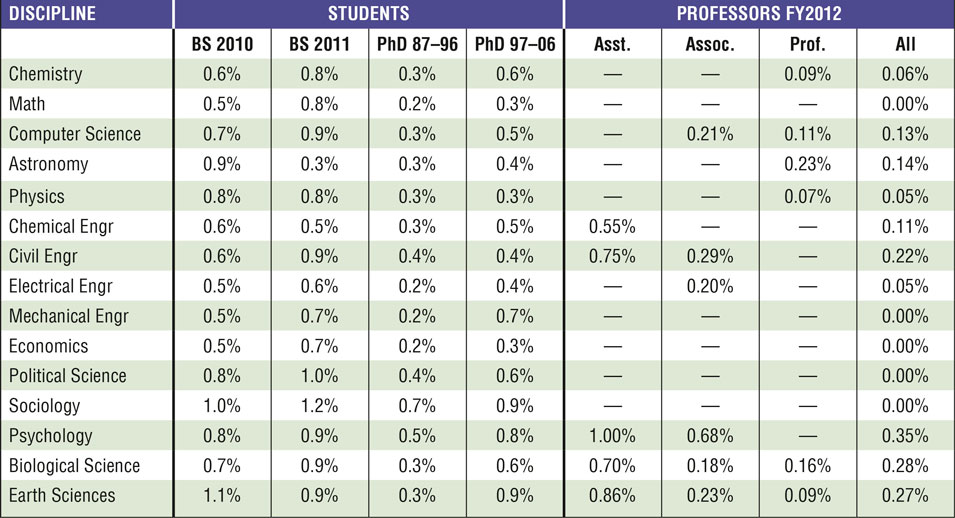
Table II also shows that not only are Native Americans underrepresented among faculty in all 15 disciplines, they are not represented at all in any rank in the top 50 departments of each of five disciplines—mathematics, mechanical engineering, economics, political science, and sociology. Despite the percentage of US population that is Native American being 1.2%, no rank of professor surpasses a 1.0% representation. In the top 50 departments, psychology assistant professors have the highest Native American representation at 1.0%, but there are zero Native American full professors in the field. The only Native American assistant professors in top 50 physical sciences and engineering disciplines are in chemical engineering and civil engineering, indicating at least a seven-year hiring lapse in the others. Only six fields—chemistry, computer science, astronomy, physics, biological sciences, and earth sciences—have any Native American full professors, with the highest percentage being a low 0.23% in astronomy.
The fact that there are so many departments with no Native American professors whatsoever poses a large problem. Since there are no professors in some fields in any of the top 50 research universities to serve as role models to Native American students, those students will not receive needed support, and academia may seem unwelcoming to them. These numbers are low enough that even if a Native American professor in a student’s field exists, it is very likely that the professor works at a different university. This discouragement may be reflected in the percentages of Native American undergraduates, which range from 0.3% in astronomy to 1.2% in sociology.
Changes in representation over time
Figure 1 shows the change over time of Native American professors of all ranks. All fields have had some degree of representation of Native American professors in general between 2002 and 2012. However, that representation in economics, sociology, political science, mathematics, and mechanical engineering has since reduced to zero. In fact, there is a general downward trend in all fields except biological sciences, civil engineering, computer science, and earth sciences. Only in civil engineering is the improvement somewhat substantial. This indicates that, in general, Native Americans are not being retained once they enter academia.
Representation of Native American professors in the “top 50” departments of each STEM discipline, by survey year. Bar graphs are ordered in representation across the surveys, increasing from left to right. The number at the top of each yellow bar corresponds to the number of Native American professors of all ranks in the 2012 survey.Reference Nelson7
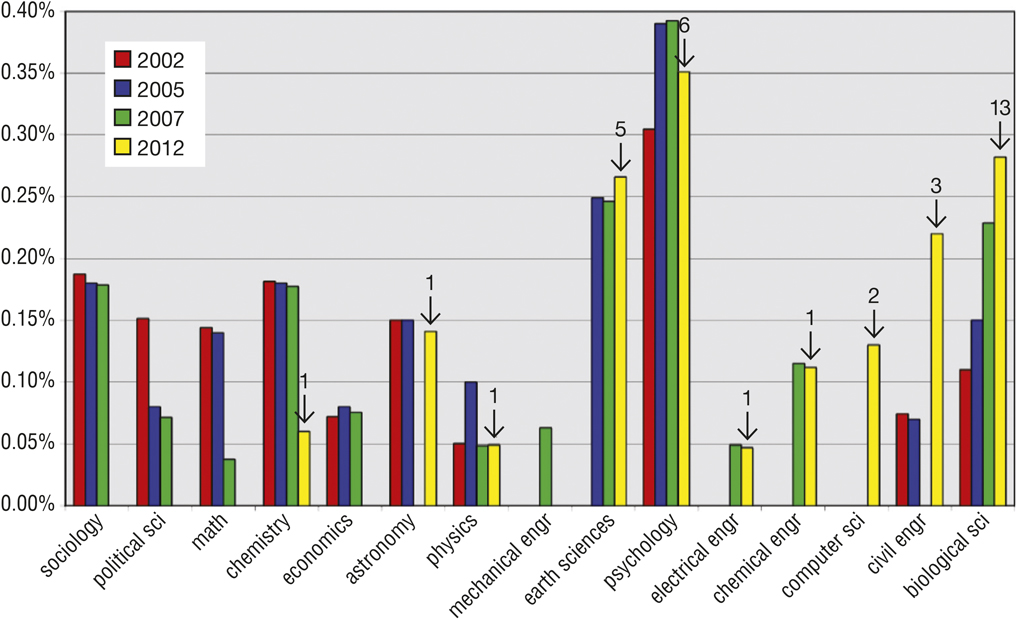
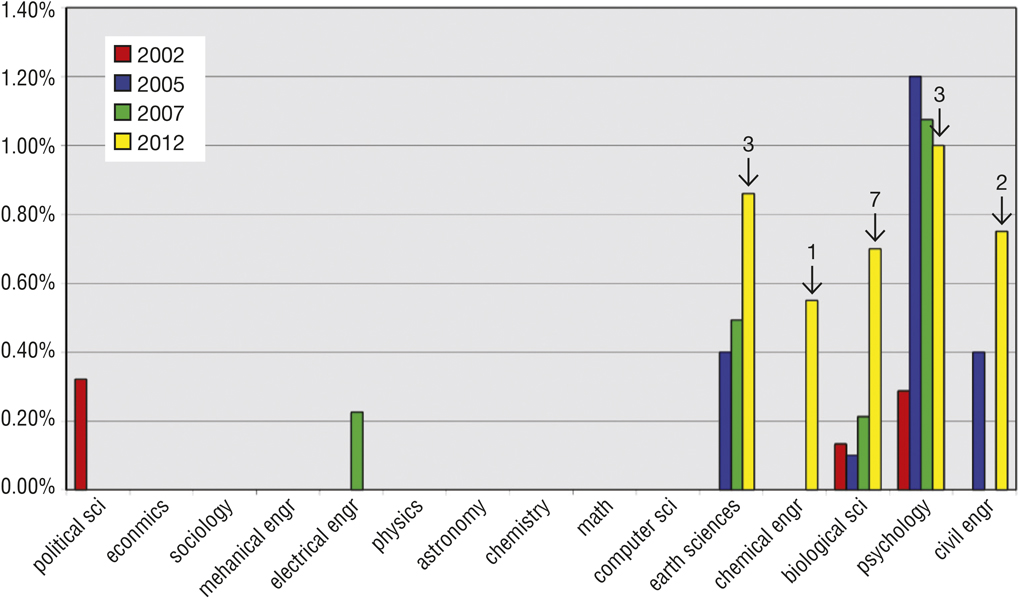
Figure 2 reveals the change over time of Native American assistant professors. Of the 15 disciplines examined, only political science, earth sciences, psychology, electrical engineering, chemical engineering, civil engineering, and biological sciences had any Native American assistant professors between 2002 and 2012. Of those, representation in political science and electrical engineering has since dropped to zero. From those remaining, earth sciences and biological science have increased significantly, and civil and chemical engineering have increased modestly. Despite having increased since 2002, since 2005, the percentage of Native American assistant professors in psychology has declined. Overall, there seems to be very little advancement in the hiring of Native American assistant professors.
Representation of Native American assistant professors in the “top 50” departments of each STEM discipline, by survey year. Bar graphs are ordered in representation across the surveys, increasing from left to right. The number at the top of each yellow bar corresponds to the number of Native American assistant professors in the 2012 survey.Reference Nelson7
Summary
The data presented herein reveal that Native Americans among science and engineering faculty in the United States continue to be underrepresented despite increased general growth in their representation among BS and PhD degree recipients. Compared to their share of the US population, Native Americans are underrepresented at almost every point in the academic pipeline. In most disciplines, there is a decline in representation from student to professor. However, in some disciplines, the representation of Native Americans is zero.
Data for Native American faculty reveal that their representation in all disciplines ranges from miniscule to zero. In no discipline are there sufficient numbers to provide mentors and role models to junior faculty, much less to students. The analysis of data changes over time and reveals sporadic representation, where Native American faculty appear for a few years and then disappear. This suggests that Native Americans are not staying in STEM faculty positions for traditional careers.
Because the disciplines surveyed, especially those in chemistry, physics, and engineering, are so closely related to MS&E, the mentioned conclusions should also be valid for MS&E. This pertains to both the headcount data, which assess the situation in different years, and the bar graph data, which provide an indication of how the representation of Native Americans is changing over time.
These data provide a measure of US (lack of) preparedness for some workforce-related issues. For example, the first is to meet the economic and development challenges described previously. The second is to groom a balanced representation of our US citizens not only to participate in, but also to lead, impending changes in science and engineering.
Acknowledgments
The research and its dissemination were funded, in part, by grants from the Alfred P. Sloan Foundation, Ford Foundation, NSF ADVANCE Leadership Award, Diversity in Science Association, and the National Institutes of Health. Approval of the Internal Review Board of the University of Oklahoma was obtained before work was initiated for each survey.



