


INTRODUCTION
Radiocarbon (14C) dating of archaeological objects and organic remains obtained from an archaeological site is the most commonly dating method in archaeology, however this still causes concern due to its destructive approach. To resolve this, further development is needed to improve the method of 14C dating by delimiting the sample size, joined to the removal of contamination, which can prohibit accurate dating. A typical target size of carbon needed for 14C dating with accelerator mass spectrometry (AMS) is 1 mg. However, this is not the size of the whole sample itself—since the sample is not 100% carbon—depending on the material and its quality, usually more of the sample material is needed in order to ensure the necessary target size. The sample sizes of parchment mentioned in 14C dating research vary, and are often not mentioned at all. For parchment, we estimated that such a 1 mg AMS target size corresponds typically to ~16 mm2 area of material, approximately 4 × 4 mm. Medieval manuscripts hold indispensable value, and any sampling should be minimally destructive, as with any cultural historical material. Therefore, 14C dating results from sample sizes with less than 1 mg of carbon should be pursued.
Made from the skin of animals, usually cattle-, goat-, or sheepskin, parchment was used in Europe for making books and documents from as early as the fifth century BC up to the early-modern era, used as the main writing medium for some 1000 years from fourth century AD onwards. Although manuscripts can be dated and localized paleographically with varying accuracy, 14C dating can corroborate this information as an absolute dating method. This is the case with the Fragmenta membranea collection at the National Library of Finland, a manuscript fragment collection of little over 9300 leaves containing material from the early eleventh century up to the mid-sixteenth century. Since the collection items are fragments of books from a geographical region (Sweden and Finland) which is paleographically poorly charted, manuscript scholars have struggled to date much of this material. Typically, the fragments have been dated within a century, with dates of 150 years and even two centuries appear commonly in the collection catalogues. Thus, although 14C dating precision also varies due to changes in the atmospheric 14C content through ages, it should provide comparable natural scientific estimates for the fragments. The problem with 14C dating such archival material lies of course in the destructive nature of the method, and minimizing the sample size is the key issue in applying it to this collection.
The challenge in 14C dating any smaller sample size than 1 mg of carbon is that the amount of contamination in the sample becomes more relevant. Therefore, the procedure must be monitored throughout and all carbon contamination, modern and old, has to be avoided to obtain as accurate results as possible. The key factor to removing contamination is the chemical pretreatment process, where the samples undergo before dating to remove all external or exogenous contaminating material, without destroying the original sample material excessively. The chemical procedure in this paper was designed based on the previous research on 14C dating of parchment and was moved to a clean room environment. The clean room was included to exclude potential air-borne contaminants on the small samples deriving from dust particles during the handling of the samples. After the pretreatment process when the sample is combusted, a typical additional concern is the possibility of leaks during the sample CO2 processing, as it can expose the sample to modern atmospheric CO2.
However, one of the most significant potential contamination in parchment is derived from its manufacturing process. Animal skins are treated with lime as a part of the dehairing process, and the parchment smoothed with pumice when dry. Lime introduces calcium carbonate, CaCO3, a fossil contamination to the material. To remove this, an acid-based solvent must be applied. Parchment was occasionally reused as palimpsest and in such cases the revitalizing of the medium may have been done with a wash of milk, wine, or other products, but the residual effect of this process is marginal compared to the CaCO3 or heavy conservation with modern materials. Substances derived from conservation treatments are frequent contaminants in 14C samples, and often are imperceptible to the naked eye. Some adhesives used in conservation of parchment are gelatin and parchment (mammalian animal) glue. The difficult to remove castor oil, which has been used to improve the visibility of faded ink, and modern synthetic polymers and acrylic resin solutions, such as versions of Paraloid®, should always be noted for their possible presence in a sample due to their wide appliance in conservation.
In this work, we established a 14C dating procedure for parchment combining clean-room based chemical pretreatment process, elemental analyzer combustion, automatized graphitization and AMS measurement to reduce the AMS target size from a typical 1 mg of carbon. We used modern parchment samples for process development and demonstrated the capability of the method by using known-age medieval parchment manuscripts.
STATE OF THE ART IN PARCHMENT STUDIES
In order to establish a method, which both eliminates modern and ancient carbon contamination and pursues a smaller sample size, it is crucial to study material with a known age. This allows the results to be analyzed and their quality evaluated. Modern parchment is one option for such a study, since it can be easily acquired and information about its precise manufacturing date is available. Modern material also has certain advantages for the development of the method. Because of the difference in the atmospheric 14C content between past and modern era, older material cannot be dated as accurately as younger material from after 1950. This is due to the atomic bomb effect, providing an accurate calibration for 14C dates for samples from the last 6 decades. On the other hand, studying only modern material can give us a distorted view: the material can be in a far better condition that would be expected in handling historical parchments.
A typical process to obtain a 14C date contains several phases: the chemical pretreatment, combustion of the sample, conversion of resulting carbon dioxide to pure carbon (graphitization) and the 14C measurement itself. Therefore, 14C dating results can suffer from various errors and effects deriving from these several sources. The age of the material, errors in the measurements, faults from laboratory procedures, contamination and concentration of 14C are the main causes of error. Also, the error entailed by the unknown age of the material must be considered, as some organic materials have possibly been dead or stored for a considerable time before being used by man in the past. Or, as in the case of manuscripts, reusing the material after decades or even centuries of its original creation—a palimpsest.
The major advantage of AMS is the detection efficiency, which has successfully resulted in moving towards smaller sample sizes, decreasing from grams to milligrams and now to micrograms. However, the smaller the sample, the more influence any remaining contamination will have on the 14C dating. Fiona Brock (Reference Brock, Shortland and Bronk Ramsey2013b) remarks (after Gupta and Polach Reference Gupta and Polach1985) how the amount and age of modern carbon (we assume F14C=1/pMC=1) present in a sample affects the values of a 900-year-old BP sample: 1% of modern carbon contamination would affect the dating to ~890 years BP, while only 5% of the same contaminant would give a dating of ~850 years. If the contaminant is old carbon (we assume F14C=0/pMC=0), 1% would result in an apparent age of ~980 years BP and 5% to ~1320 BP. Errors in the laboratory procedures can be detected for example when doing inter-laboratory measurements from the same sample, and doing these tests should be increased. Currently the challenges are the extent of the dating time frame, as well as the problem of contamination.
There are various sources of contamination to a parchment sample that can derive from multiple sources. This can be direct, such as storage or conservation treatments often applied to cultural heritage objects, or indirect such as the limestone treatment deriving from the manufacturing process. Thus, chemical pretreatment for the samples is crucial. Subsequent sample combustion and graphitization processes may typically induce modern carbon contamination due to involvement of residual atmospheric carbon dioxide. Furthermore, the AMS measurement itself has additional statistical and systematic uncertainties. These all challenge the production of accurate and precise 14C ages while working with minute samples.
Different pretreatment methods for parchment have been tried and compared in some previous studies. The standard acid-base-acid (ABA) or acid-alkaline-acid (AAA) treatment appears to be the most successful in eliminating contamination with minimum sample loss. The base wash or an additional bleach wash has been found effective, but following Brock (Reference Brock2013a) and Santos et al. (Reference Santos, Gómez-Martínez and García-León2010), any alkaline wash should be applied with caution as it can be very destructive, excluding especially fragile sample material. In the 14C dating of fourteen Dead Sea scrolls by Bonani et al. (Reference Bonani, Ivy, Wölfli, Broshi, Carmi and Strugnell1992), parchment samples were treated with ABA. During the study, the impact of the regular treatment was evaluated, with several of the methods found to be destructive, as the material was lost completely for some samples. Notably, the sample loss is a substantial risk when handling parchment.
As there is a possibility that ABA is not sufficient to remove all contamination, for instance the widely applied Paraloid® B-72 used in conservation, which is soluble in acetone, applying a wash with this solvent prior to the ABA is recommended. Bleach may be effective for removing biological contamination but can result in serious loss of the sample material, and in any case the sample undergoes base as a part of the ABA. Hexane, acetone, combinations of methanol and chloroform have been tested, with acetone being the preferred solvent as it evaporates quickly from the sample. Donahue et al. (Reference Donahue, Olin and Harbottle2002) further showed that a prior acetone wash is completely removed through a water rinse, with a 20–30% general loss of the sample overall during the pretreatment not depending on the acetone wash.
In contrast to Donahue et al. (Reference Donahue, Olin and Harbottle2002), Brock (Reference Brock2013a) does not report on the loss of the total mass of the samples but notes only that the samples survived the chemical treatments better than expected. Considering that the treatments used by Brock prior to ABA are more comprehensive than those used by Donahue et al. (2012), some loss of the material can be assumed due to the washes. In the case of small samples, up to 30% loss of total material might still be acceptable, with less being ideal. When dating parchment with heavy lipid contamination, such as castor oil in the Dead Sea Scrolls, Rasmussen et al. (Reference Rasmussen, van der Plicht, Doudna, Nielsen, Højrup, Stenby and Pedersen2009) report a low survival rate of the samples after the chemical pretreatment, which draws attention to challenges of highly contaminated samples.
Studies on 14C dating of parchment rarely mention the size of the parchment samples, so the evaluation of the size of the samples was made based on the carbon content. As parchment is assumed to contain ~90-95% collagen, of which approximately 35% is carbon, the C:N ratio (carbon-to-nitrogen ratio) can be used to represent the state of the collagen preservation in parchment samples in addition to contamination removal. The acceptable C:N ratio for collagen in radiocarbon dating is ~3.3 (Brock Reference Brock2013a, after van Klinken Reference van Klinken1999).
As found by Brock et al. Reference Brock, Wood, Higham, Ditchfield, Bayliss and Bronk Ramsey2012, measuring the %N content of the sample material is the most effective way to select samples and avoid destroying samples that are unsuitable to 14C dating. In the Laboratory of Chronology, %N and %C values are measured with an elemental analyzer, which can measure both values together from the same sample. As the sample is completely destroyed during the measurement, this phase in evaluating whether the sample is suitable for 14C dating or not, is problematic when considering the sample size. If the %N and %C are not measured, there is a real possibility of destroying a sample completely prior to dating, thus destroying a sample in vain that could have provided important information other than just the age of the specimen. Hence, in dating small sample material, whether executing this phase or not prior to chemical pretreatments, must be carefully evaluated, and non-destructive methods for contamination removal (e.g. FTIR as Brock et al. Reference Brock, Dee, Hughes, Snoeck, Staff and Bronk Ramsey2018, and NIR) better explored.
During this study, the C:N ratio was not measured before 14C dating. The sampling of the medieval parchment was then made based on the theoretical assumed value of carbon in parchment: 90% collagen of which 35–37% is carbon, therefore 31.5% of the total mass. Later measuring the carbon-content and comparing it to a modern parchment, the values were very uniform between old and new material, ca. 42–44% in each. This indicates that the collagen quality of parchment preserved in library conditions may not significantly change over time, suggesting that the C:N ratio is not a necessary step in sampling parchment.
METHODS AND MATERIALS
Samples
Three sample materials were used in this work. Modern parchment manufactured from the skin of a calf that died in October 2015 was used for initial tests of the chemical pretreatment process and for the first 14C-AMS analyses. Based on the assumption that the skin of the calf was stored the atmospheric 14C contents for 12 months prior to its death, it was estimated based on Levin et al. (Reference Levin, Kromer and Hammer2013) that the 14C content of parchment should have been ~101.6 pMC. The other samples used were two medieval documents with known original dates of writing of AD 1484 and AD 1506 to study our measurement process further.
Clean Room for Sample Pretreatment
Although the Laboratory of Chronology is using dedicated laboratory spaces and fume hoods for processing the 14C samples, there is a minor risk that modern or fossil (i.e. 14C dead) carbon contamination could be accidentally mixed with the samples through airborne particles, like dust, during sample preparation and particularly prior combustion. As the main aim of this study was to proceed towards small samples and AMS graphite masses significantly smaller than 1 mg, part of the work was to experiment with the chemical pretreatment procedure within a clean room for the first time.
A joint clean room infrastructure of Helsinki Institute of Physics and Department of Physics of the University of Helsinki is located close to the Laboratory of Chronology. This contains both class 1000 (or ISO 6/ISO 14644-1 and ISO 14698 standards) and 100 (or ISO 5) clean rooms. For this experiment, one fume hood from ISO 6 clean room was dedicated to the chemical pretreatment process for the samples. The ISO 6 class corresponds to a maximum of 35200 particles over 0.5 μm in size per m3. This can be compared to typical room air that can have 1000 times more of such particles.
ISO 6 class operations involve using of dedicated hair cover, coverall and boots and careful wiping of all incoming material prior usage. Therefore, all the operations are slightly more time-consuming. Within this work, clean room pretreatments were very successful, without complications. After the chemical pretreatment process all the samples were allowed to dry overnight in a fume hood in the clean room. In the following morning the sample vials were closed and the samples were taken for combustion process.
Chemical Pretreatment Process
For the A to C series the applied chemical pretreatment was uniform:
-
1. Acetone wash in 45°C for 1 hr.
-
2. ABA: HCl (0.5M, 30 min); NaOH (0.1M, 20 min); HCl (0.5M, 1 hr).
-
(Rinsing thoroughly with MilliQTM water between and after each step.)
The series were made with modern (A) and medieval (B, C) parchment with the combustion and graphitization with EA-HASE. Samples from modern parchment were run first in a separate AMS run giving relatively good results reproducing the modern 14C content but suffering technical issues within AMS that lowered the statistical precision. The series B and C of medieval parchments provided results ranging between 276–931 BP, most of the results being too old. This was interpreted as resulting from CaCO3 contamination. Therefore, the acid treatment was changed to double the length of time for the remaining sample series (D, E).
For the final D and E series, the chemical pretreatment method was adjusted accordingly:
-
1. Acetone wash in 45ºC for 1 hr.
-
2. ABA: HCl (0.5M, 60 min); NaOH (0.1M, 30 min); HCl (0.5M, 2 hr).
-
(Rinsing thoroughly with MilliQTM water between and after each step.)
The duration of the NaOH bath was also lengthened by 10 min, as the period of 20 min was found not harmful for the smallest sample. On the contrary, the base made the parchment samples swell, which helped the handling of the small samples. For the collagen to liquefy, the duration of NaOH treatment should be overnight, so consequently in theory there was no chance of losing a sample within 30 min—nonetheless the samples were kept under close surveillance during the entire time.
Sample Combustion and Graphitization
Two different sample treatment methods were used for combusting and converting the combusted CO2 to graphite targets for 14C-AMS measurements. The main features of both the methods are provided below.
The traditional method to combust organic samples follows essentially the method B of ASTM D6866-18 standard (ASTM 2018). In short, pretreated sample is placed inside a pre-cleaned quartz tube sealed from the other end among 3 g of copper oxide grains. This tube is placed inside a larger pre-cleaned quartz tube which is evacuated to <0.1 mbar pressure and torch-sealed. This ampoule is placed in an oven for combustion in 900ºC for at least 4 hr, generally overnight. The formed CO2 sample is cryogenically purified with liquid-N2 and cold (ca. −85°C) ethanol traps. The CO2 sample is subsequently converted to graphite with Zn and Fe catalysts (Slota et al. Reference Slota, Jull, Linick and Toolin1986) and pressed to an AMS target. This method is referred as Closed-Tube-Combustion (CTC) method.
The second method uses Elemental Analyzer (EA) combustion coupled with a LabVIEW controlled CO2 purification and graphitization line. The pretreated sample is placed in a tin cup (Elemental Microanalysis D1001) and combusted in EA (Thermo Scientific Flash 2000 NC). While the temperature of the combustion process (1020ºC) is sufficient enough to oxidize carbon to CO2, the used tin cups react with oxygen in an exothermic process rising the temperature briefly to 1800ºC. The formed CO2 is trapped cryogenically, purified and graphitized within the Helsinki Adaptive Sample PrEparation (HASE) line in the presence of zinc powder and iron catalyst (Palonen et al. Reference Palonen, Pesonen, Herranen, Tikkanen and Oinonen2014). This method is referred as EA-HASE.
Both graphitization lines of CTC and EA-HASE contain four graphitization reactors. As graphitization is a chemical reduction process and thus requires a certain amount (>4 hr) of time, the essential gain is provided within EA-HASE by the combustion speed and purity. The full combustion process takes ca. 3 min instead of >4 hr, reduces the time spent compared to CTC and limits also the potential modern CO2 contamination. Moreover, as the EA-HASE process has been optimized for repeatability, automatic control and small sample masses, we expect this to show up within the obtained results.
14C AMS Measurements
The Laboratory of Chronology of University of Helsinki uses accelerator mass spectrometry (AMS) for 14C measurements (Tikkanen et al. Reference Tikkanen, Palonen, Jungner and Keinonen2004). The Helsinki AMS can measure 14C contents within <0.2% precision after a major upgrade of the AMS control electronics in 2013. The AMS characteristics are controlled in Helsinki by using standard graphite samples, which provide 14C-free reference, to alarm any possible signals for needed maintenance. Corrections for isotopic fractionation are made by using the δ13C value measured by AMS. Therefore, the δ13C values contain potential isotopic fractionation due to graphitization and AMS measurement processes instead of being solely characteristic of samples and are not provided to avoid misinterpretations.
In this work, we aimed for moderate statistical precision (1 σ) of ±0.3–0.4 percent modern carbon (pMC) yielding to a statistical precision (1 σ) of ±30–40 14C years for the 14C age of the AD 1484 parchment sample. Both the D (CTC) and E (EA-HASE) measurement series were successful. The AMS machine backgrounds measured with natural graphite blanks pressed into AMS cathodes were 0.12 pMC (54,300 BP) and 0.11 pMC (54,400 BP) for CTC and EA-HASE series, respectively. The full process backgrounds (combustion-graphitization-AMS) were measured for the CTC process with natural graphite and for the EA-HASE process with fossil diesel samples. These showed slightly higher process background of 0.4 pMC (44,300 BP) for CTC compared to 0.13 pMC (53,100 BP) of EA-HASE. This indicates a slightly larger modern contamination resulting from the CTC process compared to the EA-HASE process. This is expected due to EA-HASE optimization for small samples. The difference observed within these individual measurements is coherent with the average long-term process background that is discussed separately (Uusitalo et al. Reference Uusitalo, Mizohata and Oinonen2020).
Data Analysis
We analyzed the measured 14C contents by following the procedure used in the international radiocarbon intercomparison studies (Scott et al. Reference Scott, Cook and Naysmith2010; z scores). The measured 14C contents (pMC i.e. percent modern carbon) are compared to simulated pMC values (pMCsim, mean, N = 20) corresponding to the assumed manufacturing year of parchment sample. The simulations were performed with R_Simulate command within OxCal software (Bronk Ramsey Reference Bronk Ramsey2009). In particular, as R_Simulate produces a slightly different pMC every time, the simulations were performed 20 times for each measurement data. The differences were assessed through a two-sample z test providing a probability p for z being smaller than a critical value zcritical = ±1.96. Differences with p values larger than 0.05 were considered statistically insignificant.
However, since the researchers interested in parchment analyses are mostly historians and thus are familiar with using calendar year ages, we also present the differences in calendar-year scale. We simulated the calendar year probability distributions (cpd) reflecting the years AD 1484 and 1506 with OxCal and the differences (Difference() command) between these simulated cpds and the measured cpd were deduced to obtain the average of the 20 mean differences. This provided a way to estimate quantitatively the quality of the 14C dating in calendar-year scale.
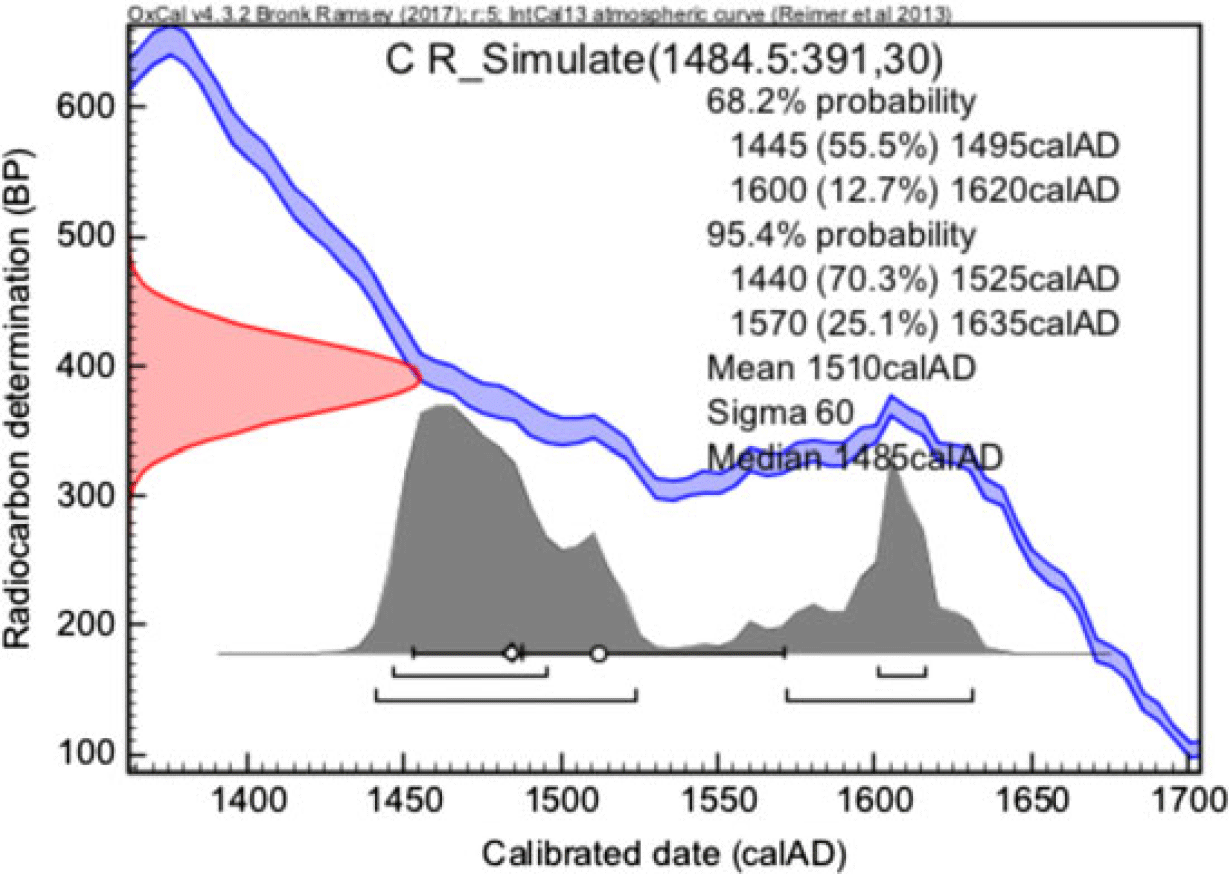
An example of a simulated 14C date and its calibration is shown in Figure 1. Altogether, 220 simulations were made for AD 1484 and the average of the mean values of the obtained cpds was 1530 ± 30 calAD. So, the average of means is slightly later compared to the assumed true age of AD 1484. This seems to be due to variations in the atmospheric 14C concentration causing a double-peaked shape of cpd. Nevertheless, the mean values of cpds provide a reasonable way to compare the quality.
Example of a simulated 14C date of the calendar year AD 1484 by assuming ±30 14C year statistical uncertainty. Note that due to double-peak distribution, the mean value of the calibrated age is 1510 ± 60 calAD which is slightly later than the assumed age of AD 1484.
RESULTS AND DISCUSSION
The first three series (A–C) were made during the progress of the method development on modern (A), 1506 (B) and 1484 (C) parchments (Table 1). Based on these, the chemical pretreatment process was refined and the remaining two series (D, E) were processed using the refined pretreatment process and with two combustion/graphitization processes.
Sample data for 14C-AMS measurements of parchments, msample = original mass of the parchment sample, mcomb = parchment mass for combustion process, method = combustion & graphitization method (CTC/EA-HASE), mC = estimated mass of graphite target for 14C-AMS measurements by assuming carbon content of 35% for collagen.

A–C Series
The first series were characterized by development for chemical pretreatment and for the EA-HASE-AMS process itself. Therefore, we discuss the results of these series only briefly.
The measured pMC values for the A series ranged from 100.8 to 104.1. The majority of the deviations from the expected value for 2015 (101.6) can probably be connected to technical issues with the AMS target holder and cathodes. However, interestingly, both the largest (2.4 mg C) and the smallest (0.12 mg C) sample provided results that are closest to the assumed value of 101.2 ± 0.3 and 100.8 ± 0.6 pMC. One of the most probable contaminants within parchment 14C analyses can be carbonates as a lime bath was part of the process for the skins for hair removal. This contamination should be seen as decreased 14C content in the data. There is no such indication within the data of modern parchment.
The series B made from AD 1506 parchment resulted in partially acceptable results as the two largest samples showed reasonably good agreement with the assumed age. However, the 4 measurements of the smaller samples (0.77–0.15 mg C) were all too old (mean values of cpds) by ca. 100–440 calendar years. Similarly, the C series made of AD 1484 parchment showed too old results as 3 out of 6 clearly had a 14C concentration that was too small.
Based on the majority of the results (7/12) being too old, we tentatively linked this effect to carbonate (limestone) contamination, as this may have varied depending on the sampling location. Consequently, the chemical pretreatment was tuned to be longer in acid treatment to attack the potential limestone contamination. In addition, the NaOH treatment was made longer as it did not risk the sample survivals. We note that acetone wash can also be considered as a source of old carbon and, if present, the removal would require additional methanol/ethanol washes.
14C Concentrations in D and E Series
For the final series D and E, the adjusted chemical pretreatment method was used on the 1484 parchment. To have a comparison to the well-established combustion/graphitization process, the D series were produced with the CTC process, whereas the E series was using the expectedly better-performing EA-HASE.
The measurement data on the D and E series are given in Table 2. Overall, the z-score analysis (Figure 2) shows that for 9 out of 11 samples there is no statistically significant difference between the measured and simulated pMC values, as the z scores remain within the critical values. These series demonstrate that prolonging the chemical pretreatment process works as expected: the true age is reproduced better compared to series B and C indicating that there is, indeed, an issue of carbonate contamination within parchments.
Measurement data of the D and E parchment series. RA = radiocarbon age. σRA = uncertainty of the RA (1 σ). Difference = average of the mean differences of 20 simulated cpd and the measured one. σDiff = standard deviation of Difference.

Comparison of measured and simulated pMC values for D and E series. The z score analysis shows two statistically significant outliers (D5 and E4). Differences between the measured and simulated results are not statistically significant for most of the samples.

However, the analysis also pinpoints two statistically significant outliers in the data: D5 and E4 samples. For these, the measured pMC values are too low by 3–4 standard deviations. It is well-known that small samples may be influenced by residual-CO2 contamination from the vacuum lines and cause ages to become too young due to modern CO2 involvement (Donahue et al. Reference Donahue, Linick and Jull1990). We do not see such a modern contamination effect, indicating that the potential contamination of residual gas-CO2 for medieval samples is well in control for both processes. On the contrary, the only deviating concentrations (D5 and E4) are too low. As the clean room excludes external contamination from pretreatment, since our process and AMS backgrounds are reasonably low, and since prolonging the chemical pretreatment seems to work as expected, we tentatively connect this effect to remaining carbonate contamination in these samples.
Results in a Calendar Year Scale
Figure 3 shows the comparison of the result of the largest sample (D6 with 2.3 mg graphite mass) to 10 simulated cpds of the year 1484. The figure shows also why one needs to make a large enough number of simulations and averaging of simulated cpds as the one of the simulations (simulation E) produces clearly a deviant cpd.
An example of a comparison of calendar year distributions of 10 simulated 14C ages of AD 1484 and the measurement of D6 sample.
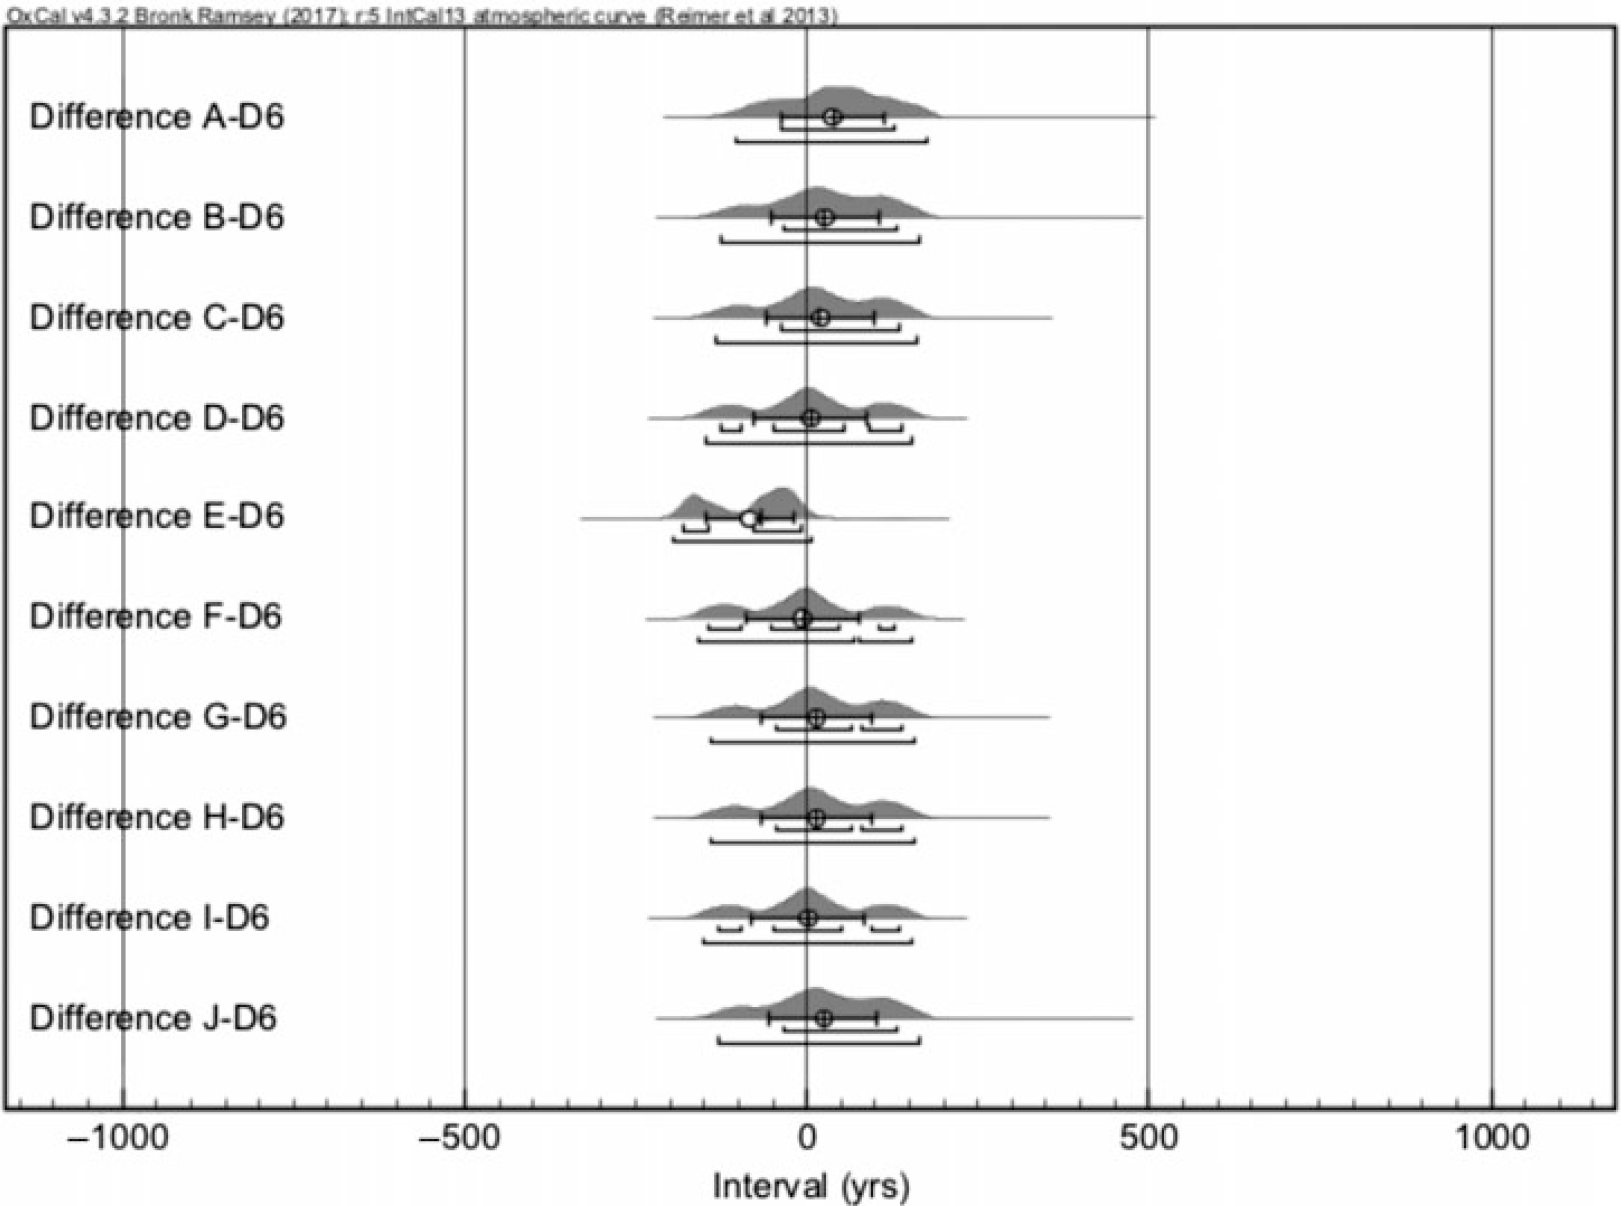
The simulated cpds and the 14C date of D6 sample (Figure 4) generally show a reasonable agreement as the Difference distributions are mostly centered around 0. This converts to (Table 2) an average difference between the simulations and measurement as –7 ± 38 calendar years (cal yr). Similarly, the samples D1–D4 provide also average difference distributions centered around 0. Thus, we conclude that the 14C dates of the parchment samples D1–4, 6 reproduce the true age of the sample well. Overall, the CTC-AMS process can reproduce the known ages for at least as low as ~0.5 mg AMS target sizes.
Differences between 10 simulated calendar year probability distributions of AD 1484 and the measurement D6 in calendar years. Eventually, 20 simulations and corresponding differences were made for each comparison.

The E series demonstrated a similar trend according to sample size for the EA-HASE-AMS process. Similar to the D series, simulated cpds for the year 1484 show a slight scattering (Figure 5) that emphasize the importance of the averaging of simulated distributions. The measurement of the largest sample E6 produces a two-peak distribution of which the largest probability mass falls at the end of the 15th century, as expected.
An example of a comparison of calendar year distributions of 10 simulated 14C ages of AD 1484 and the measurement of E6 sample.

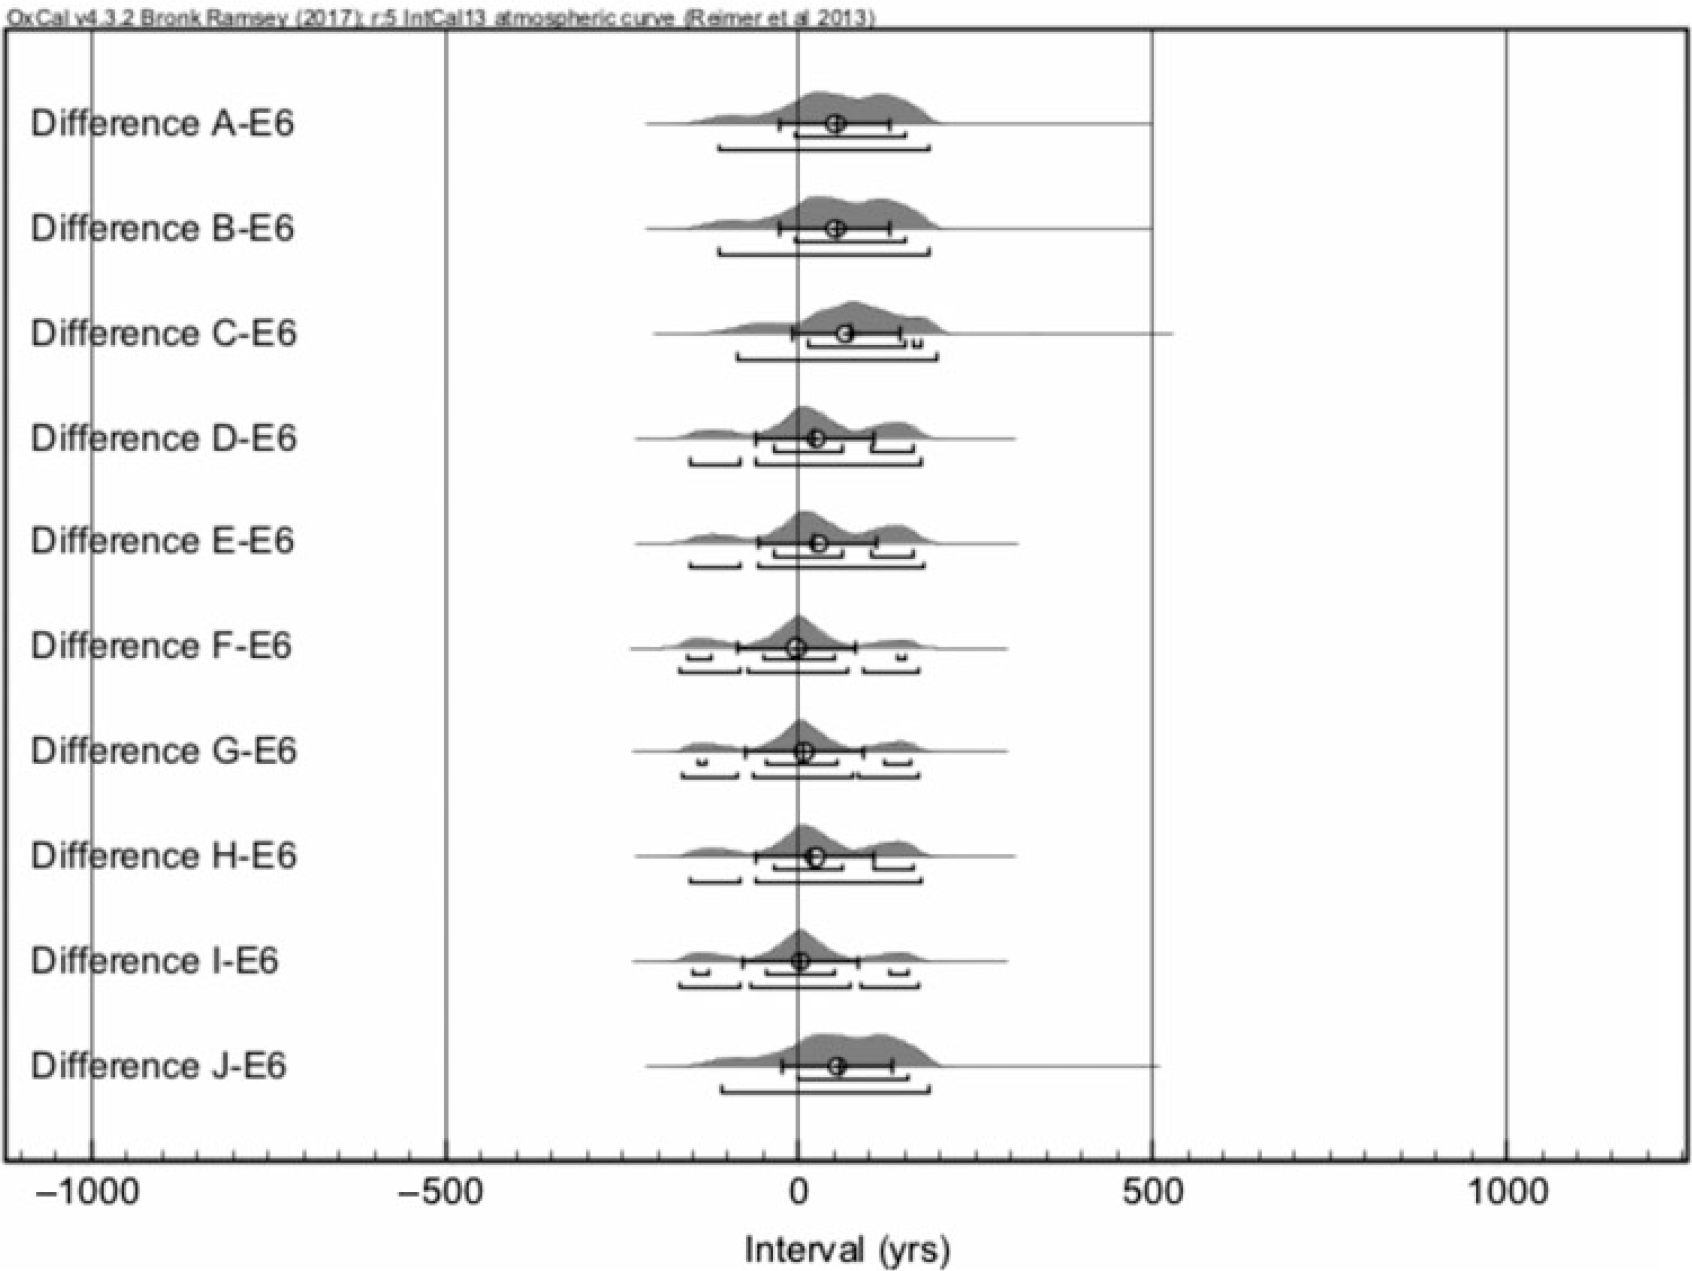
The differences between the simulated cpds and the 14C date of E6 sample (Figure 6) show a similar, better agreement than D6 as the Difference distributions are mostly centered around 0. Again, this converts to an average difference of 6 ± 29 cal yr between the simulated and the measured cpds. The E1 sample was lost due to technical issues, but the E2,3 and 5 samples show similar good agreement with the simulations. The only exception is the sample E4 (mC = 0.6 mg) for which the low 14C concentration converts to a date ca. 100 cal yr too old. Particularly, the measurement of the smallest sample E5 with 0.3 mg sample size reproduced well the true age of the parchment. This target mass corresponds typically to parchment samples of ca. 3 mm2 size in area (Table 1).
Differences between simulated calendar year probability distributions of AD 1484 and the measurement E6 in calendar years. Eventually, 20 simulations and corresponding differences were made.

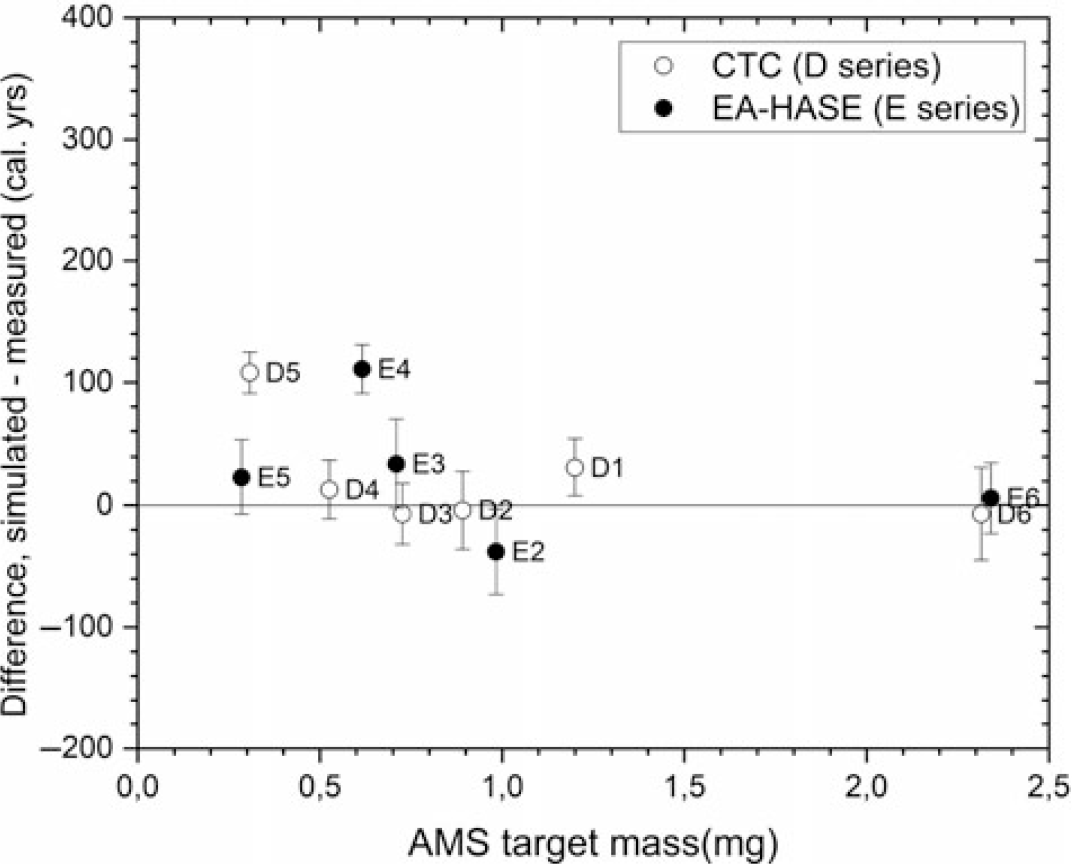
Overall, the simulated age of the 1484 parchment is reproduced (Figure 7) throughout the sample sizes. This shows that the 14C dating results of series D-E were satisfactory. Whereas the difference between the CTC and EA-HASE is tenuous, the less laborious EA-HASE-AMS process matches the expectations by providing excellent result with slightly smaller AMS target mass of 0.3 mg, corresponding to ca. 3 mm2 parchment areas. Moreover, it provides lower radiocarbon background also crucial for small sample measurements. In the future, sample purity with a focus on the carbonate contamination in unknown samples will be addressed by applying Fourier transform infra-red (FTIR) spectroscopy. Additionally, following the results presented in this paper, we aim to improve chronological analyses of the Fragmenta membranea samples with exploring even smaller >0.3 mg C samples sizes for parchment.
Differences between all the simulated and measured calendar year dates as a function of the AMS target masses.

CONCLUSION
The aim of this study was to determine the lowest sample size for 14C dating of parchment, and in particular to resolve whether it is possible to decrease the typical amount of carbon (1 mg) needed for 14C dating. Focus was placed on moving the chemical pretreatment process to a clean room to exclude surface contamination during the pretreatment. The process was developed successfully through three test series with modern and medieval parchments of known ages. Eventually, both of the processes tested—the traditional Closed-Tube-Combustion & graphitization (CTC) and Elemental Analyzer combustion and automated graphitization (EA-HASE)—were demonstrated to work with significantly smaller sample sizes. Particularly, EA-HASE-AMS process was so far able to reproduce the true age of the sample down to 0.3 mg C AMS target mass corresponding to parchment samples of ca. 3 mm2 and 0.8–1 mg before pretreatment. Therefore, this destructive method of analysis can be applied within a range to limited material, or material which does not allow large sample amounts. The information obtained pertaining to the necessary sample size can also be used in outlining the research of historical material that has perhaps been left untouched, because its sampling has been previously considered too invasive.
In the future, we will proceed towards exploiting the full potential of the EA-HASE-AMS process with 50 μg AMS graphite target masses and expand these initial studies to sample quality criteria with FTIR method in order to better understand the role of contaminants, such as carbonates within the parchment samples due to the manufacturing process with lime. In addition to this, we will extend our studies to the Fragmenta membranea parchment fragment collection. Furthermore, we will combine the datable information from historical and paleographic studies with Bayesian modelling to produce a multidisciplinary chronological analysis of parchment archives. Dating and studying history should be viewed as a multistage process, in which the one method is not ignored for another, but applied together.
ACKNOWLEDGMENTS
The study is part of the Towards Reliable Dating of Medieval Parchments: Developing Traditional and Scientific Methods project, funded by The Jenny and Antti Wihuri Foundation, and collaboration between the Laboratory of Chronology of the Finnish Museum of Natural History (LUOMUS) and the National Library of Finland. Additionally, the first author was a member of the Laboratory of Chronology in Helsinki when this research was undertaken.


 Open access