1. Introduction
With 59 × 103 km2 of glacierized area (cf. the total area of mountain glaciers in the world of 540 × 103 km2; Reference DyurgerovDyurgerov and Meier, 2005), the Hindu Kush–Himalaya (HKH) region (including Himalaya, Karakoram and Hindu Kush) comprises the biggest mountain range on Earth, and the largest ice mass outside the polar regions. As the HKH region provides water to ∼50–60% of the world’s population, it is potentially one of the most crit ical parts of the world when considering the social and economic impacts of glacier shrinkage (Reference Barnett and AdamBarnett and others, 2005). Monitoring the evolution of HKH glaciers is therefore a key issue as their melting may (1) negatively affect regional water supply in the next decades (Reference Barnett and AdamBarnett and others, 2005), (2) significantly contribute to ongoing sea-level rise (Reference Kaser, Cogley, Dyurgerov and MeierKaser and others, 2006) and/or (3) increase natural hazards linked to glaciers (especially glacial lake outburst floods) (Reference Mool, Wangda, Bajracharya, Kuzang and GurungMool and others, 2001a, b).
Mountain glaciers are also widely recognized to be sensitive climatic indicators (Reference HoughtonHoughton and others, 2001; Reference SolomonSolomon and others, 2007). Measuring glacier evolution gives insights into the regional climate change in high and remote places where meteorological measurements are difficult and rare. This is of particular interest in the western Himalaya because the region is influenced by two major climatic systems (the mid-latitude westerlies and the south Asian summer monsoon) which are still poorly known due to logistical difficulties in maintaining observational networks at high elevations. Further, the occurrence of global warming in this part of the world is still under debate (Reference Yadav, Park and SinghYadav and others, 2004; Reference Roy and BallingRoy and Balling, 2005).
The Himalaya is the largest mountain range (33 × 103 km2) of the HKH region, but its glaciers are very poorly sampled in the field. One of the most recent and comprehensive global inventories includes only 8 glaciers in India and 3 in Nepal with mass balances measured for at least 1 year (Reference DyurgerovDyurgerov and Meier, 2005). In addition to this inventory, Dokriani Glacier (7 km2), Garhwal Himalaya, India, has had its mass balance surveyed over 6 years, between 1992 and 2000 (Reference Dobhal and KumarDobhal and others, 2007). Out of these 12 glaciers, 4 are smaller than 2 km2 and the time series are short: 3 glaciers have only a single year of mass-balance measurements. Furthermore, the longest series (11 years) is for Langtang Glacier, Nepal, (75 km2) whose mass balance is not surveyed directly in the field but modelled from temperatures and precipitation measured in Kathmandu, 60 km away (Reference Tangborn and RanaTangborn and Rana, 2000). Consequently, measured mass-balance series are shorter than 9 years in India and 4 years in Nepal (World Glacier Monitoring Service, http://www.wgms.ch). Furthermore, the time series are usually old (8 ended before 1990) and no mass-balance measurements have been reported since 2000 (Reference DyurgerovDyurgerov and Meier, 2005). In conclusion, no longterm glacier-monitoring network has ever been sustained, despite the efforts of local and international scientific communities (Reference YoungYoung, 1993), and the situation has been even worse since 2000.
Satellite imagery is now a suitable tool to obtain comprehensive and frequent sampling of glacier evolution (e.g. Reference Bishop, Kargel, Kieffer, MacKinnon and RaupBishop and others, 2000; Reference KulkarniKulkarni and others, 2007) and some remote-sensing studies even address the question of glacier mass balance over a few years (e.g. Reference Berthier, Arnaud, Kumar, Ahmad and WagnonBerthier and others, 2007). Nevertheless, ground measurements are still needed for calibration and validation, and because the seasonal and annual mass balances cannot be measured from space.
Given the crucial role of Himalayan glaciers in terms of future water supply, sea-level rise and regional climate change, and given the lack of data, a long-term monitoring programme on a glacier was urgently needed. Consequently, the Great Ice research unit (Institut de Recherche pour le Développement (IRD), France) started discussions with Indian partners in 2000 to develop a common research programme on Himalayan glaciers. Rapidly, both partners decided to select a benchmark glacier in the western Himalaya. The selected glacier needed to be convenient for observations of mass, energy and hydrological balances. After several common field visits during 2001, Chhota Shigri Glacier, already studied by an Indian consortium of scientists during 1987–89 (Reference Dobhal and KumarDobhal and others, 1995), was chosen. The field measurements started in autumn 2002, taking the opportunity of a training session organized by the Hindu Kush–Himalaya UNESCO-FRIEND (Flow Regimes from International Experimental and Network Data) program (Reference Kaser and FountainKaser and others, 2003) with the participation of several research organizations from India, Nepal and Bhutan. This initiative also received the support of the International Union of Geodesy and Geophysics (IUGG) Commission for the Cryospheric Sciences (UCCS).
Chhota Shigri Glacier (32.2° N, 77.5° E), Lahaul and Spiti district, Himachal Pradesh, India, was selected because it is easy to access (around 100 km from Manali by road), of medium size (15.7 km2 over a 34.7 km2 catchment), mostly free of debris cover and lies in the crucial area alternately influenced by the Asian monsoon in summer and by the midlatitude westerlies in winter. In addition, the morphology and bedrock topography, as well as dynamics, of this glacier have been surveyed, during the summer months of 1987, 1988 and 1989 (e.g. Reference Dobhal and KumarDobhal and others, 1995; Reference Kumar and DobhalKumar and Dobhal, 1997; Reference KumarKumar, 1999). The total retreat of the snout between 1963 and 1989 has been evaluated at ∼195 m (mean retreat over these 26 years of 7.5 m a–1; Reference Dobhal and KumarDobhal and others, 1995), but a recent study (Reference KulkarniKulkarni and others, 2007) reports an accelerated retreat since 1988, with an 800 m retreat of the glacier terminus between 1988 and 2003 (mean retreat over these 15 years of 53 m a–1). Mass-balance measurements and accumulation estimates were attempted in 1987–89 (Reference Nijampurkar and RaoNijampurkar and Rao, 1992; Reference Dobhal and KumarDobhal and others, 1995; Reference KumarKumar, 1999) but they are questionable because stakes were drilled into the ice only up to 1 m depth and only part of the accumulation area is taken into account in the calculations.
Apart from the geographical description of the glacier and the study area, this paper presents 4 years of mass-balance and 3 years of surface velocity measurements of this glacier. It is planned that Chhota Shigri Glacier will become a benchmark glacier for process-understanding in this part of the Himalayan range, following the basic concepts of international climate-related glacier monitoring (‘tier-2’ level described in Reference Haeberli and MaischHaeberli and others, 2002; Reference PaulPaul and others, 2007). This glacier is likely to be included in the GLACIO-CLIM network whose aim is to select a limited number of glaciers representative of various climates of the world in order to better understand the climate–glacier relationship (http://www-lgge.obs.ujf-grenoble.fr/ServiceObs/index.htm).
2. Study Area
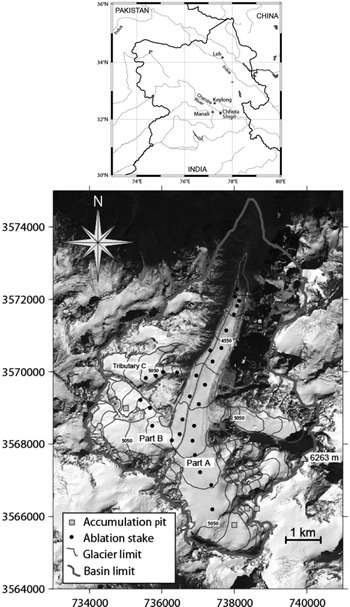
Chhota Shigri Glacier lies on the Chandra–Bhaga River basin on the northern slopes of the Pir Panjal range in the Lahaul and Spiti valley of Himachal Pradesh, in the western Himalaya. It is included in the upper basin of the Chandra River, contributing to the Chenab River, one of the tributaries of the Indus river basin (Fig. 1). This valley-type glacier is oriented roughly north–south in its ablation area, and has a variety of orientations in the accumulation area. Table 1 gives a list of geographical and topographical characteristics of Chhota Shigri Glacier, as well as some basic mass-balance information from this study (see section 5.2). The total area of the Chhota Shigri basin draining to the future hydrological station at 3900 m a.s.l. on the proglacial stream is 34.7 km2 (47% glacierized). Four tributaries and several small suspended glaciers belong to this drainage basin (Fig. 1). The total glacierized area is 16.3 km2 while Chhota Shigri Glacier covers 15.7 km2 (including tributaries). The ablation area is made up of two main flows, one coming from the eastern side of the accumulation area and flowing on the right bank of the glacier (part A) and the second coming from the western side and flowing on the left bank (part B). The ablation area is partly debris-covered, with part B being totally covered below ∼-4600 m a.s.l. and part A below ∼-4350 m a.s.l. Immediately to the east of this basin lies the largest glacier of Himachal Pradesh, Bara Shigri Glacier (28km long; 131 km2) (Dutt, 1961; Reference Berthier, Arnaud, Kumar, Ahmad and WagnonBerthier and others, 2007).
Location (upper panel) and map (lower panel) of Chhota Shigri Glacier showing the ablation stakes network, the location of drilling sites and the delimitations of the whole catchment (thick grey line) and Chhota Shigri Glacier including part A, part B and tributary C (thin grey lines). The background is a SPOT5 (Système Probatoire pour l’Observation de la Terre) image of 20 September 2005. The map coordinates are in the UTM43 (north) WGS84 reference system.

Geographical and topographical characteristics of Chhota Shigri Glacier. ELA0 and AAR0 are the calculated equilibrium-line altitude and accumulation-area ratio values, respectively, for a zero net balance given the 2005 hypsography. Mean annual temperature at ELA0 is derived from NCEP/NCAR re-analyses data for the gridpoint 32.5° N, 77.5° E at 600 hPa applying a standard lapse rate of –0.0065°C m–1

3. Climatic Conditions
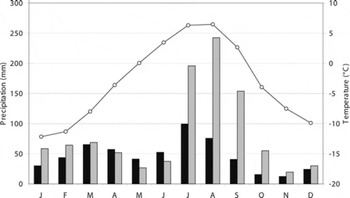
Unfortunately, climatic records from the nearest meteorological station in Keylong (Fig. 1) are not available, and therefore we use re-analysis data from the US National Centers for Environmental Prediction/US National Center for Atmospheric Research (NCEP/NCAR) (Reference KalnayKalnay and others, 1996). Figure 2 shows the mean annual cycle of monthly precipitation (1980–2006) for the two gridpoints closest to Chhota Shigri Glacier (gridpoints 31.4° N, 76.9° E and 33.3°N, 78.8°E at 105 and 173 km, respectively). We notice two distinct precipitation regimes, as previously reported by various studies (e.g. Reference Bookhagen and BurbankBookhagen and Burbank, 2006): most of the precipitation occurs in summer (July–September) due to the Asian monsoon, but there is also a significant amount in winter (January–April) due to mid-latitude westerlies. This is typical of the monsoon–arid transition zone where both the summer Asian monsoon and the winter mid-latitude westerlies influence the climate regime. The Chandra River valley, where the glacier is situated, is drier than the southern slopes of the Pir Panjal range. This is the leeward effect of the main ridge mostly oriented west–east, thus preventing part of the monsoon flux from reaching the valley (e.g. Reference Bookhagen and BurbankBookhagen and Burbank, 2006). Accumulation measurements performed at 5500 m a.s.l. on Chhota Shigri Glacier between 2002 and 2005 give rough estimates of the minimum amount of annual precipitation at high elevation. Accumulation measurements varied between a minimum annual value of 0.6mw.e. in 2003/04 and a maximum value of 1.9mw.e. in 2004/05 (the hydrological year is defined from 1 October to 30 September).
Mean annual cycle (over 27 years, 1980–2006) of monthly precipitation (grey histograms: NCEP/NCAR re-analyses data for gridpoint 31.4° N, 76.9° E; black histograms: NCEP/NCAR reanalyses data for gridpoint 33.3° N, 78.8° E) and of monthly temperature at 600 hPa (curve: NCEP/NCAR re-analyses data for the gridpoint 32.5° N, 77.5° E).

Also shown in Figure 2 is the mean annual cycle of monthly air temperature (1980–2006) at the glacier level (600 hPa) for a gridpoint (32.5° N, 77.5° E) located 30 km away. The region is characterized by a cold season extending from October to April and by a pronounced annual thermal amplitude (more than 18°C between January and August, the coldest and hottest months, respectively). The short-term meteorological observations (July–September) on the glacier during 1987–89 showed temperatures ranging from –5.2 to +10.5°C at 4600 m a.s.l. (Reference Dobhal and KumarDobhal and others, 1995).
4. Methodology
Since 2002, annual surface mass-balance measurements have been carried out on Chhota Shigri Glacier at the end of September or beginning of October. The direct glacio-logical method is used here (Reference PatersonPaterson, 1994). In the ablation area, annual mass balance is determined from stakes inserted in ice down to 10 m deep (ice density is taken as constant at 900kgm–3 and, when there is snow, densities are systematically measured in the field). In the accumulation area, cores are drilled to measure the annual net accumulation from snow layering (stratigraphy) and for density measurements. The number of ablation stakes has progressively increased from 14 stakes in 2002 between 4300 and 4900 m a.s.l. along the flowline of part A, to 29 stakes in 2005 between 4300 and 5200 m a.s.l., distributed along parts A and B and on the east-oriented tributary C (Fig. 1). Three ablation stakes are located on the debris-covered part of the glacier. In the accumulation area, between 5200 and 5500 m a.s.l., Recco avalanche reflectors together with blue powder spread out over a 2 m2 surface are used to mark a reference level, easily recognizable while drilling the following year. During the year 2004/05, accumulation was high so 12 additional accumulation pits were dug in parts A and B between 4900 and 5500 m a.s.l. In 2006, no accumulation measurements were carried out at 5500 m a.s.l. due to dangerous access (crevasses). At 5400 m a.s.l., the accumulation site is poorly representative due to avalanche occurrence, and drilling failed to locate the blue reference level. Consequently this site was abandoned.
The overall specific annual mass balance, bn , is calculated according to:
where bi is the mass balance of the altitudinal range, i, of map area si and S is the total glacier map area. For each altitudinal range, bi , is obtained from the corresponding stake readings or net accumulation measurements. The hypsography of the glacier is derived from a composite topography. This topography was obtained by combining two SPOT5 (Système Probatoire pour l’Observation de la Terre) digital elevation models (DEMs) (12 and 13 November 2004; 20 and 21 September 2005) and, where data were missing, it was completed by the SRTM (Shuttle Radar Topography Mission) DEM (February 2000). The glacier and tributaries were delineated by visual interpretation of a multispectral ASTER (Advanced Spaceborne Thermal Emission and Reflection Radiometer) scene acquired in September 2002 and, in shadowy areas, completed by the analysis of the panchromatic SPOT5 images. Using a single map over the whole measuring period to derive b n means that we obtain the reference-surface glacier-wide balance (Reference Harrison, Elsberg and CoxHarrison and others, 2005).
Accuracy of this overall specific annual mass balance depends on various factors. Among others are the accuracy of stake readings, the accuracy of the density measurements, the density and representativeness of stake or accumulation measurement sites and the accuracy of the map. Therefore, the accuracy of bn cannot be strictly evaluated, but is approximately ±20cmw.e., a typical error range for mass-balance data (e.g. Reference JanssonJansson, 1999). Year-to-year relative differences are still instructive because annual values refer to the same map, to the same area–elevation distribution function and to the same measurement network (except for 2002/03; see section 5.2). In particular, this reference-surface glacier-wide balance is amenable to direct climatic interpretation (Reference Harrison, Elsberg and CoxHarrison and others, 2005).
Since 2003, the accurate location of almost every stake has been surveyed using a differential global positioning system (Ashtech ProMark II) in order to obtain annual surface velocities of the glacier. The accuracy in x, y and z is ±0.3 m, except for some stakes of the lower ablation zone where it is ±1 m due to the low sky-view factor (narrow valley). Due to thick debris cover over the glacier tongue and steep slopes, it is not possible to perform an accurate topographical survey of the front. This thick debris cover makes the topographical survey of the glacier terminus from space rather inexact, and the 800 m retreat of the glacier terminus between 1988 and 2003 reported by Reference KulkarniKulkarni and others (2007) is somewhat questionable.
5. Results and Discussion
5.1. Annual mass balance as a function of altitude
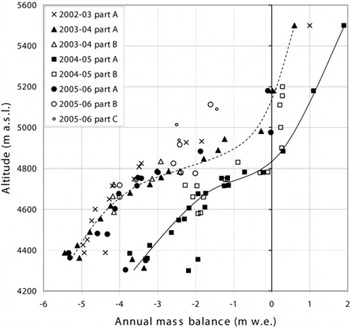
Figure 3 displays the annual mass balance as a function of altitude for the study period on Chhota Shigri Glacier, including all the measurements on part A (2002–06), on part B (2003–06) and on tributary C (2005–06). From the figure, we observe that the debris covering the lower part of the glacier efficiently protects the glacier from melting. Indeed, at 4360 m a.s.l. where two stakes are located on and outside the ∼1 to 2 cm thick debris-covered area (thin debris of a few millimetres mixed with isolated rocks sometimes bigger than a few tens of centimetres), the measured mass balance is systematically ∼1.4 to 2 m w.e. more negative on the debris-free area than over the covered part. However, the mass balance is still very negative on the covered area at this elevation, with annual values varying between –2 and –4 m w.e.
Four years of annual mass balance as a function of altitude derived from field measurements (stakes, drillings and pits). Measurements were performed on 4 October 2002, 4 October 2003, 22 September 2004, 3 October 2005 and 30 September 2006, ±3 days. Dashed and plain curves indicate the mean gradients of specific mass balance as a function of altitude on part A (excluding the debris-covered area) for 2003/04 and 2004/05, respectively. Below 4400 m a.s.l., stakes were inserted in the debris-covered area of the glacier and experienced reduced ablation compared to their respective gradients.

The mean vertical gradient of annual mass balance of the ablation area of part A between 4400 and 4900 m a.s.l. (area free of debris) varies from a minimum value of 0.60 m w.e. (100 m)–1 in 2002/03 to a maximum value of 0.81 m w.e. (100 m)–1 in 2003/04. The mean value over the 4 years (0.69 m w.e. (100 m)–1) is similar to gradients observed in the Alps or on mid-latitude glaciers (e.g. Reference Rabatel and DedieuRabatel and others, 2005) and much smaller than gradients measured on tropical glaciers which can be as high as 2 m w.e. (100 m)–1 (Reference Wagnon, Ribstein and FrancouWagnon and others, 1999; Reference KaserKaser, 2001). Studying Figure 3 in more detail, we observe that this gradient is smaller between 4400 and 4700 m a.s.l. than between 4700 and 4900m a.s.l. (uncovered areas) with respective mean values over the 4 years of 0.50 and 1.12 mw.e.(100m)–1. Indeed, below 4700 m a.s.l., the glacier flows in a deep and narrow valley whose orientation is south–north (Fig. 1). Therefore, the glacier tongue receives less solar radiation due to the shading effect of the steep valley slopes. Thus ablation is reduced and the vertical gradient of mass balance is attenuated compared to the open upper part of the glacier. In conclusion, solar radiation and, thus, surface albedo are likely to play an important role in the melting of this Himalayan glacier. However, this can be confirmed only if winter and summer mass-balance measurements and energy-balance investigations are performed. Indeed, differences in accumulation may explain part of this changing vertical gradient of mass balance.
Figure 4 shows the annual mass balances for 2004/05 and 2005/06 measured at six sites free of debris (stakes, drillings or pits) located on part A, part B and tributary C between 4920 and 5180 m a.s.l. For similar elevations, we observe large differences of mass balance between part A and part B or tributary C. In 2004/05, the equilibriumline altitude (ELA) is located below 4920 m a.s.l. and net accumulation is higher on part A than on part B (mean difference ∼0.5mw.e. at ∼5000 m a.s.l.). In 2005/06, the ELA is higher than 5180 m a.s.l. and ablation is greater on part B and tributary C than on part A (mean difference of ∼2 mw.e. at ∼5000 m a.s.l.). This is explained by the east-oriented slopes (part B and tributary C) receiving more solar radiation than north- or northwest-oriented areas of the glacier (part A). When this altitude range is in the ablation area as it was in 2005/06, the annual snow cover disappears before the end of the summer and ice is exposed to direct solar radiation. Ablation is then enhanced because ice albedo is much lower than snow albedo which favours absorption of incoming solar radiation. Thus, ice is exposed later in the season on part A than on part B or tributary C, leading to large differences in annual mass balance. This difference is reduced when this altitude range is in the accumulation area as it was in 2004/05 because then ablation concerns only snow and not ice. Spatial differences in accumulation between part A and part B and tributary C may contribute to these differences in annual mass balance, but unfortunately no winter mass-balance measurements have yet been performed.
Measurements of 2004/05 (black histograms) and 2005/06 (grey histograms) annual mass balance at six points located on parts A and B and tributary C between 4920 and 5180 m a.s.l. ‘A (4980 m)’ refers to the point located at 4980ma.s.l. on part A. P stands for pits or drillings and S for stake readings. There was no measurement on tributary C in 2004/05.

5.2. Annual specific mass balance, ELA and AAR
Table 2 gives the mean annual specific mass balance of the whole glacier, of the ablation area (below 4850 m a.s.l.), the ELA obtained on part A and the accumulation-area ratio (AAR) for the 4 years of measurements. During the study period, only 2004/05 is different from the other hydrological years, with an annual specific mass balance of +0.1 m w.e., an ELA of 4855 m and an AAR of 74%, although NCEP/NCAR annual temperature and precipitation are not significantly different. The three other years show strongly negative mass balances reaching –1.4 m w.e., an ELA of ∼5180 m a.s.l. and an AAR of ∼30º%. We are aware that the accuracy of the result of the mean annual specific mass balance is around ±20 cm w.e. (cf. section 4), but year-to-year relative differences are reliable. In 2002/03, no stakes were surveyed on part B, although its upper area is east- to southeast-oriented and thus experiences a stronger ablation than the upper area of part A (Fig. 4). Therefore, the 2002/03 specific mass balance may have been even more negative than our estimate (–1.4 m w.e.).
Specific annual mass balance of the whole glacier, b n , and of the ablation area only, b n (<4850 ma.s.l.), ELA measured on part A and AAR of Chhota Shigri Glacier during the 4 years of measurements. Since no accumulation measurements were available above 5180 m a.s.l. in 2005/06, and since this year was similar to 2002/03 and 2003/04 (for specific mass balance, see Fig. 3), we used the mean accumulation value at 5500 m a.s.l. of 2002/03 and 2003/04 (0.8 m w.e.) to calculate the 2005/06 specific mass balance

5.3. Distribution of ablation throughout the year
On 1 September 2004 and 22 July 2005, additional readings of stakes were taken, providing measurements of summer ablation. Figure 5a and b compare the annual mass balance and a part-year mass balance (1 September to 22 September in 2003/04 and 22 July to 3 October in 2004/05) as a function of altitude. The figure shows that most of the ablation occurs between July and September, during the monsoon season, and that ablation is still significant in September (ablation >1 m w.e. on 22 days at 4750 m a.s.l.). Therefore, like alpine glaciers, the glaciers of this dry part of the western Himalaya have two distinct accumulation and ablation seasons. In particular, they do not behave like tropical glaciers which experience ablation throughout the year.
Comparison between the annual mass balance (Annual MB) and a part-year mass balance (1 September to 22 September in 2003/04, and 22 July to 3 October in 2004/05) as a function of altitude. (a) 2003/04, (b) 2004/05. Only the stakes surveyed during both periods are shown.

Between 1 September and 22 September 2004, no accumulation was reported, ice was exposed at the glacier surface up to 4800 m a.s.l. (approximately constant albedo) and a zero vertical gradient of ablation between 4350 and 4800 m a.s.l. is observed over the uncovered area of part A (Fig. 5a), although a significant vertical gradient is expected. Actually, below 4700 m a.s.l., ablation is limited because of the shading effect of the surrounding slopes of the narrow valley, erasing the expected vertical gradient of ablation. This observation confirms solar radiation is the main factor controlling the ablation on the glacier tongue. The shading effect is all the more important as this is close to the glacier snout (where the valley is deepest and narrowest).
5.4. Surface velocity
All the measurements of surface velocity along the flowlines of parts A and B are plotted as a function of the distance from the snout (symbols in Fig. 6). The glacier moves faster in the upper part of the ablation zone (4600–4850 m a.s.l.) with maximum flow velocities >45 m a–1 at ∼4850 m a.s.l. In the lower part (∼4400 m a.s.l.), velocities are ∼25 m a–1. These values are in rough agreement with measurements performed in 1987/88 (Reference Dobhal and KumarDobhal and others, 1995; Reference KumarKumar, 1999). We observe two peaks in surface velocity, at 3 and 6 km from the snout (4600 and 4850 m a.s.l., respectively), corresponding to slope changes in the surface topography. Summer 1988 velocities are slightly higher (Fig. 6) than annual velocities. The 2003/04 velocities are slightly higher than those reported in following years, and part B moves a little more slowly than part A. There seems to be a limited sensitivity of glacier velocity to changes in mass balances at the annual scale.
Measured (symbols) and calculated (curves) surface velocities plotted as a function of distance from the snout (the snout position comes from the 2005 map, Fig. 1). Measurements have been performed along the flowline of part A (filled symbols) and part B (open symbols) in 2003/04 (triangles), 2004/05 (squares) and 2005/06 (circles). Summer velocities in 1988 (August–September) and 1987/88 measurements are also shown (from Reference KumarKumar, 1999). Calculated balance velocities are reported for steady-state mass balance b n = 0mw.e. (thin curve), for b n = –0.1 mw.e. (dashed curve) and for bn = –0.2 m w.e. (thick curve) considering nine glacier sections at various elevations between 4150 and 4950ma.s.l., obtained from an average thickness map surveyed in 1989 by Reference Dobhal and KumarDobhal and others (1995) (see text for details).

In Figure 6, we have also plotted (curves) the calculated balance velocities in order to roughly assess the glacier imbalance of the last two decades. Although the dynamics changes are neglected, this method allows us to estimate the ice fluxes for each section from mass-balance data according to:
where Flux(z) is the ice flux at a given elevation, z, and bi is the annual mass balance of the altitudinal range i of map area si (converted into m3 of ice per year using an ice density of 900 kg m–3, hence the factor 1/0.9). The altitudinal ranges taken into account in the calculation are located between z and the highest range of the glacier z max (6250 m a.s.l.). Calculations have been performed using a steady-state mass balance (b n = 0mw.e.), and also slightly negative mass balances (b n = –0.1 and –0.2 m w.e.). We assume here that on each point of the glacier above this altitude, z, the surface elevation has remained unchanged from one year to the next. Indeed, glaciers in this region of the Himalaya are not known to experience surges, and visual inspection of the satellite images indicates no sign (such as folded moraines) of past surges. At each elevation, z, this flux was converted into a mean velocity through the corresponding section thanks to an average ice-thickness map surveyed in 1989 by Reference Dobhal and KumarDobhal and others (1995) (ice thickness has been estimated using gravimetric techniques and ranges from 15 to 130 m). Surface elevation changes between 1989 and 2005 could not be evaluated because the 1989 map is not accurate enough and has a different geo-referencing. Surface velocities at each elevation, z, reported in Figure 6 are derived from the mean velocity at z considering that the mean velocity through a glacier section is ∼-80º% of the centre-line surface velocity (Reference PatersonPaterson, 1994). Below 4750ma.s.l. (distance from snout <5 km), the steady-state balance velocity is approximately twice as high as measured velocity. This means that either the bedrock topography surveyed by Reference Dobhal and KumarDobhal and others (1995) is erroneous (the glacier tongue below 4750 m a.s.l. is perhaps twice as thick as reported), or the glacier has experienced negative specific mass balance between 1987 and 2006. If the thickness measurements are correct, the specific net balance in best agreement with the measured surface velocities would be between –0.1 and –0.2 m w.e. a–1. In this case, providing the glacier is not in steady state, the mean specific net balance over 1987–2006 is probably lower. However, surface slope changes at 4600 and 4850 ma.s.l. do not correspond to thickness variations. Consequently, the variations of calculated velocities cannot be in agreement with the observed velocity changes along the glacier. For this reason, the ice-thickness measurements are probably questionable.
6. Summary and Conclusions
This paper presents 4 years of annual mass-balance measurements on Chhota Shigri Glacier obtained using the direct glaciological method (ablation stakes, drillings and pits). Mass balance is strongly dependent on debris cover (which significantly protects the lowest part of the glacier from melting), on exposure and on the shading effect of surrounding steep slopes. This suggests that melting is likely to be predominantly driven by incoming solar radiation which is irregularly absorbed by the glacier according to surface albedo (snow or ice, presence of debris or not). Energy-balance studies are needed to compare the relative importance of heat fluxes (radiation and turbulent fluxes) on the melting at various elevations.
Results of surface velocity show that the glacier moves faster in the upper area of the ablation zone with velocities >45 ma–1 and slows down to ∼25 ma–1 at ∼4400 m a.s.l. There seems to be a limited sensitivity of glacier velocity to changes in mass balance at the annual scale, but repeated measurements of thickness changes at various elevations are still needed to better understand the dynamics of this glacier.
At first glance, Chhota Shigri Glacier, and therefore glaciers from this dry part of the western Himalaya, seems similar to mid-latitude glaciers (alpine glaciers in particular). At an annual scale, they have the same vertical gradient of mass balance in the ablation area (excluding the debris-covered part) of ∼0.7 m w.e.(100m)–1 and their ablation season is limited to the summer months. However, this cannot be concluded definitively without looking in detail at the different seasons and especially at the distribution of accumulation throughout the year. Indeed, the western Himalaya are alternately exposed to mid-latitude westerlies bringing precipitation in winter and to the Asian summer monsoon. As a consequence, the cold winter is the main accumulation season but the glacier may receive further snow in summer, at least at high elevations. In the future, winter and summer mass balances will be surveyed together in order to better understand the accumulation regime prevailing on western Himalayan glaciers. It is likely to be very different from that on mid-latitude glaciers.
Over this 4 year monitoring period, the annual specific mass balance of Chhota Shigri Glacier is often sharply negative, with –1.4, –1.2, +0.1 and –1.4mw.e. in 2002/03, 2003/04, 2004/05 and 2005/06, respectively. Neither any general trend in the mass balance nor any conclusion concerning local climate change can be derived from this too-short observation period. Nevertheless, some recent remote-sensing studies report an overall deglaciation in Himachal Pradesh as high as 21% between 1962 and 2007 (Reference KulkarniKulkarni and others, 2007; 466 glaciers investigated) or a general thinning of glaciers in the western Himalaya between 1999 and 2004, in agreement with field measurements (Reference Berthier, Arnaud, Kumar, Ahmad and WagnonBerthier and others, 2007; overall specific mass balance of –0.7 to –0.85 m w.e. a–1 obtained over a 915 km2 ice-covered area including Chhota Shigri Glacier). These remote-sensing studies and this paper indicate an increase in the pace of glacier wastage in the western Himalaya, probably related to global warming, but long-term monitoring of Chhota Shigri Glacier is needed to study the evolution of glaciers and their relation to climate. This programme, planned for the coming years, will include winter and summer mass-balance measurements, survey of thickness changes, energy-balance studies and hydrological monitoring, as well as regional-scale remote-sensing investigations.
Acknowledgements
This work results from a joint effort of the glaciological scientific community aimed at selecting and monitoring over a long time period a benchmark glacier in the Himalaya. Many people and organizations have participated in, or funded, this project and are sincerely acknowledged here: A. Fountain, H. Jones and G. Kaser (UCCS and UNESCO-FRIEND programme), G. Rees (Centre for Ecology and Hydrology, Wallingford, UK), M.-F. Gonnord, B. Heulin, P.A. Lhôte and V. Dham (French Embassy in India), S. Ahmad (Aligarh Muslim University, India), D. Dobhal (Wadia Institute, Dehradun, India), P. Rao (WWF–India), A. Coudrain, B. Francou and P. Ribstein (IRD Great Ice) as well as Jawaharlal Nehru University, High Ice India and IRD. We thank M. Dyurgerov, W. Harrison, W. Haeberli and the Scientific Editor, N. Glasser, who helped improve the manuscript. We are grateful to all the people who have helped in the field: M. Adhikari, C. Gérard, A. Racorviteanu, K. Sturm and all the drivers, porters, cooks and base camp supervisors. Logistical support during all the field campaigns has been provided by Directorate of Mountaineering and Allied Sports, Government of Himachal Pradesh, in Manali. SPOT5 images were purchased at reduced cost thanks to the ISIS programme (copyright Centre National d’Etudes Spatiales, France) and the ASTER image was obtained for free, thanks to the GLIMS (Global Land Ice Measurements from Space) programme.