1 INTRODUCTION
Usually, X-ray spectra of isolated neutron stars (NSs) are well described by a featureless continuum which contains non-thermal and/or thermal component. In rare cases, however, absorption features are detected. Understanding origins of these features is thought to be important for various aspects of the NS physics. For instance, they can result from atomic transitions in the mid-Z element NS atmospheres (e.g., Mori & Ho Reference Mori and Ho2007). In this case, as in ordinary stars, it is possible to measure the surface gravitational redshift and, hence, the stellar mass to radius ratio. This is important for independent diagnostic of the equation of state (EOS) of dense matter inside NSs. Absorption features can also be identified with either proton or electron cyclotron lines. Electron cyclotron lines in NS spectra were predicted by Gnedin & Sunyaev (Reference Gnedin and Sunyaev1974) and then discovered by Truemper et al. (Reference Truemper1978) in the Her X-1 binary system. These lines were detected in many accreting X-ray pulsars since then, (e.g., Revnivtsev & Mereghetti Reference Revnivtsev and Mereghetti2014) allowing for direct measurements of NS magnetic fields.
For isolated NSs (INS), until recently, absorption features have been seen in X-ray spectra of only a few atypical, radio-silent, pure thermally emitting sources. This includes two low-magnetic-field central compact objects (CCOs) in supernova remnants (SNRs), 1E 1207 − 5209 (Sanwal et al. Reference Sanwal, Pavlov, Zavlin and Teter2002), and PSR J0821 − 4300 (Gotthelf & Halpern Reference Gotthelf and Halpern2009), five objects with larger fields from the ‘Magnificent Seven’ family (e.g., Pires et al. Reference Pires2014, and references therein), and one soft gamma repeater SGR 0418+5729 (Tiengo et al. Reference Tiengo2013). Sole exception is an ordinary middle-aged radio pulsar J1740+1000 (Kargaltsev et al. Reference Kargaltsev, Durant, Misanovic and Pavlov2012).
Since the launch of the Fermi γ-ray observatory, several dozens of new pulsars (Abdo et al. Reference Abdo2013) have been discovered. A substantial number of them are not seen in radio but are identified in X-rays. The radio-quiet PSR J0633+0632 (hereafter J0633) was discovered in a blind search for pulsations in the Fermi-LAT data (Abdo et al. Reference Abdo2009). Among Fermi-pulsars, J0633 is one of the brightest in X-rays, with a flux F X ~ 10−13 erg cm−2 s−1 (Ray et al. Reference Ray2011). A pulsar period P = 297.4 ms and a rotation frequency derivative imply a characteristic age τ = 59.2 kyr, a spin-down luminosity Ė = 1.2 × 1035 erg s−1 and a surface magnetic field B = 4.9 × 10¹² G (Abdo et al. Reference Abdo2013). A distance D ~ 1 kpc was estimated from an empirical relation between γ-ray and spin-down luminosities (Saz Parkinson et al. 2010). In addition, J0633 powers an extended pulsar wind nebula (PWN) visible in X-rays south from the pulsar. Analysing 20-ks Chandra observations, Ray et al. (Reference Ray2011) found that the X-ray spectrum of J0633 contains a thermal component which dominates at low energies and a non-thermal PL component of the NS magnetospheric origin describing the high energy spectral tail.
Re-analysing the Chandra data, we found a hint of an absorption feature in the spectral fit residuals. We argue that this feature is real in Section 2.1 and discuss its possible nature in Section 3.1. In Section 2.2, we analyse the X-ray spectral continuum. We confirm findings of Ray et al. (Reference Ray2011) and extend their analysis by incorporating natural constraints on the interstellar absorption and the distance to the pulsar. We analyse in detail the thermal component and investigate whether it can be attributed to the emission from the entire NS surface or a substantial part of it. In such a case, it is possible to confront inferred temperatures with predictions of NS cooling theories; this is done in Section 3.2. In addition, a speculative birthplace of J0633 is proposed in Section 3.4. If it is real, it provides additional independent constraints on the distance to the pulsar.
2 ANALYSIS OF THE X-RAY DATA
We retrieved the dataFootnote 1 from the Chandra archive. Data mode was VFAINT, exposure mode was TE and the pulsar was exposed on the ACIS-S3 chip. The CIAO v.4.6chandra_repro tool with CALDB v.4.5.9 was used to reprocess the data set. A fragment of the Chandra image of the pulsar field is shown in Figure 1. The pulsar and its extended PWN are clearly seen in the image. We extracted spectra of the pulsar and the PWN in the range of 0.3–10 keV with the CIAOv.4.6specextract tool. For the background, we used a region free from any sources which is shown by the solid rectangle in Figure 1. The PWN spectrum was extracted from the dashed rectangle shown in Figure 1 excluding the pulsar and the point-like background object ‘A’ which overlap with the PWN. The number of counts for the PWN and the background in the same region were 397 and 402, respectively. To extract the pulsar spectrum, we used a circular aperture centred at the pulsar position with the radius of 2.5 arcsec, which ensures maximal signal-to-noise ratio. There are 332 pulsar counts (≳98% of the total number of pulsar counts), two counts of background and two counts of the PWN within the aperture.
Field of J0633 as seen with Chandra/ACIS-S in the 0.3–8 keV range. The image is binned by four ACIS pixels and smoothed with a 4-pixel Gaussian kernel. The pulsar is marked in the image and its PWN adjacent to the pulsar from south is clearly seen. 60 arcsec × 70 arcsec dashed box shows the region used to extract the PWN spectrum. The unrelated background source ‘A’ falling in the extraction region is also marked. The solid rectangle with dimensions of 60 arcsec × 70 arcsec shows the region used for the background extraction. The intensity is given in counts per pixel.

We fitted the pulsar spectrum by an absorbed sum of PL and thermal components using the XSPECv.12.8.2 package (Arnaud Reference Arnaud, Jacoby and Barnes1996). To account for the photoelectric absorption, we used the XSPEC PHABS model with default cross-sections bcmc (Balucinska-Church & McCammon Reference Balucinska-Church and McCammon1992) and abundances angr (Anders & Grevesse Reference Anders and Grevesse1989). For the thermal component, we tried blackbody (BB) and hydrogen magnetic atmosphere models NSA (Pavlov et al. Reference Pavlov, Shibanov, Zavlin, Meyer, Alpar, Kiziloglu and van Paradijs1995) and NSMAX (Ho, Potekhin, & Chabrier Reference Ho, Potekhin and Chabrier2008). Since the number of the pulsar counts is small, binning the spectrum goes at the expense of spectral resolution. Therefore, we used unbinned pulsar spectrum in our analysis. Accordingly, we employed the C-statistic (Cash Reference Cash1979) for fitting, instead of more common χ2.
We performed the fitting by a Markov chain Monte-Carlo (MCMC) sampling procedure assuming uniform prior distribution for model parameters. We employed the affine-invariant MCMC sampler developed by Goodman & Weare (Reference Goodman and Weare2010) and implemented in a python package emcee by Foreman-Mackey et al. (Reference Foreman-Mackey, Hogg, Lang and Goodman2013). For each model, we used a set of 100 MCMC walkers performing 1 500 steps after initial burning, which is large enough considering that typical autocorrelation time (see, e.g., Goodman & Weare Reference Goodman and Weare2010, for details) was of the order of several tens (50–80). This resulted in a set of 150 000 samples in total which was enough to reliably approximate the posterior distribution of the model parameters. Having the sampled posterior distribution, we obtained best-fit estimates and credible intervalsFootnote 2 of the model parameters, and corresponding values of C-statistic.
To assess the goodness of fit for each model, we simulated spectra under the model in question with parameters drawn from the corresponding sampled posterior distribution. Fitting these spectra, we obtained the reference distribution of the C-statistic.Footnote 3 The C-statistic value obtained for the real data was compared with this distribution. Goodness-of-fit tests performed in such a way showed that any one-component model, pure PL or pure thermal, fails to describe the data (for 100% of simulated spectra, the C-statistic is less than observed one). In contrast, all two-component models mentioned above fit the data well, that is, the observed C-statistic value in each case is within one standard deviation from the mean of the corresponding reference distribution. Similarly, we found that an absorbed PL model is consistent with the spectrum of PWN.
2.1. Absorption feature
The pulsar spectrum is shown in the top-left panel of Figure 2 together with the best-fit PHABS × (BB+PL) model. The C-statistic value of 266.9 is also presented in the plot. The corresponding fit residuals are shown in the bottom-left panel of Figure 2. While the unbinned spectrum is used for fitting, the hard-energy part of the spectrum in Figure 2 is binned for illustration purposes.Footnote 4
Chandra/ACIS-S spectrum of J0633 fitted by an absorbed BB+PL (left) and by an absorbed (BB + PL) × GABS models (right). Best-fit models are shown with black solid lines in the top panels. Red and cyan lines show BB and PL model components, respectively. The fit residuals in form of χ2 are shown in the corresponding bottom panels. The absorption line position is shown by the thick bars. Best-fit C-statistic values are shown for both fitting models in the top panels with the values of the fit degrees of freedom given in parentheses.
What attracted our attention, was a hint of an absorption feature in the fit residuals at about 0.8 keV. The approximate feature position is marked by the thick bars in the top panels of Figure 2. There are at least five consecutive channels which seem to stay apart from the best-fit model. We thus added the Gaussian absorption (GABS) component to the model and refitted the data. The pulsar spectrum with the new best-fit model and corresponding fit residuals are shown in the top-right and bottom-right panels of Figure 2, respectively. The new fit gives better C-statistic value of 254.1. Similar effect was observed for all continuum models we had tested.Footnote 5
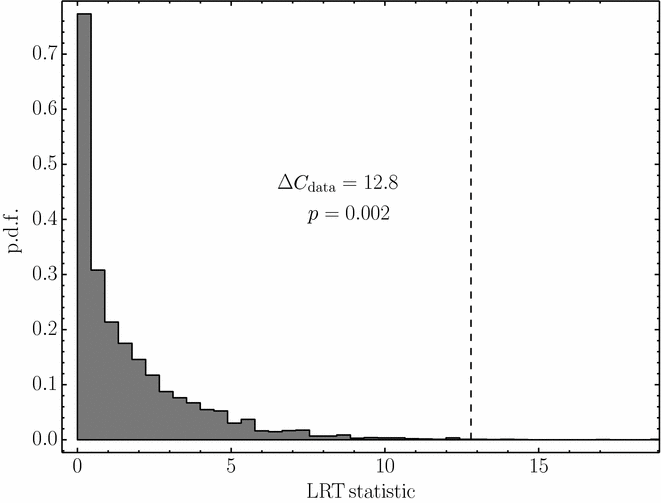
The difference in the C-statistic values between the models with and without the line is ΔC = 266.9 − 254.1 = 12.8. In order to estimate the statistical significance of the fit improvement, we constructed the appropriate reference distribution for ΔC, or likelihood ratio test (LRT) statistic, in a manner similar to the procedure of assessing the goodness of fit. We simulated spectra under the model without line (the null model), drawing parameters from the corresponding posterior distribution sampled via MCMC. We then fitted simulated spectra with the null model and the model with line (the trial model) and computed the corresponding ΔC or LRT statistic. The LRT distribution basing on 5 000 data sets simulated with BB+PL as a null model is shown in Figure 3, where ΔC = 12.8 obtained for the data is shown by the vertical dashed line. It is seen, that only for 9 out of 5 000 simulations the improvement in C-statistic was greater than 12.8. This means that such an improvement can hardly happen by chance if the null model is the true one. This statement can be quantified by the posterior predictive p-value, that is, a fraction of simulations with the LRT larger than the observed one. In our case, p-value is 0.002 which favours the absorption line presence. Similar analysis performed with other continuum models resulted in p-values of the same order of magnitude. This method is known as a method of posterior predictive p-values, the Bayesian model checking approach recommended by Protassov et al. (Reference Protassov, van Dyk, Connors, Kashyap and Siemiginowska2002). In particular, Protassov et al. (Reference Protassov, van Dyk, Connors, Kashyap and Siemiginowska2002) argue that this method is superior to the more common F-test in assessing the presence of additional model component. We refer the reader to, e.g., Gelman et al. (Reference Gelman, Carlin, Stern, Rubin, Chatfield, Tanner and Zidek2003), for a textbook description of the method.
Probability density function (p.d.f.) for the likelihood ratio test (LRT) statistic, that is, the difference in the C-statistic for the BB+PL and (BB + PL) × GABS fits for 5 000 simulated data sets. Vertical dashed line indicates the observed LRT statistic ΔC data = 12.8. The corresponding p-value is also shown, see text for details.
The best-fit spectral line parameters and their uncertainties extracted from MCMC are presented in Table 1. Here, we use the Gaussian line model which contains three parameters and is given by the following expression
 $$\begin{equation}
{\rm GABS}(E)=\exp \left( - \frac{\tau }{\sqrt{2\pi }\sigma } \, {\rm e}^{-\frac{(E-E_0)^2}{2\sigma ^2}}\right),
\end{equation}$$
$$\begin{equation}
{\rm GABS}(E)=\exp \left( - \frac{\tau }{\sqrt{2\pi }\sigma } \, {\rm e}^{-\frac{(E-E_0)^2}{2\sigma ^2}}\right),
\end{equation}$$
where E is the photon energy, E 0 is the line centre, σ is related to the full width at half maximum (FWHM) of the line as FWHM ≈ 2.35σ, and parameter τ regulates the line depth. Then, the optical depth at line centre is  $\tau /(\sqrt{2\pi }\sigma )$. A more direct measure of a line strength is the equivalent width (EW) which is defined by the following expression
 $$\begin{equation}
\mathrm{EW} = \int \limits _{-\infty }^{+\infty } \left(1-\mathrm{GABS}(E)\right)\, \mathrm{d}E.
\end{equation}$$
$$\begin{equation}
\mathrm{EW} = \int \limits _{-\infty }^{+\infty } \left(1-\mathrm{GABS}(E)\right)\, \mathrm{d}E.
\end{equation}$$
The main advantage of EW is that it is weakly dependent on the particular shape of the spectral feature. For the Gaussian line in the optically thin regime (τ/σ ≪ 1), EW ≈ τ.
Median values of the absorption feature parameters with BB+PL as a continuum model.

90% credible intervals for the line centre E 0 and equivalent width EW are given, while 99.9% limits for the line depth τ and the width σ are presented.
In Figure 4, we show one- and two-dimensional (1D and 2D) marginal posterior distributions for the line parameters. As seen, E 0 is well constrained around 0.8 keV. The median value of E 0 along with the 90% credible interval is presented in Table 1. Unfortunately, the situation is different for the line width and depth. Figure 4 reveals a bimodal, worm-like, 2D posterior distribution for σ and τ parameters. This bi-modality is also seen in the 1D distributions for these parameters. The ‘worm’ head and body correspond to different types of the absorption line. The worm-body mode corresponds to a strong saturated line with the width smaller than the Chandra/ACIS-S spectral resolution (FWHM ~ 100 eVFootnote 6). The fit quality is then determined by the wings of the line, which results, as can be shown analytically, in a strong degeneracy between the line width and depth giving the long worm-body valley in the likelihood distribution. On the other hand, the worm head corresponds to a broader and weaker line. With the present data, we cannot discriminate between these possibilities. Therefore, only the upper limit on σ and lower limit on τ are given in Table 1. At the same time, EW is well constrained as seen from Figure 4 and Table 1 which can be regarded as the most straightforward argument in favour of the line.
1D and 2D marginal posterior probability distributions for the line parameters (line central energy E 0, width σ, depth τ, and equivalent width EW) in the (BB + PL) × GABS model. The 5%, 50%, and 95% quantiles are shown with vertical-dashed lines in the 1D distributions.
Note that the above results are almost independent on the particular continuum model used to fit the pulsar spectrum. In addition, they remain qualitatively the same if models other than GABS are used to fit the absorption feature, for instance, the models for a cyclotron absorption line (CYCLABS in XSPEC) or an ionisation edge (EDGE in XSPEC).
The Bayesian analysis shows that the chances are low that the absorption feature is caused by Poisson fluctuations of the data counts. It may be an instrumental artifact though. It would thereby be appropriate to examine if there are similar features in spectra of other sources in the Chandra/ACIS-S field of view. However, all other point sources are substantially dimmer than the pulsar, showing no more than several tens of counts, and analysis of their spectra is not conclusive. We also examined the spectrum of the PWN (see Figure 5). Unfortunately, the PWN spectrum is more noisy at the soft energies than the pulsar spectrum due to much higher background. There is no line seen here, at least at the first sight. Indeed, we got improvement in statistic of only ΔC ≈ 1.5 after fitting the PWN spectra with the PL × GABS model with E 0 of about 0.8 keV. The posterior-predictive p-value test gives no evidence against the featureless continuum model with p-value ≈ 0.43. We also checked that there were no flares during observations which could distort the spectrum. Accordingly, the background spectrum is in agreement with the quiescent spectrum of the diffuse soft X-ray background as seen with Chandra/ACIS (Markevitch et al. Reference Markevitch2003).
Chandra/ACIS-S spectrum of the J0633 PWN fitted by an absorbed PL. The spectrum is binned to ensure ⩾ 1 counts per bin. The absorption line position is shown by the thick bar.
2.2. X-ray continuum
In this section, we employ the same Bayesian technique to analyse the properties of the X-ray continuum assuming the presence of the line. We will not explicitly indicate this further for brevity.
Main problems arising during the analysis of the X-ray emission from NSs come from unknown distances D and interstellar absorption towards these objects. In order to get better constrains on the latter, we now fit simultaneously the pulsar and the PWN spectra, tying the value of the hydrogen column density N H between the fits. Recall that the PWN spectrum is well described by an absorbed PL, while the pulsar spectrum contains thermal and non-thermal components. For the thermal component, as already mentioned above, we tested simple BB as well as several magnetised hydrogen atmosphere models. All latter give similar results, therefore we selected a particular model from NSMAX family, labelled 1 260 (see Ho et al. Reference Ho, Potekhin and Chabrier2008). The reason for selection of this model is twofold. First, NSMAX models account for the partial ionisation in the NS atmospheres which makes their usage more physically motivated for low temperatures in comparison with older NSA models. Second, the 1 260 model corresponds to the surface magnetic field of 5 × 10¹² G which is close to the J0633 value as inferred from P– $\dot{P}$ observations assuming dipole losses. Any atmospheric model depends on the NS surface gravity. In the NSMAX models, this is incorporated via the gravitational redshift parameter 1 + z. In our fit, we fixed 1 + z = 1.21 which corresponds to a reasonable NS model with a mass M NS = 1.4 M⊙ and a circumferential radius R NS = 13 km. The apparent NS radius as seen by a distant observer in that case is R = (1 + z)R NS ≈ 16 km. We have checked that the redshift parameter is not constrained by the data and does not influence the final results. We also note that, due to effects of general relativity, the NSMAX model can be applied only for describing the emission coming from the entire surface of the NS, while the BB model can be used to describe the emission from any part of the stellar surface.
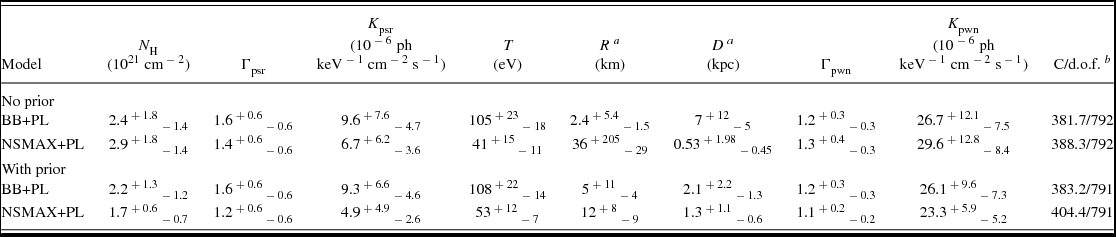
In first two rows of Table 2, we show best-fit parameters of the BB+PL and NSMAX+PL models with uncertainties corresponding to 90% credible intervals. The latter were inferred from marginal Bayesian posterior distributions as described above. These results are consistent with those of Ray et al. (Reference Ray2011) and we thereby confirm their findings. The values of C-statistic are also shown in Table 2.
Best-fit spectral parameters for continuum models.
Temperatures T and emitting area radii R are given as measured by a distant observer. Redshift parameter for NSMAX models is fixed at 1.21. Γ and K are the photon index and the normalisation of the PL component. All errors correspond to 90% credible intervals derived via MCMC. For models in two last lines, an informative prior which includes information on the N H–D correlation is applied, see text for details. a In the ‘no prior’ case, R is given assuming D = 1 kpc and D is given assuming R = 16 km. b The number of degrees of freedom is different from those given in Figure 2 because here the PWN spectrum is included.
It is instructive to consider which part of the posterior parameters distribution can describe the physically allowed situation (in the selected model framework). In particular, can the fit results for the thermal component correspond to the emission originating from the entire NS surface or a part of it? In Figure 6, we plot 1D and 2D marginal posterior distributions for the parameters of BB and NSMAX models, which are N H, temperature T, and the normalisation of the thermal component. For both models, the temperature is given as measured by a distant observer. The thermal component normalisation is presented in the form of the distance to the pulsar if the apparent radius of the emitting area is R = 16 km. As seen, the minimisation of the likelihood leads to correlation between N H and normalisation of the thermal component and thus to anti-correlation between N H and distance D. In contrast, these latter quantities obviously correlate in nature. It is unlikely to have a high N H value at a small distance and vice versa.
Top: 1D and 2D marginal posterior distributions for N H, T, and D in the BB+PL model without the prior. Distance D is shown in units of R 16km. The solid, dashed, and dot-dashed lines in N H–D frames show the empirical relations assuming R = 16 km, 1 km, and 20 km, respectively. See text for details. Vertical dashed lines in 1D distributions show 5%, 50%, and 95% quantiles. Bottom: The 1D and 2D marginal posterior distributions for N H, T, and D in NSMAX+PL model without prior. Other options are the same as in the top panel. The temperature T is redshifted for a distant observer.
There exist empirical models which provide dependence of interstellar absorption on distance. Such models usually describe the correlation between distance and optical extinction AV. The latter can be transformed to N H using one of the empirical relations between AV and N H, for instance, the one given by Predehl & Schmitt (Reference Predehl and Schmitt1995). To obtain the relation between AV and distance in the pulsar direction, we made use of the three-dimensional model of Galactic extinction from Drimmel, Cabrera-Lavers, & López-Corredoira (Reference Drimmel, Cabrera-Lavers and López-Corredoira2003) and also took into account the value of maximal N H in the pulsar direction, ~ (6–7) × 1021 cm−2 (Dickey & Lockman Reference Dickey and Lockman1990; Kalberla et al. Reference Kalberla, Burton and Hartmann2005). This information can be roughly summarised in a simple relation N H [1021 cm−2] ≈ D [kpc] at D < 7 kpc. We present this relation in the D–N H plate in Figure 6 with solid, dashed, and dot-dashed lines assuming R = 16, 1, and 20 km, respectively. The latter value is a reasonable theoretical maximum for the NS apparent radius. Consider, for example, the BB model. As can be seen, 16 km radius is consistent with the data. The corresponding D–N H relation crosses the marginal posterior distribution not far from its maximum. The star in this case appears to be at about 2.5 kpc from the Sun and has the temperature of about 100 eV. If the apparent radius is 1 km, our analysis leads (dashed line) to N H ≈ 1021 cm−2 and hence places J0633 at D ≈ 1 kpc. In this case, the inferred temperature should be higher, more than 120 eV. The radii much lower than 1 km would give worse fits and are unlikely. The portion of the posterior distribution of parameters lying down-right from the dot-dashed line in Figure 6 corresponds to unrealistic R > 20 km. This means that although the fit is formally good there, the BB model with such parameters cannot describe thermal emission from the NS surface. Looking at the N H–T and D–T plots, we conclude that too low temperatures are impossible, however, the corresponding regions are broad and this restriction is rather weak. Similar analysis can be performed for the NSMAX model. In this case, most of the posterior distribution corresponds to the region with R > 20 km. However, radii of the order of 10 km are still allowed, giving N H ≈ 1.5 × 1021 cm−2 and D ≈ 1.5 kpc. This shrinks the possible temperature range (in contrast to BB model). As clear from Figure 6, temperature is constrained at T ≳ 40 eV and N H ≲ 2 × 1021 cm−2. Again, the low-temperature part of the posterior distribution requires too high emitting area radii. Finally, as seen from the plot, the 1 km radius is too small if the NSMAX model is applied.
The Bayesian approach provides natural framework for inclusion of the additional information, such as the D–N H relation discussed above, by defining the appropriate prior distribution. Moreover, it easily allows to take into account uncertainties in the prior knowledge. Using this possibility, we incorporated the D–N H relation as the Bayesian prior in the following way. We made a conservative assumption that the relation N H [1021 cm−2] ≈ D [kpc] is accurate up to a factor of two. In principle, the central values are more likely, and a bell-shaped form of the prior, for instance, Gaussian would be appropriate. However, as the exact variances of the D–N H relations are unavailable for us, we used the following flat prior: 0.5D [kpc] < N H [1021 cm−2] < 2D [kpc]. In addition, we constrained D to be less than 7 kpc, which is the approximate distance to the edge of the Galactic disk in the pulsar direction. The application of such prior naturally splits the thermal normalisation into two independent parameters, D and R. We also constrained the latter to be less than 20 km.
The best-fit parameters inferred with account for the prior are shown in third and fourth rows of Table 2. Both BB and NSMAX models pass the goodness-of-fit test. The marginal 1D and 2D posterior distributions for N H, T, D, and R are shown in Figure 7. We can see how the prior works, comparing Figure 7 with Figure 6. The distance is now constrained by the prior relation and N H, and the constrains on R are obtained from D and the thermal component normalisation. The parameters in Table 2 generally agree with the qualitative considerations presented above. We see that both BB and NSMAX models are consistent with the physical picture where emission comes from the entire surface of the star. For the BB model, however, the star should be somewhat more distant and more absorbed than in case of the NSMAX model. The hot-spot (of about 1 km size) interpretation is also not excluded under the BB model. As it usually happens, the best-fit BB temperature is about twice higher than that for a hydrogen atmosphere model (e.g., Pavlov et al. Reference Pavlov, Zavlin, Sanwal, Burwitz and Garmire2001).
1D and 2D marginal posterior distributions for N H, T, R, and D in the BB+PL model (top) and the NSMAX+PL model (bottom), with account for the prior. Other options are the same as in Figure 6.
3 DISCUSSION
3.1. Absorption feature
The analysis performed in Section 2.1 favours presence of the absorption feature in J0633 spectra at about 0.8 keV. Unfortunately, the shape of the feature is poorly constrained with the current data, precluding us from plausible interpretation of its nature. The first possibility to consider is the cyclotron line. The cyclotron absorption line position, as seen by a distant observer, for a particle of charge Z and mass m is given by
 $$\begin{equation}
E_{\rm cycl}^{\infty }=11.577 (1+z)^{-1} Z \frac{m_e}{m} B_{12}\ {\rm keV},
\end{equation}$$
$$\begin{equation}
E_{\rm cycl}^{\infty }=11.577 (1+z)^{-1} Z \frac{m_e}{m} B_{12}\ {\rm keV},
\end{equation}$$
where me is the electron mass and the line is assumed to form at the NS surface. Now, we can estimate a surface magnetic field as B ≈ 8 × 10¹⁰ G if the line is produced by electrons and B ≈ 1.4 × 10¹⁴ G if it is produced by protons, and even higher values for more massive ions. Both values are inconsistent with the spin-down estimate of the dipole magnetic field, B = 4.9 × 10¹² G. The ‘cyclotron’ field is much lower in case of electrons and much higher in case of protons.
Note that for other INS showing absorption lines, spin-down magnetic fields, when determined, usually disagree with ‘cyclotron’ magnetic fields. For SGR 0418+5729 and PSR J1740+1000, the discrepancy is as strong as for J0633. In these cases, the proton cyclotron line interpretation is possible, for instance, if there are strong small-scale (multipolar) surface components of the magnetic field. The presence of the small-scale fields is widely discussed in literature (e.g., Asseo & Khechinashvili Reference Asseo and Khechinashvili2002; Harding & Muslimov Reference Harding and Muslimov2011, and references therein). Tiengo et al. (Reference Tiengo2013) suggested this interpretation for the spectral feature of SGR 0418+5729. They, however, had additional arguments from the phase-resolved spectral analysis which is unavailable in case of J0633. A somewhat similar feature was recently detected in the spectrum of INS RX J0720.4 − 3125 (Borghese et al. Reference Borghese, Rea, Coti Zelati, Tiengo and Turolla2015). The feature is at ~ 750 eV which corresponds, if interpreted as the proton cyclotron line, to the magnetic field about seven times higher than the spin-down one.
On the other hand, Kargaltsev et al. (Reference Kargaltsev, Durant, Misanovic and Pavlov2012) proposed that the absorption feature in PSR J1740+1000 is the electron cyclotron line which is produced by a population of warm electrons occupying some regions in the pulsar magnetosphere similar to Van Allen belts in the Earth magnetosphere. If we adopt this interpretation for the line in J0633 and assume that the magnetic field approximately obeys the dipole law, B∝r −3, we can estimate the position of the magnetospheric radiative belt as r ≈ 4R NS, or about 30–40 km above the NS surface.
For the remaining objects, the disagreement is less dramatic. The CCO 1E1207 − 5209 shows at least two features in the X-ray spectrum. Its low spin-down magnetic field suggests the electron cyclotron interpretation. However, the position of the fundamental harmonic estimated from the spin-down value is larger by a factor of 1.4 than the position of the strongest spectral feature (Gotthelf, Halpern, & Alford Reference Gotthelf, Halpern and Alford2013). Finally, for INSs from the magnificent seven group, spin-down magnetic fields are lower by a factor of 1.1–7.2 than proton cyclotron magnetic fields estimates, with the best agreement achieved for RX J1308.6+2127 (Pires et al. Reference Pires2014).
Another possible explanation of the absorption feature suggests that it results from atomic transitions either in the stellar atmosphere or in the interstellar medium. Varying abundances in the model for the interstellar photoelectric absorption, we found that the feature could be explained assuming overabundance of Fe along the pulsar line of sight. It is, in principle, possible, as the J0633 position projects onto the Monoceros Loop nebulosity, see Figure 8, which was recognised as an SNR from observations in radio, optical, and X-rays (Davies Reference Davies1963; Gebel & Shore Reference Gebel and Shore1972; Davies et al. Reference Davies, Elliott, Goudis, Meaburn and Tebbutt1978; Leahy, Naranan, & Singh Reference Leahy, Naranan and Singh1985). The distance to the remnant is not exactly known, however most of the estimates suggests a value of approximately 1.6 kpc (e.g., Borka Jovanović & Urošević Reference Jovanović and Urošević2009, and references therein) providing an SNR shell diameter of about 0.1 kpc. This distance together with our estimates for the J0633 distance (Table 2) allows the pulsar to be behind the SNR and suffer from an additional absorption of the SNR origin. However, to obtain a good fit for the J0633 spectrum, too large Fe/H ≈ 3 × 10⁻⁴ is required, which is about ten times as large as the solar one. To provide such a high abundance of Fe on average along the pulsar line of sight, abundance of Fe in the Monoceros Loop SNR itself should be at least 100 times the solar abundance, which seems implausible. Additionally, such a strong modification of the interstellar absorption should also affect the PWN spectrum, however, as stated above, we did not find any signature of spectral features there. Finally, if the absorption feature is formed in the mid-Z atmosphere of NS, then generally broader and weaker features are expected (Mori & Ho Reference Mori and Ho2007).
Hα image of the Monoceros Loop region in Galactic coordinates taken from the Southern H-Alpha Sky Survey Atlas: H-Alpha (Gaustad et al. Reference Gaustad, McCullough, Rosing and Van Buren2001). The Monoceros Loop SNR is marked by the dashed circle. The position of the pulsar and its possible proper motion direction are shown by × and the arrow, respectively. The Rosette nebula suggested as its likely birthplace is pointed on.
3.2. J0633 in the view of the NS cooling theories
According to the Table 2 and Figure 7, the J0633 thermal emission can originate from the entire stellar surface. In this case, it is instructive to compare the results with the NS cooling theories. It is worth doing, according to Table 2, for both BB and NSMAX models, although the inferred surface temperatures are different. This comparison is performed in Figure 9, where the positions of J0633 on T–τ plane are shown for both models along with the data for other cooling isolated NSs. The data on the latter objects are taken from the references collected by Yakovlev et al. (Reference Yakovlev, Gnedin, Kaminker, Potekhin, Bassa, Wang, Cumming and Kaspi2008) and Kaminker et al. (Reference Kaminker, Potekhin, Yakovlev and Chabrier2009), excluding upper limits, with addition of several sources. The additional sources include PSR J1741 − 2054 (Karpova et al. Reference Karpova, Danilenko, Shibanov, Shternin and Zyuzin2014), PSR J0357+3205 (Kirichenko et al. Reference Kirichenko, Danilenko and Shibanov2014), PSR J0007+7303 in the CTA 1 SNR (Caraveo et al. Reference Caraveo2010; Lin et al. Reference Lin2010), and two CCOs, where carbon atmosphere is used to describe their thermal radiation. These are CCO in the Cas A SNR (Yakovlev et al. Reference Yakovlev, Ho, Shternin, Heinke and Potekhin2011), the youngest source in Figure 9 and CCO XMMU J173203.3 − 344518 (Klochkov et al. Reference Klochkov, Suleimanov and Pühlhofer2015), the hottest source in Figure 9. For the latter source, we combined temperatures for both distances given in Klochkov et al. (Reference Klochkov, Suleimanov and Pühlhofer2015), and multiplied the temperature errorbars by a factor of 2 to estimate 2σ errors. In Figure 9, with cyan colour we show point obtained with BB model, and with blue colour points obtained with various atmospheric models, see the above cited references for details. In Figure 9, we also artificially adopt a factor of two uncertainty on J0633 age. It is seen, that if J0633 is covered by the atmosphere, it is the one of the coldest middle-aged (τ ≲ 105 yr) isolated NS with measured surface temperature. If, in contrast, the BB model actually fit the data, the inferred temperature is much higher.
Observations of isolated cooling NSs vs. cooling theory predictions. Temperatures obtained utilising the BB model are shown with the cyan colour, and those obtained with various atmospheric models are shown with the blue colour. The J0633 data points for BB and NSMAX models are shown by the star symbols. Dashed lines present the cooling curves corresponding to standard cooling of 1–1.9M⊙ NSs with the APR EOS. The filled region corresponds to a possible range of standard cooling curves including the unrealistically compact equations of state. Upper and lower solid curves illustrate the effects of the nuclear superfluidity in the NS core. Upper curve correspond to strong proton superfluidity suppression of the cooling, while lower curve is calculated including also Cooper pair formation emission from the triplet neutron superfluid. See text for details.
According to theory, isolated NSs cool down via the neutrino emission from their interiors and via the photon emission from their surfaces. The middle-aged stars are of particular interest as they have isothermal interiors, except a thin heat blanketing layer near the surface, and their cooling is dominated by neutrino emission (e.g., Yakovlev & Pethick Reference Yakovlev and Pethick2004). Measurements of surface temperatures of such stars allow one to determine the neutrino cooling rate and therefore to directly explore the properties of matter deep inside the star. By the filled region in Figure 9, we show the predictions from the so-called standard NS cooling scenario which assumes that a star has nucleon core and cools mainly via the modified Urca processes of neutrino emission. According to Yakovlev et al. (Reference Yakovlev, Ho, Shternin, Heinke and Potekhin2011), the standard cooling mainly depends on the compactness of the star x = Rg/R NS, where Rg is the gravitational radius, or equivalently on the gravitational redshift 1 + z = (1 − x)−1/2, being largely independent on the particular NS model. More compact stars generally cool faster. This property allows to estimate the neutrino cooling rate of a particular middle-aged star without performing cooling simulations. The filled region corresponds to a broadest possible region that can be reached with the standard cooling (note that here the standard iron heat-blanketing envelope is used). It includes also the cooling curves corresponding to highly unrealistic EOS, which allow for extremely compact stars (for details see Yakovlev et al. Reference Yakovlev, Ho, Shternin, Heinke and Potekhin2011). For comparison, in Figure 9 with short-dashed lines, we present the cooling curves for stars with a particular EOS in the core, that is the causal modification (same as used by, e.g., Yakovlev et al. Reference Yakovlev, Ho, Shternin, Heinke and Potekhin2011) of the APR EOS (Akmal, Pandharipande, & Ravenhall Reference Akmal, Pandharipande and Ravenhall1998), widely used as a standard. The curves are given for a range of NS masses from 1.0 to 1.9M⊙ per 0.1 solar mass, plus the curve for the maximal mass Mmax = 1.929M⊙ for this EOS. The direct Urca process is, in principle, allowed in the massive stars with APR EOS, but here it is switched off. The standard cooling curves for other reasonable EOSs basically fall in the same region. In other words, the part of the filled region which is colder than the lowest dashed curve is reached in the standard cooling scenario in principle, but is marginal.
Following the method described in Yakovlev et al. (Reference Yakovlev, Ho, Shternin, Heinke and Potekhin2011), we found that the neutrino cooling rate of J0633 should be 30–1 000 times stronger than the standard one, if the NSMAX model is applied, for a reasonable star compactness x < 0.5, and with account for a factor of two uncertainty in the pulsar age. Only for unrealistically compact stars, x ≈ 0.7, the inferred NSMAX temperature can be reached in the standard cooling models. A moderate increase in the neutrino cooling rate ≲ 100 can be explained by the minimal cooling theory which includes also the neutrino emission in the process of Cooper pair formation in triplet neutron superfluid in the NS core (Page et al. Reference Page, Lattimer, Prakash and Steiner2004; Gusakov et al. Reference Gusakov, Kaminker, Yakovlev and Gnedin2004). We illustrate this possibility with lower thin solid line in Figure 9. It corresponds to a 1.7M⊙ APR EOS star and similar superfluidity model as used by Shternin et al. (Reference Shternin, Yakovlev, Heinke, Ho and Patnaude2011) in explanation of the data on the NS in Cas A SNR. Too small temperature is hardly possible in the minimal cooling scenario. Nevertheless, in any case low temperatures of cooling NSs can be explained if the direct Urca processes are allowed in their cores. However, in order to get the temperatures like J0633 has, assuming NSMAX spectral model, these processes have to be suppressed, for instance, by superfluidity (Yakovlev & Pethick Reference Yakovlev and Pethick2004). Otherwise, the enhancement of the neutrino emission will be too strong.
For the BB model, the neutrino cooling rate, in contrast, should be much weaker. We find that it must be suppressed by a factor of 10–300. The lowering by a factor ≲ 50 is also possible in the minimal cooling scenario if strong proton superfluidity is involved which suppresses the conventional mUrca processes, and if the internal temperature of the star is hotter than the neutron superfluidity critical temperature so that Cooper pair emission does not operate (Gusakov et al. Reference Gusakov, Kaminker, Yakovlev and Gnedin2004). This is illustrated in Figure 9 with the upper solid line which corresponds to 1M⊙ star with the APR EOS and strong proton superfluidity in the core. This curve fits nicely the BB data. Another possibility allowed in the cooling theory is that the heat-blanketing envelope of the star contains sufficient amount of the light elements. Then, the envelope is more transparent to heat and the star looks hotter than the star with the same internal thermal state, but iron (non-accreted) envelope (Chabrier, Potekhin, & Yakovlev Reference Chabrier, Potekhin and Yakovlev1997). However, in the latter case the hydrogen (or other light-element, for instance, carbon) atmosphere would be more appropriate than BB to describe the emission spectra. Also, the star will look hotter if magnetic field as strong as ≳ 1014 G is present in the heat-blanketing envelope (Potekhin et al. Reference Potekhin, Yakovlev, Chabrier and Gnedin2003). Finally, some additional heating mechanisms can operate in the stellar interiors (e.g, Yakovlev & Pethick Reference Yakovlev and Pethick2004).
The inferred parameters of the BB model allow a different interpretation of the NS thermal emission. It is possible that it actually comes from a hot spot on a colder NS surface which is heated by charged particles coming from the magnetosphere along the magnetic field lines near the magnetic poles. The conventional polar cap radius for J0633 can be estimated as R cap = 0.145(R NS[106cm])3/2(P[s])−1/2km ≈ 400 m. This is inconsistent with the spectral fit results (Table 2), however the 1–2 km emitting area radii are possible. This range of radii correspond, according to Figure 7, to the temperatures > 125 eV and smallest possible distances of about 1–1.5 kpc. Note that these values are favoured by the pseudo-distance relation, and also by the possible birthplace of the pulsar in the Rosette nebula, see below. In the hot spot picture, inferred temperature cannot be compared with the cooling theories. The bulk of the surface is then cold and invisible in X-rays.
3.3. Non-thermal efficiencies and luminosities
The distance ranges inferred from the spectral fits (Table 2) allow to constrain the non-thermal luminosities of J0633 and its PWN. In Table 3, we give the 2–10 keV X-ray fluxes of the PWN, F pwnX and the non-thermal (PL) spectral component of the pulsar, F psrX, for both spectral models usedFootnote 7. As expected, these values almost do not depend on the type of the thermal continuum model (BB or NSMAX). Corresponding non-thermal luminosities L pwnX and L psrX are also given in Table 3 along with the values of efficiencies η Xpsr = L Xpsr/Ė and η Xpwn = L Xpwn/Ė. These values show some dependence on a choice of the spectral model because in the two models the inferred distance ranges are slightly different (Table 2). In any case, the parameters of the X-ray non-thermal emission in Table 3 are not peculiar in comparison with those for other pulsars with similar Ė (Kargaltsev & Pavlov Reference Kargaltsev, Pavlov, Bassa, Wang, Cumming and Kaspi2008; Danilenko et al. Reference Danilenko, Kirichenko, Sollerman, Shibanov and Zyuzin2013). In addition, in Table 3, we show J0633 γ-ray luminosities L psrγ and corresponding efficiencies η γpsr = L γpsr/Ė. They are calculated basing on the pulsar γ-ray flux F psrγ = (9.4 ± 0.5) × 10−11 erg cm−2 s−1 (Abdo et al. Reference Abdo2013). Note that for large distances, D ≳ 3 kpc, allowed for the BB+PL model (Table 3), the γ-ray efficiency is higher than 1. However, there are γ-ray pulsars with precisely measured distances which have ηγ > 1 (Abdo et al. Reference Abdo2013). The apparent violation of the energy conservation law is usually resolved by account for unknown beaming of the γ-ray emission.
Non-thermal fluxes, luminosities, and efficiencies.

X-ray fluxes, luminosities, and efficiencies are calculated in the 2–10 keV range.
3.4. Presumed birthplace
The J0633 PWN morphology and extent (Figure 1) is reminiscent of, for instance, a well-studied bowshock ‘Mouse’ nebula (G359.23 − 082) powered by the fast-moving PSR J1747 − 2958 (e.g., Hales et al. Reference Hales, Gaensler, Chatterjee, van der Swaluw and Camilo2009). The similarity with the Mouse suggests the direction of a proper motion of J0633 as shown by the long arrow in Figure 1. Adopting a typical synchrotron cooling time of X-ray emitting electrons in PWNe of ~ 1 000 yr (e.g., Kargaltsev et al. Reference Kargaltsev, Misanovic, Pavlov, Wong and Garmire2008) and the J0633 PWN tail size of 1.3 arcmin (see Figure 1), we estimated the pulsar proper motion as 80 mas yr−1, suggesting the pulsar angular displacement of 1.3° during its lifetime of ~ 60 kyr. Looking backwards the assumed proper motion direction on the extended field of view (Figure 8), we found a likely birthplace of the pulsar at the estimated angular displacement—the Rosette nebula. It is known as a young, 50 Myr, active star forming region located at the edge of the Monoceros Loop SNR. The distance to the Rosette of ~ 1.5 kpc (Ogura & Ishida Reference Ogura and Ishida1981) is compatible with the J0633 distance estimates, discussed above. Looking from the other side, adopting the Rosette nebula as a likely birthplace we can independently estimate the distance to the pulsar. Taking into account the conservative uncertainties of a factor of two for the pulsar age and angular distance to its specific birth location inside the Rosette nebula, and assuming that the pulsar 3D velocity is smaller than 2 000 km s−1 (e.g. Hobbs et al. Reference Hobbs, Lorimer, Lyne and Kramer2005), we obtain a distance range of 1.2 < D < 1.8 kpc adopting the distance to the Rosette nebula of 1.4–1.6 kpc. This range is consistent with that derived from the spectral analysis and does not put additional constraints on the thermal emission models.
4 CONCLUSIONS
We have analysed in detail the X-ray spectrum of the γ-ray pulsar J0633+0632. We found the evidence of the narrow absorption feature in its spectrum at 804+42−26 eV with the EW of 63+47−36 eV, where errors are at 90% confidence. While the shape of the feature cannot be constrained with the current data, the failure of any smooth continuum model in vicinity of 0.8 keV is statistically proven. We briefly discussed possible physical interpretations of the detected feature and currently favoured the cyclotron nature.
Apart from the spectral feature, we investigated the properties of the X-ray continuum. We confirmed the conclusion by Ray et al. (Reference Ray2011) that the soft part of the J0633 spectrum is dominated by the thermal component, and the hard tail is described by the non-thermal PL. We went further and took into account the correlation between the distance to the pulsar and the interstellar absorption along the J0633 line of sight on the basis of the empirical distance-extinction maps. It was included in the form of the prior distribution for the model parameters. In addition, the PWN spectrum was fitted simultaneously with the pulsar spectrum, allowing to better constrain the N H parameter. As a result of this analysis, we found that the thermal emission possibly originates from the entire surface of the star and its spectrum can be equally well described by the BB or the magnetised hydrogen atmosphere models. In the BB case, the hot spot origin of the thermal emission is also possible. The distance to the pulsar was constrained within 1–4 kpc range basing on the X-ray spectral analysis. This is especially important, as the dispersion measure distance is unavailable for the radio-silent J0633.
Confronting the inferred temperatures with the data on other cooling NSs and predictions from NS cooling theories, we found that for the atmospheric spectral model, J0633 is one of the coldest middle-aged NS with measured temperature. In this case, it must cool considerably faster than the standard cooling scenarios predict. In contrast, if the spectrum of the substantial part of the NS surface is BB, then J0633 is hotter than a standard cooling NS.
In addition, we found a possible birth site of the pulsar—the Rosette nebula. This, along with the shape of the PWN, suggests that J0633 can have prominent proper motion. At the moment, these findings do not impose additional constrains on the pulsar properties. When this paper was in preparation, deeper observations of J0633 with XMM-Newton were approved for the AO-14 observational cycle. If these observations are performed, more elaborate consideration of the absorption feature origin and nature of the continuum emission will be possible. The detection of X-ray pulsations will be especially useful to attribute the thermal emission to a small hot region or to the entire surface of the NS. The study of the variation of the absorption feature with the rotational phase is also important to explore its origin and, if the feature is a cyclotron line, magnetic field geometry (Kargaltsev et al. Reference Kargaltsev, Durant, Misanovic and Pavlov2012; Tiengo et al. Reference Tiengo2013; Borghese et al. Reference Borghese, Rea, Coti Zelati, Tiengo and Turolla2015). The observations will also allow to find out which of the two models, BB or hydrogen atmosphere, is more appropriate to describe the pulsar spectrum. If the future data will favour the atmosphere model and will confirm that the surface temperature is as low as it follows from the current data, then it will result in important consequences for understanding the physics of the neutrino emission in dense cores of NSs.
ACKNOWLEDGEMENTS
The scientific results reported in this paper are based on data obtained from the Chandra Data Archive, observations made by the Chandra X-ray Observatory. We thank Dima Barsukov and Serge Balashev for helpful discussion. YS acknowledges support from the Russian Foundation for Basic Research (grants 13-02-12017-ofi-m, 14-02-00868-a). The work of AD, DZ, and AK was supported by RF Presidential Programme MK-2837.2014.2. The modelling of the NS cooling scenarios in Sec. 3.2 was performed by PS under the support of the Russian Science Foundation, project 14-12-00316.