

1. Introduction
Farmland prices considerably increased during the last decade in many countries around the world (Borchers, Ifft, and Kuethe, Reference Borchers, Ifft and Kuethe2014; European Union, 2018; U.S. Department of Agriculture, National Agricultural Statistics Service, 2016). In Germany, farmland prices more than doubled from €8,909 to €22,310/ha on average between 2006 and 2016. Meanwhile, mobility of farmland remained relatively stable at approximately 0.7% of total agricultural area sold per year. On average, 2.08 hectares was sold per transaction. However, the German agricultural land market is characterized by significant regional differences. Characteristics of the farmland market considerably differ between West and East Germany. In West Germany, less farmland and smaller parcels are sold, but farmland is much more expensive. Price variation becomes obvious at federal state level. In 2016, prices ranged from the lower bound of about €10,000/ha in federal states such as Saarland and Thuringia to the upper bound of up to €40,000 and €50,000/ha in North Rhine-Westphalia (NRW) and Bavaria, respectively (Federal Statistical Office [Destatis], 2017a). Within some federal states, price variation is even higher. Farmland rental rates showed a similar development, even though relative price increases were smaller. Therefore, in combination with a low mobility, the access of land through the rental market is also challenging. Moreover, owing farmland has advantages for farmers such as planning security and flexibility, property rights, and better access to capital.
Some stakeholders of farmland markets have critically noted that the recent farmland price level is already much higher than the earning capacity per hectare for many farmers. To ensure that farmland will still be affordable for farmers, they advocate for political interventions like price caps and sufficient deterrents for farmland market entry by nonagricultural investors (Federal Government Working Group [BLAG], 2015). In a recently published communication, the European Commission recognizes the increasing problems on the farmland market as well as the needs for regulation. Furthermore, the European Commission (2017) confirms that regulations of the farmland market by national law, which currently ranks high on the political agenda of a number of countries, are consistent with European legislation under certain conditions. The communication underlines the current relevance of the topic and the need for further research. This is particularly true for Germany as governments of several federal states are currently working on stricter regulations for the farmland market, which also include the objective to prevent or at least to limit further price increases. Hence, there should be considerable political interest in factors influencing farmland prices to create the best possible regulations.
Because of a vast body of related literature, Hüttel et al. (Reference Hüttel, Odening, Kataria and Balmann2013) argued that the main farmland price determinants have already been recognized. However, these studies mainly applied regression methods that estimate conditional means of farmland prices given the explanatory variables. This means significant price determinants, which have already been found, initially apply only to the mean farmland price. However, as the proposed stronger interventions include price caps for agricultural land, the interest of our study primarily lies in the most important price drivers of the more expensive farmland rather than only of average farmland prices. Hence, from an agricultural policy perspective, we are especially concerned with the upper tail of the conditional farmland price distribution, and in particular with the significant price-increasing covariates in this specific segment of the conditional distribution.
We analyze the municipal-level standard farmland values (SFVs) for arable land of the German federal state NRW. It provides a favorable study area to empirically analyze various factors influencing farmland values as it is characterized by considerably heterogeneous manifestations of potential agricultural and nonagricultural explanatory variables (e.g., soil quality, livestock production, and urban sprawl). However, this also means that the locational conditions for agriculture vary significantly across regions. The implication of this is that the impacts of the explanatory variables may vary along the conditional distribution of farmland values (Nilsson and Johansson, Reference Nilsson and Johansson2013) leading to the problem that the resulting estimates of various effects on the conditional mean may not necessarily be indicative of the size and nature of these effects on the upper tail of the conditional farmland price distribution (März et al., Reference März, Klein, Kneib and Musshoff2016). Moreover, different coefficient estimates at different conditional quantiles would be a manifestation that a pure location shift model (like ordinary least squares [OLS] regression) is inadequate, and a model also allowing scale shifts is needed to explain the relationship between farmland prices and their influencing factors (Mishra and Moss, Reference Mishra and Moss2013). For example, an explanatory variable could only be significant in the upper tail, but not in the rest of the conditional distribution. This could result in an insignificant effect when estimating the conditional mean (e.g., by conventional least squares regression). Hence, if only the significant explanatory variables on the conditional mean are considered when developing stricter regulations to limit farmland price increases, the measurement could be ineffective and inefficient or, in the worst case (if the direction of the effect is adversely in the upper quantiles), will lead to counteracting incentives.
Conditional quantile regression enables us to analyze particular segments of the conditional distribution of farmland values. Hence, by estimating a set of conditional quantile functions we are able to uncover potential heterogeneities of the estimated covariate effects across the conditional distribution of farmland values (Koenker, Reference Koenker2005).Footnote 1 Conditional (on the model covariates) means we want to examine if a specific farmland attribute has a different impact on higher-priced parcels relative to lower-priced parcels that are otherwise similar in all characteristics.
An alternative approach would be an unconditional quantile regression as proposed by Firpo, Fortin, and Lemieux (Reference Firpo, Fortin and Lemieux2009). According to the authors, unconditional quantile regression allows researchers to measure the effect of a small change in the covariate X on the quantiles of the unconditional distribution of the dependent variable Y. Looking at the impact of a particular covariate on farmland values, say soil quality, illustrates well the difference between conditional and unconditional quantile regressions. Following Firpo, Fortin, and Lemieux (Reference Firpo, Fortin and Lemieux2009), finding that the positive effect of soil quality estimated using unconditional quantile regressions is smaller at the 90th than at the 10th quantile means that an increasing soil quality reduces the overall farmland price dispersion as measured by the difference between the 90th and the 10th quantiles of the unconditional farmland price distribution. However, we are not interested in the effect of soil quality on the overall price dispersion, but in the effect on the within-group price dispersion, where the “group” consists of land parcels that share the same values of all the covariates other than soil quality (conditional effect). To answer this question, we have to turn to conditional quantile regression. Here, finding that the positive effect of soil quality is smaller at the 90th than at the 10th quantile means that an increasing soil quality reduces within-group dispersion. Consequently, finding covariates with higher effects at the upper quantiles using conditional quantile regressions means that these covariates increase within-group dispersion, and hence, this would be an indication that stronger interventions with the objective to limit further farmland price increases should particularly take these covariates into account.
Previous studies indicate that it is reasonable to assume that farmland prices are influenced by different determinants in the upper and lower tail of the conditional distribution compared to mean prices (Kostov, Reference Kostov2009b; Mishra and Moss, Reference Mishra and Moss2013; Nilsson and Johansson, Reference Nilsson and Johansson2013). With regard to this parameter heterogeneity, Uematsu, Khanal, and Mishra (Reference Uematsu, Khanal and Mishra2013) hypothesized that the attributes of farmland can be divided into “luxury” and “necessity.” The luxury attributes may only have an impact at the relatively higher price range, whereas the necessary attributes may only affect prices at the lower price range. Their results showed that residential natural amenities (climate conditions, topography, and proximity to water area), which are rather luxury than necessity attributes, positively affected farmland values, but the impact was often more pronounced at the higher price range.
Despite its advantages, conditional quantile regression is still not commonly used to analyze the German farmland market. Thus, the current combination of proposed price caps and the lack of conditional quantile regression analyses of German farmland values reveals a knowledge gap. Our study tries to fill this gap by analyzing German SFVs for arable land by means of conditional quantile regression.
2. Related Literature Showing the Benefits of Quantile Regression
Quantile regression models are increasingly applied in studies dealing with house prices. These studies found substantial variations of the impacts of housing characteristics across the quantiles. These factors included square footage and number of bathrooms (Zietz, Zietz, and Sirmans, Reference Zietz, Zietz and Sirmans2008), school proximity and scenic view (Kim et al., Reference Kim, Park, Lee and Xue2015), proximity to environmental externalities such as animal agricultural facilities (Kuethe and Keeney, Reference Kuethe and Keeney2012), spatial dependence (Liao and Wang, Reference Liao and Wang2012), location within a floodplain (Zhang, Reference Zhang2016), and areas with land subsidence and earth fissures (Yoo and Frederick, Reference Yoo and Frederick2017).
Despite its growing application in the real estate sector, quantile regression is less frequently used in agricultural economics literature (Uematsu, Khanal, and Mishraet, Reference Uematsu, Khanal and Mishra2013). Kostov (Reference Kostov2009b) used a spatial quantile regression for analyzing agricultural land sales in Northern Ireland. He found two relatively separate segments of the farmland market. The larger one conformed to the conventional hedonic model with no spatial lag dependence. In contrast, considerable spatial lag dependence was observed at the higher quantiles of the dependent variable, which suggested the hedonic model broke down here. The author also showed that a significantly positive impact of a potential building site within the land parcel was only pronounced at the very high quantiles (i.e., in the more expensive parcels of land). He traced this back to the fact that nonagricultural opportunities would, in general, be more profitable than purely agricultural use of this land. In contrast, no significant effects of the land-quality variables were found at the higher quantiles. Nilsson and Johansson (Reference Nilsson and Johansson2013) included the number of seasonal homes as a proxy for rural amenities and the accessibility to population for analyzing Swedish agricultural land prices and showed that these nonagricultural factors seemed to be more important in regions that have conditionally high prices, whereas income support to farmers seemed to be most influential in regions with conditionally low prices. Mishra and Moss (Reference Mishra and Moss2013) analyzed the effects of off-farm income, farm subsidies, and location of farms on farmland values in the United States using a quantile regression approach. Most effects of the land attributes varied considerably across the quantiles, both in terms of magnitude and direction. Off-farm income, direct farm payments, and a farm's location in a metropolitan county had a positive and significant effect on farmland values, and the magnitude of the coefficients increased monotonically across quantiles. McMillen (Reference McMillen2015) used a conditionally parametric version of a quantile regression and showed significant quantile effects with particularly high land values near the urban center and along the transport network in the United States. März et al. (Reference März, Klein, Kneib and Musshoff2016) used a Bayesian geoadditive quantile regression to analyze German farmland rental rates and found some noticeable instances of heterogeneity across quantiles, particularly for the estimated effects of livestock density, share of rented agricultural land, and share of rented arable land. In a recent study, Peeters, Schreurs, and van Passel (Reference Peeters, Schreurs and van Passel2017) analyzed the impact of soil contamination on Belgian farmland prices using an unconditional quantile regression and found a significant negative impact of cadmium pollution, but only in the middle range of the distribution. They argued that the heterogeneous impact of soil pollution can be directly related to the variety of amenities that farmland provides (e.g., agricultural production, open space/recreation, and rural living).
All these studies clearly demonstrate that a quantile regression approach provides richer information of the relationship between farmland prices and farmland characteristics that otherwise would have been left unnoticed by using conventional least squares regression.
3. Implicit Price Variation of Farmland Characteristics
Our conceptual framework is the hedonic pricing model. For the discussion of the theoretical foundation, we closely follow Palmquist (Reference Palmquist, Braden and Kolstad1991) and Ready and Abdalla (Reference Ready and Abdalla2005).
According to Rosen's (Reference Rosen1974) hedonic pricing model, the price of a heterogeneous good like farmland is determined by a unique set of attribute levels, x = (x 1, x 2, . . ., xn). In particular, x is a vector of agricultural and nonagricultural attributes related to farmland. Hence, the price for which the parcel of land sells is a function of its characteristics:
 $$\begin{equation}
P = P\left( x \right).
\end{equation}$$
$$\begin{equation}
P = P\left( x \right).
\end{equation}$$
The hedonic pricing function, P(x), describes the equilibrium set of farmland prices, given the population of buyers and the available supply of farmland in a competitive market.Footnote 2 The determination of the hedonic price schedule in the market can be explained by considering the behavior of prospective buyers of farmland. Prospective buyers differ according to a vector of socioeconomic characteristics, α. A typical buyer maximizes the utility U(z, x 1, . . ., xn; α) from the consumption of the farmland attributes x and a composite good z. Thereby, U is subject to the budget constraint y = z + P(x 1, . . ., xn), where y represents the buyer's income. The first-order conditions for this optimization problem require that the marginal implicit price for each single farmland attribute xn, equals the marginal rate of substitution between attribute xn and the composite good z:
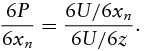 $$\begin{equation}
\frac{{6P}}{{6{x_n}}} = \frac{{6U/6{x_n}}}{{6U/6z}}.
\end{equation}$$
$$\begin{equation}
\frac{{6P}}{{6{x_n}}} = \frac{{6U/6{x_n}}}{{6U/6z}}.
\end{equation}$$
For marginal changes in xn, then, the marginal implicit price of xn measures the buyer's marginal willingness to pay for additional xn.
For a parcel of land, the hedonic pricing function in equation (1) can be written as a stochastic equation:
 $$\begin{equation}
{P_i} = {\beta _0} + {\beta _1}{x_{1i}} + {\beta _n}{x_{ni}} + {\rm{ }}{\varepsilon _i},{\rm{ }}for{\rm{ }}I{\rm{ }} = {\rm{ }}1,{\rm{ }} \ldots ,I,
\end{equation}$$
$$\begin{equation}
{P_i} = {\beta _0} + {\beta _1}{x_{1i}} + {\beta _n}{x_{ni}} + {\rm{ }}{\varepsilon _i},{\rm{ }}for{\rm{ }}I{\rm{ }} = {\rm{ }}1,{\rm{ }} \ldots ,I,
\end{equation}$$
where Pi is the per hectare price for parcel i, x is the vector of the n characteristics of farmland, β is the vector of marginal implicit prices to be estimated, and ei is an error term.
The traditional hedonic approach in equation (3) assumes that the structure is stable across the geographic area and thus that the geographic area can be treated as a single market (Huang et al., Reference Huang, Miller, Sherrick and Gómez2006; Patton and McErlean, Reference Patton and McErlean2003). Under this assumption, conventional least squares regression can be used to estimate equation (3) for identifying the implicit prices. However, violation of this assumption can cause misleading results because equilibrium prices may differ from market to market for the same set of attribute levels (Huang et al., Reference Huang, Miller, Sherrick and Gómez2006). Indeed, with regard to the empirical literature cited previously, concerns exist whether the assumption of a single market holds.
For the sake of argument, we assume that there are two prospective buyers of farmland: On the one hand, there is a farmer who needs the farmland for agricultural production. Thus, his willingness to pay is mainly oriented on or constrained by the agricultural value of farmland. The agricultural value is determined by factors affecting the profitability of agriculture. On the other hand, there is a nonagricultural investor who does not face comparable constraints and his objectives for buying farmland differ (e.g., he may need the farmland for investment diversification, reduction of inflation risks, or speculative purposes). Further, we take into account that farmland prices can be broken down into expected returns from land in its current agricultural use and expected returns from its potential use. As soon as the potential of land conversion to a more profitable nonagricultural land use is only expected by the nonagricultural investor, two segmented markets can be developed (one farmland market for purely agricultural purposes and one farmland market for nonagricultural use of land). Segmentation may not only imply that the farmer and the investor buy farmland of different values, but they may also have group-specific likes and dislikes of certain farmland characteristics (Zietz, Zietz, and Sirmans, Reference Zietz, Zietz and Sirmans2008). This can be a result of different socioeconomic characteristics α and related differences in preferences. For example, soil quality and proximity to the farm are of prior interest for the farmer because soil quality directly affects the earning capacity of the parcel and the proximity between the parcel and the farm indirectly affects the earning capacity through lower transportation costs. The nonagricultural investor is not interested in the proximity of land to his business place because he does not manage the parcel on his own and may only have limited knowledge of how to assess the soil quality. Consequently, the marginal rate of substitution between a farmland attribute xn and the composite good z in equation (2) may differ for the farmer and the investor. This results in two different implicit prices for the farmland attribute xn. For r different groups of buyers, the hedonic pricing model in equation (3) becomes
 $$\begin{eqnarray}
{P_{ri}} &=& {\beta _r}_0 + {\beta _r}_1{x_{ri}}_1 + {\beta _{rn}}{x_{rin}} + {\varepsilon _{ri}},{\rm{ for}}\;i = {\rm{ }}1,{\rm{ }} \ldots ,I\;{\rm{and }}\nonumber\\
&& r = {\rm{ }}1,{\rm{ }} \ldots ,R\;{\hbox{market segments}}.
\end{eqnarray}$$
$$\begin{eqnarray}
{P_{ri}} &=& {\beta _r}_0 + {\beta _r}_1{x_{ri}}_1 + {\beta _{rn}}{x_{rin}} + {\varepsilon _{ri}},{\rm{ for}}\;i = {\rm{ }}1,{\rm{ }} \ldots ,I\;{\rm{and }}\nonumber\\
&& r = {\rm{ }}1,{\rm{ }} \ldots ,R\;{\hbox{market segments}}.
\end{eqnarray}$$
In equation (4), the marginal contribution of the different characteristics to the value of farmland is allowed to vary according to the market segment r (Patton and McErlean, Reference Patton and McErlean2003). However, segmenting the dependent variable into subsets can create biased parameter estimates (Heckman, Reference Heckman1979). For farmland, the determination of market segments is particularly challenging because of the heterogeneity of parcels, buyers, and sellers. In principle, it is reasonable to assume that the preference structure differs among all of the prospective buyers, or, put another way, we can assume that each individual puts a different value on a farmland attribute depending on the characteristics of each individual (e.g., farmer, investor), the individual perception of the farmland attributes (Mishra and Moss, Reference Mishra and Moss2013; Uematsu, Khanal, and Mishra, Reference Uematsu, Khanal and Mishra2013), and subjective future expectations (März et al., Reference März, Klein, Kneib and Musshoff2016).
As stated previously, quantile regression is an appropriate approach to reveal such differences in the preference structure as it allows the implicit prices to vary across the conditional distribution of farmland prices. Moreover, because quantile regression employs the full data set, a market segment selection problem does not arise in the first place (Kim et al., Reference Kim, Park, Lee and Xue2015).
4. Data
Our study area is the federal state NRW located in northwestern Germany (see Figure 1). The dependent variable is the SFV for arable land as a small-scale indicator for farmland prices. Based on legal regulations, regional appraisers determine the SFV annually and report their findings for a defined zone consisting of broadly similar parcels according to the farmland characteristics. The SFV is an average value of nearly all farmland sales obtained from the data on purchasing prices of the real estate appraiser board in NRW. Only arm's length transactions are considered. Unfortunately, the entire data on purchasing prices are not available to the public in general and for science institutions in particular. Thus, the SFV is usually the best available variable for research purposes in Germany. For this analysis, data for the years 2010 to 2013 are available. Figure 1 illustrates the spatial distribution of the SFV for arable land in 2013 at the municipal level for the study area. The mean SFV for arable land is €37,640 per hectare, ranging from €9,100 to €76,000 per hectare. Despite a cluster of the highest SFV in the northwest, there is a gradient from high values in the north and west to low values in the southern and eastern peripheral areas. With this variation of SFV, NRW is an excellent representative of Germany's farmland markets.
Standard Farmland Values (SFV) for Arable Land at the Municipal Level in North Rhine-Westphalia in 2013 (source: illustration based on GeoBasis-DE/BKG, 2015b)

Descriptive statistics for the SFV and the covariates used in the hedonic pricing model are given exemplarily for 2013 in Table 1. Land use characteristics are available from the Federal Statistical Office NRW (Landesdatenbank NRW, 2017), and the soil quality index is obtained from the Geological Service of NRW. The average slope of agricultural land was generated based on altitudes given by the digital terrain model of the German Federal Agency for Cartography and Geodesy (BKG) (GeoBasis-DE/BKG, 2015a) and the land use map of the German Federal Institute for Geosciences and Natural Resources (BGR, 2015). The share of two different protected areas (NSG, WSG) was calculated by intersecting the respective map from the State Office for Nature, Environment and Consumer Protection NRW (LANUV, 2015) with the map of administrative regions from the BKG (GeoBasis-DE/BKG, 2015b). Payments for agroenvironmental measures (AUM) were obtained from the published information on recipients of European Union direct payments for the year 2013 (Federal Office for Agriculture and Food [BLE], 2015). Data on biogas and wind power plants in NRW are published by the transmission system operators Amprion and Tennet TSO. The location of the respective plant operator was used as an approximation for the site of the plant. Data on livestock production, number of farms, and the share of full-time farms were obtained from the agricultural census in 2010 (Landwirtschaftszählung, 2010). Factors relating to urban influence were obtained from the database of the Federal Statistical Office NRW (Landesdatenbank NRW, 2017) and the Regional Database Germany (Destatis, 2017b). Distances to cities with at least 100,000 inhabitants (criterion for large cities) were calculated via OpenStreetMap. The distance was measured between the centroids of the municipality and the city. The fastest road distances to all of the large cities were calculated for each municipality, and in each case the shortest distance was selected.
Descriptive Statistics for the Municipal Level Variables for North Rhine-Westphalia in 2013

a The high maximum value stems from a land use change (fallow to grassland) in the small municipality of Augustdorf (size: 10 hectares) in the year 2009. There are five similar small municipalities, where higher increases of utilized agricultural area (+15% to +89%) were observed because of land use changes. However, only 5% of all analyzed municipalities had an increase in the amount of land. This is demonstrated by the negative mean value of this variable.
Source: Calculations based on aforementioned sources.
5. Method
According to our conceptual framework, the implicit prices of farmland characteristics are expected to vary across the conditional distribution of farmland prices. The quantile regression, first proposed by Koenker and Bassett (Reference Koenker and Bassett1978), enables us to statistically examine the extent of this variation across the conditional distribution of SFVs. Unlike OLS regression, quantile regression minimizes the sum of weighted absolute deviations to estimate parameter coefficients for any quantile in the range 0 < τ < 1 conditional on the explanatory variables as
 $$\begin{equation}
\hat{\beta }\left( \tau \right) = \mathop {\min }\nolimits_{\beta \in {R^K}} \left[ {\mathop \sum\nolimits_{i \in \left\{ {i:{y_i} \ge {x_i}\beta } \right\}} \tau \left| {{y_i} - {x_i}\beta } \right| + \ \mathop \sum\nolimits_{i \in \{ i:{y_i} < {x_i}\beta \} } \left( {1 - \tau } \right)\left| {{y_i} - {x_i}\beta } \right|} \right].
\end{equation}$$
$$\begin{equation}
\hat{\beta }\left( \tau \right) = \mathop {\min }\nolimits_{\beta \in {R^K}} \left[ {\mathop \sum\nolimits_{i \in \left\{ {i:{y_i} \ge {x_i}\beta } \right\}} \tau \left| {{y_i} - {x_i}\beta } \right| + \ \mathop \sum\nolimits_{i \in \{ i:{y_i} < {x_i}\beta \} } \left( {1 - \tau } \right)\left| {{y_i} - {x_i}\beta } \right|} \right].
\end{equation}$$
Symmetric weights of the absolute residuals yield the median (τ = 0.5), whereas minimizing the sum of asymmetrically weighted absolute residuals with different weights being placed on positive and negative values yields other quantiles (e.g., τ = 0.1 or 0.9) (Koenker and Hallock, Reference Koenker and Hallock2001). The objective function (equation 5) is not differentiable, but the minimization problem can be solved by linear programming using the simplex method (Koenker, Reference Koenker2005; Uematsu, Khanal, and Mishra, Reference Uematsu, Khanal and Mishra2013).
The conditional quantile function for y given a set of explanatory variables X can be written as
 $$\begin{equation}
{Q_\tau }(y|X) = X\beta (\tau |X) + u\quad \quad {\rm{for}}\,\,{\rm{any}}\,\,{\rm{quantile}}\,\,{\rm{\tau }} \in \left( {0,1} \right),
\end{equation}$$
$$\begin{equation}
{Q_\tau }(y|X) = X\beta (\tau |X) + u\quad \quad {\rm{for}}\,\,{\rm{any}}\,\,{\rm{quantile}}\,\,{\rm{\tau }} \in \left( {0,1} \right),
\end{equation}$$
where y is an nx1 vector of the SFV for arable land in euros per hectare (n = number of observations), Qτ(y|X) is the τth quantile of y conditional on the nxk covariance matrix X that includes agricultural and nonagricultural as well as time dummy variables (k = number of explanatory variables), β(τ|X) is a τ-dependent associated kx1 vector of regression coefficients, and u represents the residuals.
However, the quantile regression model in equation (6) does not account for spatial effects (spatial dependence and spatial heterogeneity) that may be present in the data (Anselin, Reference Anselin1988). Different motivations exist to include spatial effects, which are elaborately described in LeSage and Pace (Reference LeSage and Pace2009). One of their motivations is model uncertainty, which usually applies to hedonic pricing models. According to Kostov (Reference Kostov2009a, Reference Kostov2009b), trade-offs arise between spatial dependence and choice of functional form in (agricultural land) price models in the sense that incorrect functional form assumptions can induce spurious spatial dependence or at least “increase” spatial dependence. Nonparametric approaches admit at the start that the true model structure is unknown (McMillen, Reference McMillen2012) and, hence, would avoid the problem of spurious spatial dependence. However, relatively small data sets used in empirical modeling or the complexity of these models (e.g., large numbers of covariates) make nonparametric estimation approaches often unfeasible. A spatial quantile regression is a semiparametric estimation method, which at least allows us to alleviate the potential problem of spurious spatial dependence (Kostov, Reference Kostov2009b).Footnote 3
For the farmland sale market, several studies have already identified the existence of spatial effects. Hence, in recent years spatial process models have been favored for analyses of farmland price determinants, and substantial improvements of model fit are shown (Dillard et al., Reference Dillard, Kuethe, Dobbins, Boehlje and Florax2013; Feichtinger and Salhofer, Reference Feichtinger and Salhofer2016; Huang et al., Reference Huang, Miller, Sherrick and Gómez2006; Hüttel et al., Reference Hüttel, Odening, Kataria and Balmann2013). For a spatially fixed asset like farmland, there are several reasons why spatial dependence can exist.Footnote 4 Spatial dependence can occur in the dependent variable because of spillover effects. In the case of farmland, prices in one municipality can be influenced by realized prices in neighboring areas. This effect arises because buyers typically act as competitors for land within a defined radius around their farms (Breustedt and Habermann, Reference Breustedt and Habermann2011; Hennig and Latacz-Lohmann, Reference Hennig and Latacz-Lohmann2017). Another reason is that prospective buyers refer to reference prices of comparable and nearby lots on which to base their bids (Hüttel and Wildermann, Reference Hüttel and Wildermann2015; Maddison, Reference Maddison2009). To account for such spatial spillovers and to obtain unbiased regression coefficients, a spatial lag model should be applied by using the average neighboring price as an additional explanatory variable (Anselin, Reference Anselin1988). However, to be able to use a price of a comparable lot as a reference, the reference price must be observable before the respective price formation starts (Hüttel and Wildermann, Reference Hüttel and Wildermann2015). Hence, we define a row-standardized queen-contiguity spatial weight matrix for generating the spatial lag variable such that the SFV of arable land for a municipality is only determined by the SFVs of adjacent municipalities (according to the queen criterion), which are observed before the respective SFV is determined. As a result, we include a spatiotemporally lagged SFV and treat it as an exogenous explanatory variable. Analyzing the years from 2010 to 2013, for example, the SFV for a municipality in 2013 can only be influenced by SFVs of adjacent municipalities of the years 2010 to 2012. Consequently, the results are only based on the years 2011 to 2013, because we cannot calculate a spatiotemporally lagged SFV for the year 2010. We further account for the time dimension by means of two time dummy variables representing the years 2012 and 2013, respectively. The Moran's I test confirms the existence of spatial autocorrelation in the data (Moran's I = 0.689, P < 0.0000), and the robust version of the Lagrange multiplier (LM) test indicates that spatial dependence in the dependent variable has to be considered (robust LM for spatial lag = 144.91, P < 0.0000).
Accordingly, our hedonic pricing model using a quantile regression framework is given by
 $$\begin{equation}
{Q_\tau }(y|X) = \ {\rho _{{\rm{lag}}}}\left( {\tau |X} \right)Wy + X\beta (\tau |X) + u,
\end{equation}$$
$$\begin{equation}
{Q_\tau }(y|X) = \ {\rho _{{\rm{lag}}}}\left( {\tau |X} \right)Wy + X\beta (\tau |X) + u,
\end{equation}$$
where W is an nxn spatial weight matrix that defines the relevant neighborhood of each observation by simultaneously considering the time constraints and ρ lag is the respective coefficient for the exogenously treated spatiotemporally lagged SFV. Now both the regression coefficient β(τ) and the estimation parameter ρ lag(τ) are τ-dependent. Because the spatiotemporally lagged variable is treated as an exogenous variable, the conventional quantile regression estimator of Koenker and Bassett (Reference Koenker and Bassett1978) will be consistent. We used the modified version of the Barrodale and Roberts (Reference Barrodale and Roberts1980) algorithm to estimate the conditional quantile regression model, which is described in detail in Koenker and d'Orey (Reference Koenker and d'Orey1987, Reference Koenker and d'Orey1994). The standard errors of the coefficient estimates are computed using bootstrapping (xy-pair method, 200 bootstrap replications).
6. Results
The analysis of the estimation results of the spatiotemporal quantile regression model is twofold. On the one hand, we use a graphical representation for the results to give a complete picture of the covariate effects across the conditional distribution of the SFVs for arable land in NRW. We estimate the quantile process from 0.1 to 0.9 in increments of 0.01. Figures 2 and 3 show the estimated coefficients of the quantile regression process together with their 95% confidence intervals. For comparison, the estimated coefficients and confidence intervals of OLS regression are also plotted. We do not show and describe the plots for the intercept and the insignificant variables. On the other hand, Table 2 shows the estimation results for OLS regression and a subset of selected quantiles to give an overview of the numerical implications of factors influencing SFVs and to compare the coefficients of both methods.
Quantile Plots for Estimated Coefficients of Agricultural Factors Influencing Standard Farmland Values in North Rhine-Westphalia (notes: quantile regression indicated by black solid line, quantile regression confidence interval of 95% indicated by gray shaded area, ordinary least squares [OLS] regression indicated by black dash-and-dot line, OLS regression confidence interval of 95% indicated by black dotted line, and zero line indicated by gray solid line; source: own estimation)

Quantile Plots for Estimated Coefficients of the Time Dummy Variables, the Spatiotemporal Lag, and Nonagricultural Factors Influencing Standard Farmland Values in North Rhine-Westphalia (notes: UAA indicates utilized agricultural area, quantile regression indicated by black solid line, quantile regression confidence interval of 95% indicated by gray shaded area, ordinary least squares [OLS] regression indicated by black dash-and-dot line, OLS regression confidence interval of 95% indicated by black dotted line, and zero line indicated by gray solid line; source: own estimation)

Ordinary Least Squares (OLS) and Quantile Regression Estimates of Factors Influencing Standard Farmland Values in North Rhine-Westphalia
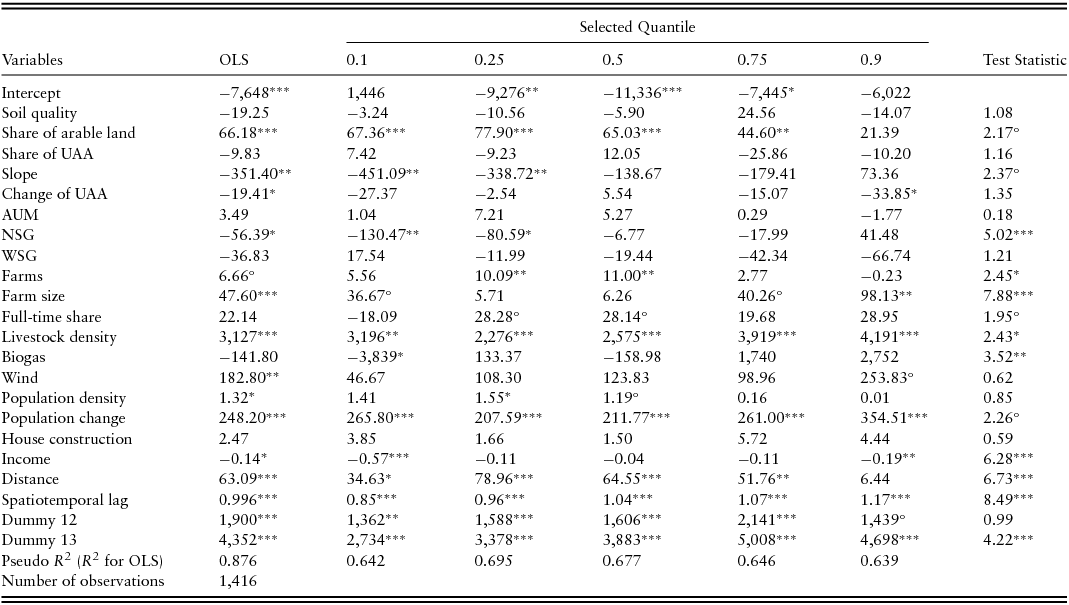
Notes: Symbols (°, *, **, ***) indicate significance at the 10%, 5%, 1%, and 0.1% level, respectively. R command “rq” is used for estimation (Koenker, Reference Koenker2017). UAA: utilized agricultural area.
Source: Own estimation.
Figure 2 shows the estimation results for the covariates of agricultural characteristics. The share of arable land reveals some differences between both methods. The OLS regression shows the expected significant positive impact because of its indication of good agricultural production conditions and higher returns associated with cropland (Hüttel et al., Reference Hüttel, Odening, Kataria and Balmann2013). An increase of 10% in the share of arable land causes the SFVs for arable land to increase by €660 per hectare. In the quantile regression estimation, the effect varies across the quantiles. In the lower half of the conditional distribution, the positive impact is comparable to or partly higher than the OLS regression (€650–€780 per hectare premium for a 10% increase in the share of arable land), but then the effect steadily decreases until it becomes insignificant in the highest quantiles. This finding reveals that covariates with varying effects across the conditional distribution of SFVs exist. The plots of the covariates’ slope and share of nature reserve show a similar result. An increase of both variables indicates less favorable conditions for agricultural production in terms of higher production costs as a steep land slope can hamper the use of heavy machinery or sometimes exclude the cultivation of certain crops (e.g., maize) (Schmidtner, Dabbert, and Lippert, Reference Schmidtner, Dabbert and Lippert2015), and the associated regulations with nature reserves restrict the allowed production intensity (Mährlein, Reference Mährlein2017). These relationships are confirmed by the significantly negative coefficients in the OLS regression. An increase of 1% results in a price discount of €350 per hectare for the slope of land and of €56 per hectare for the share of nature reserves. Again, the quantile regression estimates reveal a more differentiated picture. Both factors only negatively affect the SFVs in the lower half of the conditional distribution. A 1% increase of slope decreases the SFV by €340 to €450 per hectare, while the same change of the share of nature reserve results in a price discount by €80 to €130 per hectare. Hence, all three land characteristics are only significant or at least more pronounced in the lower half of the conditional distribution, and the lowest quantile (0.1-quantile) reveals stronger effects compared with OLS regression.
The number of farms is not significant at a 5% level in the OLS regression, whereas the quantile regression shows a significant positive impact in the middle of the conditional distribution. Here, an increase of competition by 10 farms lets the SFVs for arable land increase by €100 per hectare. The positive impact of the full-time share in this part of the distribution (only significant at the 10% level) indicates that this competition mainly stems from full-time farms requiring additional land for successful continuation of their agricultural business. The farm size positively influences the SFVs for arable land based on the OLS regression. A growth of 10 hectares per farm results in an increase of €480 per hectare. In the quantile regression, such an effect can only be detected in the upper tail of the conditional distribution, but there, the impact is twice as high. This result indicates that the lower half of the conditional price distribution might be dominated by local competition for land between diverse farms. However, for prices is the upper tail of the conditional distribution, only larger farms might be able to compete with other farmland buyers because of economy of scales and related higher willingness to pay of these farms.
Livestock density has a strong price-increasing impact on SFVs for arable land regardless of the estimation method. However, once more, the quantile regression gives a more complete picture in that it shows that the positive impact is much stronger in the higher quantiles. An increase of one livestock unit per hectare results in an increase of SFVs by €3,127 per hectare according to the OLS regression. With an increase by €4,191 per hectare in the 0.9-quantile for a one-unit increase in livestock density, the price-increasing impact is about one-third higher. The positive correlation mainly stems from high returns of livestock production and several German legal regulations that encourage livestock farmers to pay high farmland prices for additional land, particularly in regions characterized by a high agglomeration of poultry and swine farms like in NRW.
Figure 3 shows the estimated coefficients of the time dummy variables, the spatiotemporal lag, and nonagricultural factors influencing SFVs. As expected, given the considerable increase of farmland prices during the last decade (Destatis, 2017a), both dummy variables for the years 2012 and 2013 have a significant positive impact. In the OLS regression, SFVs increased by €4,300 per hectare in 2013, which is twice as high compared with 2012. Looking at the quantile regression provides additional information. Although the price-increasing effect is relatively stable in 2012, the effect increases across the conditional distribution for 2013. Hence, conditionally high farmland prices have additionally undergone higher price increases in 2013. The spatiotemporally lagged variable is positive and significant in both estimation methods. The coefficient is close to 1 in the OLS regression indicating that an increase in the average neighboring SFV by €1 per hectare raises the SFV in the respective municipality by 99.6 euro cents per hectare. The quantile regression shows a continually increasing effect over the quantiles. In the upper tail of the conditional distribution, the coefficient exceeds 1, which also reflects stronger price increases of the conditionally higher SFVs during the period considered. At this point, we note that we compared the estimation results with the results of the semilog model specification (transformation of logarithm is used for the SFV and its spatiotemporal lag, but not for the right-hand sight variables; not shown here) to check the robustness of the estimation results. The variation of the spatiotemporal lag effect differs between both models, while the impacts of the other explanatory variables remain relatively unchanged. In the semilog model, the coefficient of the spatiotemporal lag reaches its maximum in the middle of the conditional distribution. Hence, the spatial relationship between the SFV and its neighboring values (as defined in this study) is not clear and has to be interpreted with caution. However, both model specifications show a positive and significant impact of the neighborhood.
The impact of nonfarm factors can be separated into two price-increasing effects of urban sprawl: conversion of farmland to urban uses and speculative effects as represented by farmland conversion risk (Livanis et al., Reference Livanis, Moss, Breneman and Nehring2006). The impact of change of utilized agricultural area is the first piece of evidence regarding the impact of nonagricultural land use. Loss of utilized agricultural area is mainly caused by land use because of the development of new settlement and transport areas. Although the OLS regression shows a significantly negative impact, resulting in a price-increasing impact of €20 per hectare if farmland is lost by 1%, the quantile regression shows such an effect only in the highest quantiles. Here, a 1% loss of farmland causes the SFVs to increase by €30 per hectare. The exclusive significance in the 0.9-quantile indicates that nonagricultural land use is more pronounced in the upper tail of the conditional distribution of SFVs. Population change as an indicator for the speculative component supports this finding. Although its impact is significantly positive in both estimation methods, the impact becomes stronger in the upper tail of the conditional distribution according to the quantile regression. A population growth of 1% leads to an increase of SFVs by €248 per hectare in the OLS regression compared with an increase by €355 per hectare in the 0.9-quantile. The price-increasing impact of nonagricultural land use was also found in previous studies analyzing the impact of urban sprawl (Cavailhès and Thomas, Reference Cavailhès and Thomas2013; Livanis et al., Reference Livanis, Moss, Breneman and Nehring2006). In contrast, population density only positively influences the SFVs in the 0.25 and 0.5 quantiles. According to the OLS regression, there is a general price-increasing effect of population density because of a higher demand of or speculation for land conversion to nonagricultural land use. An increase of 100 inhabitants per km2 leads to an increase of €130 per hectare arable land. The impacts of the quantile regression are similar. The reason why population density does not affect the SFVs in the upper tail of the conditional distribution might be that this demand is more concentrated in suburban regions rather than in the most populous cities directly. That is, people prefer to live close to big cities, but not directly in them because suburban regions provide some natural amenities. The distance to big cities is significantly positive in the OLS regression. This appears to be somewhat conflicting to our previous results, which suggest that SFVs significantly decrease as one moves farther from the urban center. However, the quantile regression shows that the impact becomes insignificant at the higher quantiles. With regard to the results of the other explanatory variables, the effect of distance might be better explainable. On the one hand, agricultural factors indicating good agricultural productivity (share of arable land, slope) seem to be more pronounced in the lower tail of the conditional distribution where the positive impact of distance might indicate that these regions are farther away from big cities. On the other hand, nonagricultural factors seem to be more pronounced in the upper tail of the conditional distribution. Because nonagricultural land use becomes more likely as one moves further toward the city, the positive impact of distance because of agricultural purposes becomes insignificant in the highest quantiles.
Income negatively affects SFVs in the OLS regression. Here, an increase of €1,000 per inhabitant results in a price discount of €140 per hectare arable land. In the quantile regression, such an effect can only be found in both tails of the conditional distribution. The significance level and the coefficient are higher in the 0.1-quantile. Here, an increase of €1,000 per inhabitant decreases the SFV by €570 per hectare. This negative effect might indicate that good nonagricultural earning opportunities lead to a higher share of part-time farmers who do not want to buy farmland. As the lower half of the conditional distribution is dominated by the effects of agricultural competition for land (indicated by the more pronounced land and farm characteristics), it is reasonable that the effect of income is stronger in the 0.1-quantile. Finally, we found a price-increasing impact of wind power in the OLS regression and in the 0.9-quantile. Higher returns from wind power plants can explain the price premium (Ritter et al., Reference Ritter, Hüttel, Walter and Odening2015). However, this should also apply to biogas plants. Additionally, biogas plants should lead to higher competition for land from the cultivation of energy crops (Hennig and Latacz-Lohmann, Reference Hennig and Latacz-Lohmann2017). Hence, the significant negative correlation in the 0.1-quantile is difficult to explain. Although we included a comprehensive set of potential influencing factors, a plausible explanation to the unexpected result could be because of the omitted variable problem. It is possible that the biogas variable rather reflects an unobserved locational or structural factor in the lower tail of the conditional distribution leading to the unexpected sign.
The last column of Table 2 shows the test statistic for the equality of slopes (i.e., tests if at least one coefficient is significantly different from other coefficients estimated at other quantiles), which is a variant of the Wald test described in Koenker and Bassett (Reference Koenker and Bassett1982). Consequently, the significant test statistic for some of the explanatory variables underlines the suitability of the quantile regression approach. We also tested whether the model in the upper quantiles, represented here by the 90th quantile, is the same as the median model (50th quantile) and as the lower quantiles (represented by the 10th quantile). Both Wald-type joint tests for equality of slopes are highly significant, demonstrating the difference of the quantile regression model in the upper quantiles and the rest of the sample.
7. Discussion and Conclusion
Our results reveal several influencing factors with heterogeneous effects across the quantiles of SFVs, and thus our findings are consistent with the results of previous studies (Kostov, Reference Kostov2009b; März et al., Reference März, Klein, Kneib and Musshoff2016; Mishra and Moss, Reference Mishra and Moss2013; Peeters, Schreurs, and van Passel, Reference Peeters, Schreurs and van Passel2017; Uematsu, Khanal, and Mishra, Reference Uematsu, Khanal and Mishra2013). Overall, land and farm characteristics as well as nonagricultural factors are important price determinants for SFVs. Although this conclusion could also be drawn from the OLS regression results, quantile regression provides more information about the relationships. The effects considerably vary across the conditional distribution. Land and farm characteristics are important price determinants in the lower tail of the conditional distribution. Furthermore, we find some evidence that the price-increasing impacts of livestock production and nonagricultural factors, such as relative population change and loss of utilized agricultural area, are more pronounced in the upper tail of the conditional distribution leading to an underestimation of these effects by OLS regression in this part of the distribution. Concluding, these factors are the main price drivers for SFVs, especially in the highest quantiles. This information would have been left unnoticed by using a conventional least squares regression. Following Uematsu, Khanal, and Mishra (Reference Uematsu, Khanal and Mishra2013), we argue that factors indicating livestock production and nonagricultural land use opportunities might be luxury attributes of farmland and thus are more pronounced in the upper tail of the conditional distribution of SFVs, whereas factors related to land productivity and local competition for land might be necessary attributes of farmland and thus are more pronounced in the lower tail of the conditional distribution of SFVs.
According to the results, the impact of the proposed price caps for farmland needs to be discussed differentiated. Price caps should not affect farmland transactions in the lower quantiles (i.e., conditionally lower-priced parcels). Here, prices are stronger determined by productivity and farm characteristics (share of arable land, slope, number of farms, etc.), and thus the willingness to pay is mainly oriented on the agricultural value of farmland. This type of farmland should be still affordable for farmers. In contrast, farmland prices in the upper quantiles (i.e., conditionally higher-priced parcels) are more strongly determined by nonagricultural characteristics (besides livestock production). This means the demand of farmland for nonagricultural land use mainly acts as a price driver in the upper quantiles in our study area. Except for the city states, NRW is the federal state with the highest population density, and thus a high share of farmland is influenced by urban sprawl. As a consequence, access to farmland might be challenging for farmers and might give some evidence that the recent farmland price level could regionally be already higher than the earning capacity per hectare for many farmers. This might be a comprehensible reason for stronger interventions in the farmland market. At first glance, proposed price caps could be a suitable measure of intervention as it is more likely that farmland transactions in the upper quantiles will exceed a price cap, and thus these transactions would be prevented.
However, the impacts on the different groups of sellers and buyers also have to be considered. The proposed policy of capping farmland prices would negatively affect current farmland owners, who would like to sell their land at a high price. The ownership structure of farmland is quite diverse in Germany. Although statistical data are missing, sellers of farmland are predominantly nonagricultural heirs of former farmers. This group would be most severely affected. This disadvantage may be justified by the public interest of ensuring affordable agricultural land for farmers. Buyers of farmland would mainly benefit because high-priced farmland would become less expensive. This would also be true for the government itself when farmland is needed for infrastructure measures. However, generalized price caps would also lead to a considerable disadvantage for prospective buyers. For example, livestock and horticulture farmers, outstandingly successful farmers, and growing farms usually have a higher willingness to pay for additional land (partly based on marginal value perspectives). For livestock farmers, this relationship is clearly demonstrated in the empirical results. By introducing a price cap, these groups of buyers might not be able any longer to win against the competitors by high bids. Thus, their access to additional farmland could be limited. In the worst case, all prospective buyers offer the same price equal to the price cap. The willingness to pay would no longer be a deciding feature of who gets the parcel of land. Consequently, the best farmer may not win the bid leading to inferior market results.
Thus, intervention might be more effective and efficient by directly regulating the price drivers in the upper tail of the conditional distribution to limit further price increases instead of the currently discussed generalized price caps (like an arbitrary price bid threshold as a percentage of an average price level). This would also lead to regionally adjusted measurements as the main price drivers may also differ according to respective regional conditions. For example, reducing urban sprawl and paring down the loss of agricultural land to a minimum should be an effective and efficient measurement to limit further price increases in our study area, NRW.
One major limitation of our study is the aggregation level of data. The SFV for arable land at the municipal level in NRW is aggregated twice. First, the SFV is an average value of single farmland sale prices obtained from the data on purchasing prices of the real estate appraiser board in NRW. Thus, it is an aggregated value in itself. Second, we had to aggregate the SFVs at the municipal level for analyzing because of the lack of information about the location of the different SFV zones in a municipality as well as the lack of availability of explanatory variables at a less aggregated level. This could be the reason for the unexpected sign of biogas production in our empirical results. Moreover, it is reasonable to expect that the heterogeneity of covariate effects found here would become more obvious if single sale prices of farmland are used. Hence, we recommend improving the availability and quality of data for further analyses of factors influencing farmland values.
Despite the aggregation level of data, this study still clearly shows that the impacts of farmland price determinants can vary across the conditional distribution. Thus, quantile regression seems to be very suitable to detect the main price drivers and the consequential best interventions, and therefore, it proves to be a good addition to conventional least squares methods for developing policy recommendations.


 Open access