


1. Introduction
Asymmetric information is common in everyday life. This offers chances to better informed or privately informed individuals to exploit their informational advantages to earn more at the expense of less informed others. Examples include financial advisors recommending unsuitable products to their clients to earn higher bonuses, car mechanics charging for an unnecessary repair or even for one they did not conduct, or taxpayers committing tax fraud. While in the former two cases deception is directed toward a single individual, in the latter case the addressee is the state, a large group of individuals.
As the above examples illustrate, we focus on interactions in which the lying party imposes a negative externality on the addressee(s) of the lie. Gneezy and Kajackaite (Reference Gneezy and Kajackaite2020) show that people lie less when their lie causes a negative externality to another individual. In this study, we systematically vary the size of the externality and the number of people affected to investigate how these factors influence the propensity to lie.
To this end, we employ an observed cheating game, where an individual’s misreport of a privately observed number can monetarily benefit her while causing a monetary loss to addressees. The addressees are either a single individual, a group of two, or a group of five. As the privately observed number is known to the experimenter, the game allows us to study both whether the report deviates from the observed number and the extent of the deviation.
In half of our scenarios, a given lie causes the same loss to each addressee, independent of whether the addressees are one, two, or five. Therefore, the total loss increases in the number of addressees. In this case, we expect fewer lies toward groups of five than toward groups of two and fewer lies toward groups of two than toward individuals. In the other half of our scenarios, the loss caused by a given lie is kept constant for all addressees. When the addressee is an individual, that person bears the entire loss, while in the case of a group, the loss is shared equally among the group members. Consequently, the loss per addressee decreases in the number of addressees, while the total loss remains constant. Therefore, we expect fewer lies toward individuals than toward groups of two, and fewer lies toward groups of two than toward groups of five. Thus, depending on the individual loss caused by an over-report and the total loss, we have opposing predictions about lying to individuals versus lying to groups.
When each group member bears the same loss as an individual addressee, groups are lied to less often than individuals, but over-reports do not differ in size. When group members share the inflicted loss, groups are lied to similarly or less often than individuals, but the size of the over-reports toward groups is larger. We find no evidence that group size affects either the probability of lying or the size of the over-reports.
One potential explanation for why people may lie less to multiple versus individual addressees is the influence of social image concerns (Abeler et al., Reference Abeler, Nosenzo and Raymond2019; Gneezy et al., Reference Gneezy, Kajackaite and Sobel2018). Anticipating that an addressee could infer dishonesty from a report, potential liars may experience heightened reputational risks. These concerns are likely to be more salient when multiple addressees are present, which could help explain reduced lying toward groups.
Previous literature has considered lying to a single individual versus lying to a group, where the group is represented by the organization of the experimenter, i.e., an experimental budget (Fischbacher & Föllmi-Heusi, Reference Fischbacher and Föllmi-Heusi2013; Gneezy & Kajackaite, Reference Gneezy and Kajackaite2020; Meub et al., Reference Meub, Proeger, Schneider and Bizer2016; Soraperra et al., Reference Soraperra, Weisel and Ploner2019), a fictitious company (Bersoff, Reference Bersoff1999), or a group of actual individuals (Amir et al., Reference Amir, Kogut and Bereby-Meyer2016). These studies either find no difference in lying behavior toward addressees of different kinds or find that individuals are lied to less than groups.
In contrast to most previous research, we study lying to a single individual versus lying to an actual group of individuals, participating in the same experiment. Therefore, the study that is closest to ours is by Amir et al. (Reference Amir, Kogut and Bereby-Meyer2016). However, their approach differs from ours in several important ways. Amir et al. (Reference Amir, Kogut and Bereby-Meyer2016) use a game that does not allow one to observe behavior at the individual level, do not vary the group size, conduct an online experiment, and pay only 10% of the participants. Our game enables us to observe the individual decisions of each participant. Furthermore, we vary the group size, which allows us to explore possible differences in lying toward small versus large groups. Finally, we conduct our experiment in the laboratory and fully incentivize it by paying all participants.
A study that is remotely related to our work is Barneron et al. (Reference Barneron, Choshen-Hillel and Yaniv2021). Like us, they examine whether group size and the extent of individual harm to group members influence behavior. However, in their study, the consequences for group members result from a choice between allocations, whereas in our study, the losses are imposed through a lie. This distinction is fundamental. Moreover, Barneron et al. (Reference Barneron, Choshen-Hillel and Yaniv2021) focus on comparing behavior toward small versus large groups and therefore do not include a condition involving an individual addressee. Our primary interest is comparing lying behavior toward individuals versus groups.
There are peculiarities associated with employing an observed cheating game. In observed cheating games, participants are requested to report a number which is recorded and accessible to the experimenter. In contrast, it is unknown to the experimenter in unobserved cheating games (e.g., via private die rolls). Fries et al. (Reference Fries, Gneezy, Kajackaite and Parra2021), Hermann and Brenig (Reference Hermann and Brenig2022), and Gneezy et al. (Reference Gneezy, Kajackaite and Sobel2018) find that non-observability increases cheating and can lead to ceiling effects on the frequency and extent of lies. Therefore, we use an observed cheating game to establish moderate baselines, allowing both the probability and the extent of lies to increase or decrease meaningfully. Although observability affects the probability and extent of lying, we expect its impact to be consistent across our treatment conditions. Parra (Reference Parra2024) highlights some potential drawbacks of observed cheating games, such as reputational concerns, particularly when conducted online (e.g., through platforms like Prolific). To address these concerns, we conducted our study in a laboratory setting, without personal or payment-relevant information associated with the decisions in the experiment.
Of course, cheating games lack a crucial element of unethical behavior, which is (the fear of) detection and punishment. Since we study how negative externalities of different sizes influence lying behavior, we rule out punishment because its presence would confound our results.
The next section presents the experimental design. Section 3 describes the behavioral predictions. Section 4 presents the experimental results. In Section 5 we discuss our results and conclude.
2. Experimental design and procedures
We employed a modified version of the observed cheating game introduced by Gneezy et al. (Reference Gneezy, Kajackaite and Sobel2018). A participant (sender) privately observed a draw from a uniform distribution of integers from 1 to 10 and was required to report the observed number.Footnote 1 The senders knew that their report  $r$ would be identical to their payoff in euros. Depending on the treatment, senders were matched with one, two, or five receivers. Again, depending on the treatment, each receiver either received a payoff of $11-r$ euros or a payoff of $(11-r):n$ euros, where $n$ stands for the number of receivers. The participants were instructed that no other participant would learn the number they saw, only the one they reported. Table 1 provides an overview of the treatments and the number of independent observations per treatment.
Treatments and number of independent observations ( $r$ is the reported number, $n$ is the number of receivers, $N$ is the number of senders’ reports per treatment)

The payoffs were chosen such that senders and receivers had opposing interests, i.e., a higher payoff for the sender automatically implied a lower payoff for the receiver(s). To make the lie more explicit without framing it as such, the software required participants to submit their decision after the statement: “The number I saw was ...”. This procedure was similar to that of Gneezy et al. (Reference Gneezy, Kajackaite and Sobel2018). In contrast to their study, our instructions stated that the participants’ task was to decide which number they wanted to report. We implemented this modification to make the option of lying more salient, thereby reducing noise from participants who might not realize that lying is an option. Future researchers should carefully contemplate whether to use our instructions or revert to the original instructions of Gneezy et al. (Reference Gneezy, Kajackaite and Sobel2018).
Table 2 shows how the individual payoff and the total payoff of receivers depend on the reported number in each treatment. Any given report yields the same individual payoff for receivers in treatments ONE, TWO, and FIVE, while their total payoff is highest in FIVE, lower in TWO, and lowest in ONE. Any given report leads to the same total payoff for receivers in treatments ONE, TWOsplit, and FIVEsplit, while the individual payoff for receivers is highest in ONE, lower in TWOsplit, and lowest in FIVEsplit.
Individual payoffs and total payoffs across treatments

Low reports in TWO and especially in FIVE lead to large efficiency gains, high reports, respectively, lead to large efficiency losses. Efficiency is not an issue in treatments ONE, TWOsplit, and FIVEsplit.
Initially, participants were not informed which role they had been assigned. Therefore, all of them were required to report the number they saw, i.e., we used the strategy method (Selten, Reference Selten and Sauerman1967). After the reports were made, participants were informed about their role and payoff. After this one-shot game, participants filled out a short post-experimental questionnaire that contained questions on age, gender, field of study, and motives for their decision.
To keep the element of chance constant across treatments, ensuring that any observed differences are attributable to the treatments themselves, rather than to randomness, we used computer-generated random draws in the first treatment and then reused these same values in all subsequent treatments. This approach is equivalent to using common seed numbers in random number generators to fix the randomization across treatments. Employing this method was particularly important to enable comparisons of the size of the lie across treatments. From their own perspective, subjects received a genuinely random draw from the announced distribution, and their beliefs about their own game were correct. Thus, the procedure was not deceptive and did not affect participants’ earnings in any way.
We employed a between-subjects design, that is, no participant took part in more than one treatment. The experiment was carried out at the Berlin Experimental Economics Laboratory between the summer of 2019 and the fall of 2021. We recruited a total of 588 participants (114 to 120 per treatment, see Table 1) using ORSEE (Greiner, Reference Greiner2015).
We conducted an a priori power analysis using G*Power version 3.1.9.7 (Faul et al., Reference Faul, Erdfelder, Lang and Buchner2007) for sample size estimation, based on data from a pilot study (2019,  $N=24$), which compared the share of lies in ONE ( $0.25$) and TWOsplit ( $0.50$). With a significance criterion of $\alpha=.05$ and $power=.80$, the minimum sample size needed is $54$ per treatment for Fisher’s exact test and $50$ per treatment for a logistic regression.
The experiment was programmed in z-Tree (Fischbacher, Reference Fischbacher2007). An experimental session lasted approximately 30 minutes. The average payoff was 10.73 euros, including a show-up fee of 5 euros, and a flat payment of 1.5 euros for filling out the post-experimental questionnaire. Upon arrival in the laboratory, participants were randomly assigned to cubicles. Then they read the instructions (see Online-Appendix A) and answered a short quiz checking their understanding of the game. Participants were allowed to ask questions privately at any point during the experiment. After deciding on their report and filling out the demographic questionnaire, the experiment ended. All participants were privately paid in cash and subsequently exited the laboratory.
3. Behavioral predictions
While honesty always requires reporting the observed number and payoff maximization requires reporting a 10, other motivations like altruism, a preference for efficiency, or aversion to inequality may drive reports away from the truth, both up or down. More specifically, altruism will drive down reports in all treatments, while efficiency concerns will decrease reports in treatments TWO and FIVE. Inequality aversion will lead to reports of (or close to) 6 in treatments ONE, TWO, and FIVE, 4 in treatment TWOsplit, and 2 in treatment FIVEsplit (see Table 2). Consequently, we expect to observe truthful reportsFootnote 2, i.e., reports that coincide with the observed number, under-reports, i.e., reports that are below the observed number and thus benefit the receiver(s) at the expense of the sender, and over-reports, i.e., reports that are above the observed number and thus benefit the sender at the expense of the receiver(s). Although lying includes both under-reports as well as over-reports, the focus of this paper is on lies that benefit the liar, causing a loss to addressees. Therefore, we are interested in the number and size of the over-reports. Unlike Barron et al. (Reference Barron, Stüber and van Veldhuizen2024), who explicitly study motive selection and distinguish between four distinct motives (maximizing one’s own payoff, maximizing the counterpart’s payoff, telling the truth, and equalizing payoffs), we do not aim to disentangle these conflicting motives. However, we acknowledge that individuals who over-report a number below the maximum in our experiment may be torn between conflicting motivations such as inequality aversion, the desire to maximize their own payoff, and the wish to minimize the harm caused by the lie to the other party. We consider the trade-off between the latter two motives as the dominant one and base our hypotheses on this trade-off. Below, we explain how inequality aversion factors into this trade-off.
Assuming that the observed number determines the payoff to which the receiver(s) is/are entitled, receiving less would inflict a loss on them. Notice that an over-report may well lead to a more equal allocation than a truthful report. However, the over-report still changes the allocation that was intended by the truthful report and thus causes a loss to the receiver(s) compared to the situation in which the report would be truthful.
Table 3 shows the individual loss and the total loss that a given over-report causes to receivers. Comparing treatments ONE, TWO, and FIVE, it is evident that the individual loss is equal across treatments whereas the total loss is higher in FIVE than in TWO, and it is higher in TWO than in ONE. Consequently:
Individual loss versus total loss caused to receiver(s) when sender’s report ( $r$) is higher than the observed number ( $o$) by treatment

Hypothesis 1.
If people care for the total loss caused by their over-report,
(a) groups will be exposed to less over-reports than individuals;
(b) larger groups will be exposed to less over-reports than smaller groups.
Conditional on over-reporting,
(c) groups will be exposed to smaller over-reports than individuals;
(d) larger groups will be exposed to smaller over-reports than smaller groups.
Now compare treatments ONE, TWOsplit, and FIVEsplit. While the total loss from a given over-report is constant, the individual loss is highest in ONE, followed by TWOsplit, and finally FIVEsplit. Therefore:
Hypothesis 2.
If people care for the individual loss caused by their over-report,
(a) groups will be exposed to more over-reports than individuals;
(b) larger groups will be exposed to more over-reports than smaller groups.
Conditional on over-reporting,
(c) groups will be exposed to larger over-reports than individuals;
(d) larger groups will be exposed to larger over-reports than smaller groups.
So, depending on the individual loss caused by an over-report and the total loss, we have opposing predictions about lying to individuals versus lying to groups.
Another important factor that may influence the rate of over-reporting in our experiment is the concern for social image as modelled in Abeler et al. (Reference Abeler, Nosenzo and Raymond2019) and Gneezy et al. (Reference Gneezy, Kajackaite and Sobel2018). Social image refers to how the sender is perceived by others. This perception depends on what the addressees can infer about the sender’s honesty based on the report, without knowing the observed number. Thus, engaging in behavior that might appear dishonest can be costly for the sender, even if no one will ever find out for certain whether the sender actually lied or not (Bašić & Quercia, Reference Bašić and Quercia2022). The sender may worry that when the number of people who observe the report increases, the likelihood that someone will suspect her of lying also goes up. In other words, the social image cost of lying may increase with the number of addressees who observe the report. Applied to our experiment, this would imply that groups are likely to be exposed to fewer and smaller over-reports than individuals, and larger groups to fewer and smaller over-reports than smaller groups. This prediction aligns with Hypothesis 1 and runs counter to Hypothesis 2. It remains an open question how concerns about social image will interact with, and possibly amplify or weaken, the influence of the monetary loss imposed on addressees by the lie.
4. Results
We start with descriptives and proceed with econometric tests of our hypotheses. Finally, we provide a descriptive analysis of the under-reports.
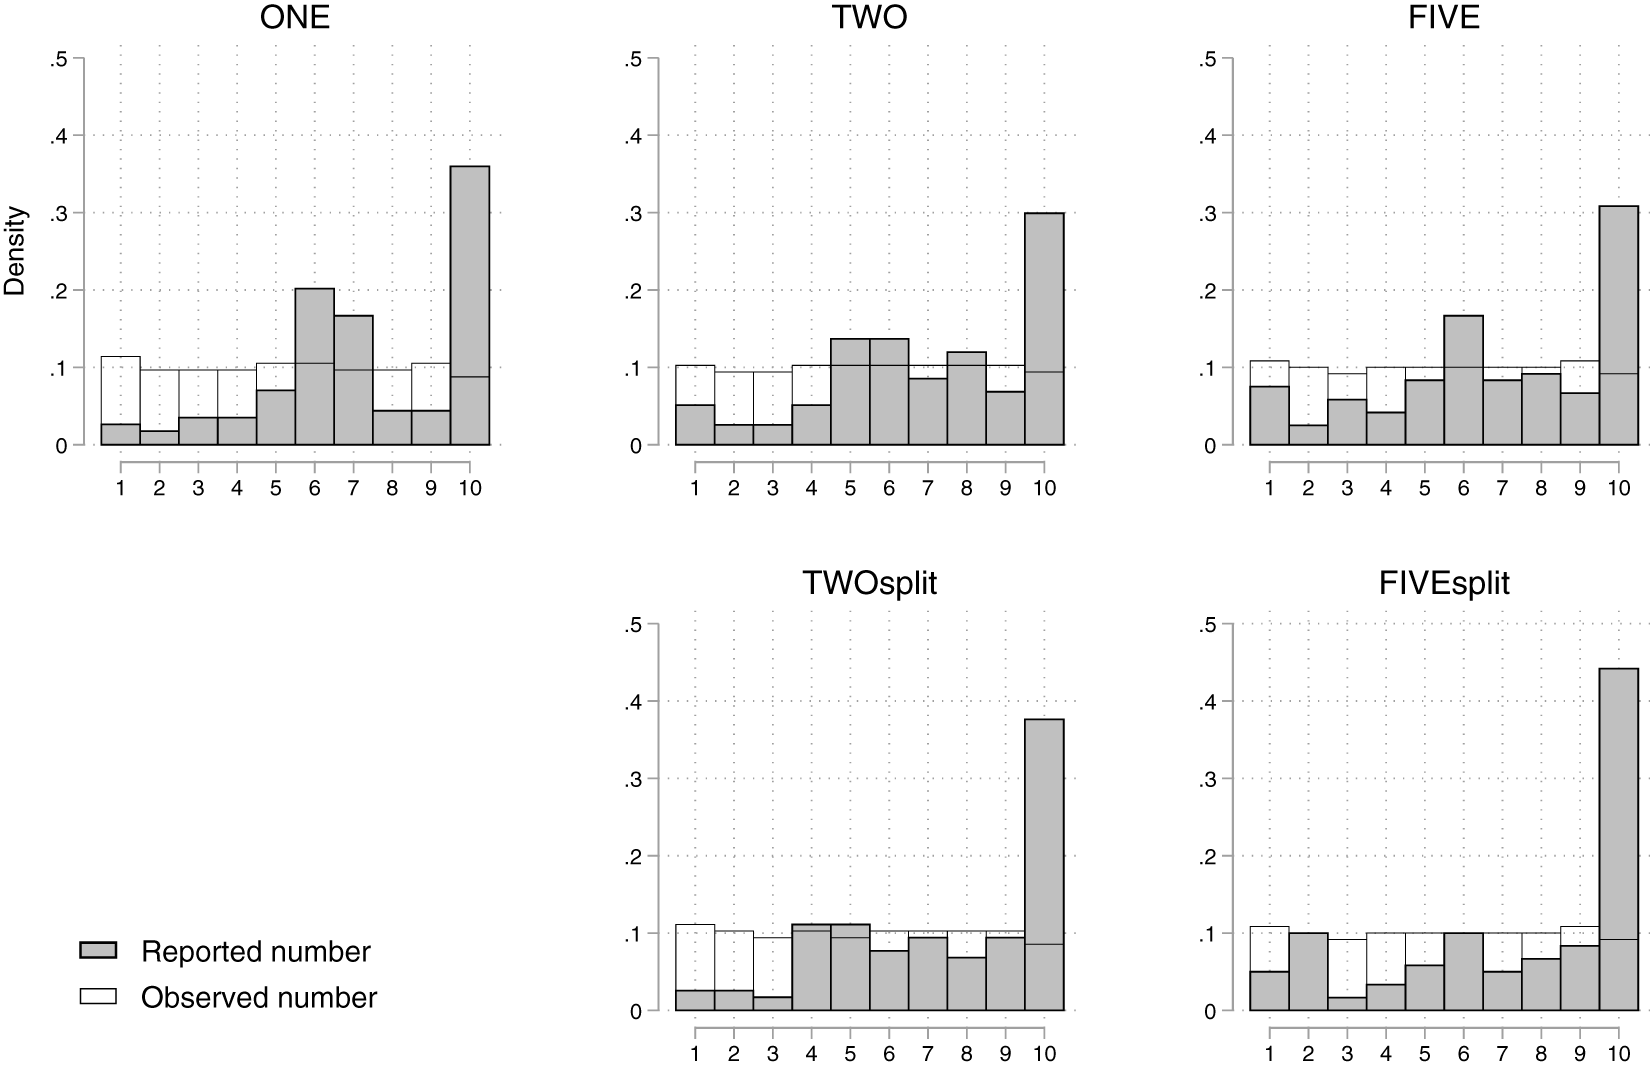
Figure 1 depicts the distributions of reported numbers (gray bars) and observed numbers (white bars) by treatment (see Online-Appendix C, for the full frequency tables of reported numbers by observed numbers). In all treatments, the reported numbers are significantly higher than the numbers participants actually saw ( $p \lt 0.001$, Wilcoxon signed-rank tests, two-sided). The lower the number participants saw, the more likely they were to over-report (Spearman’s rank correlation coefficient is negative and highly significant in all treatments, $p \lt 0.001$, two-sided). These findings are in line with the literature on lying in one-person observed cheating games (see, e.g.,
Gneezy & Kajackaite, Reference Gneezy and Kajackaite2020). The frequency of reported tens is lowest in treatments TWO and FIVE, and highest in treatment FIVEsplit but none of this is significant. In all treatments, there are spikes of reports around the fair outcomes (which is 6 in treatments ONE, TWO, and FIVE, 4 in treatment TWOsplit, and 2 in treatment FIVEsplit).
$p \lt 0.001$, two-sided). These findings are in line with the literature on lying in one-person observed cheating games (see, e.g.,
Gneezy & Kajackaite, Reference Gneezy and Kajackaite2020). The frequency of reported tens is lowest in treatments TWO and FIVE, and highest in treatment FIVEsplit but none of this is significant. In all treatments, there are spikes of reports around the fair outcomes (which is 6 in treatments ONE, TWO, and FIVE, 4 in treatment TWOsplit, and 2 in treatment FIVEsplit).
Reported numbers and observed numbers by treatment

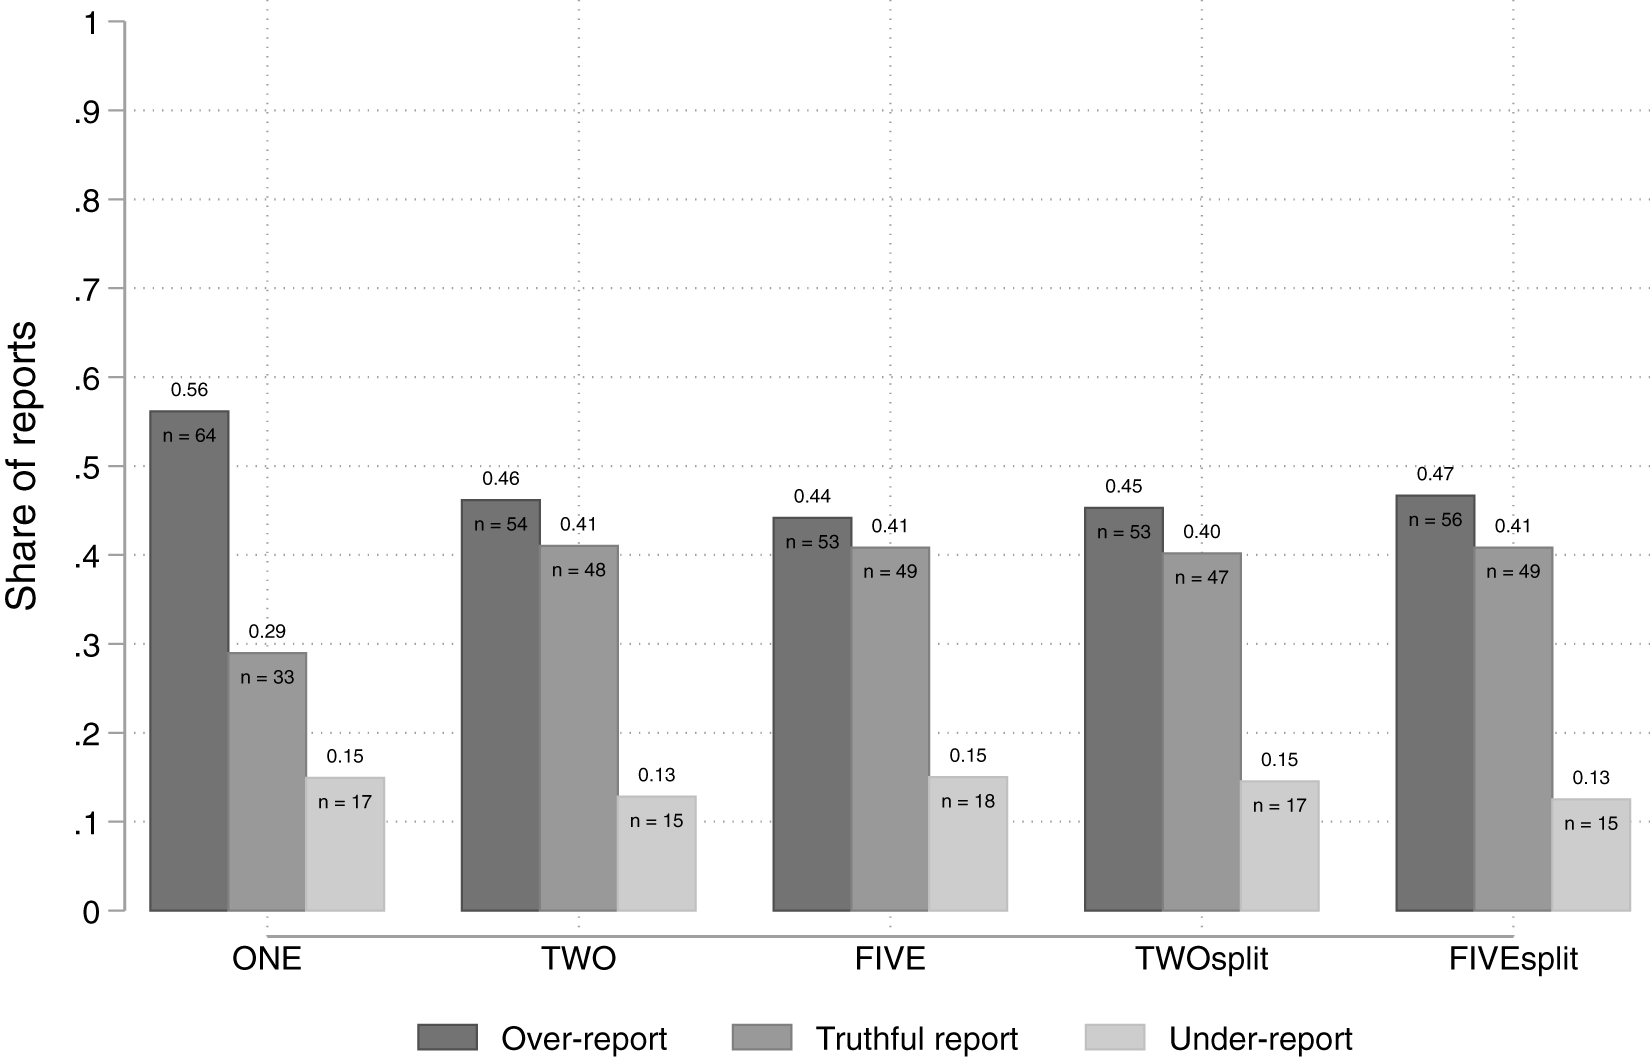
Figure 2 portrays the share of over-reports, truthful reports, and under-reports by treatment. The share of over-reports is highest in treatment ONE (56%). In the group treatments, between 44% and 47% of the participants over-reported. In each treatment, between 13% and 15% of the participants under-reported.
The share of over-reports, truthful reports, and under-reports by treatment

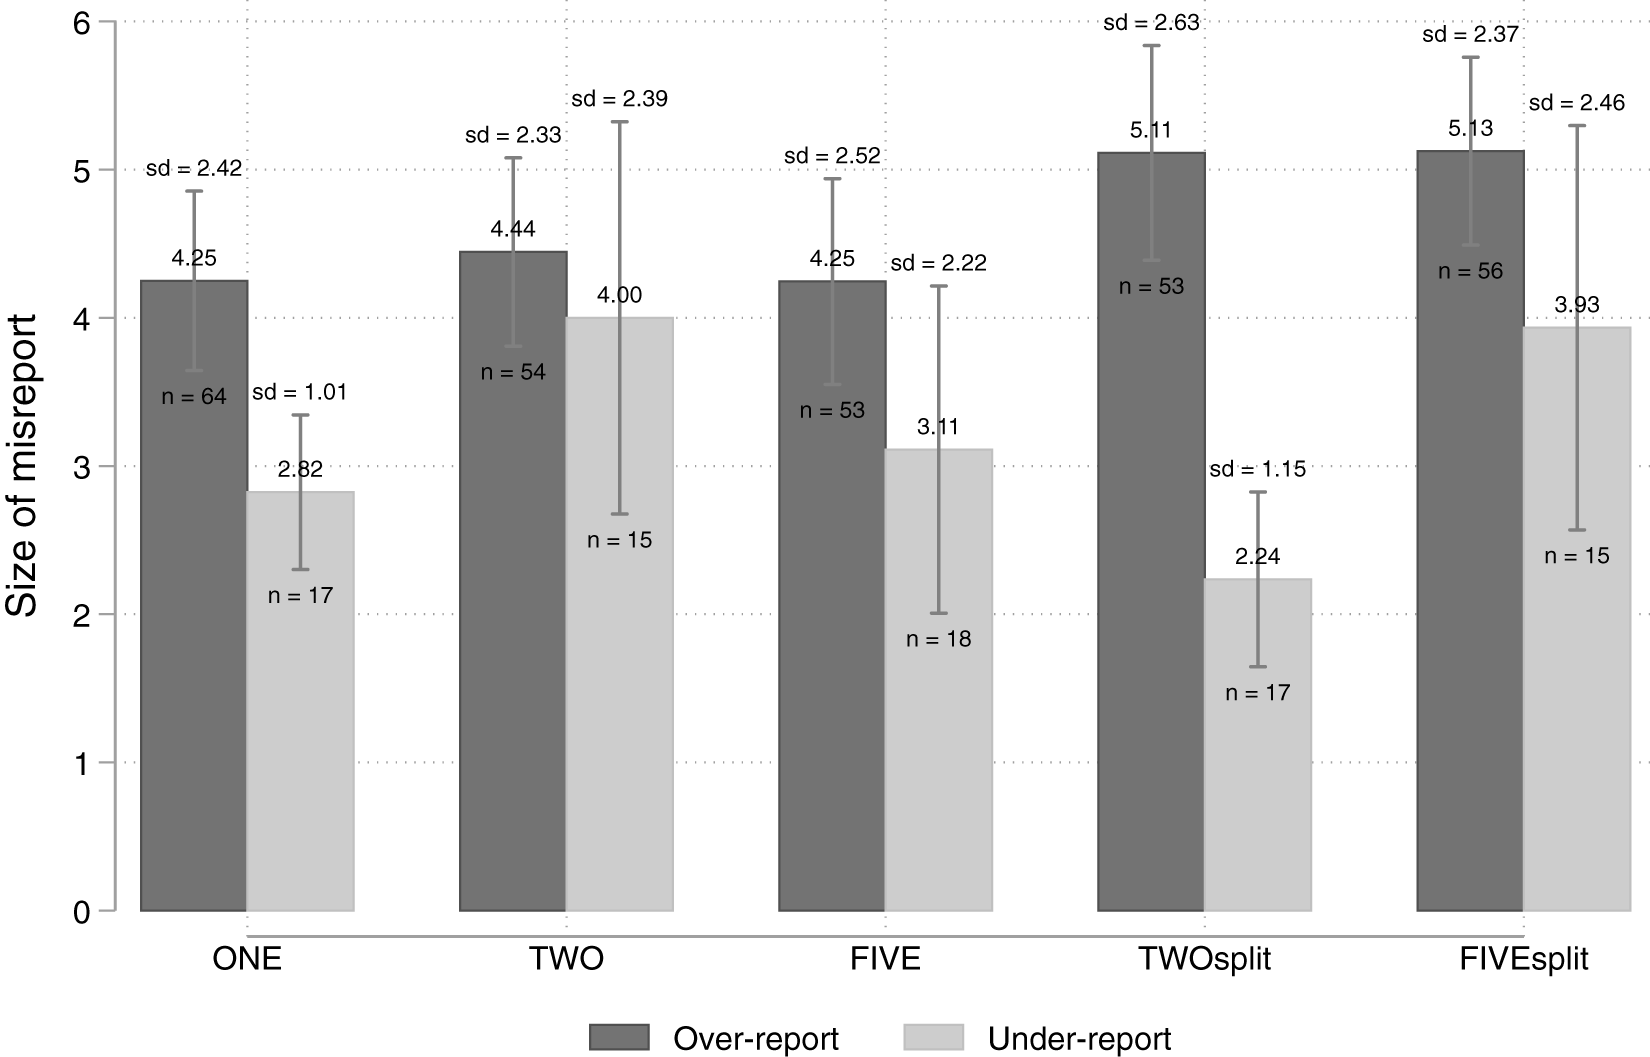
Figure 3 presents the average size of the over-reports and under-reports by treatment conditional on the decision to lie. The average size of the over-reports is higher in treatments TWOsplit and FIVEsplit (both around 5 euros) than in treatments ONE, TWO, and FIVE (all around 4 euros). Despite the low number of under-reports, we show their average size for completeness.
Average size of over-reports and under-reports by treatment

In the following, we test our predictions.
Result 1.
(i) Groups are exposed to less over-reports than individuals when the loss per group member is the same as the loss for the individual addressee and thus the total loss for groups is larger, supporting H1(a).
(ii) Groups are exposed to similar or less over-reports than individuals when the loss is split among group members, rejecting H2(a).
(iii) The size of the group does not affect the frequency of over-reports, rejecting both H1(b) and H2(b).
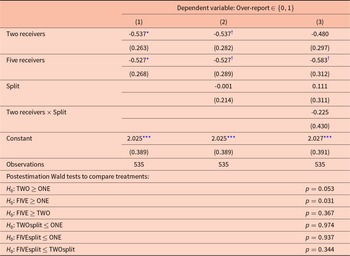
Table 4 provides econometric support for Result 1. It shows results from logistic regressions with the binary decision to over-report as the dependent variable. ‘Over-report’ takes the value of one, if the report was higher than the observed number, and zero, if it was lower or equal to the observed number. As already mentioned, we treat truthful reports and under-reports similarly because both do not impose a loss on addressee(s). Specification (1) investigates how the decision to over-report depends on the number of receivers by including the Two receivers–dummy (that takes the value one if the treatment is TWO or TWOsplit and zero otherwise), and the Five receivers–dummy (that takes the value one if the treatment is FIVE or FIVEsplit and zero otherwise). Specification (2) adds the Split–dummy (that takes the value one if the treatment is TWOsplit or FIVEsplit and zero otherwise) to explore a possible difference in the frequency of over-reports between the split-treatments and the rest of the treatments. Finally, in specification (3) we incorporate the interaction Two receivers  $\times$ Split–dummy (that takes the value one if the treatment is TWOsplit and zero otherwise) to enable the pairwise comparison between treatments using post-estimation Wald tests. We always control for the observed number (using indicator variables) and the gender of participants.
Logit regressions on the frequency of over-reports

†, *, **, *** Standard errors in parentheses. Estimation by logistic regression. Reference categories are One receiver and Five receivers  $\times$ Split. Controlled for participants’ gender and observed number. †, *, ** and *** denote significance at the 10%, 5%, 1%, and 0.1% level, respectively.
There is an indication that the probability to over-report is significantly lower, when there are two or five receivers compared to one receiver, see the significantly negative dummy variables in (1). However, this effect diminishes when introducing a Split-dummy in (2) and its interaction with group size in (3). Whether or not the loss is split among group members does not affect the probability to over-report when controlling for the group size: the Split-dummy in (2) is not significant. The post-estimation Wald tests related to specification (3), which we report at the bottom of Table 4, confirm that the probability to over-report is significantly higher in treatment ONE compared with treatment FIVE ( $p=0.031$, one-sided) and is ‘marginally’ significant compared with treatment TWO ( $p=0.053$, one-sided). We cannot reject the null hypothesis that over-reporting is at least as frequent in ONE as in any of the Split-treatments ( $p\geq0.937$, one-sided). Similarly, we do not find any evidence in the hypothesized direction with respect to comparisons between groups of different sizes (see Wald tests, TWO vs. FIVE and TWOsplit vs. FIVEsplit, $p\geq0.344$, one-sided).
Result 2.
Conditional on the decision to over-report,
(i) over-reports toward groups whose members each bear the loss are not smaller in size than over-reports toward individuals, rejecting H1(c).
(ii) over-reports toward groups whose members split the loss are larger in size than over-reports toward individuals, supporting H2(c).
(iii) the group size does not affect the average size of over-reports, rejecting H1(d) and H2(d).
Table 5 provides support for Result 2. It presents results from OLS regressions with the size of the over-reports as the dependent variable.Footnote 3 The three model specifications in Table 5 have the same set of regressors and control variables as in Table 4.
OLS regressions on the size of over-reports

†, *, **, *** Standard errors in parentheses. Estimation by OLS regression. Reference categories are One receiver and Five receivers  $\times$ Split. Only over-reports are considered. Controlled for participants’ gender and observed number. $^{\dagger}$, $^{*}$, $^{**}$ and $^{***}$ denote significance at the 10%, 5%, 1%, and 0.1% level, respectively.
The positive and significant coefficient of the Split-dummy in specifications (2) and (3) suggests that the average over-report is larger in TWOsplit and FIVEsplit than in all other treatments. The post-estimation Wald tests related to specification (3) show that the average over-report is larger both in TWOsplit and FIVEsplit than in ONE ( $p=0.021$, respectively, $p \lt 0.001$, one-sided). We find no statistically significant difference between TWOsplit and FIVEsplit ( $p=0.131$, one-sided). In addition, we do not find any support for our hypotheses, when pairwise comparing treatments ONE, TWO, and FIVE ( $p\geq0.476$, one-sided).
Under-reports
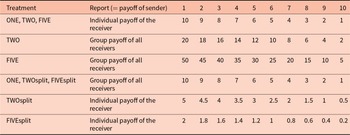
While the number of under-reports per treatment is low (ranging from 15 to 18), these observations still offer valuable insights into participants’ underlying motives. Accordingly, we refrain from making statistical inferences and instead categorize under-reports based on the resulting allocations.
Following Barron et al. (Reference Barron, Stüber and van Veldhuizen2024), we identify allocations that suggest inequality aversion or altruism. We also consider allocations that likely reflect efficiency concerns.
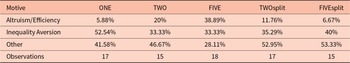
An inequality aversion motive, as modeled by Fehr and Schmidt (Reference Fehr and Schmidt1999), is assumed when an under-report leads to approximately equal payoffs between the sender and each receiver while still slightly favoring the sender. This corresponds to reporting a 6 in ONE, TWO, and FIVE; a 4 in TWOsplit; and a 2 in FIVEsplit. Altruism/efficiency is coded as the dominant motive when senders report the lowest possible number (i.e., 1). In TWO and FIVE, such a report maximizes efficiency (defined as the sum of payoffs) and is simultaneously altruistic. In contrast, in ONE, TWOsplit, and FIVEsplit, where efficiency gains are absent, the motive is interpreted as purely altruistic. Table 6 presents the frequency of these motives across treatments.
Identified motives for under-reports by treatment

Altruism/efficiency plays a minimal role in ONE, TWOsplit, and FIVEsplit, but becomes increasingly prominent in TWO (20%) and especially in FIVE (38.89%). From this, we conclude that altruism appears to play a negligible role also in treatments TWO and FIVE compared to efficiency concerns. Inequality aversion is the dominant motive in ONE (52.54%) and remains important across the group treatments, accounting for one-third to two-fifths of the observations.
The residual category “Other”, which captures mixed motives or behaviors not easily classified, accounts for the highest share in TWOsplit (52.95%) and FIVEsplit (53.33%). This may be driven by several factors. First, achieving more equal outcomes requires senders to report lower numbers, increasing the personal cost of achieving an equal outcome, and thus reports decrease, though not sufficiently to reach a 4 in TWOsplit and a 2 in FIVEsplit. Second, new behavioral motives may emerge, e.g., targeting equality between the own payoff compared with the aggregated group payoff. Reports of a 6 that balance the individual payoff against the total group payoff occurred in 17.65% of cases in TWOsplit and 13.33% in FIVEsplit.
To sum up, the dominating motives behind under-reporting seem to be efficiency concerns and inequality aversion that is targeted toward group members rather than toward the group as a whole.
5. Discussion and conclusion
In everyday situations with asymmetric information and conflict of interest, better-informed individuals may lie to earn money at the expense of less-informed others. In this study, we ask: Does it make a difference whether the addressee of a potential lie is a single individual or a group of individuals? Are larger groups subject to more lies than smaller groups? Do potential liars care about whether the loss caused by their lie is borne by each group member or shared equally among group members?
Employing a controlled, fully incentivized laboratory experiment, we find that (i) groups are never lied to more often than individuals. Conditional on the decision to lie, liars (ii) cause losses of similar size to individual and group addressees, who each bear the loss, and (iii) inflict losses of larger size on group addressees, who share the loss, than on individual addressees. Finally, (iv) groups of different sizes are treated similarly, implying that the diminishing loss per group member or the increasing total group loss do not affect the decision to lie.
Our first result stands in contrast to previous findings comparing lying to an organization with lying to an individual (e.g., Meub et al., Reference Meub, Proeger, Schneider and Bizer2016; Soraperra et al., Reference Soraperra, Weisel and Ploner2019). This discrepancy is not surprising, as harming a group of people directly in the laboratory setting is more immediate and tangible than reducing an experimental budget, which affects an abstract and impersonal collective.
Our first result also contrasts with the findings of Amir et al. (Reference Amir, Kogut and Bereby-Meyer2016), where, as in our study, the group consisted of student participants. However, as noted in the Introduction, the studies differ in several other important aspects, such as experimental procedure, decision environment, incentivization method, and the experimental paradigm employed. These differences may help explain the divergent results. One key dimension we wish to emphasize is that their experiment was conducted online, whereas ours took place in a traditional laboratory setting. To explain why this might be relevant, we draw on Boothby et al. (Reference Boothby, Clark and Bargh2014) and Boothby et al. (Reference Boothby, Smith, Clark and Bargh2016). Boothby et al. (Reference Boothby, Clark and Bargh2014) demonstrate that shared experiences tend to be amplified, becoming more positive if pleasant and more negative if unpleasant. Boothby et al. (Reference Boothby, Smith, Clark and Bargh2016) show that the amplification of shared experiences is moderated by physical and social proximity. We conjecture that in our experiment, both the physical proximity of the addressees and their social proximity (all students, which may not have been apparent in the online study) may have amplified the shared unpleasantness of the negative externality experienced by group addressees. This argument does not hold for an individual addressee, because an individual addressee does not share the negative experience with anyone. Anticipating this, senders may have been less willing to lie to a group of addressees than to individual addressees. This effect is absent in the online study, as group members are geographically dispersed and cannot observe whether the other participants are also students like themselves. Of course, this remains a conjecture that warrants further investigation in future research.
Our third result on the sensitivity of liars to the larger loss of the individual addressee in comparison to the smaller losses of the group members when it comes to the size of the lie is in line with previous findings, see, e.g., Barneron et al. (Reference Barneron, Choshen-Hillel and Yaniv2021) on the dispersion effect, or Gneezy (Reference Gneezy2005). However, unlike Barneron et al. (Reference Barneron, Choshen-Hillel and Yaniv2021), when we compare groups of different sizes, we do not find any evidence for a dispersion effect, neither when looking at the frequency of lies, nor when considering the size of the lie.
It is not surprising that a group is less likely to be lied to than an individual addressee when each group member incurs the same loss as the individual addressee, thereby making the total group loss a multiple of the individual loss. What is surprising, however, is that this aversion to lying to a group persists even if each group member suffers only a fraction of the loss that an individual addressee would bear. Both findings run counter to the explanation by Barneron et al. (Reference Barneron, Choshen-Hillel and Yaniv2021) that empathy can only be directed toward a single individual and, therefore, depends solely on the loss imposed on that individual. Since monetary losses alone cannot account for this reluctance to lie to groups, we interpret the result as stemming from a fixed psychological cost associated with lying to multiple others simultaneously, independent of their number or the size of the imposed negative externality. This psychological cost may be related to concerns about social image: the more individuals observe the report, the more individuals might suspect dishonesty (despite not knowing the actual number observed), and consequently, the more likely it is that the sender is perceived as a liar. Cleanly testing the role of social image concerns when exploring negative externalities from lying to individuals versus groups would be a further avenue for future research.
Last but not least, we observe a small but non-negligible number of under-reports. Their presence is consistent with an interpretation in which motive selection (Barron et al., Reference Barron, Stüber and van Veldhuizen2024) leads some participants to prioritize inequality aversion and efficiency concerns over truth-telling.
From a practical perspective, our results suggest that tax evasion may be less likely than defrauding a financial advisee. However, when it does occur, the resulting harm is likely to be substantial. This highlights the importance of examining the role of sanctions. Future research could explore how the threat or presence of sanctions influences behavior when lying to groups.
Supplementary material
The supplementary material for this article can be found at https://doi.org/10.1017/esa.2025.10028.
Funding statement
Financial support by Deutsche Forschungsgemeinschaft through CRC TRR 190 “Rationality and Competition” (project number 280092119) as well as support by the Berlin Centre for Consumer Policies (BCCP) are gratefully acknowledged. The experiments reported in this paper have been approved by the management of the Experimental Laboratory at Technische Universität Berlin.
Competing interests
None.


 Open access