


1. Introduction
Primary data collection through surveys is a cornerstone of empirical research (Bertrand and Mullainathan, Reference Bertrand and Mullainathan2001). Hard-to-reach populations, such as farmers and rural residents, are important stakeholders whose perspectives are valuable for policy design (Altman, Reference Altman2004; Irwin et al., Reference Irwin, Isserman, Kilkenny and Partridge2010; Pennings, Irwin, and Good, Reference Pennings, Irwin and Good2002). However, their geographical dispersion, limited contact information, reluctance to travel, and low technological literacy often make conventional in-lab and remote surveys ineffective or costly, resulting in persistent underrepresentation in empirical research (Pennings, Irwin, and Good, Reference Pennings, Irwin and Good2002). To reach these populations efficiently, researchers often rely on intercept surveys conducted at stakeholder events such as conferences and community meetings, where passing participants are approached by researchers, recruited, and surveyed on-site (Bator, Bryan, and Wesley Schultz, Reference Bator, Bryan and Wesley Schultz2011; Avemegah et al., Reference Avemegah, Gu, Abulbasher, Koci, Ogunyiola, Eduful, Li, Barington, Wang, Kolady, Perkins, Leffler, Kovács, Clark, Clay and Ulrich-Schad2021; Pitts et al., Reference Pitts, Gustafson, Wu, Mayo, Ward, McGuirt, Rafferty, Lancaster, Evenson, Keyserling and Ammerman2014).
Two administration modes are commonly used in these settings. The traditional paper mode involves printing, distributing, and collecting physical questionnaires, followed by manual data entry into computers for analysis. While straightforward to implement, this mode often requires substantial time, material, and human resources to facilitate the process monitoring and management. Paper surveys can become particularly cumbersome for researchers and discourage participation when instruments are lengthy or involve a large number of participants (Champ, Boyle, and Brown, Reference Champ, Boyle and Brown2003; Clark et al., Reference Clark, Determann, Petrou, Moro and de Bekker-Grob2014; Hess and Rose, Reference Hess and Rose2009).
The electronic mode, which moves questionnaires to online platforms, has been increasingly adopted in survey implementation (Hassler, Pearce, and Serfass, Reference Hassler, Pearce and Serfass2018; Uhlig et al., Reference Uhlig, Seitz, Eter, Promesberger, Busse and van den Besselaar2014). In this mode, instruments are typically distributed via electronic links and completed on digital devices, with responses automatically recorded and transferred into datasets ready for subsequent analysis. Electronic surveys not only eliminate physical materials and associated management burdens, but also allow greater flexibility in survey design, including more diverse question formats and features such as easy randomization and dynamic skip logic based on respondents’ previous answers.
The electronic mode is particularly well suited for intercept surveys. When adopting the electronic mode, researchers can provide QR codes that allow respondents to access the questionnaire directly on their own smartphonesFootnote 1 Footnote 2 . This approach avoids the use of physical materials and equipment during on-site recruitment, which can impose administrative burdens and discourage participation. Responses and related information are automatically recorded and stored by the online survey platform. These benefits can improve response rates and reduce data collection costs (Endres, Heiden, and Park, Reference Endres, Heiden and Park2024; Monzon, Julio, and Garcia-Martinez, Reference Monzon, Julio and Garcia-Martinez2020).
However, because the electronic mode delivers survey materials through a digital interface that differs from the paper mode in both visual presentation and response entry, respondents may perceive and interact with the questionnaire differently, resulting in heterogeneous outcomes (Dillman, Smyth, and Christian, Reference Dillman, Smyth and Christian2014). This is particularly relevant when surveying hard-to-reach populations, who may have limited technological familiarity or comfort with digital devices (Pennings, Irwin, and Good, Reference Pennings, Irwin and Good2002). If mode effects are present, they could alter response patterns and measurement outcomes, compromise validity across modes, and ultimately bias analyses and misguide policy design.
Concerns about administration mode affecting survey outcomes have existed since the early adoption of electronic surveys. Studies in this literature have primarily examined responses to closed-ended questions and survey process measures, such as completion time and item nonresponse, and generally conclude in favor of the electronic mode. For example, several studies report comparable participation rates and response quality across modes in surveys conducted with various populations, including employees in organizational settings (Croteau, Dyer, and Miguel, Reference Croteau, Dyer and Miguel2010; Thompson et al., Reference Thompson, Surface, Martin and Sanders2003), parents (Hohwü et al., Reference Hohwü, Lyshol, Gissler, Jonsson, Petzold and Obel2013), undergraduate students, and general adult populations (Weigold, Weigold, and Russell, Reference Weigold, Weigold and Russell2013). These studies often recommend electronic surveys due to their lower costs and greater efficiency. Other studies find that the electronic mode yields superior outcomes, including lower dropout rates, fewer incomplete responses, and higher data quality. Examples include Dolnicar, Laesser, and Matus (Reference Dolnicar, Laesser and Matus2009), who surveyed tourists engaged in recreational activities; Zeleke et al. (Reference Zeleke, Worku, Demissie, Otto-Sobotka, Wilken, Lipprandt, Tilahun and Röhrig2019), who studied rural communities in Ethiopia; and Tate and Smallwood (Reference Tate and Smallwood2021), who examined recreational fishermen.
However, another stream of studies focusing on stated preference methods, particularly discrete choice experiments (DCEs), which have been increasingly incorporated into survey research, report more mixed findings and express greater skepticism toward the electronic mode. For example, Savage and Waldman (Reference Savage and Waldman2008), studying internet service consumers, find that DCE responses in electronic surveys exhibit lower quality and less precise preference estimates. Watson et al. (Reference Watson, Porteous, Bolt and Ryan2019) survey households in the United Kingdom and find that electronic surveys administered through online panels yield lower response rates and higher attribute attendance. Determann et al. (Reference Determann, Lambooij, Steyerberg, de Bekker-Grob and de Wit2017), surveying health insurance consumers in the Netherlands, find that willingness to pay (WTP) estimates are often higher in the electronic mode. In contrast, Lindhjem and Navrud (Reference Lindhjem and Navrud2011) and Loomis and Paterson (Reference Loomis and Paterson2018), reviewing prior studies in recreation and environmental economics, conclude that observed response differences are largely study-specific and do not reveal a consistent pattern of substantially lower quality or validity associated with electronic modes.
Three key gaps remain in the literature. First, most prior studies do not control for sample composition across modes, which may confound administration mode effects with self-selection (Gigliotti, Reference Gigliotti2011; Lindhjem and Navrud, Reference Lindhjem and Navrud2011; Reisner et al., Reference Reisner, Conron, Scout, Mimiaga, Haneuse and Austin2014). Second, existing DCE-based analyses largely compare modes in remote survey settings where data collection occurs without the physical presence of an interviewer, such as online and mail surveys. These approaches require that potential participants’ contact information be known, which differs substantially from intercept surveys and other in-person survey settings. Third, hard-to-reach populations, such as farmers and rural residents, may perceive and interact with survey administration modes differently from the general population. To date, no study has examined administration mode effects while controlling for sample composition within intercept survey settings. These gaps leave researchers working with farmers and rural residents uncertain about the trade-offs involved in mode selection, potentially leading to biased findings and undermining comparability across studies.
To address these gaps, we conducted an intercept survey of beef cattle farmers on labor dynamics and preferences for H-2A guest worker program reforms, administered in both paper and electronic modes at a national beef producers’ conference. The beef cattle industry constitutes the largest segment of the U.S. livestock sector, which has been increasingly affected by widespread agricultural labor shortages (Hertz and Zahniser, Reference Hertz and Zahniser2013; U.S. Department of Agriculture, 2025). The H-2A guest worker program, which allows agricultural employers to hire foreign workers for seasonal agricultural jobs under specified conditions (U.S. Department of Labor, 2025a), is widely viewed as a potential solution to these labor shortages.
However, existing H-2A rules and restrictions have been criticized for limiting the program’s applicability to livestock operations, resulting in ongoing policy debates to relax H-2A rules (Rep. Fitzpatrick, 2023; Rep. Lofgren, 2024; Rep. Lofgren, 2025). Understanding producers’ labor dynamics and attitudes toward potential reforms is therefore essential for designing effective policies. Given the absence of prior research in this area and the difficulty of accessing the beef cattle farmer population due to their dispersed residence and remote operations (Key, Lacy, and Todd, Reference Key, Lacy and Todd2024), this study provides a valuable opportunity to employ an intercept survey of stakeholders to examine administration mode effects and inform future policy design.
In this study, we examine three types of outcomes commonly collected in farmer and rural surveys (Pennings, Irwin, and Good, Reference Pennings, Irwin and Good2002; Espinosa-Goded, Barreiro-Hurlé, and Ruto, Reference Espinosa-Goded, Barreiro-Hurlé and Ruto2010; Avemegah et al., Reference Avemegah, Gu, Abulbasher, Koci, Ogunyiola, Eduful, Li, Barington, Wang, Kolady, Perkins, Leffler, Kovács, Clark, Clay and Ulrich-Schad2021) and frequently used to evaluate survey performance (Liebe et al., Reference Liebe, Glenk, Oehlmann and Meyerhoff2015; Watson et al., Reference Watson, Porteous, Bolt and Ryan2019): (1) preferences elicited from a DCE; (2) responses to contextual closed-ended questions, and (3) survey process measures.
The DCE-elicited preferences capture farmers’ perceptions of selected H-2A policy reforms. The contextual closed-ended questions are primarily multiple-choice items on farmers’ labor demand and hiring practices. The survey process measures include metrics such as completion time, attention checks, and reported satisfaction. By randomly assigning consenting participants to either the paper or electronic mode, we compare outcomes across modes while controlling for self-selection (Atkin, Khandelwal, and Osman, Reference Atkin, Khandelwal and Osman2017; Muchnik, Aral, and Taylor, Reference Muchnik, Aral and Taylor2013).
This study makes two main contributions. First, it advances the survey methodology and rural research literature by evaluating whether and how administration modes affect survey outcomes, and informing researchers about mode selection to balance implementation efficiency and response reliability when surveying hard-to-reach populations. Second, it provides timely empirical evidence on the labor dynamics and preferences of beef cattle farmers regarding H-2A program reforms, offering insights for policymakers to assess potential impacts and design labor policies that better reflect stakeholder needs.
2. Survey design
The survey consisted of the following three sections: (1) a DCE for elicitation of respondents’ preferences for H-2A program reforms, (2) closed-ended questions, and (3) survey process measures. The order of these sections followed the literature recommendations to minimize cognitive burden, as hard-to-reach populations are often more susceptible to fatigue (Kam and Chan, Reference Kam and Chan2018; Kung, Kwok, and Brown, Reference Kung, Kwok and Brown2018).
2.1. Discrete choice experiment
Stated preference methods are widely used in empirical research to quantitatively assess stakeholders’ preferences for market and non-market goods, services, and policies that are not yet available or lack established prices (Champ, Boyle, and Brown, Reference Champ, Boyle and Brown2003). The DCE is one of the most frequently employed stated preference methods in farmer and rural surveys to analyze adoption decisions related to hypothetical policies, technologies, and production practices (Blasch et al., Reference Blasch, Vuolo, Essl and van der Kroon2021; Ortiz, Avila-Santamaría, and Martinez-Cruz, Reference Ortiz, Avila-Santamaría and Martinez-Cruz2023; Yue et al., Reference Yue, Lai, Watkins, Patton and Braun2023; Zhang and Melo, Reference Zhang and Melo2025).
In this study, an unlabeled DCE was implemented in the first section of the survey to examine farmers’ choices of hypothetical H-2A program alternatives and their preferences for attributes representing potential policy reforms. The attributes and levels are presented in Table 1, and an example choice scenario is shown in Figure 1.
Discrete choice experiment attributes and levels

Table 1 Long description
A table titled Discrete choice experiment attributes and levels. The table has three columns: Attribute, Levels, and Description. It contains five rows with the following data: Row 1: Attribute, Pre-set wage; Levels, $13, $15, $17; Description, The hourly wage rate employers are required to pay H-2A workers. Row 2: Attribute, Processing time; Levels, 30 days, 75 days; Description, The duration of the H-2A application process. Row 3: Attribute, Off-farm work; Levels, Allowed, Not allowed; Description, Whether H-2A workers are allowed to perform occasional off-farm related tasks such as local transporting and processing. Row 4: Attribute, Contract period; Levels, Year-round, Seasonal only; Description, Whether H-2A workers are employed seasonally only or allowed to work year-round. Row 5: Attribute, Labor mobility across employers; Levels, Yes, No; Description, Whether H-2A workers are allowed to move between registered employers without additional paperwork.
Notes: This table presents the attributes and levels used in the Discrete Choice Experiment. The selection of attributes and levels were informed by H-2A program documentation (U.S. Department of Labor, 2025a), proposed congressional reform bills, and interviews with farmers and extension specialists.
Discrete choice experiment framing and example choice scenario.

Respondents were first introduced to the current H-2A program rules, including restrictions on eligible labor tasks and seasonal employment, the application process, the minimum wage requirement known as the Adverse Effect Wage Rate (AEWR), and the provisions for housing, transportation, and meals. They were then introduced to key attributes describing proposed reforms to the program. Each respondent evaluated six choice scenarios, with each scenario presenting two hypothetical H-2A program alternatives (Program A and Program B) that differed by attribute levels. An opt-out alternative, “I won’t use either,” was included to enhance realism (Veldwijk et al., Reference Veldwijk, Lambooij, de Bekker-Grob, Smit, de Wit and Cameron2014).
The attributes and levels were selected to reflect major reform elements discussed by the U.S. Congress between 2021 and 2024. The first attribute, preset wage, represents the hourly rate employers must pay H-2A workers and captures the primary cost associated with program adoption (Hertz and Zahniser, Reference Hertz and Zahniser2013; U.S. Department of Labor, 2025a). H-2A wage rules have been among the most debated reform issues, with domestic worker advocacy groups seeking higher AEWR levels and farmer associations supporting freezes or reductions (Rep. Fischbach, 2022; Rep. Allen, 2023; Rep. Lofgren, 2024; Rep. Salazar, 2024). Given the AEWR of $15.55 in Texas in 2024 (U.S. Department of Labor, 2025a), three wage levels ($13, $15, and $17) were included to provide realistic variation.
The second attribute, processing time, reflects the duration of the H-2A application process, which currently requires approvals from both the U.S. Department of Labor and the U.S. Citizenship and Immigration Services, taking approximately 75 days in total (U.S. Department of Labor, 2025a). Lengthy processing times are widely recognized as a barrier to adoption, and proposals have advocated consolidating responsibilities under a single agency to streamline the process and reduce processing time (Sen. Paul, 2022; Rep. Gonzales, 2023; Rep. Mace, 2023; Rep. Salazar, 2024). Accordingly, an alternative level of 30 days was included to represent a feasible and meaningful improvement in processing time.
The third attribute, off-farm work, captures preferences for allowing H-2A workers to perform occasional off-farm tasks such as local transportation and processing. Under current regulations in 20 CFR § 655.103, certain off-farm activities are permissible subject to specific conditions: the task must be directly related to the farm’s production, the worker must be employed by the farm operator, more than half of the commodities involved must be produced by that same operator, and the commodities must remain unmanufactured. These conditions create compliance uncertainty and audit risk for employers, particularly in livestock operations where on- and off-farm tasks often overlap. Ongoing policy discussions propose reducing this uncertainty by relaxing these conditions or explicitly authorizing additional off-farm tasks (Rep. Salazar, 2022; Sen. Paul, 2022; Rep. Allen, 2023; Rep. Lofgren, 2024; Rep. Salazar, 2024). To reflect the ongoing debate over off-farm work while avoiding excessive regulatory complexity, we simplified this attribute to two levels, either allowed or not allowed, to evaluate farmers’ preferences for greater task flexibilityFootnote 3 .
The fourth attribute, contract period, addresses the program’s restriction to seasonal employment (Susanto et al., Reference Susanto, Rosson, Anderson and Adcock2010; U.S. Citizenship and Immigration Services, 2020; U.S. Department of Labor, 2025b). Although the H-2A program does not impose requirements that explicitly exclude livestock operations, these farmers typically require year-round labor which is not eligible under the current rules. To represent reform efforts advocating expanded eligibility, which are primarily driven by livestock farmers and their representatives (Rep. Lofgren, 2024), this attribute included two levels: allowing or not allowing year-round employment.
The fifth attribute, labor mobility across employers, represents proposals to establish a portable H-2A visa program, under which approved H-2A workers could transfer among registered employers without submitting new applications, thus increasing flexibility and reducing administrative burdens (Rep. Salazar, 2022; Rep. Salazar, 2024). Two levels were included: No, representing the current policy that requires filing a new petition for each employer; and Yes, representing the proposed portable H-2A program.
The DCE employed an optimal orthogonal-in-the-differences (OOD) design, which reduces the number of choice scenarios relative to a full factorial design, thereby improving estimation efficiency and narrowing confidence intervals (Street, Burgess, and Louviere, Reference Street, Burgess and Louviere2005). To mitigate fatigue, a blocked design was implemented with three blocks of six choice scenarios each, and respondents were randomly assigned to one block (Savage and Waldman, Reference Savage and Waldman2008). The order of choice scenarios was randomized to minimize fixed-order effects in both modes (Day et al., Reference Day, Bateman, Carson, Dupont, Louviere, Morimoto, Scarpa and Wang2012).
In the paper survey, full randomization at the individual level was not feasible; therefore, three random sequences of choice scenarios were arranged within each block. In the electronic survey hosted on the online platform Qualtrics, randomization was implemented automatically using the built-in randomization function.
2.2. Closed-ended questions
The second section of the survey collected information on beef cattle farmers’ labor demand, hiring practices, perceptions, and outlook about their farm operations through closed-ended questions. Closed-ended questions are among the most common question formats in farmer and rural surveys. Respondents were asked whether they hired workers for their farms; the types of tasks requiring labor (on-farm, off-farm, or both); and whether their labor needs were urgent or well-scheduled. Questions on hiring practices covered the average number of hours each worker was employed per week, the basis of employment (hourly, daily, or monthly), and the average wage paid.
This section also included questions on farmers’ perceptions and future outlook, such as whether they had experienced difficulties finding workers in the past five years, whether they believed an improved guest worker program would benefit their operations, whether they were confident about their farms’ profitability over the next decade, and whether they planned to expand their operations.
2.3. Survey process measures
The final section of the survey included questions to evaluate the survey process based on five behavioral and perceptual measures. First, an attention check question was incorporated using an instructed-response item adapted from Kam and Chan (Reference Kam and Chan2018) and Kung, Kwok, and Brown (Reference Kung, Kwok and Brown2018). Respondents were asked, “Please skip this question and do not choose any of the options supplied.” Selection of any option indicated a failure to pass the attention check.
Second, respondents were asked whether the survey content was clear and easy to understand, as clarity is a key factor contributing to the survey experience and response quality (Saris and Gallhofer, Reference Saris and Gallhofer2014). Third, respondents were asked whether they were satisfied with their overall survey experience. Positive survey experiences not only indicate that the survey was well received (Saris and Gallhofer, Reference Saris and Gallhofer2014) but also enhance institutional credibility, foster trust, and encourage future participation, which is especially important among farmers (Pennings, Irwin, and Good, Reference Pennings, Irwin and Good2002).
Fourth, respondents were asked whether they found the DCE section challenging. Because stated preference tasks are often the most cognitively demanding components of farmer and rural surveys, assessing perceived difficulty across administration modes provides insights into the feasibility of conducting such experiments among hard-to-reach populations (Galesic and Bosnjak, Reference Galesic and Bosnjak2009).
Finally, the time respondents finished the survey was recorded at the end of the questionnaire. In the paper mode, enumerators manually recorded the end time, whereas in the electronic mode, it was recorded automatically by the online platform. Completion time was calculated as the difference between the survey start and end times. In intercept surveys, longer completion times are considered desirable, as they are often associated with more thoughtful and engaged responses (Jeong et al., Reference Jeong, Aggarwal, Robinson, Kumar, Spearot and Park2023; Knapova et al., Reference Knapova, Smahel, Dedkova, Matyas and Yan2022; Penkala, Reference Penkala2004).
Overall, the survey was designed to be completed within ten minutes following previous recommendations on survey length with farmers (Jeong et al., Reference Jeong, Aggarwal, Robinson, Kumar, Spearot and Park2023; Penkala, Reference Penkala2004; Pennings, Irwin, and Good, Reference Pennings, Irwin and Good2002). The paper and electronic modes delivered identical survey content. In the paper mode, packets containing printed survey materials were distributed with clipboards and pencils. Respondents marked their responses by checking boxes, and the completed packets were collected by enumerators and imported for analysis. In the electronic mode, packets containing a printed QR code were distributed. Respondents scanned the code to access a survey hosted on Qualtrics, where their responses were automatically recorded and exported for analysis.
Extra care was taken to ensure that the electronic interface was optimized for smartphone screens, with minimal scrolling and legible font size to reduce respondent burden and enhance usability (Rivas and Schulzetenberg, Reference Rivas, Schulzetenberg, Rivas and Schulzetenberg2023). Enumerators overseeing both paper and electronic survey processes were instructed to encourage, but not mandate, respondents to complete all questions. No forced responses were used in either mode.
To ensure sample balance between modes, two procedures were implemented. First, respondents in both modes were recruited at the same event under identical environmental conditions and using the same recruitment protocol. Second, participants were randomly assigned to survey modes after providing consent, following field randomization practices used in prior studies (Penkala, Reference Penkala2004; Torgerson and Roberts, Reference Torgerson and Roberts1999; McMaster et al., Reference McMaster, LeardMann, Speigle, Dillman, Stander, Pflieger, Carballo, Powell, Woodall, Sun, Bauer, Lee, Corry, Williams, Fairbank, Murphy, Briggs-King, Gerrity and Lee2017). A total of 55 packets for the paper mode (each containing a consent form and six pages of survey materials) and 55 packets for the electronic mode (each containing a consent form and a printed QR code) were numbered and arranged in a computer-generated random sequence, then distributed sequentially. Following Yetter and Capaccioli (Reference Yetter and Capaccioli2010), respondents were not informed of their assigned mode before providing consent and were unaware of the alternative mode to avoid self-selection.
The survey was conducted at [Censored for Review], the largest educational conference for beef cattle farmers in the United States, in August 2024. Following standard intercept survey practices, four enumerators were hired and trained using a standardized protocol to recruit participants, monitor survey completion, collect materials, and provide technical assistance, including explanations of the DCE (Avemegah et al., Reference Avemegah, Gu, Abulbasher, Koci, Ogunyiola, Eduful, Li, Barington, Wang, Kolady, Perkins, Leffler, Kovács, Clark, Clay and Ulrich-Schad2021; Carson and Louviere, Reference Carson and Louviere2011; Galesic and Bosnjak, Reference Galesic and Bosnjak2009; Pitts et al., Reference Pitts, Gustafson, Wu, Mayo, Ward, McGuirt, Rafferty, Lancaster, Evenson, Keyserling and Ammerman2014). A central station was established in the main conference building to store materials and distribute incentives. Enumerators were deployed to four high-traffic areas within the conference venue to approach attendees, verify that they were beef cattle farmers with operational decision-making authority, and invite them to participate. Once consent was obtained, respondents were provided with the next available survey packet, completed it under enumerator supervision, and returned the materials, which were then logged at the central station.
To encourage participation, the first 55 respondents received a $20 incentive, and the remaining 55 received a $10 incentive. The study was approved by the [Censored for Review] Institutional Review Board (IRB ID: STUDY2024-0238). Both survey modes were pretested with students and a small group of farmers to ensure clarity, effectiveness, and relevance prior to implementation. The electronic survey was additionally tested across multiple brands and models of smartphones to confirm that the DCE tasks were rendered properly and were fully visible.
3. Econometric and statistical analysis
3.1. Discrete choice experiment
The DCE and its analysis are grounded in random utility theory (McFadden, Reference McFadden1974). Originally developed for consumer preference analysis, this framework has been widely used to study producers’ adoption decisions regarding policies, technologies, and production practices that often involve trade-offs among multiple dimensions of utility that extend beyond monetary profit, including stability, risk, flexibility, and sustainability (Blasch et al., Reference Blasch, Vuolo, Essl and van der Kroon2021; Ortiz, Avila-Santamaría, and Martinez-Cruz, Reference Ortiz, Avila-Santamaría and Martinez-Cruz2023; Yue et al., Reference Yue, Lai, Watkins, Patton and Braun2023; Zhang and Melo, Reference Zhang and Melo2025). Within this framework, farmers are assumed to select the alternative that maximizes their perceived utility based on the attributes presented.
Survey administration modes may influence DCE outcomes along two key dimensions: (1) utility scale, where respondents may systematically differ in choice randomness across modes (Adamowicz, Louviere, and Williams, Reference Adamowicz, Louviere and Williams1994; Fiebig et al., Reference Fiebig, Keane, Louviere and Wasi2010; Hensher, Reference Hensher2012; Lindhjem and Navrud, Reference Lindhjem and Navrud2011); and (2) mean preferences, where respondents may differ in the direction or magnitude of attribute valuation (Murwirapachena and Dikgang, Reference Murwirapachena and Dikgang2022; Watson et al., Reference Watson, Porteous, Bolt and Ryan2019). To evaluate potential differences across these dimensions while maintaining balance between model complexity and sample size (Louviere, Hensher, and Swait, Reference Louviere, Hensher and Swait2000; Train, Reference Train2009), we estimate a series of discrete choice models.
First, we estimate a Generalized Multinomial Logit (GMNL) model developed by Fiebig et al. (Reference Fiebig, Keane, Louviere and Wasi2010), which has been widely used to test for scale heterogeneity arising from differences in survey mode, population, or data source (Liebe et al., Reference Liebe, Glenk, Oehlmann and Meyerhoff2015; Whitehead and Lew, Reference Whitehead and Lew2020). The utility respondent i derives from choosing alternative j in choice scenario t is specified as:
 $$ U_{ijt}=\beta _{i1}WAGE_{jt}+\beta _{i2}\textit{SPROC}_{jt}+\beta _{i3}\textit{OFFFARM}_{jt}+\beta _{i4}\textit{YRROUND}_{jt}+\beta _{i5}\textit{MOBILITY}_{jt}+\gamma ASC_{jt}+\varepsilon _{ijt}. $$
In equation (1), the explanatory variables represent the attribute levels of the reformed H-2A policy alternatives that influence utility U ijt . WAGE jt denotes the required hourly wage, taking values of 13, 15, or 17 depending on the scenario. SPROC jt , OFFFARM jt , YRROUND jt are binary indicators equal to 1 if the processing time is shortened, if off-farm work is allowed, and if year-round employment is allowed, respectively, and 0 otherwise. ASC jt is the alternative-specific constant associated with the opt-out option (“I won’t use either”), and γ represents the baseline utility assigned to opting out. The error term ϵ ijt follows a Type I extreme value distribution.
The individual preference parameters β ik , representing respondent i’s preference for attribute k), are further specified to account for individual preference heterogeneity as:
 $$ \beta _{ik}=exp\left(\theta ELEC_{i}\right)\beta _{k}+\eta _{ik}, $$
where β k is the population mean preference for attribute k, and η ik captures unobserved individual heterogeneity. The indicator variable ELEC i = 1 if respondent i completed the electronic survey and 0 otherwise. The parameter θ measures systematic utility scale differences associated with the electronic mode relative to the paper mode. Preference parameters are assumed to follow a triangular distribution for the attribute WAGE(k=1) and normal distributions for the remaining attributes (k = 2,…,5). The triangular specification constrains the WAGE coefficient to a single sign to ensure economically plausible estimates, while the normal distributions for other attributes allow preference heterogeneity to vary in directionFootnote 4 .
The GMNL model nests the Mixed Logit (MXL) model as a special case when the utility scale does not vary across respondents. In our estimation, the scale heterogeneity parameter θ was not statistically significant, indicating no systematic scale differences between modes. Accordingly, we estimate a standard MXL model with individual preference parameters defined as:
 $$ \beta _{ik}=\beta _{k}+\eta _{ik},k=1,\ldots, 5. $$
To test for mean preference differences between modes, we estimate a second MXL model specification with interaction terms between all five attributes and the electronic mode indicator (ELEC i ), referred to as MXL-I. The utility function is specified as:
 $$ U_{ijt}=\beta _{i1}WAGE_{jt}+\beta _{i2}\textit{SPROC}_{jt}+\beta _{i3}\textit{OFFFARM}_{jt}+\beta _{i4}\textit{YRROUND}_{jt}+\beta _{i5}\textit{MOBILITY}_{jt}+\delta _{i1}\left(WAGE_{jt}\times ELEC_{i}\right)+\delta _{i2}\left(\textit{SPROC}_{jt}\times ELEC_{i}\right)+\delta _{i3}\left(\textit{OFFFARM}_{jt}\times ELEC_{i}\right)+\delta _{i4}\left(\textit{YRROUND}_{jt}\times ELEC_{i}\right)+\delta _{i5}\left(\textit{MOBILITY}_{jt}\times ELEC_{i}\right)+\gamma ASC_{jt}+\varepsilon _{ijt}. $$
The coefficients δ 1 through δ 5 capture potential mean preference differences between respondents in the paper and electronic modes. All models were estimated using simulated maximum likelihood with 500 Halton draws (Greene and Hensher, Reference Greene and Hensher2010), implemented with the gmnl package in R (Sarrias and Daziano, Reference Sarrias and Daziano2017).
3.2. Closed-ended questions
For the closed-ended questions measured on five-point Likert scales, including those assessing farmers’ confidence in future profitability and likelihood of expansion, responses were dichotomized at the midpoint, indicating a neutral attitude (MacCallum et al., Reference MacCallum, Zhang, Preacher and Rucker2002). The proportions of respondents selecting options above the midpoint were reported and compared across modes using two-proportion z-tests. For other closed-ended questions related to farmers’ labor demand and hiring practices, the proportion of respondents selecting each option was summarized and reported, and differences between modes were tested using two-proportion z-tests.
3.3. Survey process measures
For the survey process measures, differences in average survey completion time between the paper and electronic modes were tested using Welch’s t-test. For the attention check, the proportion of respondents who passed was reported, and differences between modes were tested using a two-proportion z-test.
For the remaining three measures, including whether the survey content was clear, whether respondents were satisfied with the survey experience, and whether they found the DCE section challenging, responses were collected using five-point Likert scales. Proportions of responses above the midpoint were summarized and compared between modes using two-proportion z-tests.
4. Results
We received 51 and 48 completed responses for the paper and electronic surveys, respectively, resulting in completion rates of 93 and 87%. These rates are consistent with those typically reported in intercept surveys (Avemegah et al., Reference Avemegah, Gu, Abulbasher, Koci, Ogunyiola, Eduful, Li, Barington, Wang, Kolady, Perkins, Leffler, Kovács, Clark, Clay and Ulrich-Schad2021; Carson and Louviere, Reference Carson and Louviere2011; Pitts et al., Reference Pitts, Gustafson, Wu, Mayo, Ward, McGuirt, Rafferty, Lancaster, Evenson, Keyserling and Ammerman2014). Although the completion rate was higher for the paper mode, a two-proportion z-test indicated that the difference was not statistically significant (p = 0.34).
Table 2 reports sample producer characteristics by survey mode. The results indicate that age, education, herd size, and income source were balanced across the paper and electronic modes. The sample primarily consisted of beef cattle farmers under the age of 50 who held a college degree and had secondary income sources in addition to beef cattle production. About half managed small herds of fewer than 100 cows. Overall, the sample comprised a higher proportion of younger and more educated respondents than the general U.S. farming population, while herd size and income structure align with national averages. This difference likely reflects the nature of the educational conference setting, which tends to attract producers who are younger, more educated, and more engaged in information-seeking and technology adoption (Läpple and Hennessy, Reference Läpple and Hennessy2015).
Sample composition

Table 2 Long description
The table compares producer characteristics by survey mode, including age, education, herd size, and income source. It has five rows and five columns. The columns are labeled Characteristics, National average, Paper survey (N = 51), Electronic survey (N = 48), and p-value. The rows are labeled Age under 50, College degree, Herd size below 100, and Secondary income. Row 1: Age under 50, National average: 36.8 percent under 55, Paper survey: 69 percent, Electronic survey: 75 percent, p-value: 0.48. Row 2: College degree, National average: 50 percent, Paper survey: 71 percent, Electronic survey: 79 percent, p-value: 0.36. Row 3: Herd size below 100, National average: 56 percent, Paper survey: 53 percent, Electronic survey: 42 percent, p-value: 0.36. Row 4: Secondary income, National average: 71 percent, Paper survey: 73 percent, Electronic survey: 75 percent, p-value: 0.96.
4.1. Discrete choice experiment
The results of the MXL, GMNL, and MXL-I models estimated from the DCE data are presented in Table 3. In the GMNL model, the utility scale parameter corresponding to the electronic mode (θ) was not statistically significant, indicating no systematic utility scale differences between the paper and electronic modes.
Discrete choice experiment preference estimates

Table 3 Long description
A table comparing preference estimates across three models: GMNL, MXL, and MXL-I. The table has 21 rows and 4 columns. Column headers are Mean, Std. Dev., Interaction (x Electronic Format (ELEC)), and Utility Scale Parameter. Row labels include WAGE, SPROC, OFFFARM, YRROUND, MOBILITY, and ASC for the Mean section; WAGE, SPROC, OFFFARM, YRROUND, MOBILITY for the Std. Dev. section; WAGE x ELEC, SPROC x ELEC, OFFFARM x ELEC, YRROUND x ELEC, MOBILITY x ELEC for the Interaction section; and theta for the Utility Scale Parameter section. The table also includes Model Statistics with Number of respondents (N), Number of Observations (N x t), LogLikelihood, AIC, and BIC. Each cell contains numerical values with standard errors in parentheses. Notable trends include significant values for WAGE, SPROC, OFFFARM, and ASC across different models, with varying standard deviations and interaction effects.
Notes: This table reports the results from three models estimated using the Discrete Choice Experiment data. In the GMNL model, the parameter θ captures the systematic utility scale difference of electronic responses relative to paper responses. When the utility scale is not accounted for, the GMNL model reduces to a standard MXL model presented next. Finally, an additional MXL-I model, built upon the MXL by incorporating interactions between the mode indicator (ELEC) and all attribute variables, is estimated to capture mean preference heterogeneity.
Asterisks denote statistical significance: * p < 0.10, ** p < 0.05, *** p < 0.01.
In the MXL-I model, which accounts for mean preference heterogeneity by including interactions between attributes and survey mode, we found a significant difference for the attribute processing time: respondents in the electronic mode placed less value on shorter application processing times than those in the paper mode. Across all models, the attributes of preset wage and off-farm work significantly influenced farmers’ utility and hypothetical adoption decisions. The standard deviation terms for all attributes were statistically significant, indicating the presence of unobserved preference heterogeneity.
We estimated the mean WTP values and 95% confidence intervals of the attributes based on 1,000 clustered bootstrap replications, resampled at the individual level. WTP values are calculated as the negative ratio of the corresponding attribute coefficients to the wage coefficient, as shown in Table 4. Based on the MXL-I model, paper-mode respondents were, on average, willing to pay an additional $1.58 per hour, equivalent to 13% of the wages they currently pay workers ($12.61 per hour as reported in the closed-ended question section), for a shorter application process (from 75 to 30 days). They were also willing to pay an additional $1.92 per hour, or 15% of the wages they pay workers, to adopt a program that clearly allows off-farm tasks compared to one that does not. In contrast, electronic-mode respondents exhibited a WTP of $1.82 per hour, approximately 14% of the wages they currently pay workers, for a program that allows off-farm work compared to one does not.
Discrete choice experiment willingness to pay (WTP) estimates

Table 4 Long description
The table presents willingness to pay (WTP) estimates for various attributes using different models. It has 16 rows and 3 columns. The columns are labeled Attribute, Mean WTP ($/hr), and 95% Confidence Interval. The rows are grouped by different models: GMNL model, MXL model, MXL-1 model (paper survey respondents), and MXL-1 model (electronic survey respondents). Each model group includes attributes such as SPROC (shorten processing time), OFFFARM (allow off-farm work), YRROUND (allow year-round employment), and MOBILITY (allow mobility across employers). The values in the Mean WTP ($/hr) column and the 95% Confidence Interval column vary for each attribute and model. Notable trends include higher WTP for OFFFARM across all models and negative WTP for MOBILITY in the GMNL and MXL models.
Notes: The table reports mean WTP estimates and 95% confidence intervals. WTP is calculated as the negative ratio of each attribute coefficient to the wage coefficient. Estimates are based on 1,000 clustered bootstrap replications resampling at the individual level. Estimates in bold are statistically significant at the 0.05 level.
In summary, although no utility scale differences were observed across administration modes, a mean preference difference was found for the attribute processing time, which was positively valued by paper survey respondents but deemed irrelevant by electronic respondents. Overall, a higher required wage consistently reduced farmers’ likelihood of adoption, and allowing off-farm work was consistently valued across all models and both modes. Across all attributes tested, significant unobserved preference heterogeneity was found.
4.2. Closed-ended questions
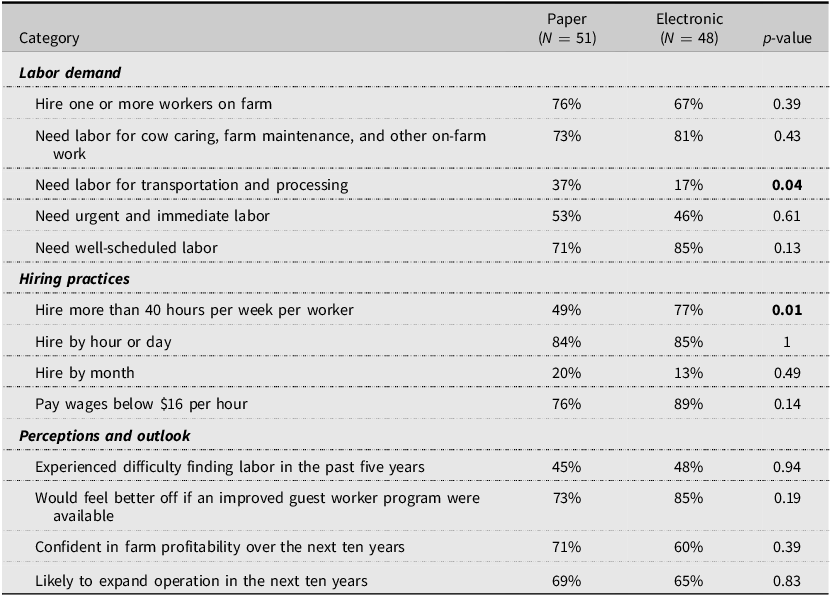
Closed-ended question responses are summarized in Table 5. Out of 13 items, responses were highly consistent across modes, with only two showing moderate differences. A higher proportion of paper-mode respondents reported needing labor for off-farm tasks, whereas a higher proportion of electronic-mode respondents reported hiring workers for more than 40 hours per week. The remaining questions showed no evidence of differences across modes.
Closed-ended responses by administration mode

Table 5 Long description
The table compares closed-ended responses by administration mode, focusing on labor demand, hiring practices, and perceptions and outlook. It has 13 rows and 5 columns. The columns are labeled Category, Paper (N = 51), Electronic (N = 48), and p-value. The rows are grouped under three main categories: Labor demand, Hiring practices, and Perceptions and outlook. Each row lists specific questions or statements with corresponding percentages for Paper and Electronic modes, and a p-value indicating the significance of differences. Notable differences include a higher proportion of paper-mode respondents needing labor for off-farm tasks and a higher proportion of electronic-mode respondents hiring workers for more than 40 hours per week.
Notes: Each row reports the proportion of respondents who indicated a positive response for the corresponding category. Some questions allowed multiple selections; therefore, percentages may not sum to 100. p-values are based on two-sample proportion z-tests comparing across modes. Bolded p-values indicate significance at the 5% level.
Overall, most beef cattle farmers reported hired labor needs, with more than two-thirds hiring at least one worker on their farms. While the majority required labor for core on-farm tasks, a notable portion (37% in the paper mode and 17% in the electronic mode) also reported needing labor for off-farm activities including transportation and processing. In addition to well-scheduled labor demand commonly found in other livestock industries (Peña-Lévano, Burney, and Beaudry, Reference Peña-Lévano, Burney and Beaudry2023), beef cattle farmers exhibited a non-trivial demand for urgent and immediate labor. More than half of the farmers reported employing workers for over 40 hours per week, with hourly or daily pay being the most common payment arrangement. The majority paid wages below $16 per hour, with an estimated average being $12.61Footnote 5 , which is well below the AEWR of $15.55 required as the minimum wage for the H-2A program in Texas in 2024 (U.S. Department of Labor, 2025a).
Regarding perceptions, about half of the farmers reported difficulties finding workers in the past five years, indicating ongoing labor shortages in the industry. Most also noted that they would benefit from an improved guest worker program. Looking ahead, the majority expressed confidence in their farm profitability and anticipated expanding operations within the next decade, suggesting an overall optimistic outlook.
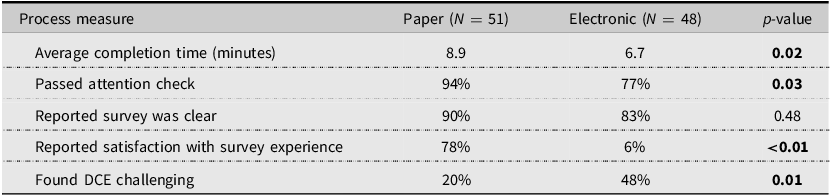
4.3. Survey process measures
Results for survey process measures are summarized in Table 6. Significant differences were observed between modes across all measures except one. Paper-mode respondents spent an average of 8.9 minutes completing the survey, significantly longer than the 6.7 minutes observed in the electronic mode (p < 0.05).
Survey process measures by administration mode

Table 6 Long description
A table comparing survey process measures by administration mode, highlighting significant differences between paper and electronic modes. The table has 6 rows and 4 columns. Column headers are Process measure, Paper (N = 51), Electronic (N = 48), and p-value. Row labels are Average completion time (minutes), Passed attention check, Reported survey was clear, Reported satisfaction with survey experience, and Found DCE challenging. Row 1: Average completion time (minutes), Paper (N = 51), 8.9, Electronic (N = 48), 6.7, p-value, 0.02. Row 2: Passed attention check, Paper (N = 51), 94 percent, Electronic (N = 48), 77 percent, p-value, 0.03. Row 3: Reported survey was clear, Paper (N = 51), 90 percent, Electronic (N = 48), 83 percent, p-value, 0.48. Row 4: Reported satisfaction with survey experience, Paper (N = 51), 78 percent, Electronic (N = 48), 69 percent, p-value, less than 0.01. Row 5: Found DCE challenging, Paper (N = 51), 20 percent, Electronic (N = 48), 48 percent, p-value, 0.01.
Notes: The p-value for average completion time is based on Welch’s t-test; p-values for all other measures are based on two-proportion z-tests. Bolded p-values indicate significance at the 5% level.
While most respondents in both modes passed the attention check, paper respondents achieved a higher pass rate (94%) than electronic respondents (77%, p < 0.05). Regarding survey clarity, 90% of paper respondents and 83% of electronic respondents reported that the survey content was clear and easy to understand, a difference that was not statistically significant (p = 0.48). Satisfaction with the survey experience differed markedly (p < 0.01): 78% of paper respondents reported being satisfied with the survey experience compared with only 6% in the electronic mode (p < 0.01). Additionally, 20% of paper respondents and 48% of electronic respondents reported finding the DCE section challenging (p < 0.05).
Overall, the survey process measures indicate that the paper mode yielded more favorable outcomes than the electronic mode. Although the majority of respondents in both groups found the survey clear, paper respondents spent more time, demonstrated greater attentiveness, presented higher satisfaction, and fewer of them reported finding the DCE tasks challenging.
5. Discussion
5.1. Administration mode effects on survey outcomes
We evaluated the effects of survey administration mode across three outcome measures: DCE-elicited preferences, closed-ended responses, and survey process measures. Among these, process measures exhibited the greatest differences across modes. While most respondents in both modes agreed that the survey content was clear and easy to understand, respondents in the electronic mode spent less time completing the survey, paid less attention, and reported lower satisfaction. These patterns likely reflect lower overall engagement among respondents in the electronic mode.
One possible explanation is the higher level of distraction inherent in digital interfaces (Höhne et al., Reference Höhne, Schlosser, Couper and Blom2020). Digital devices, particularly smartphones, cannot fully replicate the visual layout of paper surveys and have often been associated with reduced attention and cognitive engagement (Rivas and Schulzetenberg, Reference Rivas, Schulzetenberg, Rivas and Schulzetenberg2023). Another potential source is that electronic surveys are more susceptible to satisficing behaviors, such as speeding or straightlining (Zhang and Conrad, Reference Zhang and Conrad2014). These behaviors lead respondents to move through questions rapidly without fully processing them, thereby shortening completion time and reducing attention and overall response quality.
The preference analysis using DCEs revealed no systematic differences in utility scale across administration modes, consistent with Determann et al. (Reference Determann, Lambooij, Steyerberg, de Bekker-Grob and de Wit2017). This suggests that the electronic mode does not inherently increase choice randomness relative to the paper mode. This result is likely attributable to the controlled intercept setting and the standardized recruitment process across modes which mitigated self-selection.
However, differences emerged in mean preference estimates. Attribute processing time was valued by respondents in the paper mode but was found to have a negligible effect on utility in the electronic mode. This pattern of attribute non-attendance is likely associated with relatively lower attention and greater perceived difficulty in the DCE section among respondents in the electronic mode (Liebe et al., Reference Liebe, Glenk, Oehlmann and Meyerhoff2015; Zhang and Conrad, Reference Zhang and Conrad2014).
Closed-ended questions exhibited the smallest differences across modes. Only two of the thirteen items differed: the proportion of farmers needing labor for off-farm tasks and the proportion hiring individual workers for more than 40 hours per week. Other questions, including attitudinal and outlook items, remained comparable across modes. This aligns with prior findings that straightforward multiple-choice questions are generally less affected by administration mode and interface differences (Dillman, Smyth, and Christian, Reference Dillman, Smyth and Christian2014).
Overall, we find meaningful outcome differences between the electronic and paper modes. Several practical implications follow. First, researchers should exercise caution when comparing results from surveys administered using different modes. While responses to straightforward closed-ended questions may be largely comparable, researchers should remain mindful of the potential differences in process measures and DCE-elicited preferences for studies administered in different modes.
Second, researchers should balance efficiency and response quality when making survey mode selection decisions, taking into account their research objectives and available resources. While electronic modes are increasingly popular for their higher efficiency, lower costs, and reduced administrative burden, they may be associated with lower response quality and less favorable respondent experiences. Although electronic mode can yield comparable responses for simple multiple-choice questions, for surveys involving complex instruments, such as stated preference DCEs, the traditional paper mode remains preferable due to higher respondent engagement.
Finally, practitioners should exercise caution when selecting administration modes for policy briefings or outreach surveys. Electronic modes may yield lower response quality and less favorable survey experiences among farmers, potentially harming institutional credibility and future participation. Relying on electronic mode may also systematically exclude stakeholders who are less comfortable with technology, thereby exacerbating digital inequality. In such contexts, paper-based or mixed-mode approaches may represent safer and more inclusive alternatives.
5.2. Beef cattle farmers’ labor dynamics and preferences for H-2A reforms
We find that beef cattle farmers have substantial demand for hired labor to perform both traditional on-farm agricultural tasks and a variety of off-farm activities. Overall, these farmers report confidence in future profitability and plans for production expansion. However, nearly half have already experienced labor difficulties, which may intensify in the future. This highlights a potential role for the H-2A program in alleviating labor shortages in the livestock sector.
By comparing beef cattle farmers’ labor demand and hiring practices with current H-2A regulations, we identify two major misalignments that may limit program adoption. First, most beef cattle operations rely on well-scheduled, year-round labor, which is incompatible with the H-2A program’s seasonal employment requirement. Second, the required AEWR is considerably higher than the wages typically paid by beef cattle farmers, making participation financially challenging.
Results from the DCE analysis show that wage levels and the flexibility to assign workers to off-farm tasks are consistently valued by farmers. This finding aligns with prior studies showing that farmers prioritize cost and production practice considerations in farm operations (Mugnier, Husson, and Cournut, Reference Mugnier, Husson and Cournut2021). In contrast, attributes reflecting other proposed reforms, such as allowing year-round employment and establishing a portable H-2A program, were not consistently valued. This limited support may reflect information gaps, as many beef cattle farmers have limited familiarity with the H-2A program and are hesitant to rely on it for year-round labor in core production activities that are vulnerable to disruption. In addition, the regulatory complexity and administrative burden associated with year-round employment may be perceived as higher compliance costs and risks, thereby deterring participation among generally risk-averse farmers (Zhang and Melo, Reference Zhang and Melo2025).
These findings yield several policy implications for improving H-2A program accessibility for beef cattle farmers. First, our results support efforts to relax restrictions on year-round employment and to allow greater flexibility in assigning workers to off-farm tasks, which would better align the program with livestock production practices. Second, while the high wage requirement remains a major barrier to adoption, adjustments to the AEWR calculation or policies that limit its growth could improve alignment with industry conditions. Finally, communication and outreach related to the H-2A program can be strengthened across agricultural sectors to improve farmers’ understanding of program rules and ongoing reform efforts, thereby fostering broader support for policy initiatives.
6. Limitations
This study has some limitations. First, the sample includes 99 responses, which falls within the common range for intercept surveys with farmer participants, in which data collection is constrained by the high cost and one-on-one nature of intercept surveys (Bator, Bryan, and Wesley Schultz, Reference Bator, Bryan and Wesley Schultz2011; Pitts et al., Reference Pitts, Gustafson, Wu, Mayo, Ward, McGuirt, Rafferty, Lancaster, Evenson, Keyserling and Ammerman2014). Although the sample yielded 594 observed choice scenarios and it exceeds the minimum sample sizes suggested by Lancsar and Louviere (Reference Lancsar and Louviere2008), who recommend 60 responses, and Assele, Meulders, and Vandebroek (Reference Assele, Meulders and Vandebroek2023), who recommend 84 responses, a larger sample would have improved statistical power.
Second, the sample contains a higher proportion of younger and more educated beef cattle farmers than the national farming population. Given that herd size and income sources align with national averages, the labor dynamics observed in the sample are likely reasonably representative. However, younger and more educated farmers tend to be more open to new or unfamiliar policies and technologies (Läpple and Hennessy, Reference Läpple and Hennessy2015), which could introduce an upward bias in the estimated WTP for policy attributes.
Finally, because this study focuses on intercept surveys, which are particularly effective for hard-to-reach populations when their contact information is unavailable, caution should be exercised in generalizing the results to remote surveys, such as mail or internet surveys, which differ in respondent context and interaction. Future research could extend this work by testing different survey modes in both in-person and remote settings and by validating the findings with a broader set of stakeholders across diverse demographic groups.
7. Conclusion
This study examined whether administration mode affects survey outcomes among hard-to-reach populations. We conducted an intercept survey using both paper and electronic modes to assess beef cattle farmers’ labor dynamics and preferences for H-2A program reforms during a national producers’ conference. The analysis focused on three types of outcomes: DCE-elicited preferences, closed-ended responses, and survey process measures.
Results indicate that closed-ended responses were largely consistent across modes and no systematic differences in the utility scale were observed in the DCE analysis. However, mean preference estimates for a single DCE attribute varied between modes. Substantial differences in survey process measures support this interpretation: paper-mode respondents spent more time completing the survey, paid closer attention, and reported higher satisfaction with the survey experience.
These findings indicate significant differences in survey outcomes across administration modes. While the electronic mode represents a viable option for questionnaires consisting primarily of straightforward multiple-choice items, the paper mode remains preferable for surveys involving complex tasks that require greater engagement, such as DCEs, when resources allow.
This study also highlights the labor challenges faced by beef cattle farmers. The H-2A program holds potential to address these challenges if policymakers implement reforms that better align program rules with farmer practices, such as relaxing restrictions on year-round employment, allowing off-farm work, and adjusting the AEWR to reflect prevailing industry wages. Targeted outreach and communication efforts to increase farmers’ awareness and understanding of the program and its reforms could help stakeholders make more informed participation decisions and build greater support for these initiatives.
Supplementary material
The supplementary material for this article can be found at https://doi.org/10.1017/aae.2026.10040.
Data availability statement
The data that support the findings of this study are available on request from the corresponding author, [JZ]. The data are not publicly available due to privacy concerns as mandated by the Institutional Review Board, as the data contain information that could compromise the privacy of research participants.
Acknowledgements
None.
Author contribution
Conceptualization, J.Z. and G.M.; Methodology, J.Z. and G.M.; Formal analysis, J.Z. and G.M.; Data curation, J.Z. and G.M.; Writing – original draft, J.Z. and G.M.; Writing – review and editing, J.Z. and G.M.; Supervision, G.M.; Funding acquisition, G.M.
Financial support
This research was supported by the U.S. Department of Agriculture (USDA) Sustainable Agriculture Research and Education (SARE) program under project number LS23-387. The contents are solely the responsibility of the authors and do not necessarily represent the views of the USDA or SARE.
Competing interests
The authors declare no conflict of interest.
Use of artificial intelligence tools
The author used the generative AI tool ChatGPT4.5 (OpenAI) solely for spell-checking during manuscript preparation. No content, ideas, data, analyses, or images generated by AI were included in the manuscript.


 Open access