


As the coronavirus disease 2019 (COVID-19) pandemic swept through the United States, regions experienced peak cases and hospitalizations at various times in 2020.Reference Sapiano, Dudeck and Soe1 The pandemic response placed burden on acute-care hospitals (ACHs), which may have altered staffing practices, increased critical care capacity, and modified use of personal protective equipment (PPE).Reference Rebmann, Alvino and Holdsworth2,Reference Weiner-Lastinger, Dudeck and Allen-Bridson3 In the early stages of the pandemic, little was known about how COVID-19 hospitalizations would affect the incidence of healthcare-associated infections (HAIs). Single-site studies observed early signs of increases in select HAIs during the spring of 2020.Reference Fakih, Bufalino and Sturm4–Reference LeRose, Sandhu and Polistico6 Others have studied the occurrence of secondary infections in COVID-19 patients.Reference Kumar, Adams and Hererra7–Reference Smith, Karaba and Amoah9 Additionally, a report from the National Healthcare Safety Network (NHSN) found significant increases in central-line–associated bloodstream infections (CLABSIs) during the early months of the pandemic.Reference Patel, Weiner-Lastinger and Dudeck10
The NHSN is the nation’s largest HAI surveillance system and is used by nearly all US hospitals to fulfill local, state, or federal HAI reporting requirements. NHSN data are used to measure progress toward prevention goals; this progress is assessed using an observed-to-predicted ratio called the standardized infection ratio (SIR).11 Nationally, from 2015 to 2019, there have been consistent, significant reductions in the SIRs for CLABSIs, catheter-associated urinary tract infections (CAUTIs), and Clostridioides difficile infection (CDI) laboratory-identified (LabID) events.12–Reference Nkwata, Soe, Li, Godfrey-Johnson, Edwards and Dudeck14 Some significant year-to-year decreases have also been observed in methicillin-resistant Staphylococcus aureus (MRSA) bacteremia LabID events since 2010.12,13,Reference Jones, Mu and Li15 Conversely, there has been minimal change in the occurrence of ventilator-associated events (VAEs).12 Given the potential for COVID-19 response activities to impact HAI prevention and surveillance, the NHSN team analyzed national and state SIRs to identify potential changes in HAI incidence between 2019 and 2020.
Methods
CLABSIs, CAUTIs, VAEs, select surgical site infections (SSIs), MRSA LabID, and CDI LabID events that occurred in ACHs between 2019 and 2020 and were reported to the NHSN Patient Safety Component as of April 1, 2021, were included in this report. Standard surveillance definitions and exclusion rules are described elsewhere for each HAI type.16
CLABSIs and CAUTIs included in this analysis were those in scope for the Centers for Medicare and Medicaid Services (CMS) Hospital-Acquired Conditions Reduction Program (HACRP).17 The HACRP includes infections that occurred in adult and pediatric intensive care units (ICUs), neonatal ICUs (CLABSI only), and adult and pediatric medical, surgical, and medical–surgical wards. VAE data encompass all events classified as ventilator-associated condition (VAC), infection-related ventilator-associated condition (IVAC), and possible ventilator-associated pneumonia (PVAP). VAE surveillance is not included in the CMS HACRP, but events reported voluntarily or due to a state mandate from adult ICUs and adult wards were included.
The SSIs included were a subset of those required under the HACRP and classified as deep incisional or organ-space infections following adult inpatient colon or abdominal hysterectomy procedures, detected during the same admission as the procedure or readmission to the same hospital. LabID event surveillance for both organisms is conducted for facility-wide inpatient (FacWideIN) locations and is required for participation in the HACRP. Hospitals that reported no FacWideIN patient days or admissions for a quarter were excluded from the LabID analysis for that quarter.
Temporal comparisons in HAI incidence between 2019 and 2020 were analyzed using national and state SIRs, calculated for each calendar quarter by dividing the number of reported infections by the number of predicted infections, and they were represented by the relative change in magnitude. The number of predicted infections was obtained using regression models created from the 2015 national baseline data with appropriate risk adjustment for the respective HAI. The complete risk adjustment methodology and criteria used for SIR numerators are summarized in the NHSN SIR Guide.11 SIRs below 1 indicate fewer infections observed than predicted, signaling reductions. Likewise, SIRs above 1 indicate more infections were observed than predicted, signaling increases.
The percentage change between pairs of 2019 and 2020 quarterly SIRs was calculated as follows:
 $${2020{\rm{\;SIR}} - 2019{\rm{\;SIR}}\over{{{2019{\rm{\;SIR}}}}}}\;\times\;100$$
The 95% confidence intervals around the percentage change were calculated, and a 2-tailed P ≤ .05 calculated by mid-P exact test was considered statistically significant. Percentile distributions of the 2020 SIRs were calculated using data from hospitals with at least 1 predicted HAI.
To reduce potential inclusion bias, SIR analyses were restricted to hospitals with complete surveillance data for both quarters in each pair of quarterly comparisons and for the same locations when applicable (ie, device-associated infections). Given the nature and impact of the pandemic on ACHs, the CMS issued an HAI reporting exception for 2020-Q1–2020-Q2, allowing hospitals to temporarily pause reporting to the NHSN.18 The impact of this exception was assessed for each HAI type by calculating the percentage of hospitals in 2019-Q1–2019-Q2 that also reported HAI data for 2020-Q1–2020-Q2.
The CDC previously identified the states with a high number of hospitalized COVID-19 patients between April 1 and July 14, 2020.Reference Sapiano, Dudeck and Soe1 To determine the impact of COVID-19 on HAI incidence in these states, the percentage change in state-level Q2 and Q3 SIRs were calculated for CLABSI, CAUTI, VAE, and MRSA bacteremia. For reference, supplemental data tables and interactive maps are provided on the NHSN website (https://www.cdc.gov/nhsn/datastat/index.html) that provide a comparison between 2019 and 2020 quarterly SIRs for all states and all applicable HAI types, as well as a comparison of location-stratified national SIRs for DA infections.
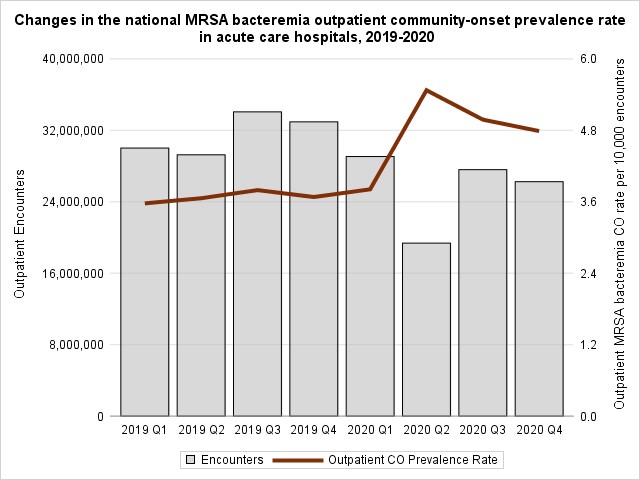
Additional supporting analyses were performed to help inform the changes in SIRs, including a review of the length-of-stay (from patient admission to discharge date), time to event (from device insertion to infection date), and device utilization measured by the standardized utilization ratio (SUR). SURs were calculated by dividing the number of reported device days by the number of predicted device days, based on 2015 national baseline data.19 In addition, the inpatient and outpatient quarterly community-onset MRSA bacteremia prevalence rates were reviewed from 2019-Q1 to 2020-Q4.16 The FacWideIN community-onset prevalence rate was calculated per 1,000 admissions, and the outpatient community-onset prevalence rate was calculated per 10,000 encounters in emergency departments and 24-hour observation units. Data were analyzed using SAS version 9.4 software (SAS Institute, Cary. NC).
Results
Most ACHs reporting 2019 HAI surveillance data continued to report data throughout 2020 (Table 1). Between 86% and 88% of hospitals that conducted surveillance for CLABSI, CAUTI, MRSA bacteremia, or CDI during 2019-Q1 or 2019-Q2 also reported surveillance data for 2020-Q1 or 2020-Q2. Larger declines in the number of reporting hospitals were seen for VAE (22 – 25% drop) and SSI (25%–36% drop) surveillance. Reporting levels during the second half of 2020 were close to those of the prepandemic period for most HAIs.
Number of Hospitals Reporting Healthcare-Associated Infection (HAI) Data to NHSN for 2020 Q1 and 2020 Q2 When a Standard Exception Was in Place for the Centers for Medicare and Medicaid (CMS) Hospital-Acquired Conditions Reduction Program
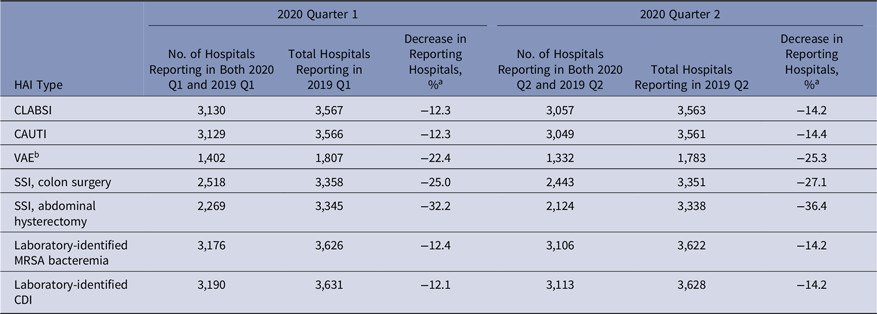
Note: NHSN, National Healthcare Safety Network; CLABSI, central-line–associated bloodstream infection; CAUTI, catheter-associated urinary tract infection; VAE, ventilator-associated event; SSI, surgical site infection; MRSA, methicillin-resistant Staphylococcus aureus; CDI, Clostridioides difficile infection; CMS, Centers for Medicare and Medicaid Services.
a Calculated as follows: [(hospitals reporting in 2020 − hospitals reporting in 2019) ÷ hospitals reporting in 2019] × 100.
b VAE data are not included in the requirements for the CMS Hospital-Acquired Conditions Reduction Program.
CLABSI
Despite an initial 12% decrease in the 2020-Q1 CLABSI SIR compared to 2019-Q1, the SIRs in 2020-Q2–2020-Q4 were significantly higher than those in 2019 (Tables 2–5). The largest year-to-year magnitudes of increase (46%–47%) occurred during Q3 and Q4, with the highest CLABSI SIR of 1.01 occurring during 2020-Q3. The increases in the CLABSI SIRs were driven by larger SIR numerators in 2020; for example, in 2020-Q3, there were 4,460 CLABSIs reported, representing a 53% increase compared to the 2,911 events reported from the same hospitals and locations in 2019-Q3. During the same time, the number of predicted CLABSIs increased by 5% (data not shown).
National Healthcare-Associated Infection (HAI) Standardized Infection Ratios (SIRs) for Acute-Care Hospitals, January–March 2020 (Q1)
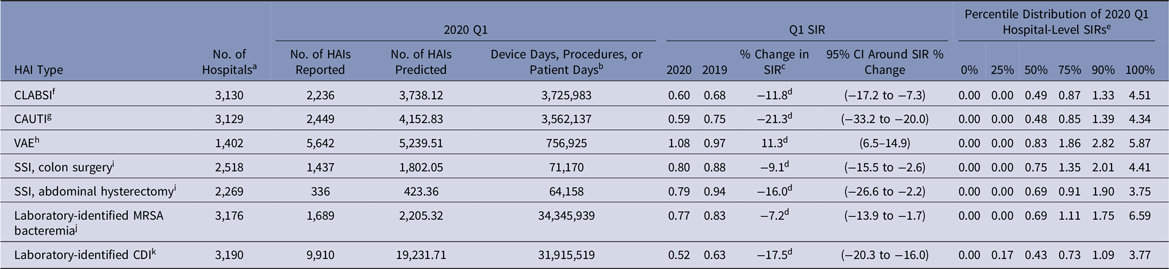
Note. CI, confidence interval; CLABSI, central-line–associated bloodstream infection; CAUTI, catheter-associated urinary tract infection; VAE, ventilator-associated event; SSI, surgical site infection; MRSA, methicillin-resistant Staphylococcus aureus; CDI, Clostridioides difficile infection; NHSN, National Healthcare Safety Network; CMS, Centers for Medicare and Medicaid Services; ICU, intensive care unit.
a The number of acute-care hospitals that reported complete HAI surveillance data for both quarters in the comparison.
b Device days are shown for CLABSI, CAUTI, and VAE. Procedure counts are shown for SSI. Patient days are shown for laboratory-identified events.
c % change was calculated as follows: [(2020 SIR − 2019 SIR) ÷ 2019 SIR] × 100.
d Statistical significance based on 2-tailed P ≤ .05, reflected in the relative % change in magnitude.
e Percentile distribution of hospital-level SIRs includes only those hospitals that had at least 1 predicted HAI.
f CLABSI SIRs were calculated using data from adult and pediatric ICUs, neonatal ICUs, and adult and pediatric medical, surgical, and medical–surgical wards.
g CAUTI SIRs were calculated using data from adult and pediatric ICUs, and adult and pediatric medical, surgical, and medical–surgical wards.
h VAE SIRs were calculated using data from adult ICUs and wards.
i SSIs included are those classified as deep incisional or organ-space infections following adult inpatient procedures that were detected during the same admission as the surgical procedure or upon readmission to the same hospital. The NHSN Complex Admission–Readmission model was used for SIR calculations.
j MRSA bacteremia SIRs were calculated using data from all inpatient locations in the hospital (facility-wide inpatient, or FacWideIN) except inpatient rehabilitation and inpatient psychiatric units certified by the CMS. Reported and predicted HAIs were limited to hospital-onset events that were identified in an inpatient location on the fourth day (or later) after admission to the facility.
k CDI SIRs were calculated using data from all inpatient locations in the hospital (FacWideIN) except neonatal ICUs, newborn nurseries, and inpatient rehabilitation and inpatient psychiatric units certified by the CMS. Reported and predicted HAIs were limited to hospital-onset incident events that were identified in an inpatient location on the fourth day (or later) after admission to the facility without a prior positive CDI specimen in the previous 56 days.
The change in CLABSI SIR varied by state and quarter (Table 6). Arizona’s CLABSI SIR was 149% higher in 2020-Q2 than 2019-Q2, and the SIR for Massachusetts doubled in 2020-Q2. Louisiana and Michigan experienced statistically significant increases of >70% in their Q2 CLABSI SIRs. Although New Jersey and New York reported nonsignificant changes in their CLABSI SIRs in 2020-Q2, both states had a substantial decline (61% and 40%, respectively) in the number of reporting hospitals in 2020-Q2 compared to 2019.12 The number of reporting hospitals returned to prepandemic levels in 2020-Q3 for both states, and New Jersey’s 2020-Q3 CLABSI SIR (0.86) was 59% higher than the SIR from 2019-Q3 (0.54). Arizona, Georgia, and Florida observed substantial (97%–148%) increases in their 2020-Q3 state SIRs compared to 2019-Q3.
CAUTI
The national CAUTI SIR steadily increased from 2020-Q1 to 2020-Q4, ranging from 0.59 in Q1 to 0.82 in Q4 (Tables 2–5). Significant increases in the 2020 CAUTI SIR compared to 2019 were observed in Q3 and Q4, with the Q4 SIR increasing by 19%, from 0.69 in 2019 to 0.82 in 2020. The increase in the Q4 CAUTI SIR was driven by a 36% increase in the number of infections, from 3,142 in 2019-Q4 to 4,258 in 2020-Q4. The number of predicted CAUTIs increased by 15% during this period. At the state level, significant increases in the Q3 CAUTI SIR were reported by Arizona (69%) and California (24%) (Table 7). Georgia, Massachusetts, Michigan, and New Jersey each observed >20% increase in their state’s CAUTI SIR for 2020-Q3 compared to 2019-Q3, although these increases were not statistically significant.
VAE
Between 1,332 and 1,496 hospitals reported VAE data to NHSN for each quarter in 2019 and 2020 (Tables 2–5). The 2020-Q2 and 2020-Q3 national VAE SIRs were 1.31 and 1.29. Preliminary Q4 data indicated an even higher SIR; 10,108 and 7,296 VAEs were reported and predicted respectively, resulting in a 2020-Q4 SIR of 1.39. Significant increases in the national VAE SIRs were observed in all 4 quarters of 2020 compared to 2019, with the largest increase of 45% occurring in Q4. Many states experienced significant increases in their VAE SIRs in 2020-Q2 and 2020-Q3, such as 88% and 91% increases in the Illinois and New York SIRs for Q2, and an 87% increase in the Georgia SIR for Q3 (Table 8). The median hospital-level VAE SIR for 2020-Q2, 2020-Q3, and 2020-Q4 were all above 1.0, with the highest median SIR of 1.30 occurring in Q4.
All Device-Associated infections
Overall, the national distributions of time to infection for CLABSI and CAUTI, or length-of-stay for patients with any device-associated infection were significantly different in 2020 compared to 2019 (not shown). The median time to infection for ICU CLABSIs increased from 8 days in 2019 to 10 days in 2020. The median length of stay for an ICU patient with a CAUTI increased from 17 days in 2019 to 20 days in 2020, and for ICU VAEs, it increased from 17 days in 2019 to 19 days in 2020.
Compared to 2019, central-line and urinary catheter usage were significantly higher in 2020-Q2–2020-Q4, and ventilator usage was significantly higher in all 4 quarters of 2020 (not shown). The central-line SUR increased by 7%, from 0.85 in 2019-Q2–2019-Q4 to 0.91 to 2020-Q2–2020-Q4. The urinary catheter SUR increased by 9%, from 0.81 in 2019-Q2–2019-Q4 to 0.88 in 2020-Q2–2020-Q4. The quarterly ventilator SURs were 25%–31% higher in 2020-Q2–2020-Q4, with the Q4 SUR increasing from 0.94 in 2019-Q4 to 1.23 in 2020-Q4.
MRSA bacteremia LabID
The national SIRs for MRSA bacteremia were significantly higher in 2020-Q2, 2020-Q3, and 2020-Q4 compared to 2019, with the 2020 SIRs ranging from 0.77 in Q1 to 1.07 in Q4 (Tables 2–5).
During 2020-Q2, there was a 15% (5 million) reduction in national FacWideIN patient days, an 18% (1.4 million) reduction in admissions, and a 34% (10 million) reduction in outpatient encounters (Appendix A1–A2 online). These decreases in denominators led to increases in the 2020-Q2 inpatient and outpatient community-onset MRSA bacteremia prevalence rates compared to 2019-Q2; there was a small increase in the inpatient community-onset prevalence rate (0.53 vs 0.59 events per 1,000 admissions) and a large increase in the outpatient community-onset prevalence rate (3.66 vs 5.47 events per 10,000 encounters).
The national MRSA bacteremia SIR was 0.92 in 2020-Q2, a 12% increase from 2019-Q2. This increase was largely driven by the decline in patient days in 2020-Q2, which contributed to a 10% decline in the number of predicted MRSA bacteremia events compared to the same quarter in 2019. A corresponding decline was not observed in the number of reported MRSA bacteremia events; the number of events reported for 2020-Q2 was 1% higher than that reported for 2019-Q2 (data not shown).
During 2020-Q3 and 2020-Q4, the national MRSA bacteremia SIRs were 23% and 34% higher than the 2019 values, resulting from a larger number of LabID events reported during these quarters in 2020 versus 2019. Several states reported significantly higher MRSA bacteremia SIRs in 2020-Q2 than 2019-Q2, such as Arizona with an 80% increase and New Jersey with a 99% increase (Table 9). Among select states in the Q3 comparison, Louisiana had the largest increase in their state SIR of 96%.
SSI and CDI LabID
We detected no significant increases in the national quarterly SIRs for SSI or CDI for any quarter in 2020 compared to 2019. The national CDI SIR steadily declined in 2019-Q1–2019-Q4 from 0.63 to 0.55 and remained stable at 0.52 for each quarter in 2020 (Tables 2–5). Decreases in the SSI SIRs compared to 2019 were reported throughout 2020 for both procedure categories, although some decreases were not statistically significant. Fewer inpatient colon and abdominal hysterectomy procedures were performed in each quarter of 2020 compared to 2019, with the greatest decreases of 23% and 39%, respectively, occurring during Q2 (data not shown).
National Healthcare-Associated Infection (HAI) Standardized Infection Ratios (SIRs) for Acute-Care Hospitals, April–June 2020 (Q2)
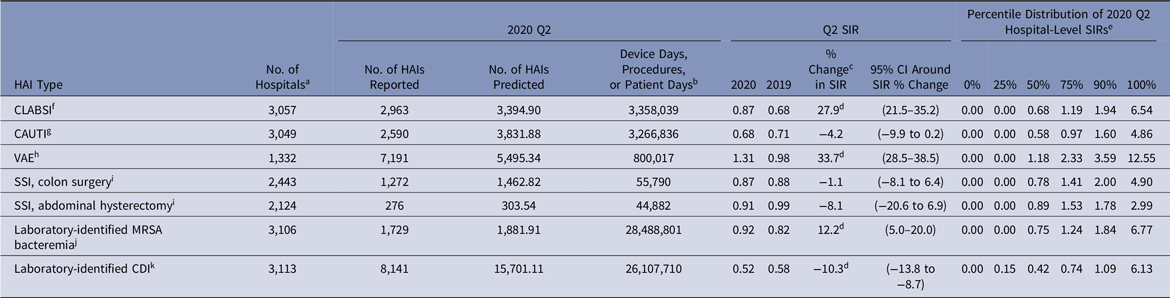
Note. CI, confidence interval; CLABSI, central-line–associated bloodstream infection; CAUTI, catheter-associated urinary tract infection; VAE, ventilator-associated event; SSI, surgical site infection; MRSA, methicillin-resistant Staphylococcus aureus; CDI, Clostridioides difficile infection. NHSN, National Healthcare Safety Network; CMS, Centers for Medicare and Medicaid Services; ICU, intensive care unit.
a The number of acute-care hospitals that reported complete HAI surveillance data for both quarters in the comparison.
b Device days are shown for CLABSI, CAUTI, and VAE. Procedure counts are shown for SSI. Patient days are shown for laboratory-identified events.
c % change was calculated as follows: [(2020 SIR − 2019 SIR) ÷ 2019 SIR] × 100.
d Statistical significance based on 2-tailed P ≤ .05, reflected in the relative % change in magnitude.
e Percentile distribution of hospital-level SIRs includes only those hospitals that had at least 1 predicted HAI.
f CLABSI SIRs were calculated using data from adult and pediatric ICUs, neonatal ICUs, and adult and pediatric medical, surgical, and medical–surgical wards.
g CAUTI SIRs were calculated using data from adult and pediatric ICUs, and adult and pediatric medical, surgical, and medical–surgical wards.
h VAE SIRs were calculated using data from adult ICUs and wards.
i SSIs included are those classified as deep incisional or organ-space infections following adult inpatient procedures that were detected during the same admission as the surgical procedure or upon readmission to the same hospital. The NHSN Complex Admission–Readmission model was used for SIR calculations.
j MRSA bacteremia SIRs were calculated using data from all inpatient locations in the hospital (facility-wide inpatient, or FacWideIN) except inpatient rehabilitation and inpatient psychiatric units certified by the CMS. Reported and predicted HAIs were limited to hospital-onset events that were identified in an inpatient location on the fourth day (or later) after admission to the facility.
k CDI SIRs were calculated using data from all inpatient locations in the hospital (FacWideIN) except neonatal ICUs, newborn nurseries, and inpatient rehabilitation and inpatient psychiatric units certified by CMS. Reported and predicted HAIs were limited to hospital-onset incident events that were identified in an inpatient location on the fourth day (or later) after admission to the facility without a prior positive CDI specimen in the previous 56 days.
National Healthcare-Associated Infection (HAI) Standardized Infection Ratios (SIRs) for Acute-Care Hospitals, July–September 2020 (Q3)
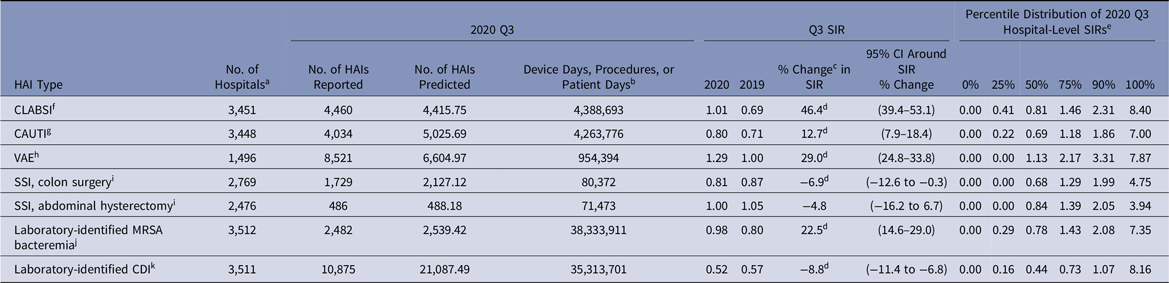
Note. CI, confidence interval; CLABSI, central-line–associated bloodstream infection; CAUTI, catheter-associated urinary tract infection; VAE, ventilator-associated event; SSI, surgical site infection; MRSA, methicillin-resistant Staphylococcus aureus; CDI, Clostridioides difficile infection; NHSN, National Healthcare Safety Network; CMS, Centers for Medicare and Medicaid Services; ICU, intensive care unit.
a The number of acute-care hospitals that reported complete HAI surveillance data for both quarters in the comparison.
b Device days are shown for CLABSI, CAUTI, and VAE. Procedure counts are shown for SSI. Patient days are shown for laboratory-identified events.
c % change was calculated as follows: [(2020 SIR − 2019 SIR) ÷ 2019 SIR] × 100.
d Statistical significance based on 2-tailed P ≤ .05, reflected in the relative % change in magnitude.
e Percentile distribution of hospital-level SIRs includes only those hospitals that had at least 1 predicted HAI.
f CLABSI SIRs were calculated using data from adult and pediatric ICUs, neonatal ICUs, and adult and pediatric medical, surgical, and medical–surgical wards.
g CAUTI SIRs were calculated using data from adult and pediatric ICUs, and adult and pediatric medical, surgical, and medical–surgical wards.
h VAE SIRs were calculated using data from adult ICUs and wards.
i SSIs included are those classified as deep incisional or organ-space infections following adult inpatient procedures that were detected during the same admission as the surgical procedure or upon readmission to the same hospital. NHSN Complex Admission–Readmission model was used for SIR calculations.
j MRSA bacteremia SIRs were calculated using data from all inpatient locations in the hospital (facility-wide inpatient, or FacWideIN) except inpatient rehabilitation and inpatient psychiatric units certified by the CMS. Reported and predicted HAIs were limited to hospital-onset events that were identified in an inpatient location on the fourth day (or later) after admission to the facility.
k CDI SIRs were calculated using data from all inpatient locations in the hospital (FacWideIN) except neonatal ICUs, newborn nurseries, and inpatient rehabilitation and inpatient psychiatric units certified by CMS. Reported and predicted HAIs were limited to hospital-onset incident events that were identified in an inpatient location on the fourth day (or later) after admission to the facility without a prior positive CDI specimen in the previous 56 days.
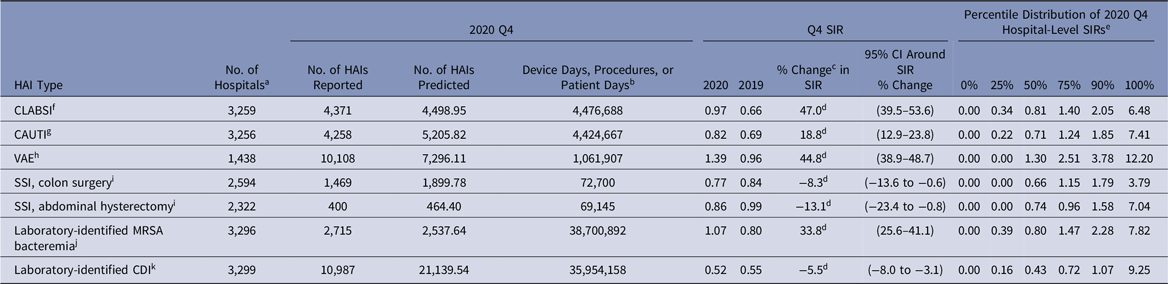
Preliminary National Healthcare-Associated Infection (HAI) Standardized Infection Ratios (SIRs) for Acute-Care Hospitals, October–December 2020 (Q4)
Note. CI, confidence interval; CLABSI, central-line–associated bloodstream infection; CAUTI, catheter-associated urinary tract infection; VAE, ventilator-associated event; SSI, surgical site infection; MRSA, methicillin-resistant Staphylococcus aureus; CDI, Clostridioides difficile infection; ICU, intensive care unit; CMS, Centers for Medicare and Medicaid Services; NHSN, National Healthcare Safety Network.
a The number of acute-care hospitals that reported complete HAI surveillance data for both quarters in the comparison.
b Device days are shown for CLABSI, CAUTI, and VAE. Procedure counts are shown for SSI. Patient days are shown for laboratory-identified events.
c % change was calculated as follows: [(2020 SIR − 2019 SIR) ÷ 2019 SIR] × 100.
d Statistical significance based on 2-tailed P ≤ .05, reflected in the relative % change in magnitude.
e Percentile distribution of hospital-level SIRs includes only those hospitals that had at least 1 predicted HAI.
f CLABSI SIRs were calculated using data from adult and pediatric ICUs, neonatal ICUs, and adult and pediatric medical, surgical, and medical–surgical wards.
g CAUTI SIRs were calculated using data from adult and pediatric ICUs, and adult and pediatric medical, surgical, and medical–surgical wards.
h VAE SIRs were calculated using data from adult ICUs and wards.
i SSIs included are those classified as deep incisional or organ-space infections following adult inpatient procedures that were detected during the same admission as the surgical procedure or upon readmission to the same hospital. The NHSN Complex Admission–Readmission model was used for SIR calculations.
j MRSA bacteremia SIRs were calculated using data from all inpatient locations in the hospital (facility-wide inpatient, or FacWideIN) except inpatient rehabilitation and inpatient psychiatric units certified by the CMS. Reported and predicted HAIs were limited to hospital-onset events that were identified in an inpatient location on the fourth day (or later) after admission to the facility.
k CDI SIRs were calculated using data from all inpatient locations in the hospital (FacWideIN) except neonatal ICUs, newborn nurseries, and inpatient rehabilitation and inpatient psychiatric units certified by the CMS. Reported and predicted HAIs were limited to hospital-onset incident events that were identified in an inpatient location on the fourth day (or later) after admission to the facility without a prior positive CDI specimen in the previous 56 days.
Discussion
This report is the first to present national and select state-level quarterly SIRs for each HAI type in 2020, along with a comparison to 2019 SIRs. Due to reporting requirements for the CMS HACRP, NHSN data are representative of largely all ACHs in the country and provide a national picture of how patient safety, in particular HAI incidence, may have been affected by the COVID-19 pandemic.
2020 Q2 and Q3 Central-Line–Associated Bloodstream Infection (CLABSI) a Standardized Infection Ratios (SIRs) for Acute-Care Hospitals Compared to 2019 for Select States
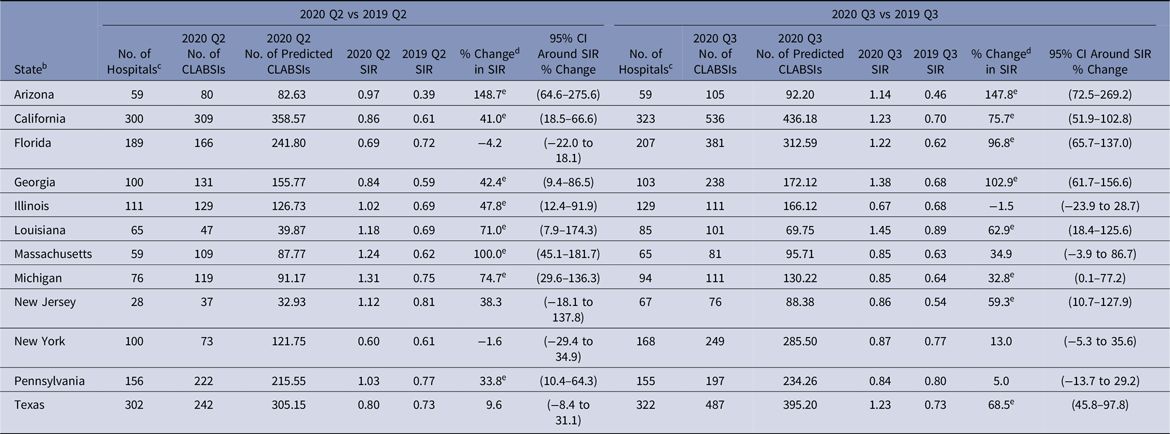
Note. CI, confidence interval; CDC, Centers for Disease Control and Prevention; NHSN, National Healthcare Safety Network; ICU, intensive care unit.
a SIRs were calculated using data from adult and pediatric ICUs, neonatal ICUs, and adult and pediatric medical, surgical, and medical–surgical wards.
b Quarterly CLABSI SIRs are available for all eligible states and quarters in the Supplementary Tables (online). The states shown in this table were identified by the CDC as having a high number of hospitalized COVID-19 patients between April 1, 2020, and July 14, 2020.Reference Sapiano, Dudeck and Soe1
c Hospitals reporting complete CLABSI surveillance data to the NHSN for the same location for both quarters in the comparison.
d % change was calculated as follows: [(2020 SIR − 2019 SIR) ÷ 2019 SIR] × 100.
e Statistical significance based on 2-tailed P ≤ .05, reflected in the relative % change in magnitude.
2020 Q2 and Q3 Catheter-Associated Urinary Tract Infection (CAUTI) a Standardized Infection Ratios (SIRs) for Acute-Care Hospitals Compared to 2019 for Select States
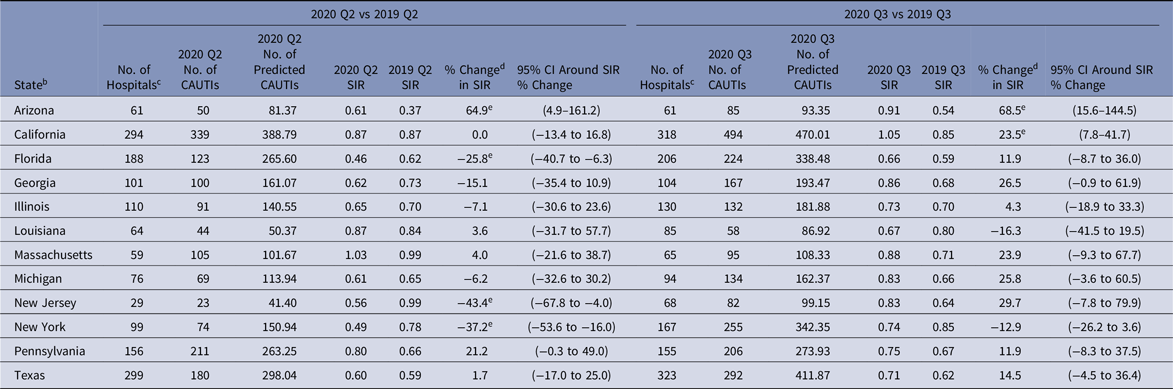
Note. CI, confidence interval; CDC, Centers for Disease Control and Prevention; NHSN, National Healthcare Safety Network; ICU, intensive care unit.
a SIRs were calculated using data from adult and pediatric ICUs, and adult and pediatric medical, surgical, and medical–surgical wards.
b Quarterly CAUTI SIRs were available for all eligible states and quarters in the Supplementary Tables (online). The states shown in this table were identified by the CDC as having a high number of hospitalized COVID-19 patients between April 1, 2020, and July 14, 2020.Reference Sapiano, Dudeck and Soe1
c Hospitals reporting complete CAUTI surveillance data to the NHSN for the same location for both quarters in the comparison.
d % change was calculated as follows: [(2020 SIR − 2019 SIR) ÷ 2019 SIR] × 100.
e Statistical significance based on 2-tailed P ≤ .05, reflected in the relative % change in magnitude.
2020 Q2 and Q3 Ventilator-Associated Event (VAE) a Standardized Infection Ratios (SIRs) for Acute-Care Hospitals Compared to 2019 for Select States
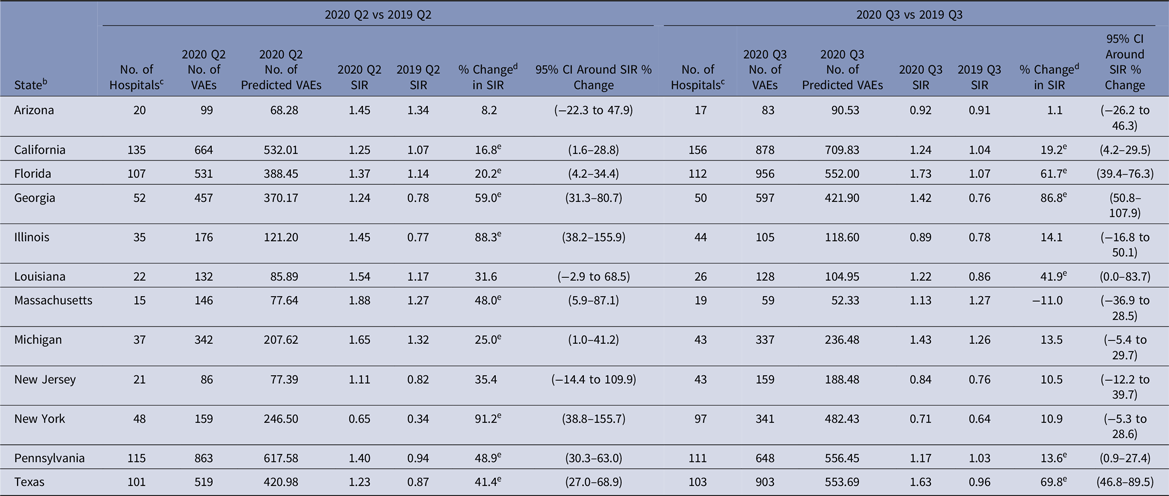
Note. CI, confidence interval; CDC, Centers for Disease Control and Prevention; NHSN, National Healthcare Safety Network; ICU, intensive care unit.
a SIRs were calculated using data from adult ICUs and adult wards.
b Quarterly VAE SIRs are available for all eligible states and quarters in the Supplementary Tables (online). The states shown in this table were identified by the CDC as having a high number of hospitalized COVID-19 patients between April 1, 2020, and July 14, 2020.Reference Sapiano, Dudeck and Soe1
c Hospitals reporting complete VAE surveillance data to the NHSN for the same location for both quarters in the comparison.
d % change was calculated as follows: [(2020 SIR − 2019 SIR) ÷ 2019 SIR] × 100.
e Statistical significance based on 2-tailed P ≤ .05, reflected in the relative % change in magnitude.
2020 Q2 and Q3 Laboratory-Identified (LabID) Methicillin-Resistant Staphylococcus aureus (MRSA) Bacteremia a Standardized Infection Ratios (SIRs) for Acute-Care Hospitals Compared to 2019 for Select States
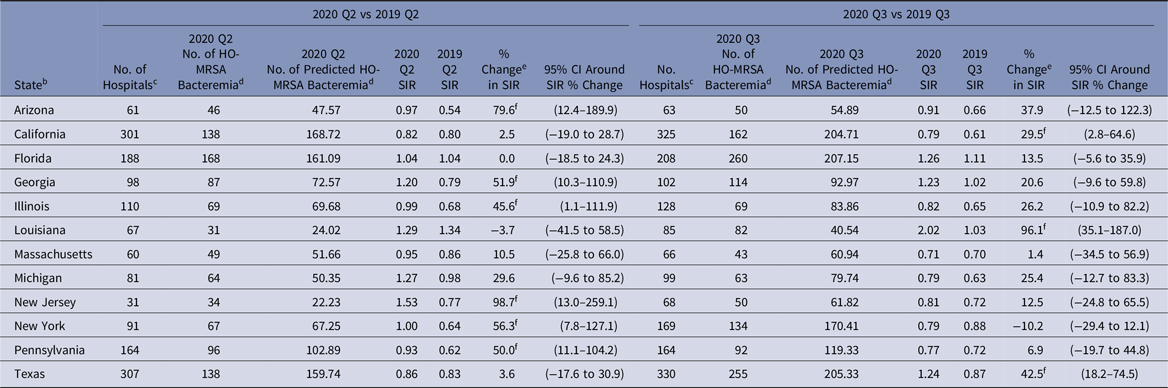
Note. CI, confidence interval; HO, hospital-onset; MRSA, methicillin-resistant Staphylococcus aureus; CDC, Centers for Disease Control and Prevention; NHSN, National Healthcare Safety Network; CMS, Centers for Medicare and Medicaid Services.
a SIRs were calculated using data from all inpatient locations in the hospital (facility-wide inpatient, or FacWideIN) except inpatient rehabilitation and inpatient psychiatric units certified by the CMS.
b Quarterly MRSA bacteremia SIRs are available for all eligible states and quarters in the Supplementary Data Tables (online). The states shown in this table were identified by the CDC as having a high number of hospitalized COVID-19 patients between April 1, 2020, and July 14, 2020.Reference Sapiano, Dudeck and Soe1
c Hospitals reporting complete MRSA bacteremia LabID event surveillance data to the NHSN for both quarters in the comparison.
d Hospital-onset events are defined as those that were identified in an inpatient location on the fourth day (or later) after admission to the facility.
e % change was calculated as follows: [(2020 SIR − 2019 SIR) ÷ 2019 SIR] × 100.
f Statistical significance based on 2-tailed P ≤ .05, reflected in the relative % change in magnitude.
Prior to the pandemic, widespread decrease in HAI incidence had been observed across US hospitals.12 Except for VAE, the national 2020-Q1 SIR for each HAI was below 1 and significantly lower than that from 2019-Q1, indicating a continual decline in HAI incidence at the beginning of 2020. As hospitals began to respond to the COVID-19 pandemic in 2020-Q2, increases in national SIRs became apparent. Initial increases in the SIRs were observed early in the year for CLABSI and MRSA bacteremia (starting in 2020-Q2) and for VAE (starting in 2020-Q1). However, compared to 2019, 2020-Q3 and 2020-Q4 saw large and significant increases in the CLABSI, CAUTI, VAE, and MRSA bacteremia SIRs (Fig. 1).
Changes in the 2020 national healthcare-associated infection (HAI) standardized infection ratios (SIRs) for acute-care hospitals, compared to respective 2019 quarters. Note. CLABSI, central-line–associated bloodstream infection; CAUTI, catheter-associated urinary tract infection; VAE, ventilator-associated event; SSI, surgical site infection; MRSA, methicillin-resistant Staphylococcus aureus; CDI, Clostridioides difficile infection. Interpretation: Unless otherwise noted, the results of the significance tests comparing consecutive annual pairs of quarterly SIRs are based on a 2-tailed test P ≤ .05; however, the directional percentage change is based on the relative change in magnitude. An arrow pointing down, and a negative percentage change value, indicate that the 2020 SIR is lower than the 2019 SIR for the same quarter. An arrow pointing up, and a positive percentage change value, indicate that the 2020 SIR is higher than the 2019 SIR for the same quarter. Note. 1. “No change” signifies that the change in SIR was not statistically significant.
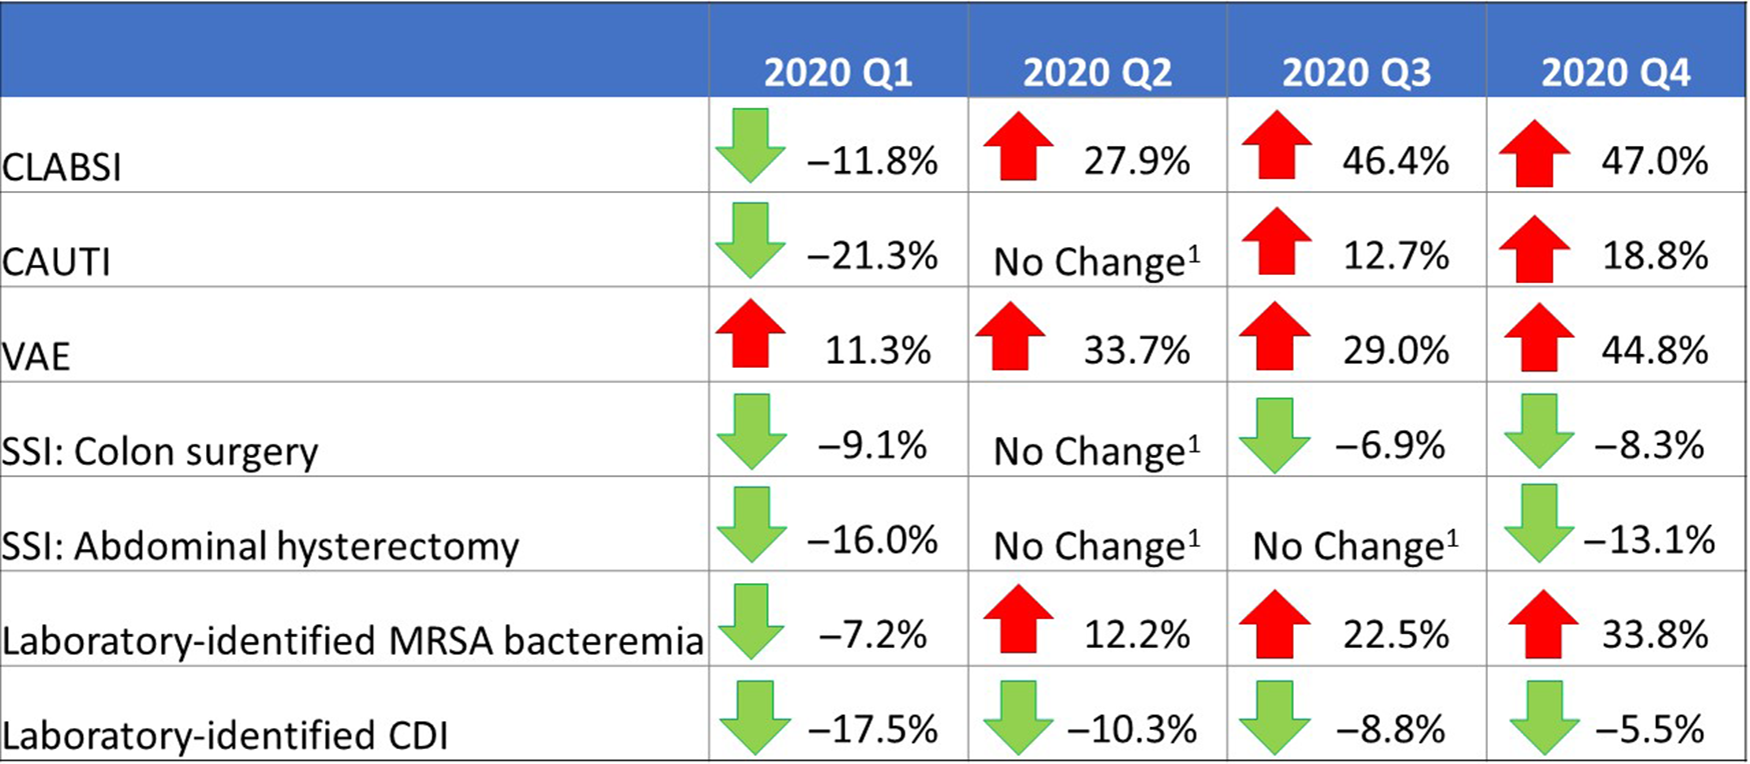
The CLABSI SIR experienced the greatest increase among all HAI types; the heightened CLABSI incidence during the pandemic and the likely impacts of hospital COVID-19 prevention activities on central-line insertion and maintenance practices have been previously documented.Reference Fakih, Bufalino and Sturm4–Reference LeRose, Sandhu and Polistico6,Reference Patel, Weiner-Lastinger and Dudeck10 CAUTIs and VAEs were also reported more frequently in 2020 than 2019. A longer patient length-of-stay, additional comorbidities and higher patient acuity levels, and a longer duration of device use in 2020 could have contributed to an overall increased risk of a device-assoicated infection during the pandemic. In addition, some studies identified an increased risk of ventilator-associated conditions in critically ill COVID-19 patients.Reference McMullen, Smith and Rebmann5,Reference Maes, Higginson and Pereira-Dias20 The characteristic worsening of respiratory status in some patients with COVID-19 resulted in an increase in the number of hospitalized patients in 2020 that required ventilation, and an increase in patients’ average duration of ventilation, both of which could have contributed to an increased risk of VAE. Almost all states previously identified by CDC with a high COVID-19 hospital admission burden observed increases in their 2020-Q2 CLABSI and VAE SIRs compared to 2019, most of which were statistically significant.Reference Sapiano, Dudeck and Soe1
Preliminary data for 2020-Q4 showed a large increase of 34% in the national MRSA bacteremia SIR compared to 2019-Q4. There were 2,715 MRSA bacteremia events reported for 2020-Q4, which is 41% higher than the number of events reported by the same set of hospitals in 2019-Q4. Further investigation is needed to identify the source of these additional events. A previous study found that device-associated infections, particularly those related to central-lines, are a common source of MRSA bacteremia; thus, the increase in MRSA bacteremia in 2020 is possibly a result of inadequate central-line insertion and maintenance practices.Reference Fakih, Bufalino and Sturm4,Reference LeRose, Sandhu and Polistico6,Reference Ham, See and Novosad21 However, preliminary NHSN data show no substantial changes in 2020, compared to 2019, in the proportion of CLABSIs caused by S. aureus, or in the proportion of S. aureus CLABSIs that are resistant to methicillin (data not shown). S. aureus has been identified as a common cause of secondary bacterial infection in COVID-19 patients.Reference Kumar, Adams and Hererra7,Reference Smith, Karaba and Amoah9 One meta-study found that >25% of all coinfections in COVID-19 patients were related to S. aureus, more than half of which were MRSA.Reference Adeiza, Shuaibu and Shuaibu22 Whether some of the MRSA bacteremia events reported to NHSN in 2020 occurred as secondary infections in patients with COVID-19 remains unknown.
The increased focus on hand hygiene, environmental cleaning, patient isolation, and use of PPE during 2020, combined with continued inpatient antimicrobial stewardship programs and a marked decline in outpatient antibiotic prescribing, may have resulted in decreases in the CDI SIRs during 2020 compared to 2019.Reference McMullen, Smith and Rebmann5,23
This analysis has several limitations. The 2020-Q4 data were analyzed prior to the CMS HACRP reporting deadline of May 17, 2021, and therefore may be incomplete. This analysis was restricted to hospitals that reported data for both 2019 and 2020; new hospitals and units that opened in 2020 were not included. Thus, this paper does not reflect all HAIs that occurred in the United States. Information on the voluntarily reported COVID-19 status of patients with HAIs was not explored. In addition, we focused solely on ACHs for this analysis, and did not address HAI incidence in other settings that may have cared for COVID-19 patients, such as critical access and long-term ACHs.
This is the first comprehensive look at the impact of COVID-19 on HAI incidence at the national and state levels. Substantial increases in CLABSIs, CAUTIs, VAEs, and MRSA bacteremia were observed. The year 2020 marked an unprecedented time for hospitals, many of which were faced with extraordinary circumstances of increased patient caseload, staffing challenges, and other operational changes that limited the implementation and effectiveness of standard infection prevention practices. A regular review of HAI surveillance data is critical for hospitals to identify gaps in prevention and address any observed increases in HAIs. Infection prevention staff should continue to reinforce infection prevention practices in their facilities, and consider the importance of building resiliency in their programs to withstand future public health emergencies.
Supplementary material
To view supplementary material for this article, please visit https://doi.org/10.1017/ice.2021.362
Acknowledgments
The authors express gratitude to all infection prevention staff in US healthcare facilities for their continued efforts in HAI surveillance and prevention, and for working tirelessly to keep all patients safe during an unprecedented public health emergency. We also thank the members of NHSN Protocol and Validation Team for their continued dedication to NHSN, patient safety, and for providing continued support to NHSN users in their HAI surveillance efforts during the COVID-19 pandemic: Katherine Allen-Bridson, Dominque Godfrey-Johnson, Cindy Gross, Denise Leaptrot, Nigel Lewis, Bonnie Norrick, Melissa Otis, LaTasha Powell, Victoria Russo, Henrietta Smith, Jennifer Watkins. The findings and conclusions in this article are those of the authors and do not necessarily represent the official position of the US Centers for Disease Control and Prevention.
Financial support
No financial support was provided relevant to this article.
Conflicts of interest
All authors report no conflicts of interest relevant to this article.


 Open access