





Impact statement
This study presents a scalable, proof-of-concept solution for improving sustainability in livestock farming. By providing farmers with detailed, timely data on pasture conditions and yield predictions, this EO-based approach supports informed decision-making regarding animal health and farm management, helping to reduce environmental pressures, such as overgrazing and land degradation, while supporting productivity. Developed within the European Space Agency’s (ESA) Global Development Assistance Agriculture activity, the work offers a validated approach that, following further testing across diverse conditions and landscapes, could be adapted to improve resource management and economic stability for Paraguay’s agropastoral sector and similar regions globally, demonstrating how advanced satellite technology can be bridged with practical farming needs.
Introduction
The sustainable intensification of global agriculture is critical to address escalating food security challenges and environmental constraints (Herrero et al., Reference Herrero, Thornton, Mason-D’Croz, Palmer, Benton, Bodirsky, Bogard, Hall, Lee, Nyborg, Pradhan, Bonnett, Bryan, Campbell, Christensen, Clark, Cook, de Boer, Downs, Dizyee, Folberth, Godde, Gerber, Grundy, Havlik, Jarvis, King, Loboguerrero, Lopes, McIntyre, Naylor, Navarro, Obersteiner, Parodi, Peoples, Pikaar, Popp, Rockström, Robertson, Smith, Stehfest, Swain, Valin, van Wijk, van Zanten, Vermeulen, Vervoort and West2020). Precise monitoring of above-ground biomass, specifically expressed as Dry Matter Biomass (DMB), is therefore essential for informed resource management, particularly in agropastoral systems. Current methodologies for DMB estimation are broadly divided into direct empirical models, which use vegetation indices from remote sensing, and mechanistic productivity models based on Net Primary Productivity (NPP) principles (Wenquan et al., Reference Wenquan, Zhiying, Cenliang, Zhoutao, Kun, Dailiang and Fu2024). The latter includes approaches such as climate-based correlations, complex physiological and ecological simulations and Light Use Efficiency (LUE) models, which relate absorbed radiation to biomass synthesis (Pei et al., Reference Pei, Dong, Zhang, Yuan, Doughty, Yang, Zhou, Zhang and Xiao2022).
Among these, the Carnegie-Ames-Stanford Approach (CASA) model is a prominent LUE framework, recognised for its integration with satellite remote sensing data (Wang et al., Reference Wang, Ma, Zhang and Shang2022). The availability of high-resolution multispectral data, notably from the Sentinel-2 (S2) constellation, has enabled the application of models like CASA at spatial granularities previously unattainable with moderate-resolution sensors such as MODIS (Fang et al., Reference Fang, Yan, Wei, Zhao and Zhang2021). This enhanced resolution is crucial for capturing the heterogeneity of pastoral landscapes. The CASA model requires both optical EO data and meteorological variables. For the latter, the ERA5-Land reanalysis dataset provides a globally consistent, temporally resolved representation of land-surface climate parameters, meeting the model’s input requirements (Muñoz-Sabater et al., Reference Muñoz-Sabater, Dutra, Agustí-Panareda, Albergel, Arduini, Balsamo, Boussetta, Choulga, Harrigan, Hersbach, Martens, Miralles, Piles, Rodríguez-Fernández, Zsoter, Buontempo and Thépaut2021).
A key component of the CASA model is the estimation of the fraction of Absorbed Photosynthetically Active Radiation (fAPAR). Conventional methods often use time series of the Normalised Difference Vegetation Index (NDVI), which can saturate under high leaf area and biomass density (Fu et al., Reference Fu, Zhou, Lei and Zhou2023). This limitation can be addressed by using Sentinel-2’s red-edge spectral region, which is more sensitive to variations in chlorophyll content and canopy structure (Fang et al., Reference Fang, Yan, Wei, Zhao and Zhang2021). Furthermore, high-temporal-resolution phenological monitoring, as undertaken in this study with a 10-day compositing period, must contend with data gaps due to cloud cover. Robust temporal gap-filling and smoothing algorithms are therefore necessary to reconstruct continuous fAPAR trajectories that accurately represent vegetation phenology, a prerequisite for deriving cumulative DMB metrics (Chen et al., Reference Chen, Jönsson, Tamura, Gu, Matsushita and Eklundh2004).
This study uses a physically based approach for fAPAR estimation, applying the Beer–Lambert law to establish a theoretical relationship between fAPAR and the Leaf Area Index (LAI). The LAI is derived using the Simple Sentinel-2 LAI Index (SeLI), which uses near-infrared and red-edge wavelengths to infer canopy properties (Pasqualotto et al., Reference Pasqualotto, Delegido, Van Wittenberghe, Rinaldi and Moreno2019). The reflectance data are generated as 10-day synthetic composites, where the optimal observation for each pixel is selected using a maximum NDVI criterion, minimising atmospheric and anisotropic effects (Sáenz et al., Reference Sáenz, Cicuéndez, García, Madruga, Recuero, Bermejo-Saiz, Litago, de la Calle and Palacios-Orueta2024).
Surface albedo, another key model input influencing incident Photosynthetically Active Radiation (PAR) calculation, is retrieved from S2 reflectance using a narrowband-to-broadband conversion scheme validated for Sentinel-2 MSI and Landsat 8/9 OLI sensors (Claverie et al., Reference Claverie, Ju, Masek, Dungan, Vermote, Roger, Skakun and Justice2018; He et al., Reference He, Liang, Wang, Cao, Gao, Yu and Feng2018; Feng et al., Reference Feng, Cook, Onuma, Naegeli, Tan, Anesio, Benning and Tranter2024). The LUE parameter is modulated by environmental stressors like temperature and water availability (Pei et al., Reference Pei, Dong, Zhang, Yuan, Doughty, Yang, Zhou, Zhang and Xiao2022). It can be quantified empirically or through inversion against field-measured NPP and PAR data (Propastin et al., Reference Propastin, Kappas, Herrman and Tucker2012) or using global datasets in data-sparse regions (Zhao et al., Reference Zhao, Heinsch, Nemani and Running2005).
The final workflow step converts cumulative NPP into DMB using vegetation-specific conversion coefficients, including carbon allocation factors and root-to-shoot ratios (Fu et al., Reference Fu, Zhou, Lei and Zhou2023). In the absence of comprehensive local calibration, these parameters are taken from relevant regional ecophysiological studies (Bolinder et al., Reference Bolinder, Janzen, Gregorich, Angers and VandenBygaart2007; Baldassini and Paruelo, Reference Baldassini and Paruelo2020).
The primary objective of this research is to operationalise this integrated framework to generate a high-fidelity, 36-layer annual time series of DMB at a 10-day resolution. This facilitates detailed analysis of pasture phenology and provides a physiologically based quantification of biomass dynamics (Bolton et al., Reference Bolton, Gray, Melaas, Moon, Eklundh and Friedl2020). The resulting data products are designed to support precision livestock management by identifying phenological transitions and assessing forage availability.
Methods
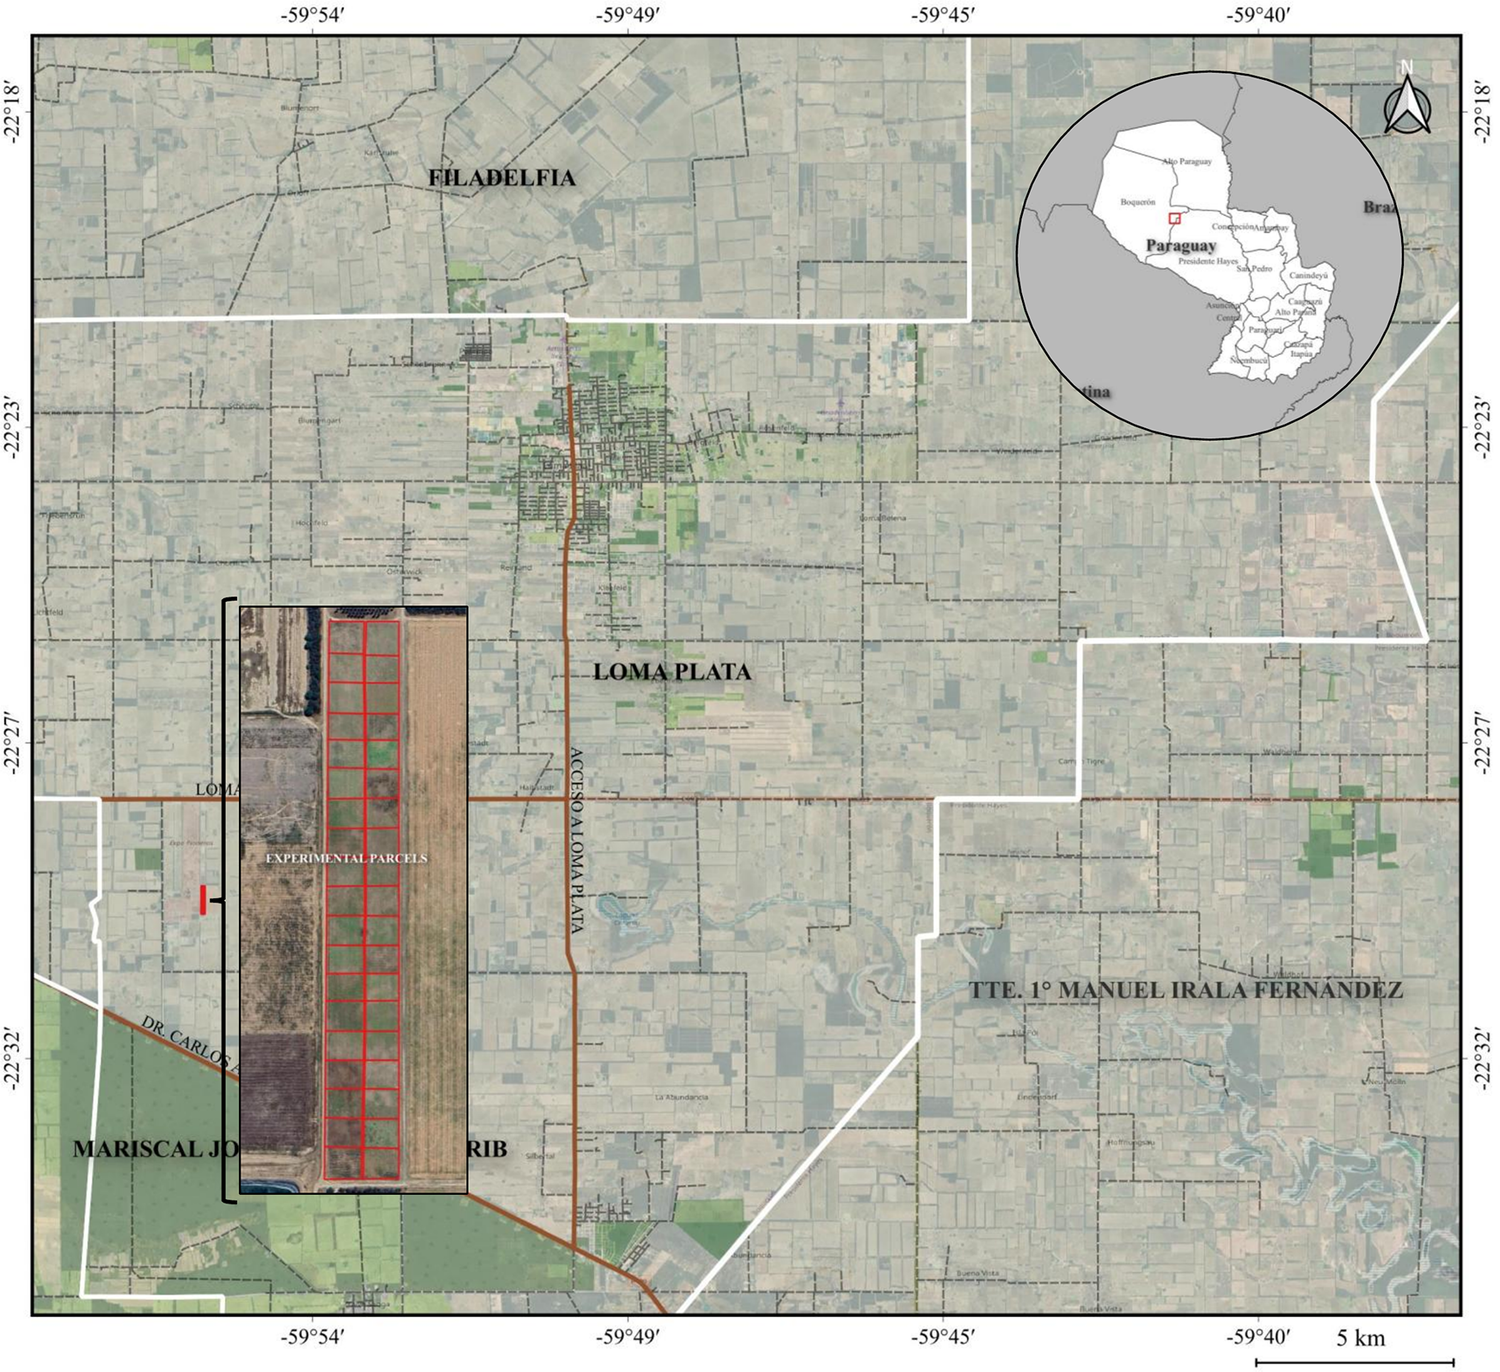
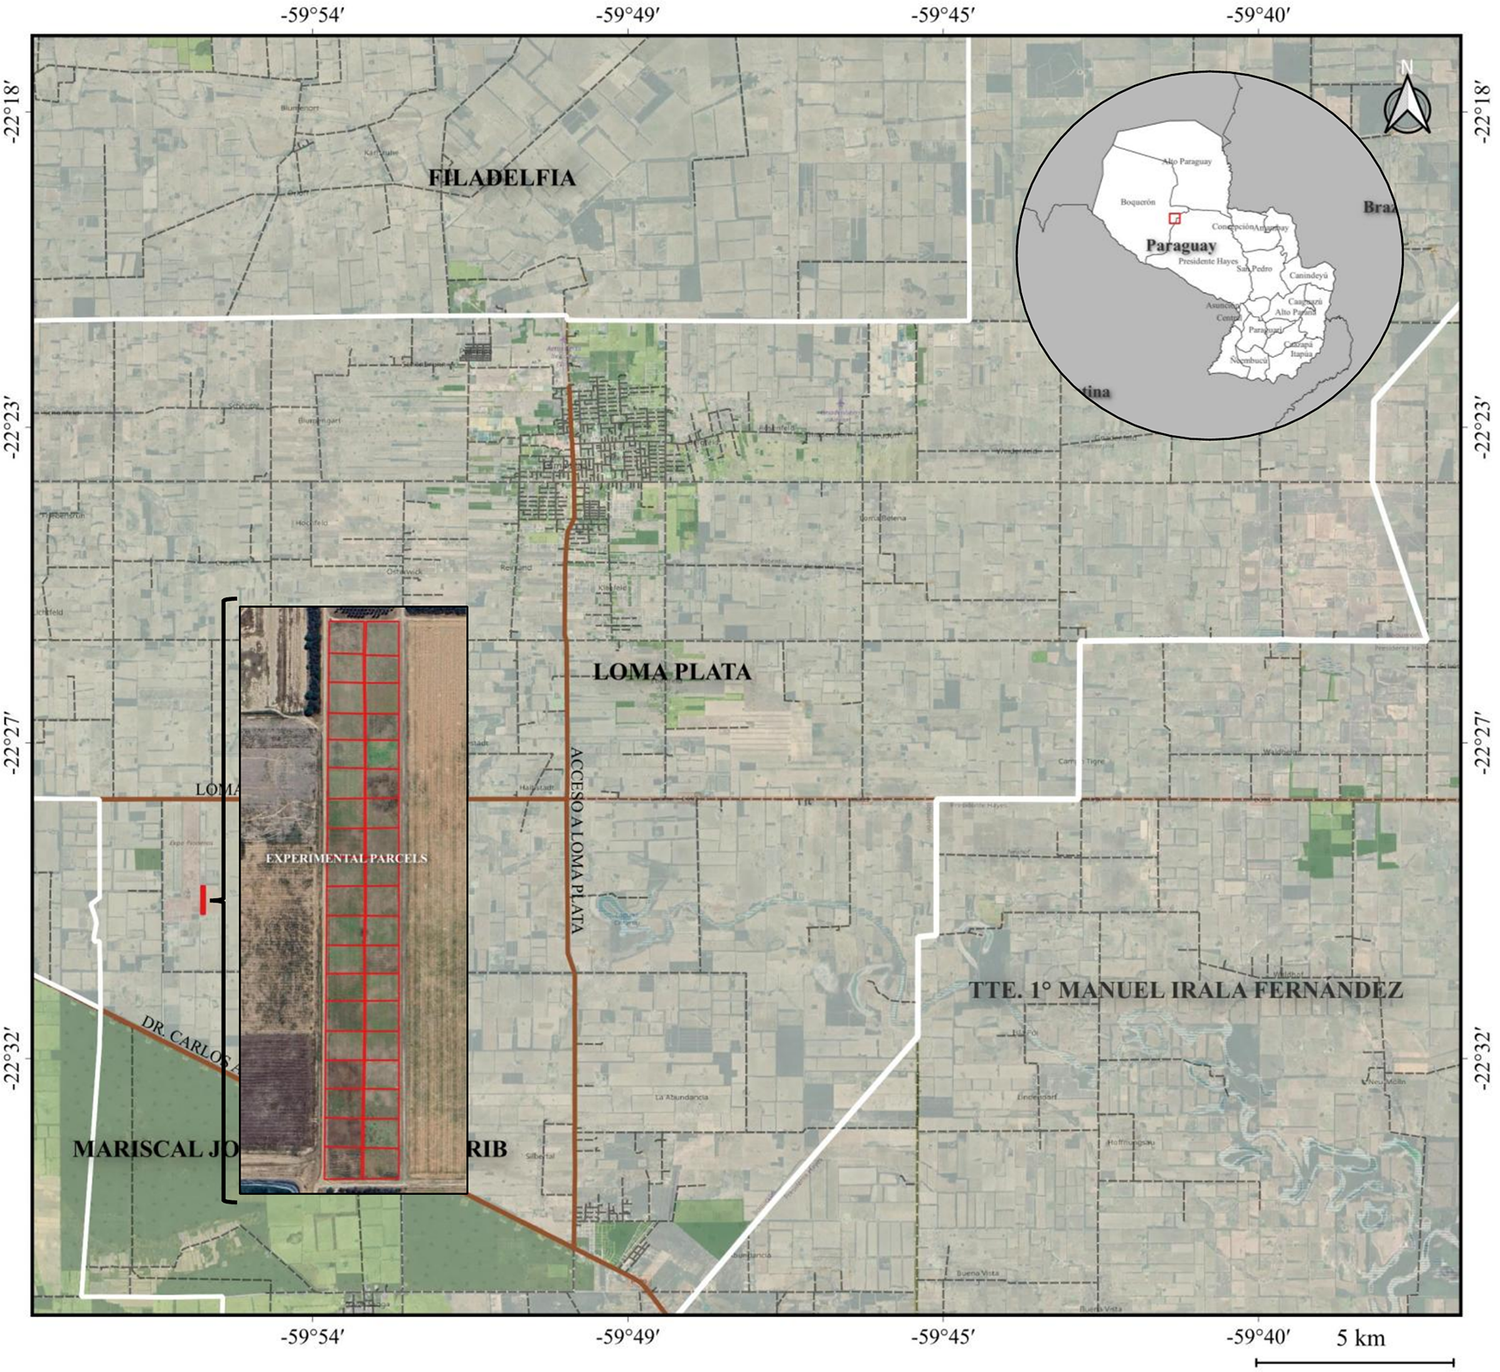
The study area covers 1,260 km2 in Paraguay’s Central Chaco region, spanning longitudes 59° 58′ 12″ to 59° 37′ 4.8″ west and latitudes 22° 35′ 38″ to 22° 16′ 44″ south. It includes parts of the municipalities of Loma Plata, Filadelfia, Tte 1° Manuel Fernández, and Mariscal José Félix Estigarribia (Figure 1). This predominantly pasture area hosts trial plots managed by FECOPROD and two dairy farms.
Study area. In the top right-hand corner, a zoom-in view of Paraguay showing administrative units, while the red square indicates the study area, which covers the municipalities of Loma Plata, Filadelfia, Tte 1° Manuel Fernández, and Mariscal José Félix Estigarribia. In the bottom left-hand corner, zoom in on the trial plots.
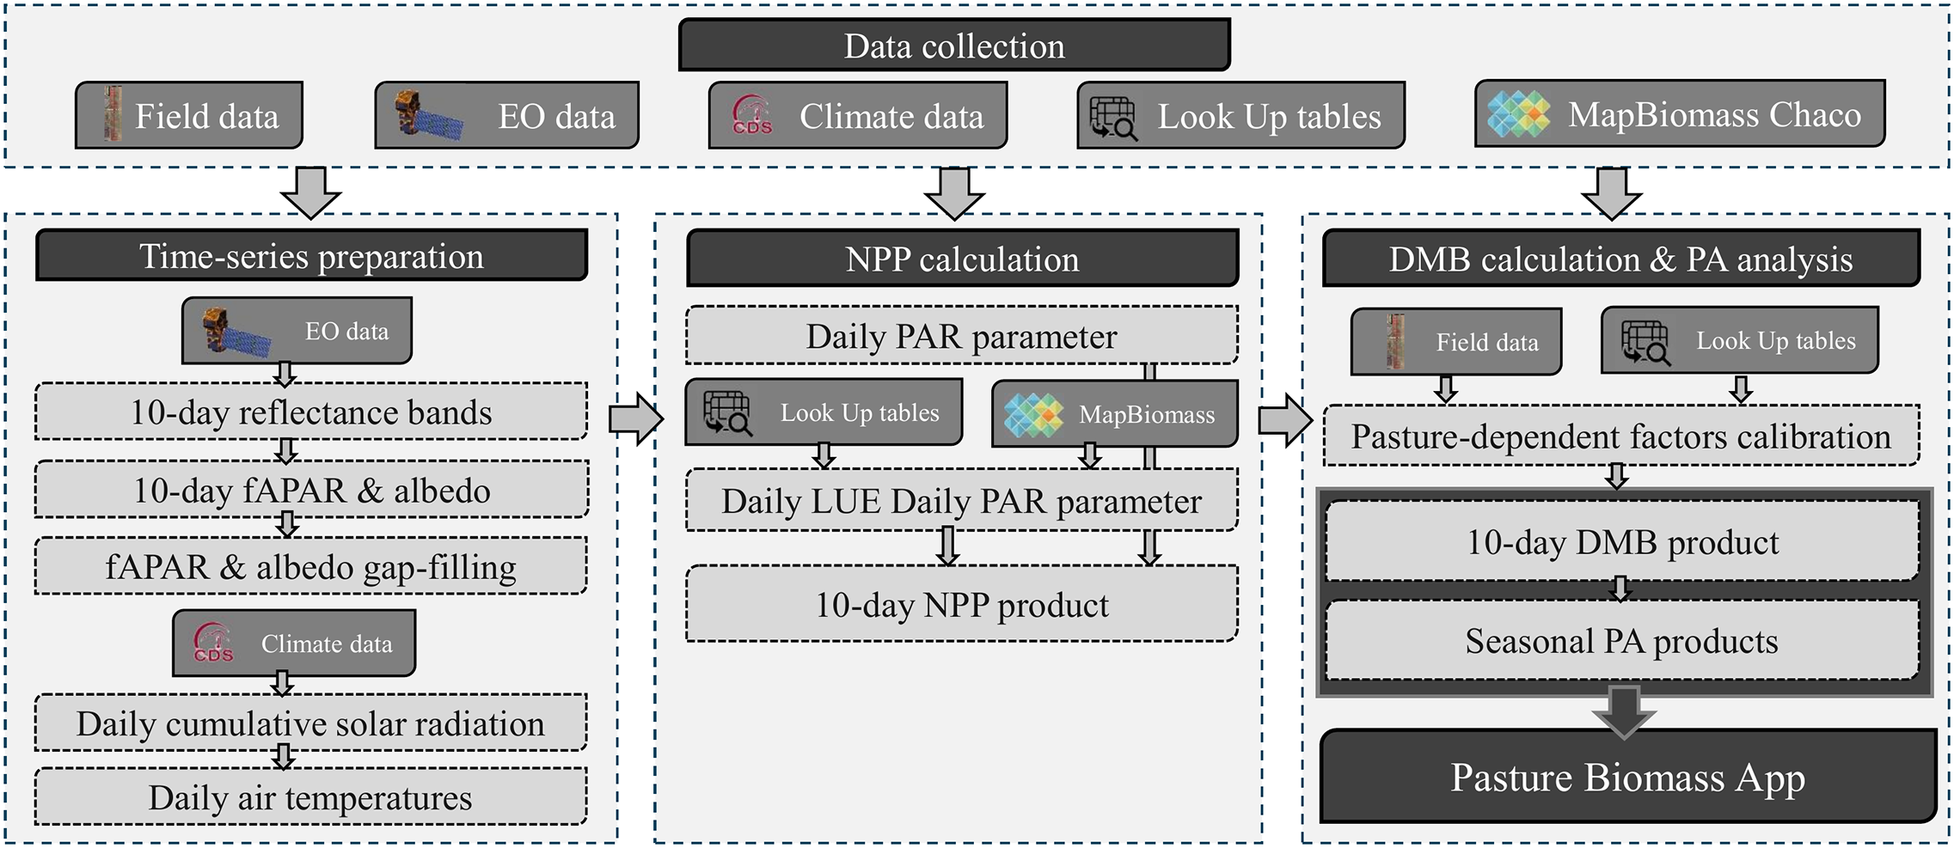
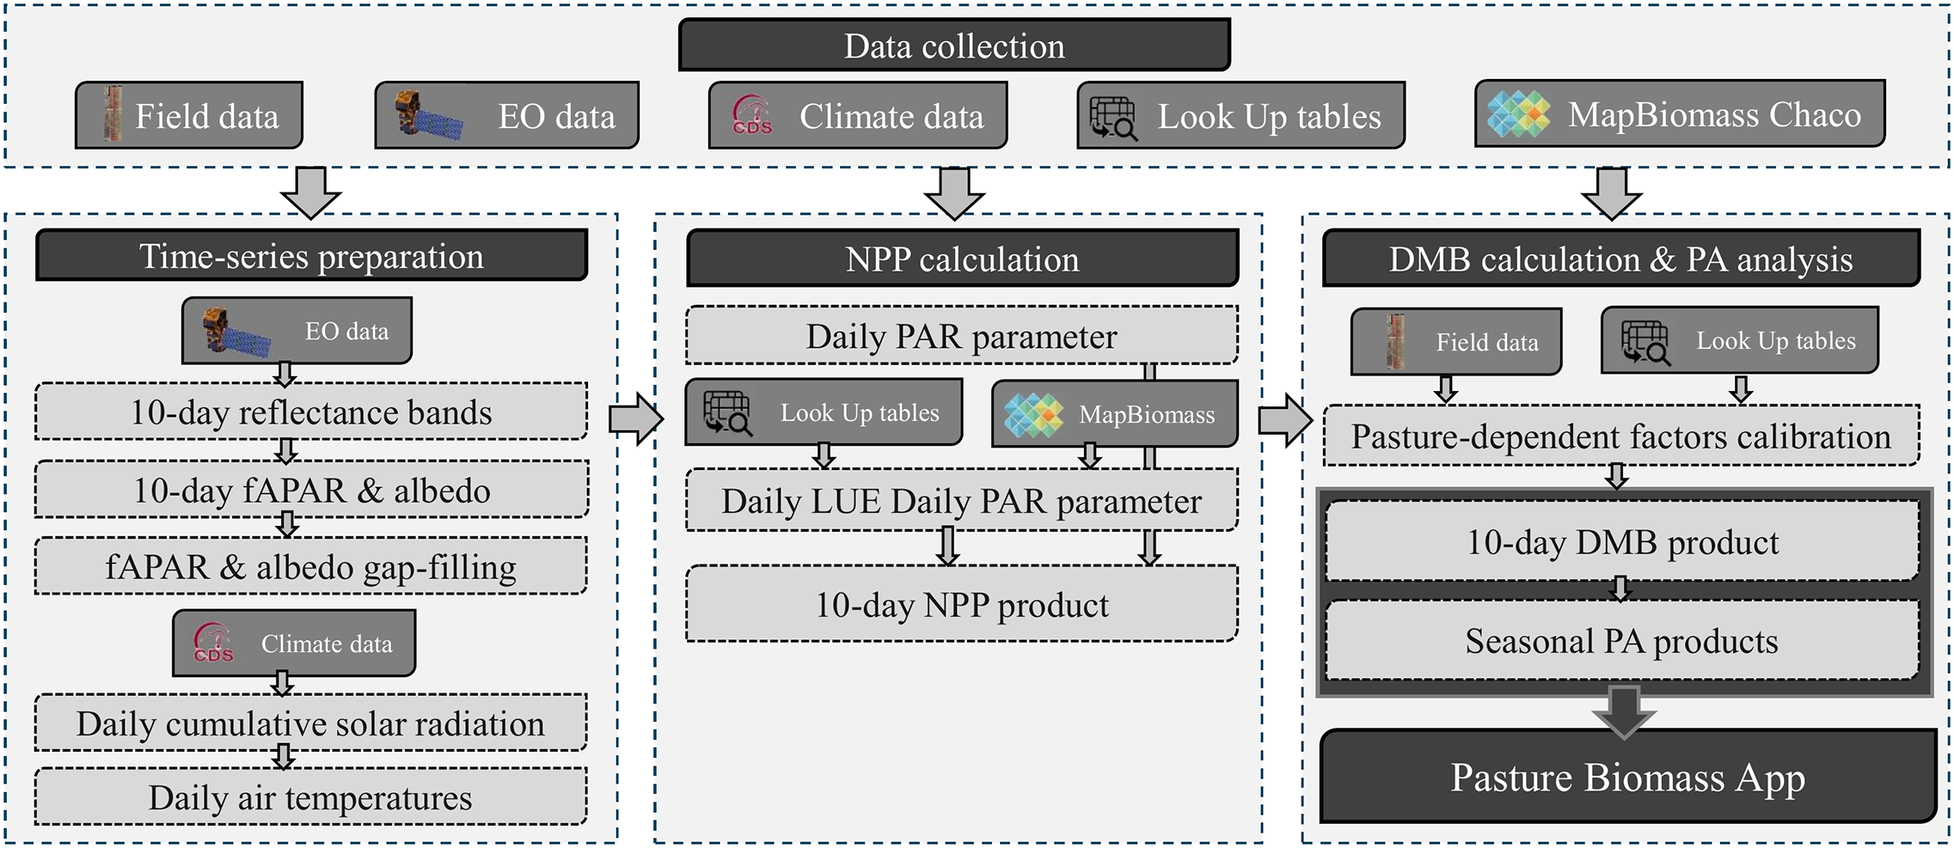
The methodological framework comprises four sequential stages: data collection, time-series preparation, NPP calculation and conversion to dry biomass with phenological analysis (PA). The complete workflow is illustrated in Figure 2 and described in detail in the following subsections.
Methodological framework. The workflow comprises four stages: Data Collection, Time Series Preparation, NPP Calculation and DMB Calculation with Phenological Analysis (PA).
Data acquisition and preprocessing
Field data included agronomic records from 38 trial plots provided by FECOPROD, containing forage species, sowing dates, mowing dates for 2022 and average harvested bale weight per species. EO data consisted of Sentinel-2 Level-2A products from 2016 onwards. Climatic variables were sourced from the ERA5-Land dataset. Additional parameters came from the MODIS MOD17 product Biome-Property-Look-Up-Table (Zhao et al., Reference Zhao, Heinsch, Nemani and Running2005) and carbon allocation coefficients (Bolinder et al., Reference Bolinder, Janzen, Gregorich, Angers and VandenBygaart2007). Pasture extent was defined using land cover maps from the MapBiomas Chaco project (MapBiomas Chaco, 2017).
Time-series preparation
A 10-day composite of Sentinel-2 reflectance data was generated. For each pixel, the observation date with the maximum NDVI within a 10-day period was selected to create an NDVImax-day map. The corresponding Top-of-Atmosphere reflectance values for these dates were compiled into the final composite, ensuring the use of direct sensor measurements rather than temporal averages. These composites were used to derive biophysical parameters. The 10-day fAPAR was calculated (Equation 1) by relating it to the SeLI index, with the extinction coefficient (k) calibrated for grasslands (Pickett-Heaps et al., Reference Pickett-Heaps, Canadell, Briggs, Gobron, Haverd, Paget, Pinty and Raupach2014; Pasqualotto et al., Reference Pasqualotto, Delegido, Van Wittenberghe, Rinaldi and Moreno2019). Surface albedo (Equation 2) was computed using a narrowband-to-broadband conversion model adapted for Sentinel-2 MSI (He et al., Reference He, Liang, Wang, Cao, Gao, Yu and Feng2018).


The fAPAR and albedo time series underwent a three-step gap-filling and smoothing procedure: outlier removal, interpolation constrained to three consecutive composites with forward-fill and smoothing with a Savitzky–Golay filter (Chen et al., Reference Chen, Jönsson, Tamura, Gu, Matsushita and Eklundh2004).
Hourly ERA5-Land climate data were processed into daily cumulative solar radiation (SSRD) and minimum air temperature (TMIN). To integrate the meteorological drivers with the high-resolution optical data, a harmonization procedure was required. First, the hourly ERA5-Land variables (SSRD and TMIN) were aggregated to daily totals and daily minimum values, respectively. Subsequently, these daily meteorological grids were resampled using nearest-neighbour interpolation and reprojected to match the Sentinel-2 tiling grid and projection. This approach operates under the assumption that the macro-scale climatic forcings provided by ERA5-Land are representative of the conditions influencing productivity at the paddock scale. This methodology is consistent with other studies that combine high-resolution optical imagery with coarser resolution climate reanalysis data (Robinson et al., Reference Robinson, Allred, Smith, Jones, Moreno, Erickson, Naugle and Running2018).
NPP calculation
Photosynthetically Active Radiation (PAR) was derived first, followed by a temperature-regulated scaling of LUE, resulting in the NPP estimate (Equations 3–6).




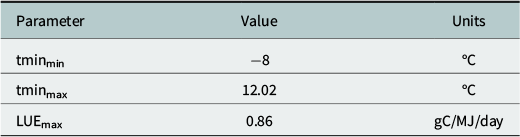
Parameters for the temperature stress function and maximum light use efficiency (LUEmax) were taken from the MODIS MOD17 Biome-Property-Look-Up-Table (Zhao et al., Reference Zhao, Heinsch, Nemani and Running2005). Values used are in Table 1.
Values from biome-property-look-up-table for MODIS GPP/NPP
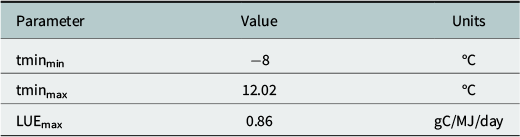
Table 1. Long description
Table listing three MODIS GPP/NPP model parameters with their values and units. tminmin with value -8 °C is the daily minimum temperature below which the plant’s photosynthetic activity is reduced to zero, tminmax with value 12.02 °C is the temperature threshold at which the daily minimum temperature stops limiting photosynthesis, allowing the plant to operate at maximum efficiency, and LUEmax with value 0.86 gC/MJ/day is the theoretical maximum rate at which a plant canopy can convert absorbed solar energy (radiation) into plant biomass (carbon) under perfect conditions (no temperature stress, no water stress, ample nutrients).
The use of a globally derived maximum light use efficiency (LUEmax = 0.86 gC/MJ) from the MODIS Biome-Property-Look-Up-Table introduces a potential source of bias, as this value may not be fully representative of the specific C4 (warm-season) pasture species in the Central Chaco. While this parameterization was necessary due to the absence of local eddy-covariance flux data or regionally tuned estimates (Robinson et al., Reference Robinson, Allred, Smith, Jones, Moreno, Erickson, Naugle and Running2018), it is acknowledged as a key uncertainty.
DMB calculation
The 10-day DMB was derived from cumulative NPP using a conversion model accounting for carbon partitioning (Equation 7):

∑NPP represents the 10-day cumulative NPP. The
$ {C}_{\mathrm{allocation}} $
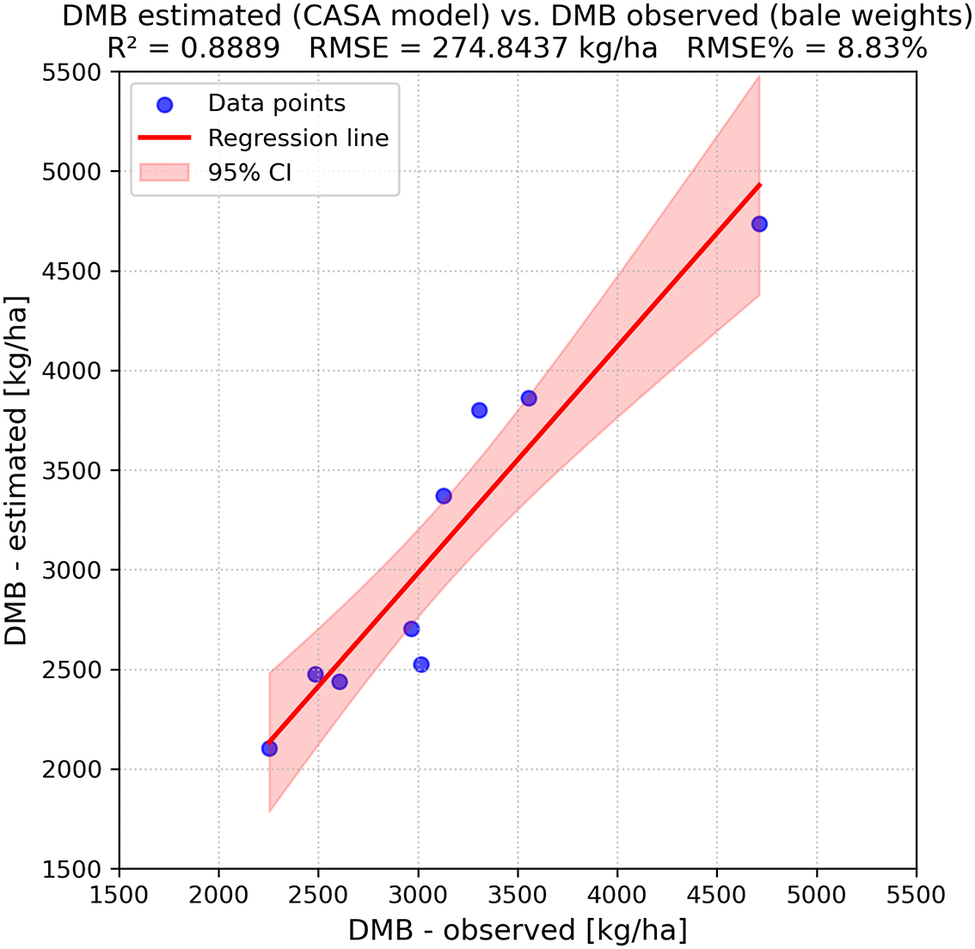
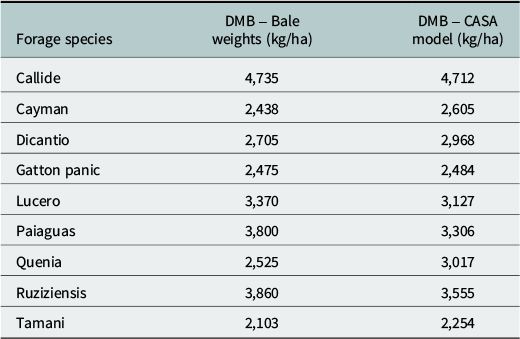
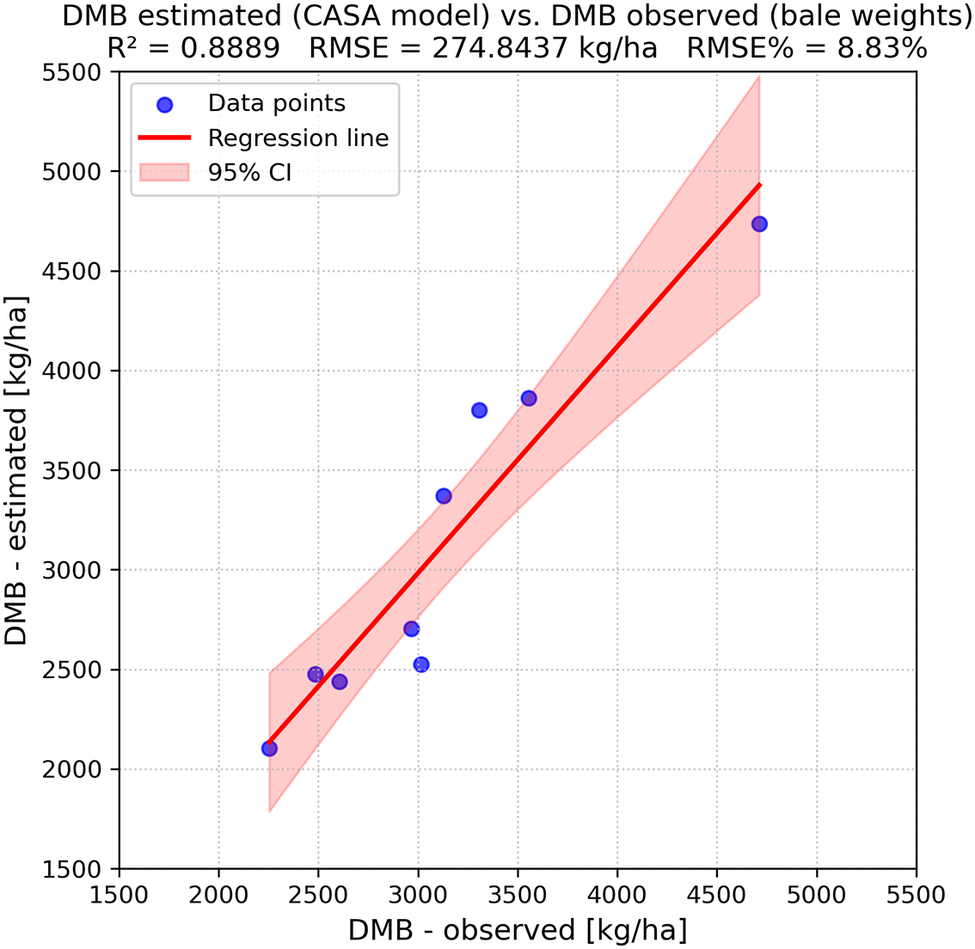
 parameter, representing the carbon allocation capacity, was adopted from Bolinder et al. (Reference Bolinder, Janzen, Gregorich, Angers and VandenBygaart2007). The root-shoot ratio was calibrated by correlating monthly accumulated NPP for each forage species in 2022 with measured bale weights. This yielded a mean ratio of 0.4136, consistent with regional literature (Baldassini and Paruelo, Reference Baldassini and Paruelo2020). Model accuracy was evaluated against ground-truth bale weights (Table 2), achieving an R
2 of 0.89 and RMSE of 8.83%. Figure 3 shows a scatter plot of estimated DMB versus observed DMB with a regression line and 95% confidence interval.
parameter, representing the carbon allocation capacity, was adopted from Bolinder et al. (Reference Bolinder, Janzen, Gregorich, Angers and VandenBygaart2007). The root-shoot ratio was calibrated by correlating monthly accumulated NPP for each forage species in 2022 with measured bale weights. This yielded a mean ratio of 0.4136, consistent with regional literature (Baldassini and Paruelo, Reference Baldassini and Paruelo2020). Model accuracy was evaluated against ground-truth bale weights (Table 2), achieving an R
2 of 0.89 and RMSE of 8.83%. Figure 3 shows a scatter plot of estimated DMB versus observed DMB with a regression line and 95% confidence interval.
Comparison of ground-truth bale weights and CASA model DMB estimates
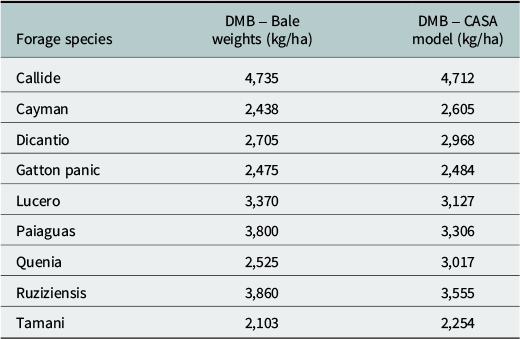
Table 2. Long description
Comparative analysis of DMB estimates for nine forage species. Two values are provided: Ground-truth measurements based on actual bale weights, and estimates generated by the CASA model. All values are expressed in kilograms per hectare. For most species, the CASA model tends to overestimate DMB compared to ground-truth bale weights, with exceptions being Callide (slight underestimate) and Lucero (model lower than ground-truth by 243 kg/ha). Callide shows the closest agreement between ground-truth (4,735 kg/ha) and model estimates (4,712 kg/ha), with a difference of only 23 kg/ha. Quenia shows the largest discrepancy, with the CASA model estimating 3,017 kg/ha compared to the ground-truth value of 2,525 kg/ha (a difference of 492 kg/ha).
Estimated DMB versus observed DMB with regression line and 95% confidence interval.
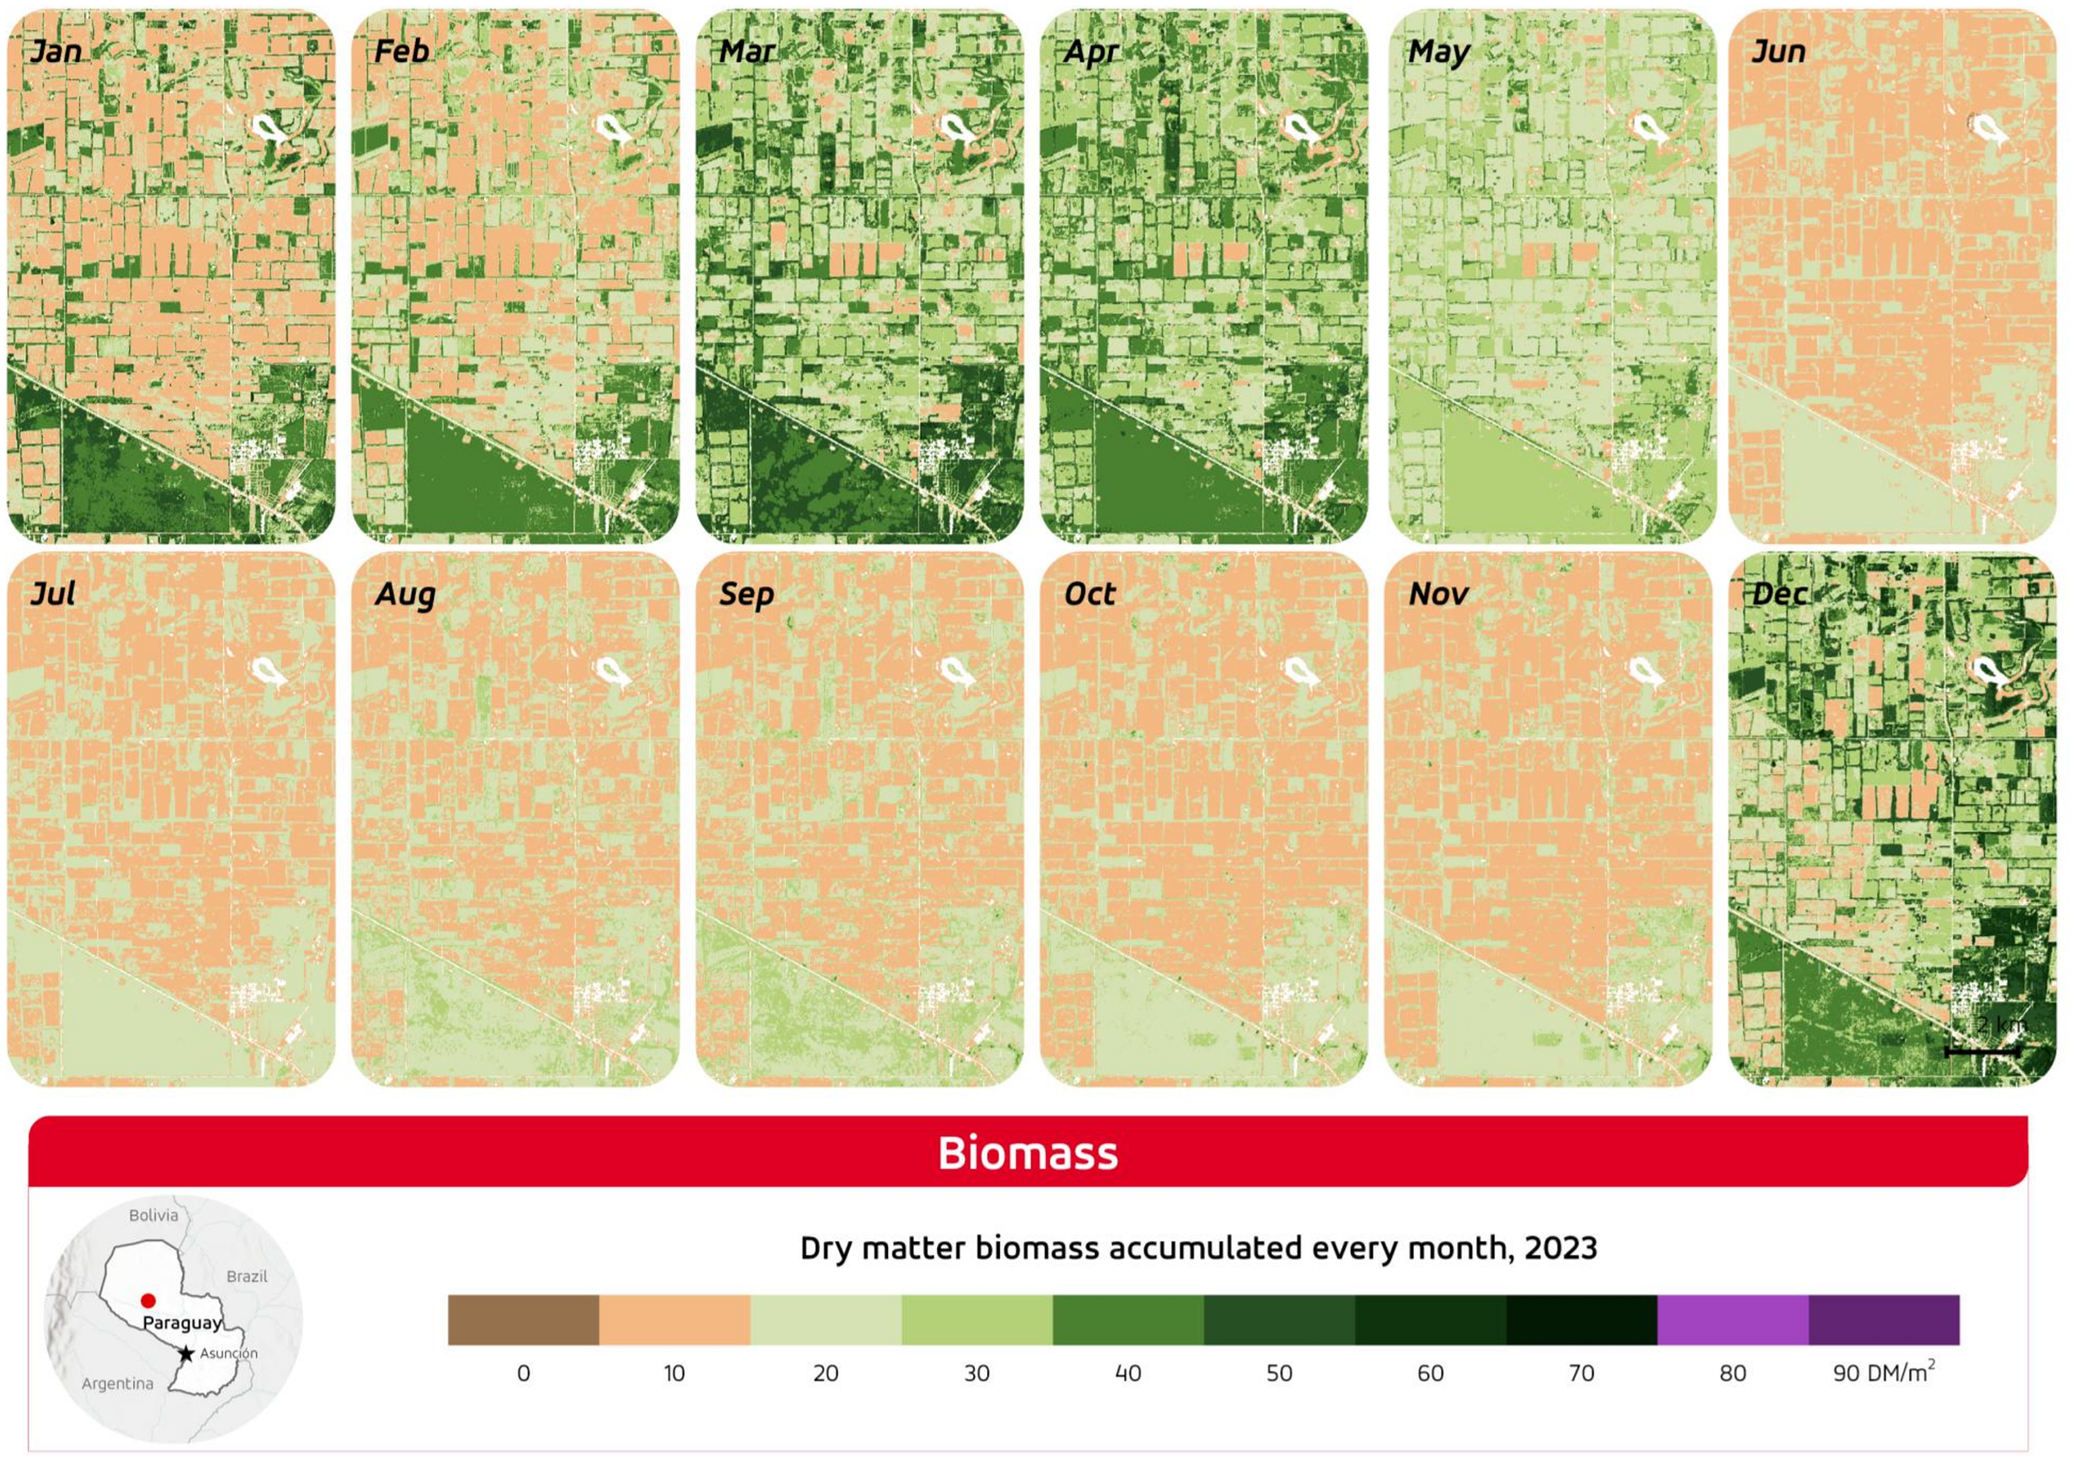
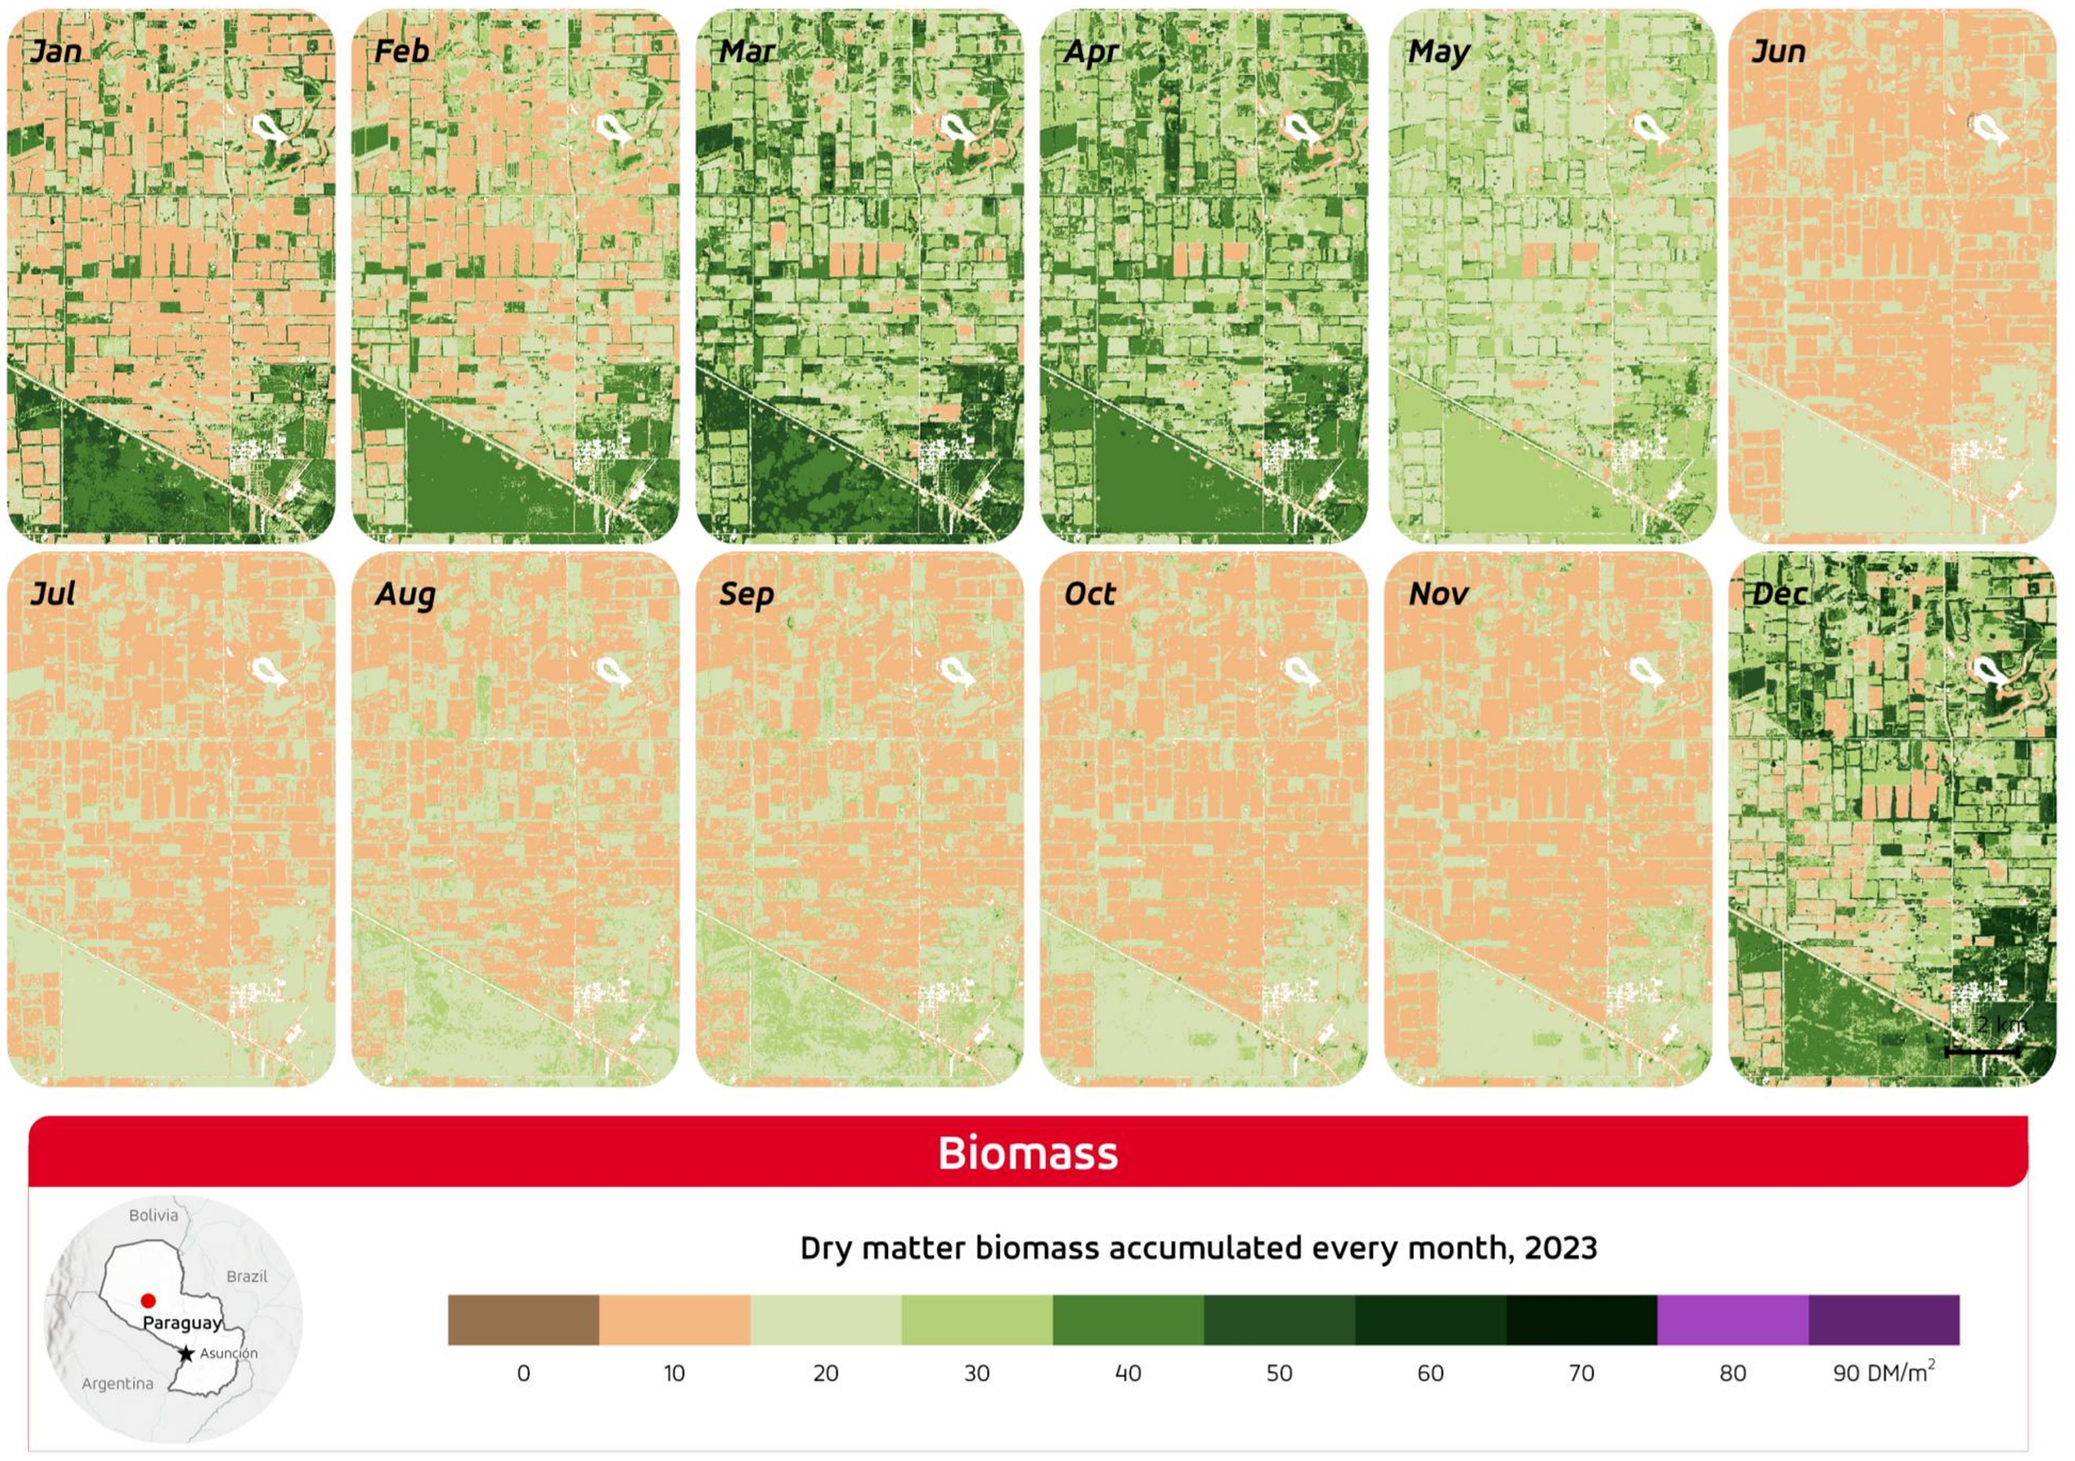
After calibration, the 10-day DMB time series was generated for the entire study area. Figure 4 shows an example of a 10-day DMB product accumulated every month in 2023.
DMB accumulated every month in 2023 for the entire study area.
It is important to note that while the model was robustly calibrated and validated within the FECOPROD trial plots, the absence of independent in-situ DMB measurements from other locations within the broader inference region precludes external validation of the DMB estimates beyond the immediate study area. In addition, a limitation of this study is the lack of a temporal assessment of model performance, as the validation was constrained to spatial variability within a single year (2022) due to the absence of multi-year field biomass data. This precludes an evaluation of the model’s ability to capture interannual variability driven by climate fluctuations.
The products were delivered via a dedicated Pasture Biomass Production decision-support tool. This application allows cooperative managers and farmers to visualise and analyse data. Core functionalities include:
-
1. Interactive Biomass Monitoring: Visualisation and animation of 10-day DMB maps to monitor forage availability.
-
2. Phenological Metrics: Dates and biomass values for the start, peak and end of the growing season, plus daily accumulation and senescence rates.
-
3. Comparative Analysis: A ‘Split Map’ mode to compare products from different seasons or dates.
-
4. Farm-Level Data Extraction: Clicking on trial plots displays a detailed DMB time-series graph for model validation and productivity tracking.
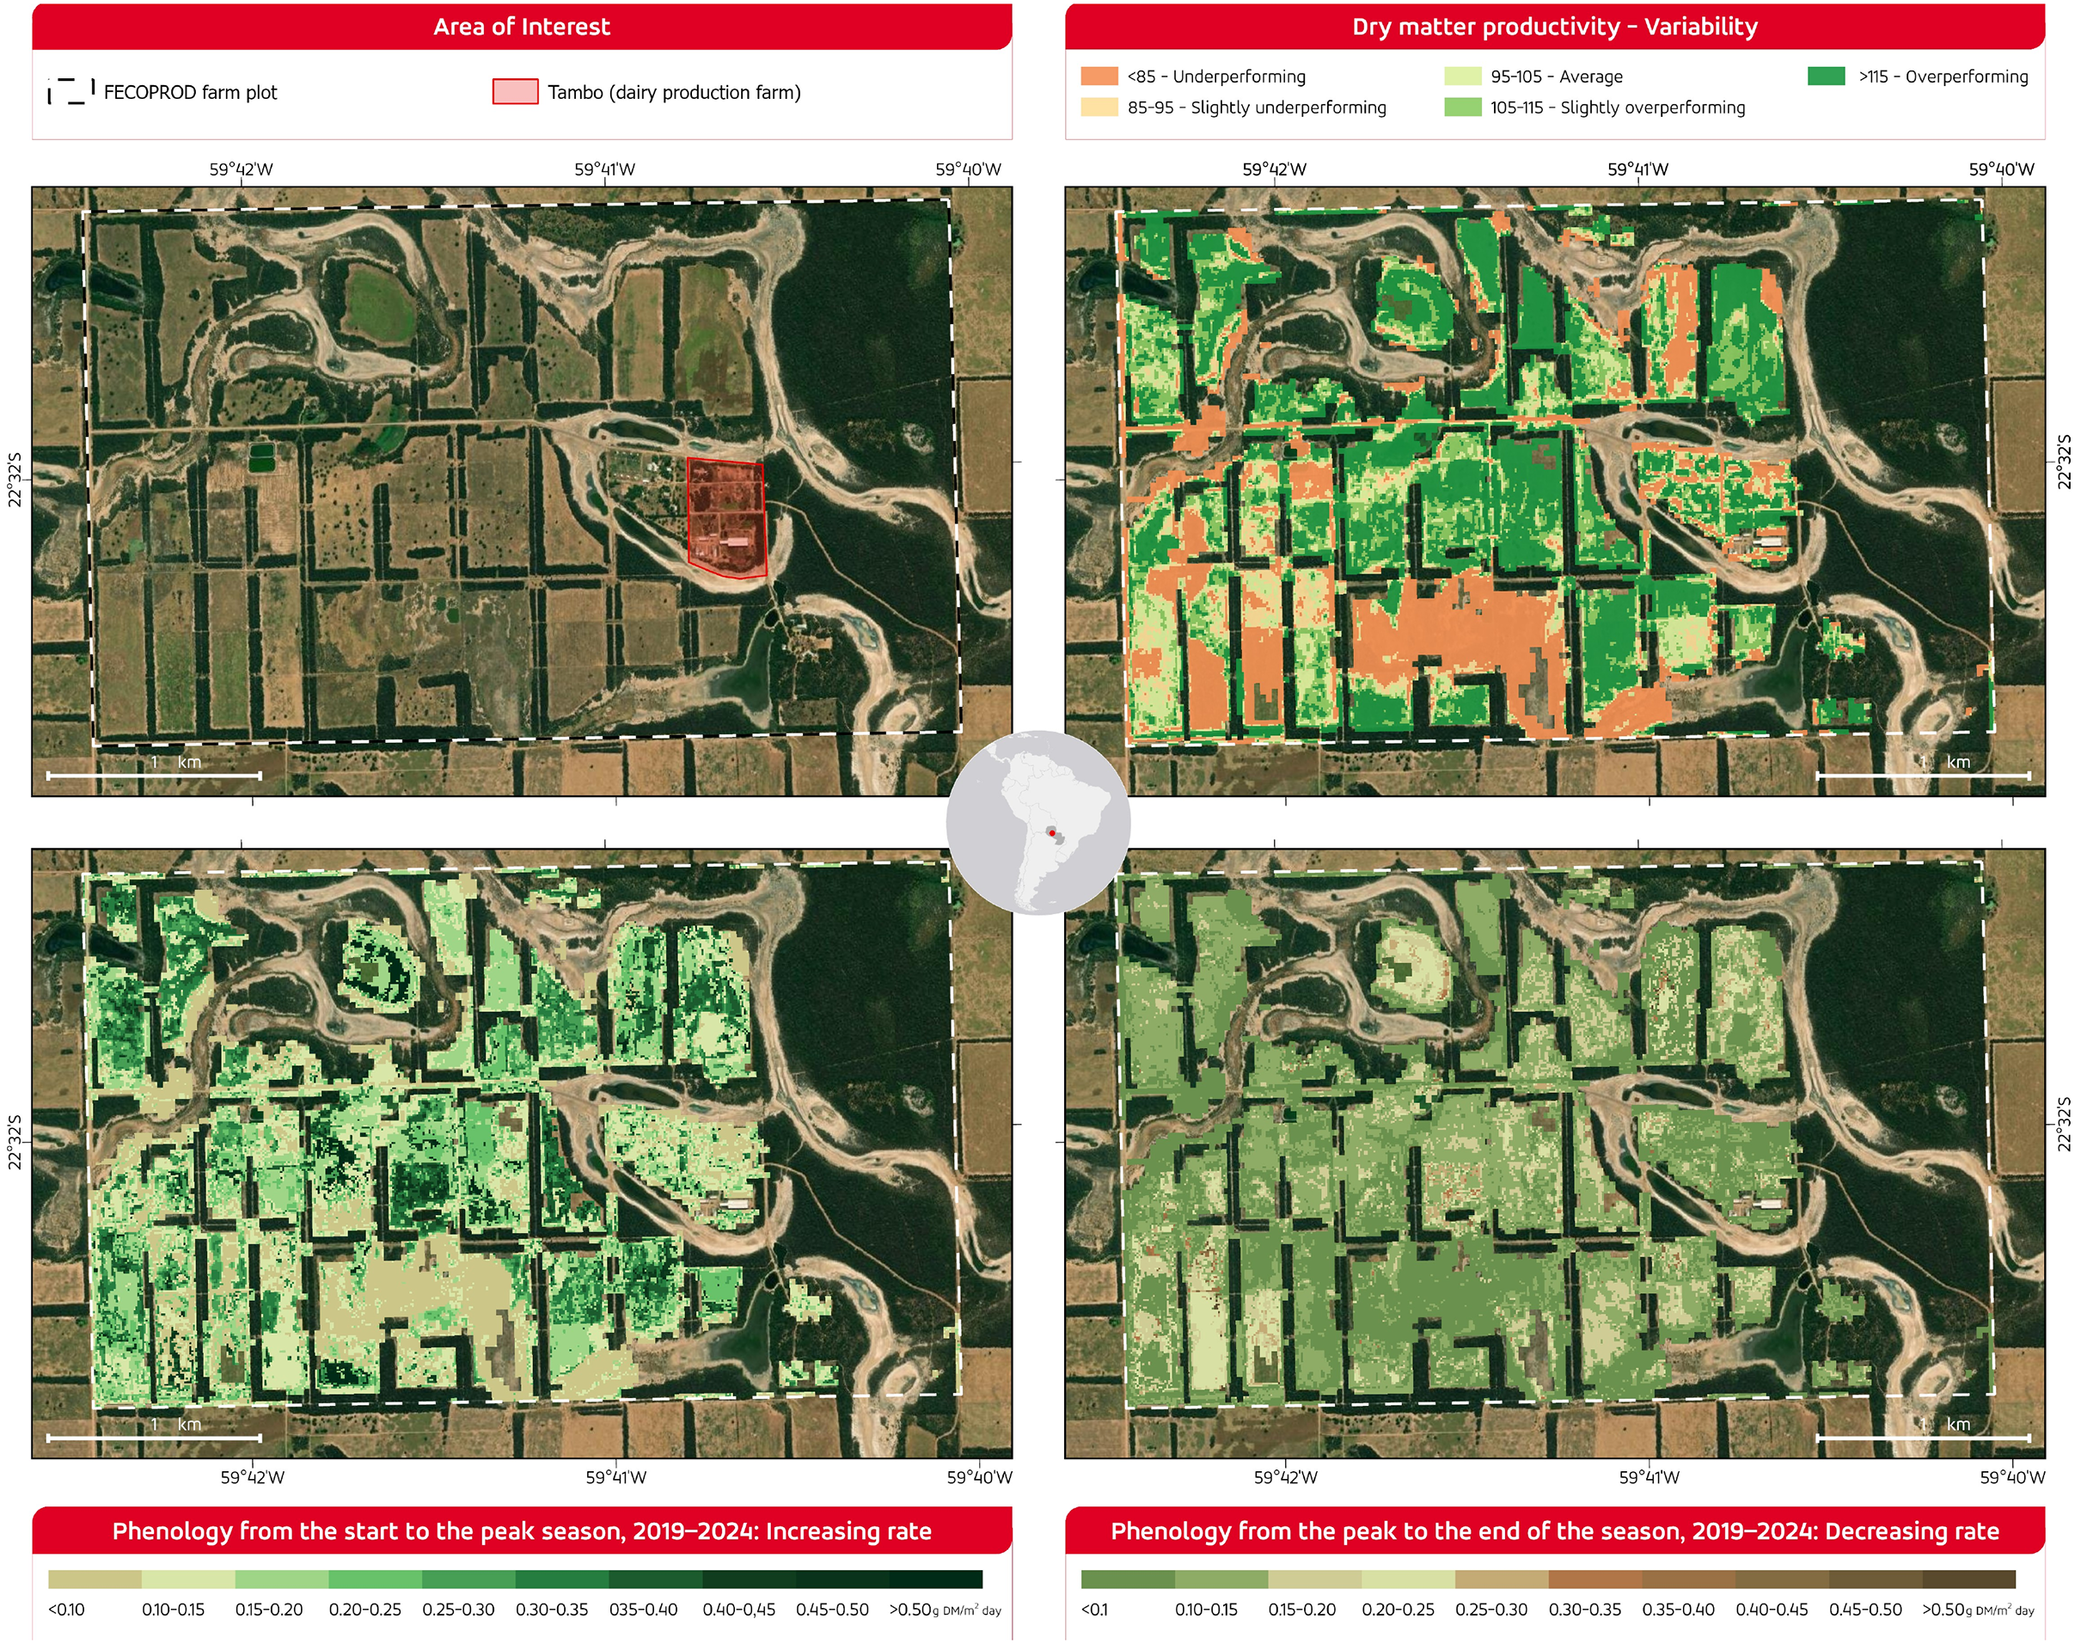
Figure 5 shows an example of variability and phenological metrics derived from 10-day DMB analysis.
Over a FECOPROD farm, DMB variability analysis on the top-right, together with daily accumulation and senescence rates in the bottom-left and bottom-right, respectively.
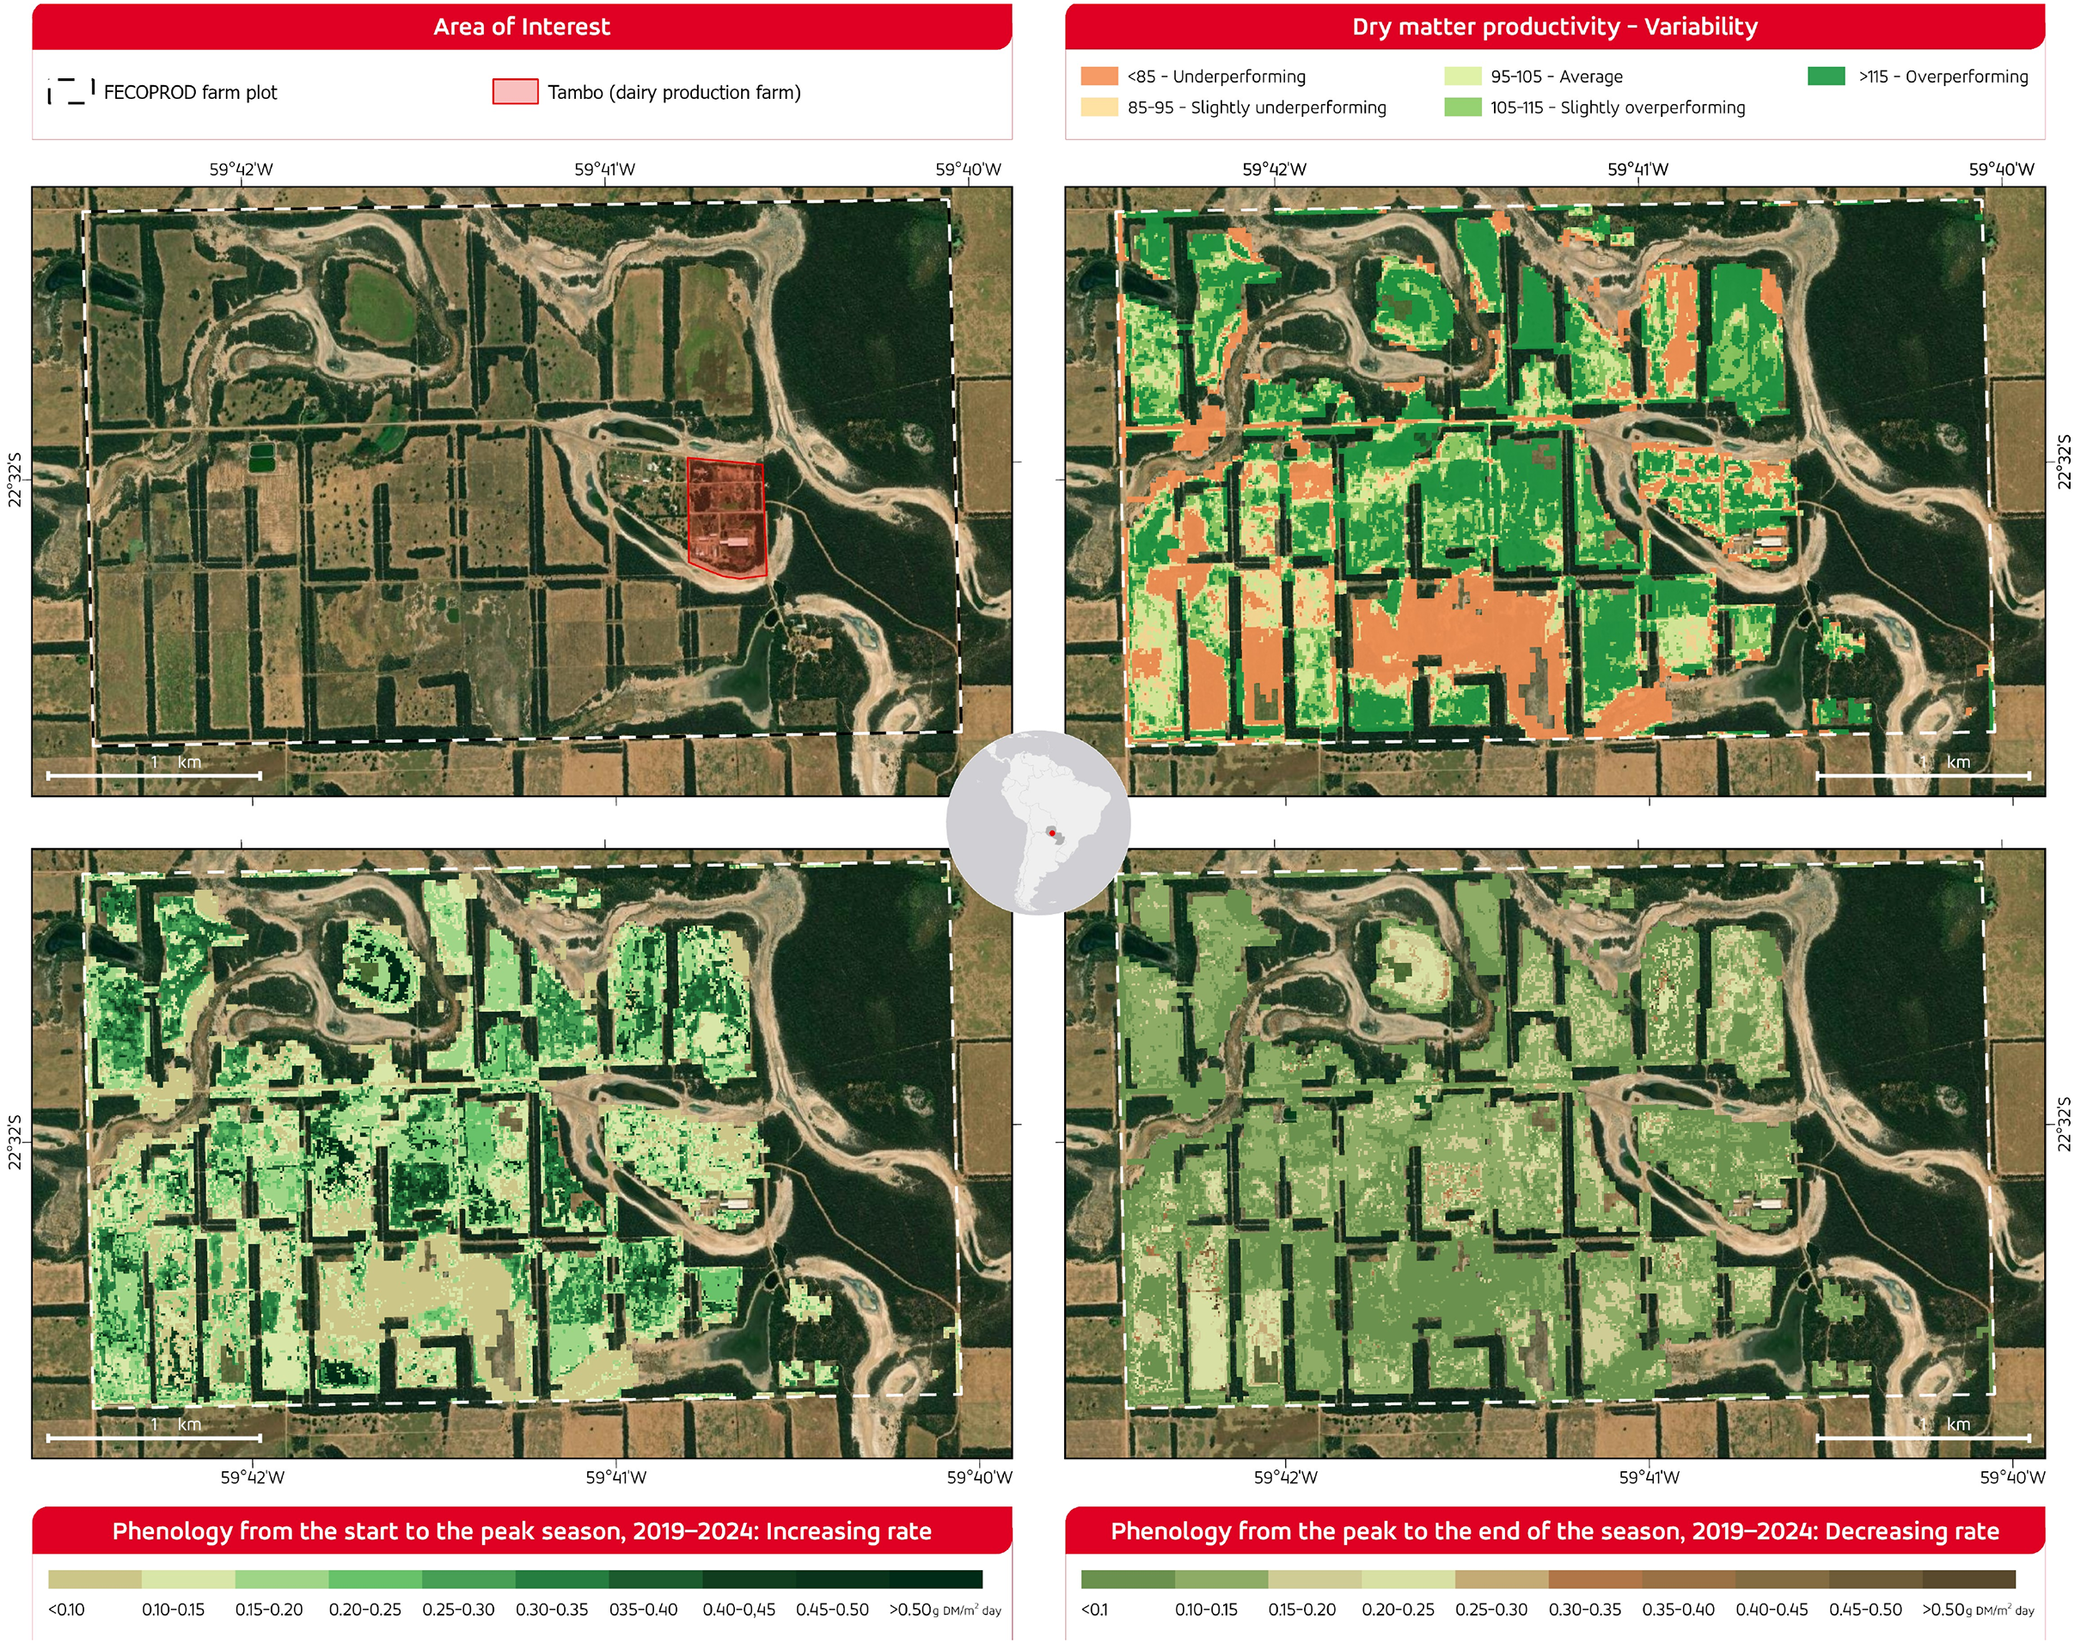
Figure 5 Long description
The DMB variability analysis assesses the condition of pastures in relation to nearby paddocks. The variability is classfied into five categories by highlighting underperforming biomass areas, facilitating targeted interventions such as rotational grazing or supplemental feeding. The DMB increasing rate (Rate of Green-Up) indicator enable precise tracking of growth patterns for grazing schedules, while the DMB decreasoing rate (Rate of Green-Down) to anticipate forage availability.
Results and discussion
The locally calibrated CASA model demonstrated strong performance in estimating grassland biomass in Paraguay’s Central Chaco, achieving a coefficient of determination of R 2 = 0.89 and an RMSE of 8.83% when calibrated and validated against field bale weights. These results exceed those reported in comparable studies and confirm the viability of EO-based approaches for operational livestock management in dryland systems. Nevertheless, critical examination of both methodological strengths and limitations is required when contextualised within the existing literature on dryland ecosystem modelling.
The product developed here differs substantially from other grassland monitoring tools. The Rangeland Analysis Platform (RAP), a benchmark for US rangelands, combines Landsat imagery with machine learning to estimate fractional vegetation cover at 30 m resolution (Robinson et al., Reference Robinson, Allred, Smith, Jones, Moreno, Erickson, Naugle and Running2018; Jones et al., Reference Jones, Naugle, Twidwell, Uden, Maestas and Allred2020). In contrast, this study provides estimates of the DMB specifically calibrated for forage species in the Chaco, using constant-quality products derived every 10 days from the analysis of Sentinel-2 time-series imagery with a resolution of 10 m. RAP has recently expanded to include 10 m Sentinel-2 derived products, but the core Landsat-based fractional cover product remains at 30 m resolution (Allred et al., Reference Allred, McCord, Assal, Bestelmeyer, Boyd, Brooks, Cady, Duniway, Fuhlendorf, Green, Harrison, Jensen, Kachergis, Knight, Mattilio, Mealor, Naugle, O’Leary, Olsoy, Peirce, Reinhardt, Shriver, Smith, Tack, Tanner, Tanner, Twidwell, Webb and Morford2025).
A key methodological contribution is the establishment of a scalable processing workflow adaptable to multiple satellite and climate data sources. Notable advances include: (i) consistent 10-day products derived from reflectance composites over dekadal periods, integrating bands from blue to shortwave infrared (SWIR), selecting the day with the maximum NDVI to ensure consistent data quality; (ii) dynamic fAPAR and albedo calculation from Sentinel-2 composites that captures seasonal surface variations and reduces bias in photosynthetically active radiation (PAR) estimation, unlike biome-averaged fixed values; (iii) time series subjected to a three-step gap filling and smoothing procedures; and (iv) 10 m spatial resolution that captures intra-pasture heterogeneity, a critical advantage over 500 m MODIS-derived products for farm-level decision-making (Smith et al., Reference Smith, Dannenberg, Yan, Herrmann, Barnes, Barron-Gafford, Biederman, Ferrenberg, Fox, Hudson, Knowles, MacBean, Moore, Nagler, Reed, Rutherford, Scott, Wang and Yang2019; Fawcett et al., Reference Fawcett, Cunliffe, Sitch, O’Sullivan, Anderson, Brazier, Hill, Anthoni, Arneth, Arora, Briggs, Goll, Jain, Li, Lombardozzi, Nabel, Poulter, Séférian, Tian, Viovy, Wigneron, Wiltshire and Zaehle2022).
The CASA model’s foundation in explicit ecophysiological principles potentially enables generalisation beyond calibration conditions, provided parameters remain representative. However, land surface models applied to semi-arid ecosystems face considerable uncertainties regarding water availability responses and photodegradation processes, both relevant to the Chaco context (Fawcett et al., Reference Fawcett, Cunliffe, Sitch, O’Sullivan, Anderson, Brazier, Hill, Anthoni, Arneth, Arora, Briggs, Goll, Jain, Li, Lombardozzi, Nabel, Poulter, Séférian, Tian, Viovy, Wigneron, Wiltshire and Zaehle2022).
While the FECOPROD trial plots consist of managed grasslands planted with specific forage species to assess their performance under local climatic conditions, the broader Central Chaco landscape comprises a heterogeneous mosaic of C3 (cool-season) and C4 (warm-season) grasses, shrubs and scattered woody elements, each with distinct ecophysiological parameters (Baldassini and Paruelo, Reference Baldassini and Paruelo2020). Applying the model beyond the trial areas – where parameters were calibrated exclusively on grassland plots – requires caution, as the uniform assignment of LUEmax, root-to-shoot ratio and carbon allocation coefficients across this wider mosaic may introduce bias when significant woody cover is present.
This issue is well documented: Tian et al. (Reference Tian, Brandt, Liu, Verger, Tagesson, Diouf, Rasmussen, Mbow, Wang and Fensholt2016) showed that spectral responses and phenological dynamics differ substantially between herbaceous and woody strata in Sahelian savannahs, complicating vegetation index interpretation. In landscapes where woody cover contributes significantly to the spectral signal without representing available forage, model estimates may diverge from actual grass biomass. This phenomenon could partially explain any discrepancies between modelled estimates and observed bale weights in plots with higher woody encroachment, although within the managed FECOPROD trials – where woody elements are minimal – the calibration remains robust.
Nevertheless, successful root-to-shoot ratio calibration across multiple forage species demonstrates the model’s capacity for specialisation. With detailed species maps, future developments could generate species-specific biomass predictions, substantially improving accuracy. Integration of plant functional type (PFT) maps – such as refined MapBiomas Chaco classifications differentiating herbaceous from woody vegetation – represents a clear pathway for enhancing model transferability to the broader landscape.
The principal strength is successful local calibration with field data – a critical aspect often absent in dryland remote sensing studies. The 10-day temporal resolution and derived phenological metrics (growing season start, peak and end; accumulation and senescence rates) provide operationally relevant information for livestock management.
However, limitations must be explicitly acknowledged. Model accuracy depends on fixed parameters – carbon allocation coefficient (
$ {C}_{\mathrm{allocation}} $
 ) and a simplified temperature-based LUE stress scalar – selected based on data availability rather than local measurement. Validation is exclusively spatial, not temporal, due to the absence of multi-year biomass series. Smith et al. (Reference Smith, Dannenberg, Yan, Herrmann, Barnes, Barron-Gafford, Biederman, Ferrenberg, Fox, Hudson, Knowles, MacBean, Moore, Nagler, Reed, Rutherford, Scott, Wang and Yang2019) emphasise that this recurrent dryland remote sensing limitation severely constrains model capacity to predict ecosystem responses to interannual climate variability. Furthermore, validation was confined to calibration plots; geographically dispersed independent measurements are required to assess regional performance.
The use of MODIS-derived LUEmax (0.86 gC/MJ) introduces unquantified uncertainty. Robinson et al. (Reference Robinson, Allred, Smith, Jones, Moreno, Erickson, Naugle and Running2018) showed that regional LUEmax calibration using flux tower data substantially improves grassland productivity estimates. Additionally, the temperature-based stress function inadequately captures water availability–temperature–productivity interactions characteristic of semi-arid systems; advanced models incorporate vapour pressure deficit or soil water balance stress functions (Pei et al., Reference Pei, Dong, Zhang, Yuan, Doughty, Yang, Zhou, Zhang and Xiao2022).
Future work should therefore: (i) extend temporal calibration scope through continued plot-level biomass collection to capture interannual variability; (ii) collect independent validation data beyond trial plots to assess spatial transferability; (iii) incorporate locally measured carbon allocation coefficients and more complex water stress factors to refine LUE estimation, improving model precision and transferability; and (iv) integrate PFT maps, such as refined MapBiomas Chaco classifications, to differentiate between herbaceous and woody vegetation when scaling the model beyond managed grasslands.
Conclusions
This study successfully developed and validated an operational framework integrating field data with EO and climate analytics to generate high-resolution (10 m), 10-day dry matter biomass maps and phenological metrics for livestock management in Paraguay’s Central Chaco.
The key contributions are threefold. First, it demonstrated that a locally calibrated CASA model, driven by Sentinel-2 and ERA5-Land data, can achieve robust dry matter biomass estimates (R 2 = 0.89, RMSE = 8.83%) in dryland pastoral systems, with validation against independent bale weights confirming model reliability. Second, it established a scalable processing workflow incorporating dynamic fAPAR and albedo calculation and rigorous time-series preparation that outperforms biome-averaged approaches, enabling consistent 10-day monitoring at 10 m resolution. Third, successful species-level root-to-shoot ratio calibration across multiple forage species confirmed the model’s capacity for local specialisation, while highlighting the need for PFT-differentiated parameters when scaling to heterogeneous landscapes.
The resulting decision-support tool delivers actionable intelligence to farmers and cooperatives, enabling precise monitoring of forage availability, identification of phenological transitions (start, peak and end of growing season) and quantification of accumulation and senescence rates. This directly supports sustainable intensification by preventing overgrazing, optimising resource use and strengthening agricultural resilience to climate variability.
Nevertheless, critical limitations must guide future development. The current validation is exclusively spatial and confined to managed grassland plots; independent, geographically dispersed and multi-annual datasets are required to assess temporal performance and transferability to the wider Chaco landscape, where woody vegetation is prevalent. Parameter dependencies – notably globally derived LUEmax, simplified temperature stress functions and fixed carbon allocation coefficients – represent sources of uncertainty warranting refinement through local flux tower calibration, integrated water stress factors and PFT-specific parameterisation.
This case study establishes a precedent for Paraguay and analogous semi-arid regions globally, demonstrating that EO-driven insights can be operationalised to empower agricultural stakeholders. The pilot’s success supports broader adoption with potential to enhance food security, economic viability and environmental stewardship in livestock-dependent economies.
Open peer review
For open peer review materials, please visit http://doi.org/10.1017/dry.2026.10039.
Data availability statement
The Sentinel-2 L2A satellite imagery used in this study is freely available from the Copernicus Data Space Ecosystem (https://dataspace.copernicus.eu/data-collections/copernicus-sentinel-missions/sentinel-2). The ERA5-Land climate data can be accessed via the Copernicus Climate Data Store (https://cds.climate.copernicus.eu). The MODIS MOD17 Biome-Property-Look-Up-Table parameters are available through the NASA MODIS portal (MODIS Web). The MapBiomas Chaco land cover maps are publicly accessible at MapBiomas Chaco.
The field data (parcel locations and bale weights) were provided by FECOPROD under a collaboration agreement supporting this ESA GDA Agriculture activity (Contract Number 4000138672/22/I-NB). They are not publicly available due to their proprietary nature, but might be available from FECOPROD upon reasonable request and with appropriate permission. Dry matter biomass products and phenological metrics are available from the corresponding author upon reasonable request.
Acknowledgements
The authors would like to thank FECOPROD and Copernicus services for providing datasets, and the World Bank for initiating and supporting this effort.
Financial support
This work was supported by the European Space Agency’s Global Development Assistance (GDA) thematic activity on Agriculture (Contract Number 4000138672/22/I-NB).

 Open access


Comments
No accompanying comment.