


1. Introduction
The Indo-Pacific Warm Pool (IPWP), acknowledged as possessing the world’s largest tropical warm water mass, is characterized by sea surface temperatures surpassing 28°C (Clement et al. Reference Clement, Seager and Murtugudde2005; Kim et al. Reference Kim, Yu and Lu2012; De Deckker, Reference De Deckker2016) and plays a crucial role in atmospheric deep convection (Russell et al. Reference Russell, Vogel, Konecky, Bijaksana, Huang, Melles, Wattrus, Costa and King2014). Variations in sea surface temperatures, rainfall patterns and oceanic circulation within the IPWP significantly impact the distribution of heat and moisture, thus influencing global atmospheric circulation patterns (Cane, Reference Cane1998; Hoerling et al. Reference Hoerling, Hurrell and Xu2001; Yan et al. Reference Yan, Ho, Zheng and Klemas1992; Qian et al. Reference Qian, Chang, Li, Li, Sun and Zhang2023). Modern observations highlight the substantial impact of the seasonal latitudinal shifts of the Intertropical Convergence Zone (ITCZ) and its associated monsoon system, as well as the El Niño-Southern Oscillation (ENSO) variability, on shaping hydrologic characteristics in the IPWP region (Leech et al. Reference Leech, Lynch-Stieglitz and Zhang2013; Schneider et al. Reference Schneider, Bischoff and Haug2014). Therefore, studying hydrological climate variations in the IPWP is crucial for unraveling its intricate role in regional and global climate systems.
On geological timescales, the impact and mechanisms of ITCZ variations on the regional precipitation changes within the IPWP present conflicting findings. As a narrow band of convective winds and intense precipitation located near the equator, the ITCZ regulates the distribution of precipitation in the middle and low latitudes by seasonally migrating in response to interhemispheric temperature gradients (Schneider et al. Reference Schneider, Bischoff and Haug2014; Denniston et al. Reference Denniston, Ummenhofer, Wanamaker, Lachniet, Villarini, Asmerom, Polyak, Passaro, Cugley, Woods and Humphreys2016). With the southward migration of the ITCZ, precipitation decreases in the Northern Hemisphere summer monsoon area, while increasing in the Southern Hemisphere summer monsoon area, and vice versa (Schneider et al. Reference Schneider, Bischoff and Haug2014). Several studies propose that tropical precipitation changes were primarily linked to the precession cycles in Earth’s orbit (Clement et al. Reference Clement, Hall and Broccoli2004; Wang et al. Reference Wang, Cheng, Edwards, Kong, Shao, Chen, Wu, Jiang, Wang and An2008; Merlis et al. Reference Merlis, Schneider, Bordoni and Eisenman2013; Jalihal et al. Reference Jalihal, Bosmans, Srinivasan and Chakraborty2019). Accordingly, the interhemispheric anti-phasing precipitation pattern is shaped by contrasting insolation between the Northern and Southern Hemispheres, causing latitudinal ITCZ migrations (Berger, Reference Berger1978; Kutzbach et al. Reference Kutzbach, Liu, Liu and Chen2008). Findings from stalagmite δ18O records in both hemispheres strongly support this hypothesis (e.g., Wang et al. Reference Wang, Cheng, Edwards, Kong, Shao, Chen, Wu, Jiang, Wang and An2008; Cheng et al. Reference Cheng, Edwards, Sinha, Spotl, Yi, Chen, Kelly, Kathayat, Wang, Li, Kong, Wang, Ning and Zhang2016). Reconstructions of precipitation, runoff and sea-surface salinity (SSS) from the IPWP further reveal notable responses to precession-induced alterations (e.g., Kissel et al. Reference Kissel, Laj, Kienast, Bolliet, Holbourn, Hill, Kuhnt and Braconnot2010; Tachikawa et al. Reference Tachikawa, Cartapanis, Vidal, Beaufort, Barlyaeva and Bard2011; Dang et al. Reference Dang, Jian, Kissel and Bassinot2015; Jian et al. Reference Jian, Wang, Dang, Mohtadi, Rosenthal, Lea, Liu, Jin, Ye, Kuhnt and Wang2022). Notably, Earth’s obliquity also appears to be important in driving the latitudinal migration of the ITCZ, similarly resulting in anti-phase variations in interhemispheric precipitation in the IPWP (Liu et al. Reference Liu, Lo, Shi, Wei, Chou, Chen, Chuang, Wu, Mii, Peng, Amakawa, Burr, Lee, DeLong, Elderfield and Shen2015; Zhang et al. Reference Zhang, Xu, Holbourn, Kuhnt, Beil, Li, Xiong, Dang, Yan, Pei, Ran and Wu2020, Reference Zhang, Xu, Holbourn, Kuhnt, Xiong and Li2022). Liu et al. (Reference Liu, Lo, Shi, Wei, Chou, Chen, Chuang, Wu, Mii, Peng, Amakawa, Burr, Lee, DeLong, Elderfield and Shen2015) suggest that obliquity forcing may have a greater impact on the western Pacific ITCZ migration, based on planktonic foraminifera REE/Ca records. Therefore, the reconstruction of precipitation records on longer timescales is of great significance for exploring the effects of diverse orbital forcing on the hydroclimate variability.
In contrast to the observed anti-phase precipitation patterns between hemispheres on different timescales, an increasing number of studies demonstrated synchronized precipitation variations between hemispheres in tropical regions on (sub-)millennial timescales (e.g., Konecky et al. Reference Konecky, Russell, Rodysill, Vuille, Bijaksana and Huang2013; Yan et al. Reference Yan, Wei, Soon, An, Zhou, Liu, Wang and Carter2015; Denniston et al. Reference Denniston, Ummenhofer, Wanamaker, Lachniet, Villarini, Asmerom, Polyak, Passaro, Cugley, Woods and Humphreys2016; Scroxton et al. Reference Scroxton, Burns, McGee, Hardt, Godfrey, Ranivoharimanana and Faina2017; Yang et al. Reference Yang, Zhang, Yi, Zhong, Lu, Wan, Du and Xiang2023). Such synchronized pattern would contradict the traditional migration theory of the ITCZ. The in-phase precipitation changes can be well explained by the expansion and contraction of the latitudinal extent of the ITCZ (Konecky et al. Reference Konecky, Russell, Rodysill, Vuille, Bijaksana and Huang2013; Yan et al. Reference Yan, Wei, Soon, An, Zhou, Liu, Wang and Carter2015; Denniston et al. Reference Denniston, Ummenhofer, Wanamaker, Lachniet, Villarini, Asmerom, Polyak, Passaro, Cugley, Woods and Humphreys2016; Scroxton et al. Reference Scroxton, Burns, McGee, Hardt, Godfrey, Ranivoharimanana and Faina2017; Yang et al. Reference Yang, Zhang, Yi, Zhong, Lu, Wan, Du and Xiang2023). During times of ITCZ expansion, precipitation intensifies synchronously at both northern and southern edges, while precipitation declines simultaneously at both edges when the ITCZ contracts (Yuan et al. Reference Yuan, Chiang, Liu, Bijaksana, He, Jiang, Imran, Wicaksono and Wang2023). The expansion and contraction of the ITCZ is likely triggered by various interacting factors, such as symmetrical changes in solar irradiance (Yan et al. Reference Yan, Wei, Soon, An, Zhou, Liu, Wang and Carter2015; Scroxton et al. Reference Scroxton, Burns, McGee, Hardt, Godfrey, Ranivoharimanana and Faina2017), strengthening Walker circulation (Konecky et al. Reference Konecky, Russell, Rodysill, Vuille, Bijaksana and Huang2013) and changes in the meridional atmospheric circulation (Denniston et al. Reference Denniston, Ummenhofer, Wanamaker, Lachniet, Villarini, Asmerom, Polyak, Passaro, Cugley, Woods and Humphreys2016). Further studies, hence, are warranted to explore the impact of spatial ITCZ variations on alterations in precipitation patterns between hemispheres.
As the region with the highest water vapor exchange globally (Pierrehumbert, Reference Pierrehumbert2000), the IPWP is ideal to provide insight into the impact of ITCZ migration and expansion/contraction on local precipitation. Recently, Xiong et al. (Reference Xiong, Zhai, Algeo, Lu, Li, Meyer, Jiang, Zhang, Qin, Gong and Wang Zand Jia2022) and Yu et al. (Reference Yu, Tang, Colin, Wilson, Zhou, Song, Chang, Zhang, Bassinot and Wan2023) examined the spatial pattern of precipitation variations across the IPWP on millennial scales, highlighting the importance of the ITCZ on the precipitation patterns in different regions of the IPWP. The observed changes in precipitation during the Last Glacial Maximum (LGM) point to an overall drying trend across the IPWP, caused by both the zonal shifts of ENSO and the meridional migration of ITCZ (Xiong et al. Reference Xiong, Zhai, Algeo, Lu, Li, Meyer, Jiang, Zhang, Qin, Gong and Wang Zand Jia2022). Yu et al. (Reference Yu, Tang, Colin, Wilson, Zhou, Song, Chang, Zhang, Bassinot and Wan2023) identified noticeably spatial heterogeneity of precipitation within the IPWP over the past 40 kyr, attributed to the predominant effects of the ENSO-like system in the western Pacific and the migration of the ITCZ in the Indian Ocean. Unfortunately, studies on past ITCZ expansion/contraction changes are not only scarce but also primarily confined to the last few millennia for the IPWP region (e.g., Denniston et al. Reference Denniston, Ummenhofer, Wanamaker, Lachniet, Villarini, Asmerom, Polyak, Passaro, Cugley, Woods and Humphreys2016; Konecky et al. Reference Konecky, Russell, Rodysill, Vuille, Bijaksana and Huang2013; Scroxton et al. Reference Scroxton, Burns, McGee, Hardt, Godfrey, Ranivoharimanana and Faina2017; Yan et al. Reference Yan, Wei, Soon, An, Zhou, Liu, Wang and Carter2015; Yang et al. Reference Yang, Zhang, Yi, Zhong, Lu, Wan, Du and Xiang2023), significantly limiting our understanding of the impact of ITCZ variability on spatial patterns of precipitation variations in IPWP.
To determine the temporal and spatial variability of the ITCZ on orbital timescales, we attempted to reconstruct the precipitation patterns within the IPWP region. Past precipitation, approximated from the residual oxygen isotope compositions of seawater, was deduced from combined δ18O and Mg/Ca compositions of sea surface-dwelling planktonic foraminifera from International Ocean Discovery Program (IODP) Site U1486 within the central IPWP (Bismarck Sea). By integrating published ice-volume corrected sea surface salinity records (δ18Osw-ivc) from the IPWP region, we assessed the spatial and temporal patterns of precipitation across the IPWP over the past 450 kyr and explored its driving mechanisms on the precession band.
2. Materials and methods
2.a. Location of site U1486 and modern climate
IODP Expedition 363 Site U1486 (02º22.34ʹS, 144º36.08ʹE) was drilled at a water depth of 1332 m in the Bismarck Sea, located ∼150 km away from the mouth of the Sepik River in Papua New Guinea (Fig. 1a; Rosenthal et al. Reference Rosenthal, Holbourn and Kulhanek2018). This study focused on samples from Site U1486, collected at 10-cm intervals, covering a depth range from the core-top down to 31 m Core Composite Depth Below Sea Floor. The sediment lithology in this section remained consistently homogenous, primarily composed of fine-grained, grayish-white sediment rich in planktonic microfossils. No volcanic ash layers or signs of disturbance were observed.
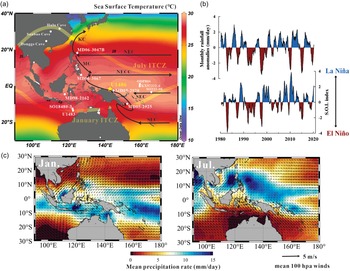
The Indo-Pacific Warm Pool and regional circulation patterns, alongside the modern climatology of the study area. (a) Map of the IPWP displaying modern annual sea surface temperatures (SST at 0 m; World Ocean Atlas 2013 dataset; Locarnini et al. Reference Locarnini, Mishonov, Antonov, Boyer, Garcia, Baranova, Zweng, Paver, Reagan, Johnson, Hamilton and Seidov2013) of the studied Site U1486 (yellow star) and other relevant sites discussed in the study (white circles) is shown. Bright yellow shading lines denote the mean positions of the Intertropical Convergence Zone (ITCZ) in July and January, respectively (Lutgens & Tarbuck, Reference Lutgens and Tarbuck2001). Black dotted lines represent annual mean 28°C SST isotherms. Key ocean currents include the North Equatorial Current (NEC), North Equatorial Counter Current (NECC), South Equatorial Current (SEC), Kuroshio Current (KC) and Mindanao Current (MC). (b) The Southern Oscillation Index (SOI, 5-point running average) between 1980 and 2020 (https://www.cpc.ncep.noaa.gov/data/indices/soi) together with the monthly rainfall anomaly over the Site U1486 source area (2.5° spatial resolution centered on 2°S, 144°E, 11-point running average, https://climatedataguide.ucar.edu/climate-data/gpcp-monthly-global-precipitation-climatology-project). (c) Depiction of mean rainfall rate and the 1000 hPa wind field in January (left) and July (right). Rainfall data sourced from https://psl.noaa.gov/data/gridded/data.cmap.html, while land wind data obtained from http://iridl.ldeo.columbia.edu/expert/ds:/SOURCES/.NOAA/.NCEP-NCAR/.CDAS-1.

The hydrological cycle in the studied area is influenced both by the Asian-Australian monsoon and ENSO (Webster et al. Reference Webster, Magana, Palmer, Shukla, Tomas, Yanai and Yasunari1998; Wang et al. Reference Wang, Wu and Li2003). During the boreal summer, southeasterly trade winds prevail, with the ITCZ shifting northward, thereby reducing the precipitation rate in the study area (Fig. 1a, c). Conversely, northwesterly winds dominate during the boreal winter, leading to a southward shift of the ITCZ and an increase in precipitation (Fig. 1a, c). On inter-annual timescales, precipitation is closely linked to ENSO events (Fig. 1b). Unusual dry (wet) conditions occur in the Papua New Guinea region during El Niño (La Niña) phases (Dai & Wigley, Reference Dai and Wigley2000).
2.b. Stable oxygen isotope and Mg/Ca analyses
Stable oxygen isotope (δ18O) and Mg/Ca analyses were conducted on the surface-dwelling planktonic foraminiferal species Globigerinoides ruber (white) extracted from 335 samples collected at 10-cm intervals downcore. Approximately 50 shells of G. ruber were selected from the 250–355 μm size fraction. Subsequently, these foraminiferal shells were gently crushed into several fragments.
For stratigraphical purposes, δ18O was measured on the benthic foraminifer Cibicidoides wuellerstorfi. Approximately 3–5 individuals were picked from both the 300–355 μm and the 355–500 μm size fractions.
For stable isotope analysis, all fragments from the benthic samples and one-third of the fragments from the planktonic foraminifer G. ruber were utilized, while the remaining two-thirds of the G. ruber fragments were allocated for Mg/Ca analysis. The isotope analysis was performed using a GV IsoPrime mass spectrometer at the Key Laboratory of Marine Geology and Environment, Institute of Oceanography, Chinese Academy of Sciences, Qingdao. Results are presented in δ18O notation (‰ relative to the Vienna Pee Dee Belemnite standard), calibrated to the National Bureau of Standards 18 standard, analyzed approximately every 10 samples, with a long-term standard deviation of 0.06‰.
For Mg/Ca analysis, the G. ruber underwent pretreatment and cleaning procedures following the methods described by Barker et al. (Reference Barker, Greaves and Elderfield2003), with the exclusion of a reductive step. The shells were sequentially cleaned using Milli-Q water rinses, methanol rinses and an oxidizing solution. Organic matter was eliminated through oxidation using a heated 1% NaOH-buffered H2O2 solution. Samples were dissolved in 0.075-M QD HNO3 and analyzed using an inductively coupled plasma–optical emission spectrometer (ICP-OES) at the same laboratory. The average standard deviation for replicate measurements was approximately 0.52%. The contamination assessment included Fe/Ca, Mn/Ca and Al/Ca ratios, with most samples registering values below detection limits (Fig. S1). Furthermore, according to Barker et al. (Reference Barker, Greaves and Elderfield2003), the presence of detrital contamination affecting the measured Mg/Ca ratios can be inferred by evaluating the correlation between estimated Mg/Ca and Fe/Ca or Al/Ca data. No significant correlation was found between Fe/Ca and Mg/Ca (R2 = 0.006), Mn/Ca and Mg/Ca (R2 = 0.02), or Al/Ca and Mg/Ca (R2 = 0.004), ensuring the reliability of the Mg/Ca measurements (Fig. S1).
2.c. Estimates of sea-surface temperature and seawater δ18O
The planktonic foraminifer G. ruber calcifies within the depths of 30–95 m in the mixed layer of the Western Pacific Warm Pool (WPWP) (Rippert et al. Reference Rippert, Nürnberg, Raddatz, Maier, Hathorne, Bijma and Tiedemann2016; Raddatz et al. Reference Raddatz, Nürnberg, Tiedemann and Rippert2017). By comparing the reconstructed sea-surface temperature (SSTMg/Ca) based on the Mg/Ca ratio in G. ruber shells using available calibration equations (Fig. S2; Table S1), we selected the equation (1) established in the western Pacific by Dekens et al. (Reference Dekens, Lea, Pak and Spero2002). This decision was based on the fact that its constructed average core-top SSTMg/Ca value (∼29.3°C) aligns closely with the modern SST (∼29.1°C; Locarnini et al. Reference Locarnini, Mishonov, Antonov, Boyer, Garcia, Baranova, Zweng, Paver, Reagan, Johnson, Hamilton and Seidov2013).
 $$\matrix{ {{\rm{SST}}(^\circ {\rm{C}}) = \;{\rm{ln}}\;\left[ {{\rm{Mg}}/{\rm{Ca}}\;\left( {{\rm{mmol}}/{\rm{mol}}} \right)/0.38} \right]/0.09\;} \hfill \cr
{\quad \quad \quad \quad \quad \quad + 0.61\;\left( {{\rm{core}}\;{\rm{depth}}\;{\rm{km}}} \right) + 1.6} \hfill \cr } $$
$$\matrix{ {{\rm{SST}}(^\circ {\rm{C}}) = \;{\rm{ln}}\;\left[ {{\rm{Mg}}/{\rm{Ca}}\;\left( {{\rm{mmol}}/{\rm{mol}}} \right)/0.38} \right]/0.09\;} \hfill \cr
{\quad \quad \quad \quad \quad \quad + 0.61\;\left( {{\rm{core}}\;{\rm{depth}}\;{\rm{km}}} \right) + 1.6} \hfill \cr } $$
Calcite dissolution might lead to lowered Mg/Ca-temperature estimates due to the selective removal of Mg-ions from the foraminiferal calcite (e.g., Nürnberg et al. Reference Nürnberg, Bijma and Hemleben1996; Dekens et al. Reference Dekens, Lea, Pak and Spero2002; Regenberg et al. Reference Regenberg, Nürnberg, Steph, Groeneveld, Garbe-Schönberg, Tiedemann and Dullo2006). Equation (1) incorporates a depth correction to account for dissolution effects on Mg/Ca. As indicated by Regenberg et al. (Reference Regenberg, Regenberg, Garbe-Schönberg and Lea2014), foraminiferal Mg/Ca in the study area is notably affected at depths below 2500 m. Given the limited impact of dissolution at our specific location (1332 m), we decided not to apply the dissolution correction in our Mg/Ca data. Moreover, recent calibrations derived from sediment traps and modern core tops in WPWP provide confidence that the dissolution effect is insignificant in our study area (Hollstein et al. Reference Hollstein, Mohtadi, Rosenthal, Moffa Sanchez, Oppo, Martínez Méndez, Steinke and Hebbeln2017).
The error in SSTMg/Ca reconstructions was assessed by propagating the uncertainties arising from both the Mg/Ca measurements and the Mg/Ca temperature calibration, following Mohtadi et al. (Reference Mohtadi, Prange, Oppo, De Pol-Holz, Merkel, Zhang, Steinke and Luckge2014). On average, the resulting errors are approximately ±0.97°C.
The oxygen isotope composition of seawater (δ18Osw) and SSS exhibit a linear relationship in the western Pacific (e.g., Fairbanks et al. Reference Fairbanks, Evans, Rubenstone, Mortlock, Broad, Moore and Charles1997; Gibbons et al. Reference Gibbons, Oppo, Mohtadi, Rosenthal, Cheng, Liu and Linsley2014). As a result, the residual δ18O of surface seawater (δ18Osw-ivc), which corrects for the influence of continental ice volume, has been widely utilized in the reconstruction of past regional hydrological changes. We derived δ18Osw using Equation (2) established by Bemis et al. (Reference Bemis, Spero, Bijma and Lea1998), adjusting values to the Vienna Standard Mean Ocean Water standard by adding 0.27‰ (Hut, Reference Hut1987). The estimated average core-top δ18Osw value (∼0.25‰) closely matches the modern seawater δ18O value at the core site (0.22‰; LeGrande & Schmidt, Reference LeGrande and Schmidt2006). Additionally, we compared the estimated δ18Osw results derived from different SSTMg/Ca calibration equations (Fig. S2; Table S1), validating the reliability of the calibration equations. Furthermore, we corrected δ18Osw for global ice volume changes based on the studies by Bintanja et al. (Reference Bintanja, van de Wal and Oerlemans2005) and Spratt & Lisiecki (Reference Spratt and Lisiecki2016), respectively. As shown in Fig. S2, the two estimated δ18Osw-ivc results exhibit a high level of consistency. Consequently, the estimated δ18Osw-ivc derived from simulated global marine isotopes from Bintanja et al. (Reference Bintanja, van de Wal and Oerlemans2005) is reliable and feasible.
 $${{\rm{\delta }}^{18}}{{\rm{O}}_{{\rm{sw}}}} = \left[ {{\rm{SS}}{{\rm{T}}_{{\rm{Mg}}/{\rm{Ca}}}}\left( {^\circ {\rm{C}}} \right) - 16.5 + 4.8 \times {{\rm{\delta }}^{18}}{{\rm{O}}_{G.\;ruber}}} \right]/4.8 + 0.27$$
We calculated uncertainties in δ18Osw-ivc using the method described by Mohtadi et al. (Reference Mohtadi, Prange, Oppo, De Pol-Holz, Merkel, Zhang, Steinke and Luckge2014), accounting for uncertainties from Mg/Ca and δ18O measurements, temperature equations and global ice volume removal (Bintanja et al. Reference Bintanja, van de Wal and Oerlemans2005). The resulting uncertainties averaged 0.21‰ for δ18Osw-ivc.
2.d. Chronology
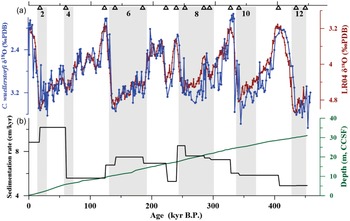
The age model for Site U1486 was constructed based on the δ18O record obtained from the benthic foraminifer Cibicidoides wuellerstorfi (δ18O C. wuellerstorfi ). The δ18O C. wuellerstorfi values ranged from 1.68‰ to 3.85‰ over the past 450 kyr BP, revealing clear glacial-interglacial cycles (Fig. 2a). Comparison of δ18O C. wuellerstorfi values with the global benthic foraminiferal δ18O stack LR04 (Lisiecki & Raymo, Reference Lisiecki and Raymo2005) identified 15 tie points for age control (Fig. 2a). The age model for the entire core was calculated using a MATLAB linear interpolation optimization method. Site U1486 provides a continuous record spanning the past 450 kyr, encompassing five glacial-interglacial cycles (Fig. 2a). The average sedimentation rate over this period was approximately 7.17 cm/kyr the past 450 kyr (Fig. 2b). With a sampling interval of 10 cm, the average sample resolution is approximately 1.3 kyr.
Age model of Site U1486. (a) Benthic foraminifer C. wuellerstorfi δ18O (blue line) and the global benthic foraminiferal δ18O stack LR04 (Lisiecki & Raymo, Reference Lisiecki and Raymo2005) (red line). Black triangles indicate tie points for δ18O C. wuellerstorfi . (b) Depth-age model (green line) and sedimentation rates (black line) of sediment Site U1486. Gray vertical shadings indicate even-numbered Marine Isotope Stages (MIS).

3. Results
The oxygen isotope values of G. ruber (δ18O G. ruber ) exhibit a range from −3.18‰ to −0.93‰ over the past 450 kyr, displaying distinct glacial-interglacial cycles (Fig. 3a). Generally, δ18O G. ruber values are higher/heavier during glacial periods (MIS 2, 4, 6, 8, 10 and 12) and lower/lighter during interglacial stages. The highest δ18O G. ruber value (−0.93‰) is observed at ∼433.4 kyr (MIS 12), while the lowest δ18O G. ruber value (∼−3.18‰) is found at the top of the core.
Planktonic foraminiferal proxy records of Site U1486. (a) G. ruber δ18O, (b) G. ruber Mg/Ca-based SST, (c) the ice volume corrected-seawater δ18O (δ18Osw-ivc) and (d) C. wuellerstorfi δ18O (black), superimposed is the global ice volume δ18Osw (blue; Bintanja et al. Reference Bintanja, van de Wal and Oerlemans2005). Gray vertical shadings indicate even-numbered marine isotope stages (MIS), while colored shadings for individual records represent their respective error ranges (see Sections 2.2 and 2.3). (e) Spectral (left) and wavelet transform (right) analyses of the δ18Osw-ivc record of Site U1486. The green line indicates the precession cycle.
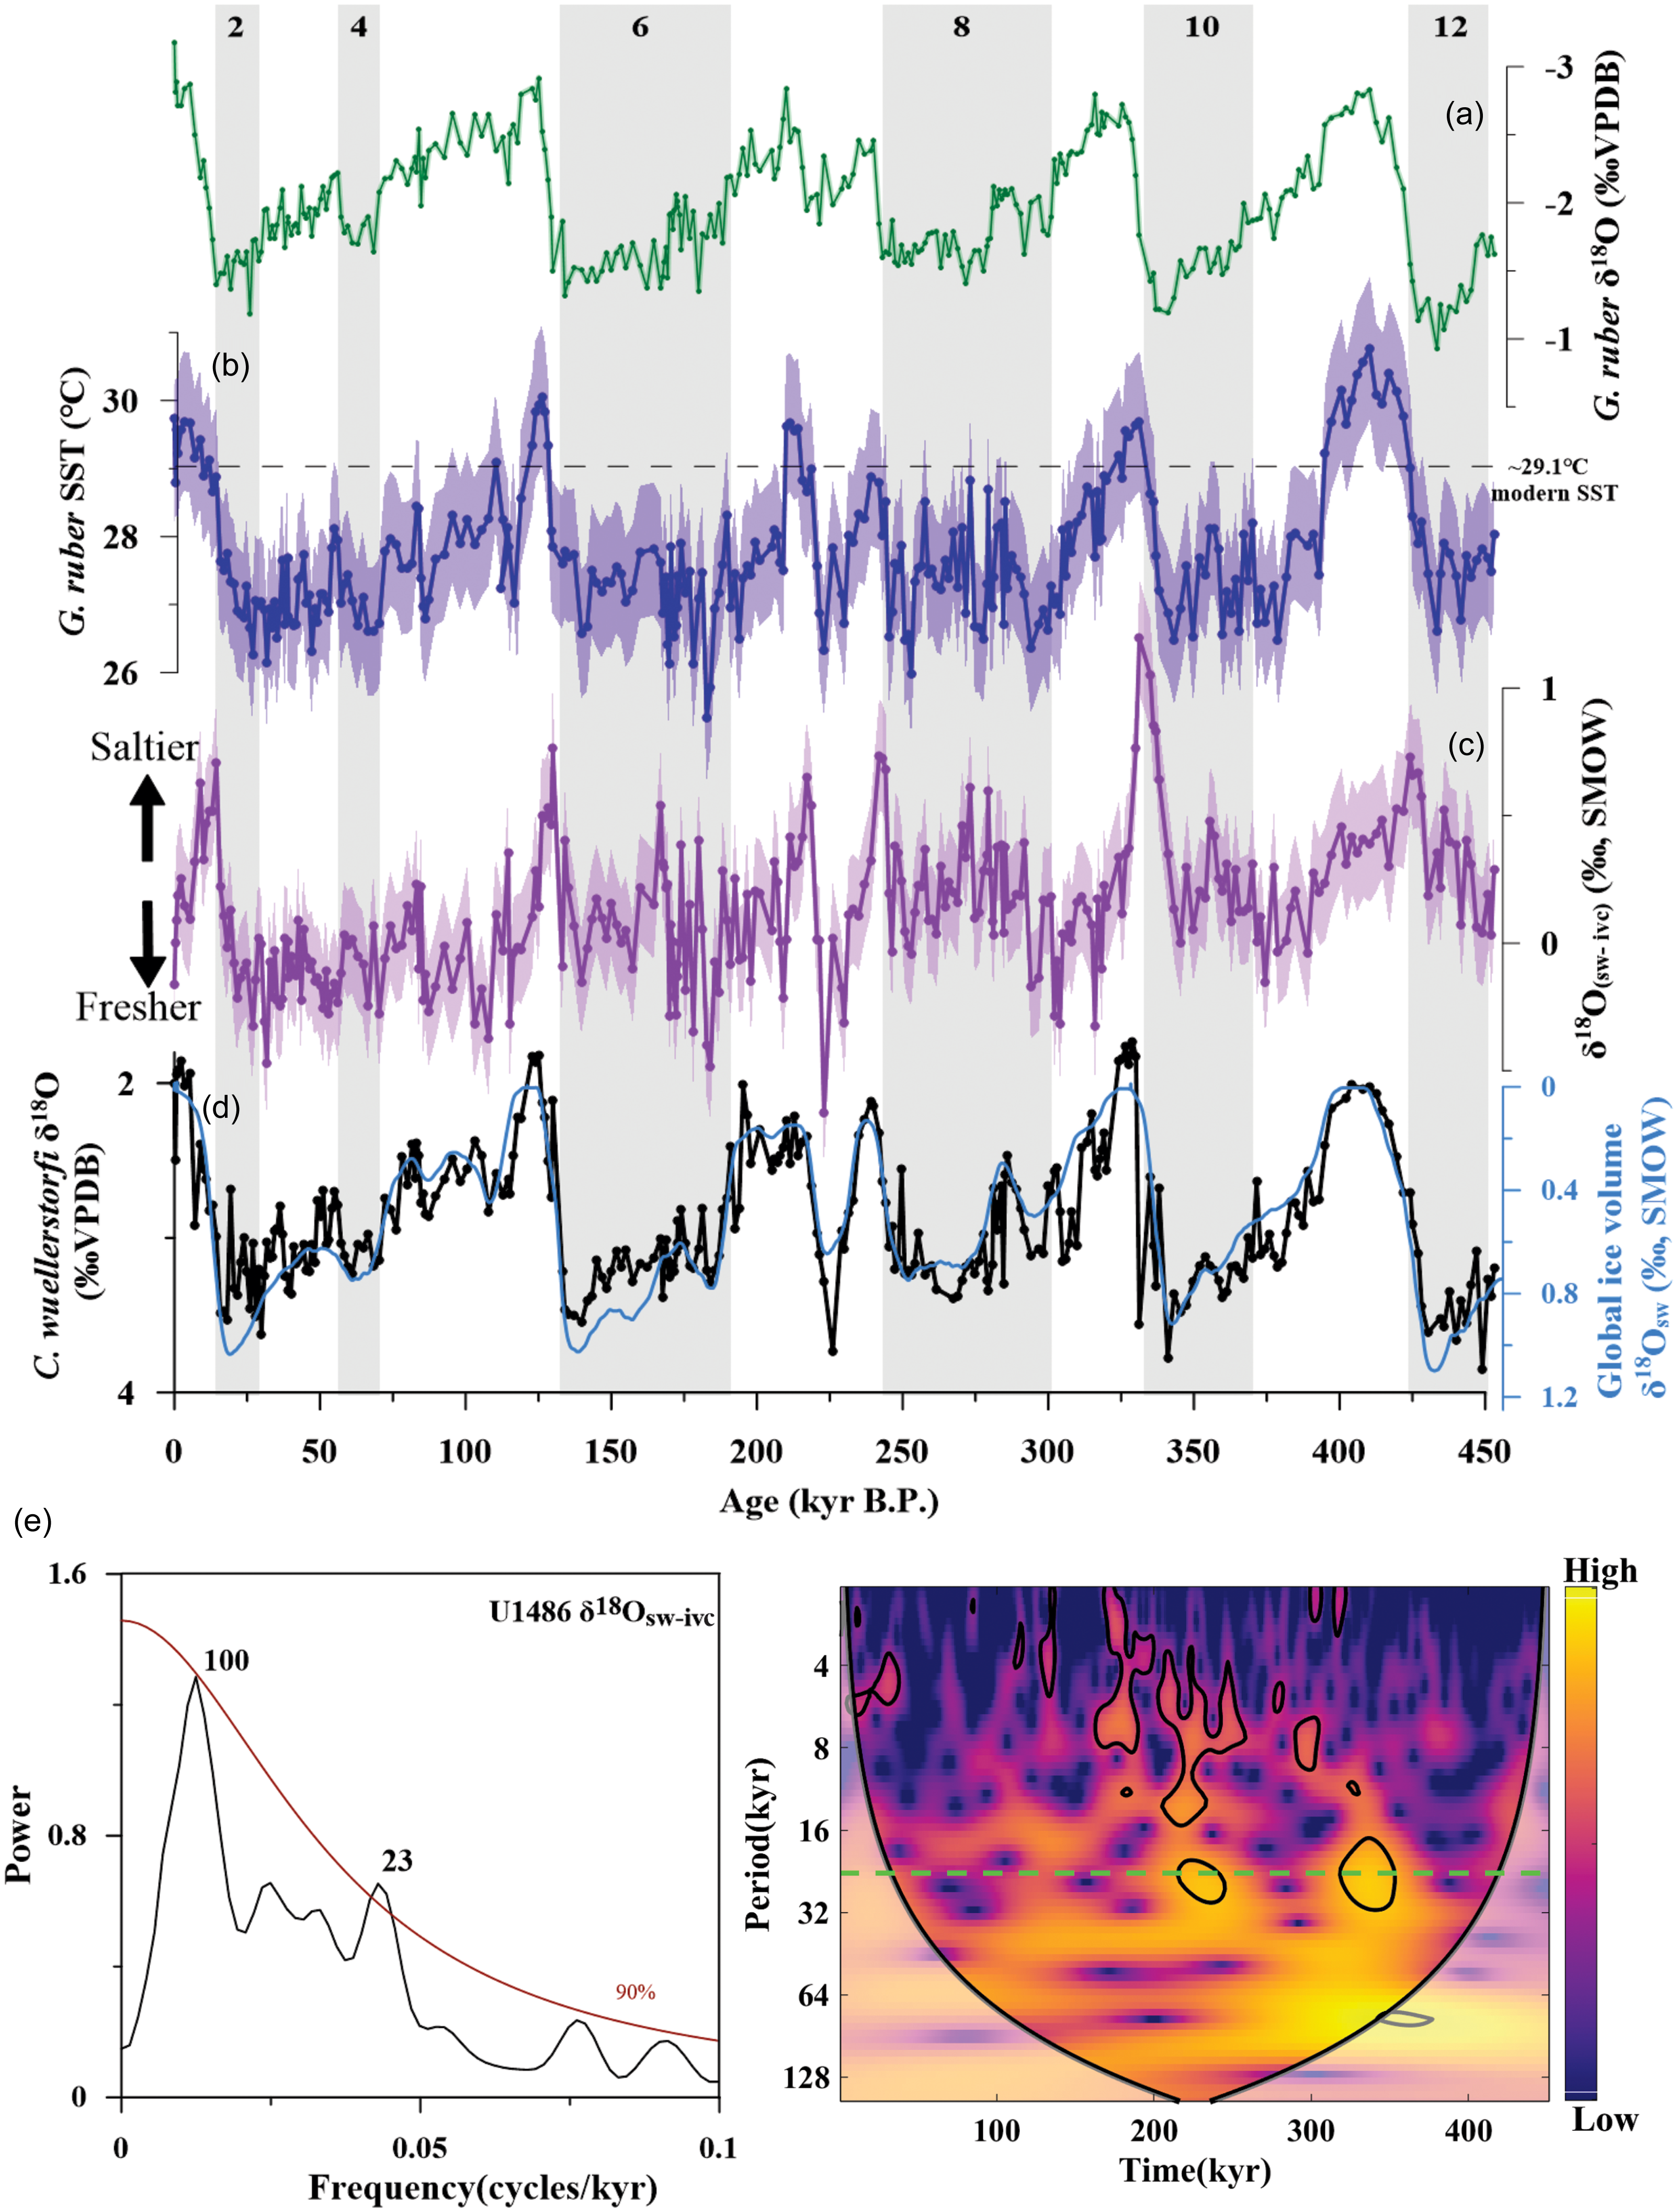
G. ruber Mg/Ca varies from 3.22 to 5.24 mmol/mol, which yields sea-surface temperature (SSTMg/Ca) at Site U1486 spanning a range of 25.3 to 30.8 °C, with an average of approximately 27.7 °C. As shown in Figure 3b, the SSTMg/Ca record shows pronounced glacial-interglacial variations over the past 450 kyr, with higher temperatures occurring during interglacial stages and lower temperatures during peak glacial stages.
Modern seawater δ18O and SSS display a positive correlation, with higher δ18Osw-ivc values corresponding to increased salinity in surface seawater, while lower δ18Osw-ivc values indicate fresher seawater (Fairbanks et al. Reference Fairbanks, Evans, Rubenstone, Mortlock, Broad, Moore and Charles1997; Rosenthal et al. Reference Rosenthal, Oppo and Linsley2003; Stott et al. Reference Stott, Cannariato, Thunell, Haug, Koutavas and Lund2004; Gibbons et al. Reference Gibbons, Oppo, Mohtadi, Rosenthal, Cheng, Liu and Linsley2014). Model simulations also support the assumption that the tropical Pacific has maintained a consistent relationship between δ18Osw-ivc and SSS (Holloway et al. Reference Holloway, Sime, Singarayer, Tindall and Valdes2016). In comparison with δ18O G. ruber and SSTMg/Ca, δ18Osw-ivc does not exhibit obvious glacial-interglacial cycles, ranging from −0.66‰ to 1.20‰ (Fig. 3c). However, during MIS 2, MIS 6, MIS 10 and MIS 12, δ18Osw-ivc is relatively lower compared to the interglacial stages, with the highest value observed near the MIS 10/9 transition (Fig. 3c). During deglacial episodes of rapid SSTMg/Ca warming (e.g., MIS 12/11, MIS 10/9, MIS 6/5 and MIS 2/1), sea-surface δ18Osw-ivc values simultaneously increase, implying a change to more saline conditions at sea surface (Fig. 3b, c).
4. Discussion
4.a. Using site U1486 δ18Osw-ivc as a proxy to reconstruct local precipitation variability over the past 450 kyr
δ18Osw serves as a common proxy for SSS, which is a crucial parameter in the hydrological cycle (Stott et al. Reference Stott, Cannariato, Thunell, Haug, Koutavas and Lund2004; Leech et al. Reference Leech, Lynch-Stieglitz and Zhang2013). Although δ18Osw is influenced by multiple factors, including precipitation, evaporation, upwelling and meridional and zonal currents (Conroy et al. Reference Conroy, Thompson, Cobb, Noone, Rea and LeGrande2017), the existence of a linear correlation between δ18Osw and SSS is due to both being primarily influenced by evaporation and precipitation (Fairbanks et al. Reference Fairbanks, Evans, Rubenstone, Mortlock, Broad, Moore and Charles1997; LeGrande & Schmidt, Reference LeGrande and Schmidt2006). Thus, the δ18Osw variability is often interpreted in the context of hydroclimate variability (Fairbanks et al. Reference Fairbanks, Evans, Rubenstone, Mortlock, Broad, Moore and Charles1997; LeGrande & Schmidt, Reference LeGrande and Schmidt2006). Additionally, Conroy et al. (Reference Conroy, Thompson, Cobb, Noone, Rea and LeGrande2017) found that the δ18Osw-salinity linear relationship appears stronger in the western tropical Pacific based on both observational data and results from isotope-enabled climate model simulations. Therefore, δ18Osw primarily reflects changes in the precipitation-evaporation balance. Given the minimal fluctuations in modern SST in the western Pacific (Kim et al. Reference Kim, Yu and Lu2012), δ18Osw likely reflects local precipitation patterns (Gibbons et al. Reference Gibbons, Oppo, Mohtadi, Rosenthal, Cheng, Liu and Linsley2014). Recent studies by Yang et al. (Reference Yang, Zhou, Yan, Ma, Cheng, Hu, Shen, Zhao, Hou, Lu and Liu2024) analyzing modern reanalysis data in the South China Sea revealed an inverse correlation between regional SSS and precipitation rate. Additionally, Conroy et al. (Reference Conroy, Thompson, Cobb, Noone, Rea and LeGrande2017) identified a weak relationship between SST and SSS in the western Pacific based on modern data.
For the reconstruction of past local precipitation changes in the western Pacific, we consider the ice-volume corrected δ18Osw-ivc record from Site U1486. Positive deviations in δ18Osw-ivc values indicating more saline conditions at sea surface, suggest reduced local precipitation in the western Pacific, while negative values point to intensified local precipitation (Rosenthal et al. Reference Rosenthal, Oppo and Linsley2003; Stott et al. Reference Stott, Cannariato, Thunell, Haug, Koutavas and Lund2004). The Site U1486 δ18Osw-ivc record displays relatively muted glacial-interglacial cycles over the past 450 kyr, which fluctuate between −0.66 ‰ and 1.20 ‰ and differ substantially from the SSTMg/Ca pattern (Fig. 3c). Moreover, the variation in Site U1486 δ18Osw-ivc is similar to the change in the ln(Ti/Ca) record obtained from the adjacent core MD05-2920 (Fig. 4i; Tachikawa et al. Reference Tachikawa, Cartapanis, Vidal, Beaufort, Barlyaeva and Bard2011, Reference Tachikawa, Timmermann, Vidal, Sonzogni and Timm2014). The ln(Ti/Ca) values were utilized as an indicator of rainfall over the drainage basin of the Sepik River in New Guinea (Tachikawa et al. Reference Tachikawa, Cartapanis, Vidal, Beaufort, Barlyaeva and Bard2011, Reference Tachikawa, Timmermann, Vidal, Sonzogni and Timm2014). Cross-spectral analysis reveals a significant coherence between Site U1486 δ18Osw-ivc and ln(Ti/Ca) from core MD05-2920 on the precession band (Fig. S3), supporting the dominance of precession cycles in controlling precipitation variations in the study area.
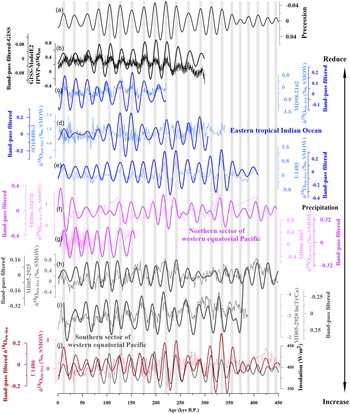
The orbital-scale precipitation pattern in the Indo-Pacific Warm Pool over the past 450 kyr. (a) The variation in precession (Laskar et al. Reference Laskar, Robutel, Joutel, Gastineau, Correia and Levrard2004). (b) GISS_ModelE2-R simulated δ18Osw-ivc records of the IPWP (Jian et al. Reference Jian, Wang, Dang, Mohtadi, Rosenthal, Lea, Liu, Jin, Ye, Kuhnt and Wang2022). (c, d, e) The δ18Osw-ivc records of cores MD98-2162, SO18480-3 and U1483 in the eastern tropical Indian Ocean (Jian et al. Reference Jian, Wang, Dang, Mohtadi, Rosenthal, Lea, Liu, Jin, Ye, Kuhnt and Wang2022; Zhang et al. Reference Zhang, Xu, Holbourn, Kuhnt, Xiong and Li2022). (f, g) The δ18Osw-ivc records of cores MD06-3047B and MD06-3067 in the northern sector of western equatorial Pacific (Bolliet et al. Bolliet et al., Reference Bolliet, Holbourn, Kuhnt, Laj, Kissel, Beaufort, Kienast, Andersen and Garbe-Schönberg2011; Jia et al. Jia et al., Reference Jia, Li, Xiong, Steinke, Jiang, Chang and Qin2018). (h) The δ18Osw-ivc records of core MD05-2925 (Lo et al. Reference Lo, Shen, Zeeden, Tsai, Yin, Yang, Chang, Su, Mii, Chuang and Chen2022). (i) The ln(Ti/Ca) record of core MD05-2920 (Tachikawa et al. Reference Tachikawa, Timmermann, Vidal, Sonzogni and Timm2014). (j) The δ18Osw-ivc record of Site U1486, superimposed by the July–August insolation at the equator (black) (Laskar et al. Reference Laskar, Robutel, Joutel, Gastineau, Correia and Levrard2004). The overlain, bold, dark-colored lines represent the precession band-pass filtered results. Band-pass filter with a central frequency of 0.043 kyr−1 and a bandwidth of 0.01 kyr−1. Vertical grey bars indicate lower precession values.

To study the underlying mechanisms driving local precipitation changes in the western Pacific over the past 450 kyr, we employed redfit spectral and wavelet analysis using the Past3 software with a Hanning window (Hammer et al. Reference Hammer, Harper and Ryan2001). The spectral analysis reveals that the Site U1486 δ18Osw-ivc record is characterized by prominent 100 kyr eccentricity and 23 kyr precession cycles. Wavelet analyses further shows that the 23 kyr cycle is most prominent during ∼260−180 and ∼370−300 ka BP (Fig. 3e). The phase difference between the maximum in δ18Osw-ivc and the maximum in precession is ∼−148° (Fig. 5h). On the precession band, the Site U1486 δ18Osw-ivc record displays precession band-pass filtered patterns that are mostly in phase with a few exceptions, such as δ18Osw-ivc changes preceding precession shifts during the periods of ∼175−145 and ∼110−75 ka BP (Fig. 4j). The discrepancies between the δ18Osw-ivc and precession may be attributed to terrestrial influences (Hollstein et al. Reference Hollstein, Mohtadi, Kienast, Rosenthal, Groeneveld, Oppo, Southon and Lückge2020), or due to a relatively weakened 23 kyr cycle during these specific time intervals (Fig. 3e). Nonetheless, the δ18Osw-ivc record exhibits an overall consistency with precession variations over the past 450 kyr, where almost every low precession value corresponds to high δ18Osw-ivc values (Fig. 4j). We conclude that the past local precipitation variations at Site U1486 were associated with precessional changes.
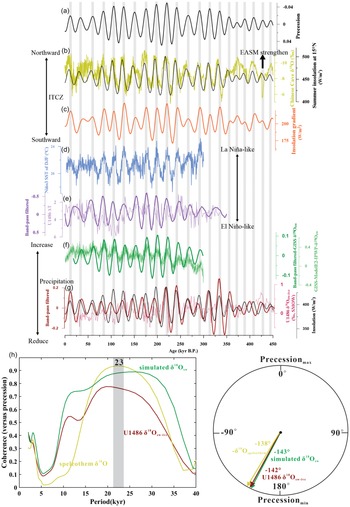
Comparing the precipitation records in the IPWP and East Asia with the ENSO-like proxy and the migration of the ITCZ. (a) The variation in precession (Laskar et al. Reference Laskar, Robutel, Joutel, Gastineau, Correia and Levrard2004). (b) The speleothem δ18O records in China (Cheng et al. Reference Cheng, Edwards, Sinha, Spotl, Yi, Chen, Kelly, Kathayat, Wang, Li, Kong, Wang, Ning and Zhang2016), superimposed on the summer insolation at 15°N (Laskar et al. Reference Laskar, Robutel, Joutel, Gastineau, Correia and Levrard2004). (c) The summer interhemispheric tropical insolation gradient, determined by the variation in June insolation between 23° N and 23° S (Laskar et al. Reference Laskar, Robutel, Joutel, Gastineau, Correia and Levrard2004). (d) CESM-simulated Niño3 SST of DJF (Zhang et al. Reference Zhang, Yu, Gong, Wang, Chang, Lohmman, Qi and Li2021). (e) Differences between SST and thermocline water temperature (ΔT) for Site U1486. (f) GISS_ModelE2-R simulated δ18Osw-ivc records of the IPWP (Jian et al. Reference Jian, Wang, Dang, Mohtadi, Rosenthal, Lea, Liu, Jin, Ye, Kuhnt and Wang2022). (g) The δ18Osw-ivc records of Site U1486 superimposed by the July–August insolation at the equator (black) (Laskar et al. Reference Laskar, Robutel, Joutel, Gastineau, Correia and Levrard2004). The records are overlaid by the precession band-pass filtered output (bold, dark-colored lines). Band-pass filter with a central frequency of 0.043 kyr−1 and a bandwidth of 0.01 kyr−1. Vertical grey bars indicate lower precession values (high Northern Hemisphere summer insolation). (h) Phase relationships among U1486 δ18Osw-ivc, simulated IPWP δ18Osw-ivc, speleothem δ18O and the precession parameter, illustrated through coherences (left) and phase angles (right).

It is noteworthy that, although Site U1486 δ18Osw-ivc record and the ln(Ti/Ca) record from adjacent core MD05-2920 exhibit nearly coherent variation on the precession band (Fig. 4i, j), the ln(Ti/Ca) record is characterized by not only precession but also obliquity signals (Tachikawa et al. Reference Tachikawa, Timmermann, Vidal, Sonzogni and Timm2014). The coarse terrigenous fraction represented by Ti varied with the precession cycle, while CaCO3 exhibited a pronounced obliquity band (Tachikawa et al. Reference Tachikawa, Cartapanis, Vidal, Beaufort, Barlyaeva and Bard2011). Additionally, precipitation records based on ln(K/Ca) at Site U1483 (offshore north-western Australia) contain an additional obliquity component (Zhang et al. Reference Zhang, Xu, Holbourn, Kuhnt, Beil, Li, Xiong, Dang, Yan, Pei, Ran and Wu2020). The orbital forcing of elemental ratios is evidently different from the predominant precession control observed in the δ18Osw-ivc records of Site U1486. This discrepancy in dominant cyclicity may suggest that different precipitation proxies respond differently to climatic forcing. The SSS proxy (δ18Osw-ivc), primarily controlled by the precipitation-evaporation balance (Conroy et al. Reference Conroy, Thompson, Cobb, Noone, Rea and LeGrande2017), tends to exhibit stronger precession-driven variability due to its direct linkage with monsoon dynamics and seasonal changes in precipitation (Stott et al. Reference Stott, Cannariato, Thunell, Haug, Koutavas and Lund2004).
Orbital precession is triggered by the Earth’s rotational axis oscillation, leading to a continuous change in the relative positioning of the Earth and the Sun (Berger & Loutre, Reference Berger, Loutre, Duplessy and Spyridakis1994). This alteration modifies the seasonal and meridional distribution of solar radiation across the Earth’s surface with a 23 kyr periodicity (Berger & Loutre, Reference Berger, Loutre, Duplessy and Spyridakis1994; Merlis et al. Reference Merlis, Schneider, Bordoni and Eisenman2013). The equatorial insolation variation is primarily influenced by precession changes on orbital timescales, with an increased summer solar insolation in the equatorial region during low precession periods (Yin et al. Reference Yin, Wu, Berger, Goosse and Hodell2021). Our δ18Osw-ivc record reveals a similar pattern with July–August insolation changes at the equator over the past 450 kyr. The elevated insolation levels corresponded to increased δ18Osw-ivc values, implying reduced local precipitation in Papua New Guinea, and vice versa (Fig. 4j). The core MD05-2920 ln(Ti/Ca) also exhibits significant coherence with insolation at precessional periodicities, consistent with our δ18Osw-ivc record of Site U1486 (Fig. 4i, j). Additionally, modeled precipitation results further support the simultaneous changes in precipitation and local summer insolation in the western Pacific (Kutzbach et al. Reference Kutzbach, Liu, Liu and Chen2008). These findings suggest that variations in local precipitation in the Papua New Guinea region were likely driven by the equatorial insolation changes in line with precessional variations. The precession signal might have influenced the local precipitation patterns through northern and southern hemispheric thermal gradients (Braconnot et al. Reference Braconnot, Marzin, Gregoire, Mosquet and Marti2008) or the temperature contrast between land and sea surfaces (Ruddiman, Reference Ruddiman2008; Merlis et al. Reference Merlis, Schneider, Bordoni and Eisenman2013).
4.b. Precession-driven synchronous precipitation changes in the IPWP over the past 450 kyr
The IPWP as Earth’s largest reservoir of atmospheric water vapor experiences the highest rainfall levels (Cane, Reference Cane1998; Leung et al. Reference Leung, Zhang, Gan, Wang, Qian and Hu2022). Modern mean rainfall data show a central region for rainfall within the IPWP (Fig. 1c). To investigate precipitation variations on orbital timescales across the entire IPWP region, we compared precipitation records from different areas within its central precipitation zone (Fig. 1a). These areas encompass the northern IPWP (cores MD06-3047B and MD06-3067; Bolliet et al. Bolliet et al., Reference Bolliet, Holbourn, Kuhnt, Laj, Kissel, Beaufort, Kienast, Andersen and Garbe-Schönberg2011; Jia et al. Jia et al., Reference Jia, Li, Xiong, Steinke, Jiang, Chang and Qin2018), the southern sector of the IPWP (cores U1486 and MD05-2925; this study and Lo et al. Reference Lo, Shen, Zeeden, Tsai, Yin, Yang, Chang, Su, Mii, Chuang and Chen2022) and the Indian Ocean (cores MD98-2162, SO18480-3 and U1483; Jian et al. Reference Jian, Wang, Dang, Mohtadi, Rosenthal, Lea, Liu, Jin, Ye, Kuhnt and Wang2022; Zhang et al. Reference Zhang, Xu, Holbourn, Kuhnt, Xiong and Li2022). We distinguish the northern and southern divisions of the IPWP based on the equator. Detailed information about the original datasets for these cores is provided in Table S2. Conroy et al. (Reference Conroy, Thompson, Cobb, Noone, Rea and LeGrande2017) identified a linear relationship between δ18Osw and SSS in various IPWP areas across multiple sites. δ18Osw-ivc likely serves as a reliable proxy to reflect past local precipitation variations due to the limited variability of SST in the IPWP (Gibbons et al. Reference Gibbons, Oppo, Mohtadi, Rosenthal, Cheng, Liu and Linsley2014). All δ18Osw-ivc records are similarly based on G. ruber Mg/Ca and δ18O and are considered to reliably reflect local precipitation through time.
All δ18Osw-ivc records from various regions of the western tropical Pacific across the equator suggest overall synchronous precipitation patterns on orbital timescales. The δ18Osw-ivc record of core MD05-2925 (Lo et al. Reference Lo, Shen, Zeeden, Tsai, Yin, Yang, Chang, Su, Mii, Chuang and Chen2022), situated in the southern region of the western equatorial Pacific, shows a fundamental synchrony with variations in boreal summer insolation at the equator driven by precession over the past 450 kyr (Fig. 4h). Similarly, the precipitation record of core MD06-3047B (Jia et al. Jia et al., Reference Jia, Li, Xiong, Steinke, Jiang, Chang and Qin2018), located in the northernmost part of the WPWP, is consistently related to precession variations over the past 450 kyr, except during the ∼410-370 ka BP period (Fig. 4f) (likely due to missing original data in the core MD06-3047B δ18Osw-ivc record during this specific period). Furthermore, the filtered 23-kyr component of the δ18Osw-ivc record from core MD06-3067 in the northern IPWP also demonstrates synchronous changes with precession variations over the past ∼160 kyr, where each peak in SSS corresponds to both a low in precession and a peak in equatorial insolation during boreal summer (Fig. 4g; Bolliet et al. Bolliet et al., Reference Bolliet, Holbourn, Kuhnt, Laj, Kissel, Beaufort, Kienast, Andersen and Garbe-Schönberg2011).
In contrast, the δ18Osw-ivc record from the central IPWP core KX97322-4 exhibits limited coherence with precession variability over the past 360 kyr (Zhang et al. Reference Zhang, Yu, Gong, Wang, Chang, Lohmman, Qi and Li2021). This lack of coherence might be attributed to an ENSO-like state or potentially to the fact that δ18Osw-ivc is influenced by both precession and obliquity (Zhang et al. Reference Zhang, Li, Chang, Yu and Wang2015, Reference Zhang, Yu, Gong, Wang, Chang, Lohmman, Qi and Li2021). Obliquity may affect the atmospheric circulation and the associated meridional heat and moisture fluxes by regulating the latitudinal distribution of insolation (Mantsis et al. Reference Mantsis, Clement, Broccoli and Erb2011, Reference Mantsis, Lintner, Broccoli, Erb, Clement and Park2014; Bosmans et al. Reference Bosmans, Drijfhout, Tuenter, Hilgen, Lourens and Rohling2015). This might explain why obliquity bands are present in the δ18Osw-ivc record of core KX97322-4, as obliquity could affect local precipitation through atmospheric circulation and heat and moisture fluxes. Additionally, variations in the δ18Osw-ivc signals may be due in part to differences in core locations capturing divergent information. Moreover, Liu et al. (Reference Liu, Lo, Shi, Wei, Chou, Chen, Chuang, Wu, Mii, Peng, Amakawa, Burr, Lee, DeLong, Elderfield and Shen2015) proposed that precipitation variations in the western Pacific are more affected by obliquity than by precession-paced changes in the ITCZ, based on foraminiferal rare earth elements (indicator of precipitation-dependent river runoff). This change in dominant cyclicity could be attributed to differences in proxy-specific bias or tendency. In the eastern IPWP, the δ18Osw-ivc records from cores SO225-08 (unpublished data from Nürnberg) and ODP806 (Lea et al. Reference Lea, Pak and Spero2000), located in the eastern IPWP, did not exhibit synchronous changes with precession parameters but rather showed distinct glacial-interglacial cycles. This discrepancy might be attributed to the relatively low sample resolution in these records. Cores SO225-08 and ODP806, being situated close to the central equatorial Pacific, might experience more influence on their hydrological conditions by atmospheric circulation, such as the meridional Hadley circulation and the Walker circulation (Lea et al. Reference Lea, Pak and Spero2000). In conclusion, the variations in δ18Osw-ivc across various regions of the WPWP are not entirely identical, possibly due to regional differences, varying impact of driving factors, and/or sample resolution. However, with respect to precessional cyclicity, all precipitation records within the central precipitation zone across the WPWP generally show similar patterns (Fig. 4).
Notably, the pattern of precipitation changes in the western part of the IPWP (eastern tropical Indian Ocean) is similar to in the western tropical Pacific. The filtered 23-kyr component of the δ18Osw-ivc records from the southern part of the Makassar Strait (core MD98-2162) and Timor Sea (cores SO18480-3 and U1483) close to the equator demonstrate a nearly synchronous response to precession-driven boreal summer insolation variations (Fig. 4c–e; Jian et al. Reference Jian, Wang, Dang, Mohtadi, Rosenthal, Lea, Liu, Jin, Ye, Kuhnt and Wang2022; Zhang et al. Reference Zhang, Xu, Holbourn, Kuhnt, Xiong and Li2022). Higher insolation levels correspond to higher δ18Osw-ivc values, hence more saline sea-surface conditions, while lower insolation levels correspond to lowered δ18Osw-ivc values and fresher conditions (Fig. 4c–e). This covariance is consistent with the precipitation record of Site U1486. Overall, nearly all records are characterized by higher δ18Osw-ivc values (higher SSS; lower precipitation) at precession minima, implying that both the eastern tropical Indian Ocean and the western tropical Pacific within the IPWP experienced drier conditions simultaneously during lower precession periods (Fig. 4).
Consistently, the simulated annual mean δ18Osw-ivc derived from a water isotope (δ18Osw)-enabled air-sea coupled climate model (GISS_ModelE2-R; Jian et al. Reference Jian, Wang, Dang, Mohtadi, Rosenthal, Lea, Liu, Jin, Ye, Kuhnt and Wang2022) reveals a dominant 23-kyr cycle with higher δ18Osw-ivc values and hence, more saline conditions at sea surface during precession minima (Fig. 4b), supporting our notion on synchronous precession-driven precipitation changes in the IPWP. We conclude that the variations in equatorial insolation, driven by precession parameters, likely influence the SSS through precipitation variability within the IPWP region.
4.c. Effects of the ITCZ changes on the precipitation variations in IPWP
4.c.1. Variations in ITCZ latitudinal migration
The IPWP is a significant moisture source for the East Asian summer monsoon (EASM). Numerous studies demonstrated a strong association between EASM variability and the hydrological conditions as well as convective activity in the IPWP (e.g., Lau et al. Reference Lau, Kim and Yang2000; Lu, Reference Lu2001; Kawamura et al. Reference Kawamura, Matsuura and Iizuka2001; Yin et al. Reference Yin, Singh, Berger, Guo and Crucifix2014). The records of Chinese stalagmite δ18O, commonly used to reconstruct EASM variability, display distinct precession-related changes with intense precipitation during higher Northern Hemisphere summer insolation over the past 450 kyr (Fig. 5b; Cheng et al. Reference Cheng, Edwards, Sinha, Spotl, Yi, Chen, Kelly, Kathayat, Wang, Li, Kong, Wang, Ning and Zhang2016). The strong precession signal observed in Chinese speleothem records corresponding to insolation patterns is consistent with climate model simulations (e.g., Battisti et al. Reference Battisti, Ding and Roe2014; Rachmayani et al. Reference Rachmayani, Prange and Schulz2016). The Site U1486 δ18Osw-ivc variations generally show a pronounced anti-phased relationship with Chinese stalagmite δ18O on precessional timescales (Fig. 5b, f). This observation is further corroborated by the coherence analysis (Fig. 5h) and by most of the precipitation records within the IPWP region (Fig. 4). When δ18Osw-ivc values increase (lower precipitation) in the IPWP, the δ18O values in Chinese speleothems decrease (higher precipitation). Conversely, periods of high precipitation in the IPWP correspond to a weakening of the EASM. Additionally, the simulated δ18Osw-ivc of the IPWP and measured δ18O values in Chinese speleothems are anti-correlated on precessional timescales (Fig. 5b, e; Jian et al. Reference Jian, Wang, Dang, Mohtadi, Rosenthal, Lea, Liu, Jin, Ye, Kuhnt and Wang2022), which is further confirmed by cross-spectral analysis (Fig. 5h).
The anti-phased relationship between δ18Osw-ivc of the IPWP and Chinese speleothem δ18O is associated with the ocean heat content of the IPWP (Jian et al. Reference Jian, Wang, Dang, Mohtadi, Rosenthal, Lea, Liu, Jin, Ye, Kuhnt and Wang2022). During low precession phases (high Northern Hemisphere summer insolation), La Niña-like conditions prevail in the western tropical Pacific. This is indicated by both the CESM-simulated Niño3 SST of December–January–February (DJF) (Zhang et al. Reference Zhang, Yu, Gong, Wang, Chang, Lohmman, Qi and Li2021), and the temperature gradient between sea surface and thermocline waters (ΔT). A deep thermocline at Site U1486 deduced from a small ΔT (unpublished data) implies enhanced ocean heat storage in the mixed layer (Fig. 5d, e). This higher ocean heat content likely amplifies the strength of the EASM, enhancing moisture transport from ocean to continent and resulting in a negative deviation in Chinese speleothem δ18O values (Jian et al. Reference Jian, Wang, Dang, Mohtadi, Rosenthal, Lea, Liu, Jin, Ye, Kuhnt and Wang2022). The precipitation changes in the IPWP and EASM regions exhibit a strong coherence to local insolation changes. Therefore, their precipitation changes may be attributed to the redistribution of heat between the Northern and Southern Hemispheres triggered/amplified by precessional forcing, a conclusion which is consistent with model simulations (Braconnot et al. Reference Braconnot, Marzin, Gregoire, Mosquet and Marti2008; Battisti et al. Reference Battisti, Ding and Roe2014).
The IPWP, located within the belt of the modern ITCZ’s seasonal migration (Fig. 1a), experiences precipitation primarily regulated by the seasonal latitudinal movement of the ITCZ (Trenberth et al. Reference Trenberth, Stepaniak and Caron2000; Schmidt & Spero, Reference Schmidt and Spero2011; Schneider et al. Reference Schneider, Bischoff and Haug2014; Jo et al. Reference Jo, Woo, Yi, Yang, Lim, Wang, Cheng and Edwards2014). During periods of elevated summer insolation in the Northern Hemisphere, the ITCZ migrates northward (e.g., McGee et al. Reference McGee, Donohoe, Marshall and Ferreira2014), lowering precipitation in IPWP (Schmidt & Spero, Reference Schmidt and Spero2011; Jo et al. Reference Jo, Woo, Yi, Yang, Lim, Wang, Cheng and Edwards2014). This low in IPWP precipitation is supported by the high values of δ18Osw-ivc records from the IPWP region during the lower precession periods, which correspond to the high summer insolation in the Northern Hemisphere (Fig. 4). Seasonal variations in the thermal contrast between the Northern and Southern Hemispheres prompted the migration of the ITCZ, shifting toward the warmer hemisphere (Schneider et al. Reference Schneider, Bischoff and Haug2014). During the boreal summer, increasing insolation warms the subtropical water, strengthening the meridional pressure gradient and enhancing the southerlies flowing across the equator into the ITCZ, leading the ITCZ to move northward (Chang & Philander, Reference Chang and Philander1994; Geen et al. Reference Geen, Bordoni, Battisti and Hui2020). Therefore, the migration of the mean position of the ITCZ could be indicated by the disparity in summer insolation between hemispheres (Chiang & Friedman Reference Chiang and Friedman2012; Lu et al. Reference Lu, Yi, Liu, Mason, Jiang, Cheng, Stevens, Xu, Zhang, Jin, Zhang, Guo, Wang and Otto-Bliesner2013; Schneider et al. Reference Schneider, Bischoff and Haug2014). We calculated the summer interhemispheric insolation gradient between 23° N and 23° S (Fig. 5c; Laskar et al. Reference Laskar, Robutel, Joutel, Gastineau, Correia and Levrard2004). A higher summer interhemispheric gradient during the precessional minima points to the northward migration of the ITCZ and reduced precipitation in the IPWP (Fig. 5f, g). Conversely, a decreased meridional summer interhemispheric insolation gradient results in the southward shift of the ITCZ, causing increased precipitation in the IPWP (Fig. 5c, f, g). During periods of Northern Hemisphere warming, such as the Bølling–Allerød and the early Holocene epochs characterized by a strong EASM, the ITCZ shifted northward (Wang et al. Reference Wang, Cheng, Edwards, An, Wu, Shen and Dorale2001; Yancheva et al. Reference Yancheva, Nowaczyk, Mingram, Dulski, Schettler, Negendank, Liu, Sigman, Peterson and Haug2007). Recent research further suggests that the location and migrations of the ITCZ, where the trade winds of the Northern and Southern Hemispheres converge, are closely associated with variations in regional monsoon patterns (Gadgil, Reference Gadgil2018, and references therein). Hence, the strength of the EASM is closely linked to the migrations of the ITCZ (e.g., Ding et al. Reference Ding, Liu, Rutter, Yu, Guo and Zhu1995; An, Reference An2000; Yancheva et al. Reference Yancheva, Nowaczyk, Mingram, Dulski, Schettler, Negendank, Liu, Sigman, Peterson and Haug2007). Chinese stalagmite δ18O records revealed that the intensification of the EASM during the precessional minima, accompanied by the northward migration of the ITCZ, resulting in high precipitation in the EASM region (Fig. 5b, c; Cheng et al. Reference Cheng, Edwards, Sinha, Spotl, Yi, Chen, Kelly, Kathayat, Wang, Li, Kong, Wang, Ning and Zhang2016). These findings emphasize the significant impact of ITCZ variations on hydrological changes within the IPWP and EASM regions. Orbital precession played a pivotal role in determining the seasonal distribution of incoming insolation in both hemispheres. This drives the north-south migration of the ITCZ and causes the subtropical high-pressure anomalies in the Indian and Pacific Oceans (Merlis et al. Reference Merlis, Schneider, Bordoni and Eisenman2013; Schneider et al. Reference Schneider, Bischoff and Haug2014), leading to anti-correlated changes in precipitation between the IPWP and EASM region.
The mechanisms described above, supported by other paleoclimatic and modeling studies spanning millennial to orbital timescales (e.g., Wang et al. Reference Wang, Auler, Edwards, Cheng, Ito and Solheid2006; Merlis et al. Reference Merlis, Schneider, Bordoni and Eisenman2013; Dang et al. Reference Dang, Jian, Kissel and Bassinot2015; Huang et al. Reference Huang, Wan, Li and Li2019), provide a robust explanation for the interhemispheric anti-phased precipitation pattern between the IPWP and EASM region. Nevertheless, precipitation records in the northern equatorial region of the IPWP (e.g., cores MD06-3047B and MD06-3067; Bolliet et al. Bolliet et al., Reference Bolliet, Holbourn, Kuhnt, Laj, Kissel, Beaufort, Kienast, Andersen and Garbe-Schönberg2011; Jia et al. Jia et al., Reference Jia, Li, Xiong, Steinke, Jiang, Chang and Qin2018) exhibit nearly synchronous interhemispheric changes with the southern IPWP region (Fig. 4). The migration of the ITCZ alone might not adequately account for the synchronous interhemispheric precipitation changes observed. Today, the ITCZ shifts between 9°N in boreal summer and 2°N in boreal winter across the modern Pacific Ocean (Schneider et al. Reference Schneider, Bischoff and Haug2014). We speculate that during periods of high precession when the ITCZ migrates southward, the ITCZ might still remain in the Northern Hemisphere, resulting in heightened precipitation over both the northern and southern IPWP regions. Besides, we propose that the synchronized interhemispheric precipitation changes in the northern and southern WPWP could be linked to the expansion and contraction of the ITCZ on the precession band (see below).
4.c.2. Variations in ITCZ expansion and contraction
Numerous studies have revealed the in-phase changes in precipitation between hemispheres over (sub-)millennial timescales, which can be effectively explained by the expansion and contraction of the ITCZ, specifically its width (e.g., Collins et al. Reference Collins, Schefuß, Heslop, Mulitza, Prange, Zabel, Tjallingii, Dokken, Huang, Mackensen, Schulz, Tian, Zarriess and Wefer2010; Konecky et al. Reference Konecky, Russell, Rodysill, Vuille, Bijaksana and Huang2013; Yan et al. Reference Yan, Wei, Soon, An, Zhou, Liu, Wang and Carter2015; Denniston et al. Reference Denniston, Ummenhofer, Wanamaker, Lachniet, Villarini, Asmerom, Polyak, Passaro, Cugley, Woods and Humphreys2016; Scroxton et al. Reference Scroxton, Burns, McGee, Hardt, Godfrey, Ranivoharimanana and Faina2017; Yang et al. Reference Yang, Zhang, Yi, Zhong, Lu, Wan, Du and Xiang2023). Yang et al. (Reference Yang, Zhang, Yi, Zhong, Lu, Wan, Du and Xiang2023) discovered that both the southern and northern margins of the ITCZ experienced simultaneously arid tropical Indian Ocean hydrological conditions during the early stage of the deglacial Heinrich Stadial 1 period, indicating a contracted tropical precipitation belt during that time. The precession bandpass filtered δ18Osw-ivc records of core MD06-3047B (located near the northern margin of the ITCZ), and Site U1483 and core MD05-2925 (located in the southern margin of the ITCZ) show reduced precipitation during most lower precession periods (Fig. 6b–d; Jia et al. Jia et al., Reference Jia, Li, Xiong, Steinke, Jiang, Chang and Qin2018; Zhang et al. Reference Zhang, Xu, Holbourn, Kuhnt, Xiong and Li2022; Lo et al. Reference Lo, Shen, Zeeden, Tsai, Yin, Yang, Chang, Su, Mii, Chuang and Chen2022), possibly indicating the contraction of the ITCZ in the IPWP region and vice versa. While the precipitation records in the northern and southern marginal ITCZ are not consistently in-phase during certain periods (e.g., 390–360 ka BP), this discrepancy may be attributed to regional influencing factors or stratigraphical issues. However, collectively, these records consistently demonstrate high coherence with precession variability, suggesting that the ITCZ contracts during lower precession periods and expands during higher precession periods. We hypothesize that the synchronization of precipitation in both northern and southern regions of the IPWP on the precession band may also be attributed to the expansion and contraction of the ITCZ. Coincident with the ascending branch of the Hadley circulation, the ITCZ is typically delineated as the convergence zone of the trade winds from the Northern and Southern Hemispheres, thus strongly impacted by regional tropical climate dynamics (Byrne & Schneider, Reference Byrne and Schneider2016; Geen et al. Reference Geen, Bordoni, Battisti and Hui2020). Studies suggest that on (sub)-millennial timescales, the ITCZ width may be linked to variations in the Walker circulation (Konecky et al. Reference Konecky, Russell, Rodysill, Vuille, Bijaksana and Huang2013) and meridional atmospheric circulation (Denniston et al. Reference Denniston, Ummenhofer, Wanamaker, Lachniet, Villarini, Asmerom, Polyak, Passaro, Cugley, Woods and Humphreys2016). Consequently, we propose that synchronous precipitation changes between the hemispheres on orbital timescales might be intricately tied to changes in regional atmospheric circulation, which could affect the expansion and contraction of the ITCZ.
Effects of the ITCZ migration and width on the precipitation variations in the IPWP on the precession band. A. The records of ITCZ migration and width variation: (a) The variation in precession (Laskar et al. Reference Laskar, Robutel, Joutel, Gastineau, Correia and Levrard2004). (b, c, d) Precession bandpass filtering curves of δ18Osw-ivc records in northern marginal ITCZ (core MD06-3047B; Jia et al. Jia et al., Reference Jia, Li, Xiong, Steinke, Jiang, Chang and Qin2018) and southern marginal ITCZ (core MD05-2925 and Site U1483; Lo et al. Reference Lo, Shen, Zeeden, Tsai, Yin, Yang, Chang, Su, Mii, Chuang and Chen2022; Zhang et al. Reference Zhang, Xu, Holbourn, Kuhnt, Xiong and Li2022). (e) Gradients of δ18Osw−ivc between Site U1486 and core MD06-3047B (Jia et al. Jia et al., Reference Jia, Li, Xiong, Steinke, Jiang, Chang and Qin2018). (f) Gradients of δ18Osw−ivc between Site U1486 and core MD05-2925 (Lo et al. Reference Lo, Shen, Zeeden, Tsai, Yin, Yang, Chang, Su, Mii, Chuang and Chen2022). (g) The summer interhemispheric tropical insolation gradient, determined by the variation in June insolation between 23° N and 23° S (Laskar et al. Reference Laskar, Robutel, Joutel, Gastineau, Correia and Levrard2004). Vertical grey bars indicate lower precession values. B. Schematic diagrams showing ITCZ variability during low-precession (left) and high-precession (right) intervals. The pink shaded band indicates the position and size of the ITCZ, referring to the belt of the modern ITCZ’s seasonal migration.

Yuan et al. (Reference Yuan, Chiang, Liu, Bijaksana, He, Jiang, Imran, Wicaksono and Wang2023) suggested that the larger (smaller) discrepancy in rainfall between the central and marginal regions of the ITCZ corresponds to a more contracted (expanded) ITCZ. In our study, we calculated the differences in δ18Osw-ivc (Δδ18Osw-ivc) among Site U1486 (central ITCZ), core MD06-3047B (near the northern marginal ITCZ) and core MD05-2925 (southern marginal ITCZ) to explore the variations in ITCZ contraction/expansion on orbital timescales (Fig. 6e, f). It should be noted that although δ18Osw-ivc may be influenced by various factors, we hypothesize that it primarily reflects changes in the precipitation-evaporation balance at the core sites in the IPWP, as discussed in Section 4.a. However, we acknowledge the presence of a leading or lagging relationship between Δδ18Osw-ivc and the expansion and contraction of the ITCZ on precession bands over the past 450 kyr (Fig. 6a, e, f), which does not exclude the possibility of δ18Osw-ivc being influenced by other factors or differences in core age models. We use this approach of Δδ18Osw-ivc to solely qualitatively describe the changes in ITCZ contraction and expansion during low-precession and high-precession intervals. Overall, the Δδ18Osw-ivc records between central and marginal ITCZ regions both increase during lower precession periods, while smaller precipitation differences (reduced Δδ18Osw-ivc) indicate an expanded ITCZ during higher precession periods (Fig. 6e, f).
Yan et al. (Reference Yan, Wei, Soon, An, Zhou, Liu, Wang and Carter2015) proposed that the ITCZ’s expansion and contraction correspond with symmetrical changes in insolation between hemispheres on sub-millennial timescales. Furthermore, recent modeling work by Singarayer et al. (Reference Singarayer, Valdes and Roberts2017) indicate that precessional changes in the ITCZ width may result from different responses of its northern and southern extremes to variations in the interhemispheric temperature gradient. Thus, we suggest that variations in interhemispheric insolation due to precession may influence the expansion and contraction of the ITCZ. These hemispheric insolation variations could affect the interactions between radiation and clouds and thus ITCZ width, as suggested by the climate models (Voigt & Shaw, Reference Voigt and Shaw2015; Lau & Kim, Reference Lau and Kim2015). The contracted and expanded positions of the ITCZ, as depicted in Figure 6B, were determined based on various precipitation records across different IPWP regions, providing a qualitative overview of the ITCZ positions. Some studies suggests that the ITCZ might be influenced by extratropical forcing, such as the North Hemisphere ice sheet and the Atlantic meridional overturning circulation (Kang et al. Reference Kang, Held, Frierson and Zhao2008). If so, variations in the low/high precession parameter under different climate conditions could lead to differing latitudinal shifts and sizes of the ITCZ. However, in our study we hypothesize that position and size of the ITCZ remain constant under all low (high) precession periods. Here, the position and size refer to the belt of the modern ITCZ’s seasonal migration (Fig. 1a). In summary, we suggest that the precessional hydroclimatic synchronicity changes in the IPWP might be driven by both the latitudinal migration of the ITCZ and the variations in its width over the past 450 kyr. The ITCZ migrated northward (southward) and contracted (expanded) during the periods of low (high) precession, as indicated by enriched (depleted) precipitation in the EASM region and in-phase depleted (enriched) precipitation in the entire IPWP region (Fig. 6B).
5. Conclusions
We utilized high-resolution δ18Osw-ivc records approximating SSS from Site U1486, retrieved from the Sepik River mouth in Papua New Guinea, to reconstruct precipitation changes within the IPWP over the past 450 kyr. The δ18Osw-ivc records display a dominant 23 kyr periodicity without a distinct glacial-interglacial trend. Our analysis focused on examining the spatial pattern of precipitation variations across the IPWP over orbital timescales, revealing a synchronous precipitation pattern on precession band. We assert that changes in ITCZ played a dominant role in determining the reconstructed precipitation patterns in the IPWP region on precession band. The anti-phased precipitation changes between the IPWP and the EASM region unveiled variations in the ITCZ migration, which was determined by the seasonal distribution of incoming insolation in both hemispheres on precession band. The synchronous precipitation changes between the two hemispheres within the IPWP emphasized the significant impact of the ITCZ’s expansion and contraction on precipitation variability within the IPWP over precession timescales. Our findings suggest that during low precession periods, the ITCZ migrated northward and contracted, leading to increased precipitation in the EASM region and synchronous reduction of precipitation within the various locations across the IPWP.
Supplementary material
To view supplementary material for this article, please visit https://doi.org/10.1017/S0016756824000177
Acknowledgments
We thank all members of IODP Expedition 363 for their efforts in gathering the fundamental information and samples essential for this study. This study was financially supported by Laoshan Laboratory (No. LSKJ202204201), the Strategic Priority Research Program of the Chinese Academy of Sciences (Grant No. XDB42000000), and the National Natural Science Foundation of China (Grant Nos. 42076051, 42076050 and 41876041). We thank David McGee and Jiangnan Shi for providing useful feedback that improved the manuscript.


 Open access