


Introduction
The most important social decisions an individual makes throughout their life, such as choosing a leader or a romantic partner, are often influenced by the ability to infer personality traits, motivations, or other qualities of others (Olivola, Eubanks et al., Reference Olivola, Eubanks and Lovelace2014). These inferences are frequently based on limited information, particularly facial appearance, which serves as a powerful cognitive bias and shapes the interpretation of social encounters (Olivola, Funk et al., Reference Olivola, Funk and Todorov2014; Zebrowitz, Reference Zebrowitz and Calder2011). Consequently, the same behavior can be perceived as assertive or distrustful depending on the accompanying facial features, potentially determining success or failure in various contexts (Hassin & Trope, Reference Hassin and Trope2000).
The face provides a rich source of information, revealing cues about ethnicity, gender, age, and even emotional state (Todorov et al., Reference Todorov, Olivola, Dotsch and Mende-Siedlecki2015). From these visual signals, individuals rapidly form social judgments about underlying characteristics such as personality, behavior, and cognitive abilities (Hall et al., Reference Hall, Goren, Chaiken, Todorov, Borgida, Sullivan and Federico2009; Montepare & Zebrowitz, Reference Montepare, Zebrowitz and Zanna1998; Olivola, Eubanks et al., Reference Olivola, Eubanks and Lovelace2014; Olivola & Todorov, Reference Olivola and Todorov2010). In this way, associations are established between certain facial traits and expected behaviors: For instance, attractive faces are generally perceived more positively and linked to socially desirable qualities, which translates into preferential treatment in domains such as personal relationships, the workplace, or the judicial system (Eagly et al., Reference Eagly, Ashmore, Makhijani and Longo1991; Gulati et al., Reference Gulati, Martínez-Garcia, Fernández, Lozano, Lepri and Oliver2024; Langlois et al., Reference Langlois, Kalakanis, Rubenstein, Larson, Hallam and Smoot2000; Zebrowitz & Collins, Reference Zebrowitz and Collins1997). Similarly, faces with features associated with aggressiveness or, conversely, with a childlike (babyface) appearance tend to be linked to dominant or submissive behaviors, respectively (Montepare & Zebrowitz, Reference Montepare, Zebrowitz and Zanna1998; Zebrowitz & Collins, Reference Zebrowitz and Collins1997).
Lenz and Lawson (Reference Lenz and Lawson2011) use the term “appearance effect” when referring to the tendency for people to infer strangers’ personality traits based on their facial features. There are several personality traits that can be inferred from a face: Oh et al. (Reference Oh, Dotsch, Porter and Todorov2020) show that people evaluate characteristics as diverse as aggression, attractiveness, tenderness, trustworthiness, dominance, emotional stability, intelligence, meanness, responsibility, and sociability, while Giacomin and Rule (Reference Giacomin and Rule2020) found evidence of evaluation of attractiveness, power, competence, dominance, warmth, and tenderness.
Numerous studies have shown that facial judgments occur extremely quickly and automatically (Bar et al., Reference Bar, Neta and Linz2006; Oosterhof & Todorov, Reference Oosterhof and Todorov2008; Pessoa et al., Reference Pessoa, Japee and Ungerleider2005; Todorov et al., Reference Todorov, Oh, Uddenberg and Albohn2025). Bar et al. (Reference Bar, Neta and Linz2006) found that a coherent first impression can be formed in as little as 39 milliseconds. This time may be further reduced when the face displays an emotional expression, facilitating even faster evaluations (Oosterhof & Todorov, Reference Oosterhof and Todorov2008). In particular, threatening facial expressions are processed rapidly and even unconsciously, suggesting an adaptive mechanism for detecting socially relevant danger cues (Pessoa et al., Reference Pessoa, Japee and Ungerleider2005). Moreover, judgments regarding traits such as competence, trustworthiness, or aggressiveness made after only 100 milliseconds strongly correlate with judgments made without time constraints (Willis & Todorov, Reference Willis and Todorov2006). The speed with which these nonverbal signals are processed leaves little room for cognitive control, encouraging the use of mental shortcuts or heuristics in social decision-making (Kahneman, Reference Kahneman2003).
Ward (Reference Ward2022) proposes several explanations for the persistence of face-based inferences, highlighting the role of self-fulfilling prophecies: Individuals with certain facial features are treated according to social expectations, thereby reinforcing specific behavioral patterns (Haselhuhn et al., Reference Haselhuhn, Wong and Ormiston2013; Thierry & Mondloch, Reference Thierry and Mondloch2021). For example, men with a higher facial width-to-height ratio (fWHR) are often perceived as more dominant or aggressive, which leads others to interact with them more defensively or selfishly; this treatment, in turn, reinforces the initial perceptions, creating a social feedback loop (Haselhuhn et al., Reference Haselhuhn, Wong and Ormiston2013). Moreover, inferences can also be shaped by momentary facial expressions, such as a smile, or by culturally shared stereotypes that lack objective validity (Jones & Kramer, Reference Jones and Kramer2021; Oosterhof & Todorov, Reference Oosterhof and Todorov2009; Todorov et al., Reference Todorov, Oh, Uddenberg and Albohn2025). Although these impressions may have immediate adaptive value, they do not reliably indicate stable personality traits (Todorov et al., Reference Todorov, Olivola, Dotsch and Mende-Siedlecki2015). Despite the apparent consensus on first impressions observed in the literature (Ballew & Todorov, Reference Ballew and Todorov2007; Cogsdill et al., Reference Cogsdill, Todorov, Spelke and Banaji2014; Oosterhof & Todorov, Reference Oosterhof and Todorov2008; Willis & Todorov, Reference Willis and Todorov2006), facial evaluations show important diagnostic limitations and are poor predictors of actual personality (Todorov et al., Reference Todorov, Olivola, Dotsch and Mende-Siedlecki2015).
Influence of Dominant Appearance on Success in Different Social Contexts
Facial perception constitutes a complex process that involves both specific facial cues and individual or contextual differences in the perceivers or the observed face (Olivola & Todorov, Reference Olivola and Todorov2010; Rule et al., Reference Rule, Ambady, Adams, Ozono, Nakashima, Yoshikawa and Watabe2010; Todorov et al., Reference Todorov, Olivola, Dotsch and Mende-Siedlecki2015).
To understand how facial dominance influences the perception and success of leaders, it is essential to introduce this key concept: Facial dominance refers to the perception of an individual as capable of commanding respect or inducing fear through intimidation and coercion, constituting one of the core dimensions of social perception alongside warmth or trustworthiness (Cheng et al., Reference Cheng, Tracy, Foulsham, Kingstone and Henrich2013; Fiske, Reference Fiske2019; Henrich & Gil-White, Reference Henrich and Gil-White2001; Oosterhof & Todorov, Reference Oosterhof and Todorov2008). This impression is constructed from facial features, vocal signals, expressions, and attitudes (Clifford, Reference Clifford2020; Eriksson, Reference Eriksson2018).
Dominance is fundamental to understanding how impressions of potential leaders are formed and how the perception of this dimension in them can condition their opportunities for success across different social and cultural contexts (Antonakis & Jacquart, Reference Antonakis, Jacquart, Bligh and Riggio2012; Giacomin & Rule, Reference Giacomin and Rule2020; Olivola & Todorov, Reference Olivola and Todorov2010). These judgments are based on mental prototypes and are mediated by social factors such as status or culture, thereby perpetuating stereotypes and inequalities (Barber et al., Reference Barber, Lee, Becerra and Tate2019; Poveda-Bautista et al., Reference Poveda-Bautista, Diego-Mas and Alcaide-Marzal2021; Unkelbach et al., Reference Unkelbach, Brütting, Schilling and Wänke2025).
At the cultural and societal level, in Western contexts, there is a preference for a prototypical leader characterized as White, male, attractive, and dominant (Giacomin & Rule, Reference Giacomin and Rule2020). However, in collectivist cultures or cooperative scenarios, warmth and a willingness to collaborate are more highly valued (Rule et al., Reference Rule, Ambady, Adams, Ozono, Nakashima, Yoshikawa and Watabe2010; Van Vugt, Reference Van Vugt2006). In this regard, Rule et al. (Reference Rule, Ambady, Adams, Ozono, Nakashima, Yoshikawa and Watabe2010) found that facial perceptions of power predict electoral success in the United States, whereas warmth is more relevant in Japan. In other areas, such as the military, facial dominance has been partially associated with rank attainment, suggesting that facial judgments also impact strict hierarchical structures (Mazur et al., Reference Mazur, Mazur and Keating1984; Mueller & Mazur, Reference Mueller and Mazur1996).
Moreover, facial dominance can either facilitate or hinder success depending on the social group to which the candidate belongs. Livingston and Pearce (Reference Livingston and Pearce2009) demonstrated that Black executives with a warm and baby-faced appearance, traits that mitigate perceptions of threat, tend to achieve greater success, whereas women in executive positions often benefit from faces perceived as more dominant. Emotional expression also plays a decisive role: White male leaders who express anger or show less warmth typically receive higher status and greater compensation than those who maintain neutral or friendly expressions (Brescoll & Uhlmann, Reference Brescoll and Uhlmann2008; Tiedens, Reference Tiedens2001).
Furthermore, compared to other facial attributes, facial dominance is particularly relevant in predicting success in conflictive contexts (Spisak, Homan et al., Reference Spisak, Homan, Grabo and Van Vugt2012; Laustsen & Petersen, Reference Laustsen and Petersen2020), specifically among voters with more conservative ideologies (Laustsen & Petersen, Reference Laustsen and Petersen2020).
These findings highlight how leadership evaluations based on dominant faces result from a complex interaction between perceiver characteristics (such as ideology or cultural beliefs) and candidate attributes (including emotional expressions, gender or race differences, and associated stereotypes) (Chiao et al., Reference Chiao, Bowman and Gill2008; Giacomin & Rule, Reference Giacomin and Rule2020; Laustsen & Petersen, Reference Laustsen and Petersen2017; Livingston & Pearce, Reference Livingston and Pearce2009). This underscores the differential role of dominant appearance, in contrast to other facial attributes, in the formation of impressions and choice of leaders under certain social contexts and preconceived ideas (Laustsen & Petersen, Reference Laustsen and Petersen2020; Olivola & Todorov, Reference Olivola and Todorov2010; Rule et al., Reference Rule, Ambady, Adams, Ozono, Nakashima, Yoshikawa and Watabe2010). When applied to the political domain, these insights suggest that voter choices may be driven by psychological, cultural, or visual factors rather than purely ideological considerations (Olivola et al., Reference Olivola, Eubanks and Lovelace2014, Reference Olivola, Funk and Todorov2014).
Adaptive Followership Theory: Intergroup Conflict and Cooperative Contexts
The influence of facial appearance on the perception and selection of leaders is best understood within a theoretical framework that combines evolutionary leadership theory (Spisak, Homan et al., Reference Spisak, Homan, Grabo and Van Vugt2012; Van Vugt & Ahuja, Reference Van Vugt and Ahuja2010; Van Vugt & Grabo, Reference Van Vugt and Grabo2015) and adaptive followership theory (Laustsen & Petersen, Reference Laustsen and Petersen2020), the latter being an extension of the former.
Evolutionary leadership theory posits that human leadership emerged as an adaptation to coordinate and protect groups, thereby facilitating survival (Spisak, Dekker, et al., 2012; Van Vugt, Reference Van Vugt2006; Van Vugt et al., Reference Van Vugt, Hogan and Kaiser2008; Van Vugt & Ahuja, Reference Van Vugt and Ahuja2010; Van Vugt & Grabo, Reference Van Vugt and Grabo2015). From this perspective, preferences for dominant versus prosocial leaders depend on social context and perceived threats. Spisak, Homan et al. (Reference Spisak, Homan, Grabo and Van Vugt2012) identify two primary types of leadership: (1) prosocial leadership, oriented toward cooperation and peace, characterized by promoting empathy, altruism, and group cohesion; and (2) dominant leadership, oriented toward conflict, which seeks competitive advantage through domination, risk-taking, and status-seeking.
Complementarily, adaptive followership theory focuses on the psychological mechanisms of followers in selecting leaders who maximize their interests and protection according to situational context, suggesting that preferences for certain facial traits in leaders adapt to the prevailing social environment (Laustsen & Petersen, Reference Laustsen and Petersen2020; Petersen & Laustsen, Reference Petersen and Laustsen2020). Corresponding to the two types of leadership proposed, two main social contexts are distinguished. Laustsen and Petersen (Reference Laustsen and Petersen2020) argue that in conflictual contexts or times of war, where external threats exist and strong group defense is required, leaders with dominant appearances are favored. Such leaders are perceived as strong, assertive, and capable of acting decisively and aggressively to protect the community (Spisak, Homan et al., Reference Spisak, Homan, Grabo and Van Vugt2012; Laustsen & Petersen, Reference Laustsen and Petersen2020). Masculine facial features, such as prominent jaws and intense gazes, serve as evolutionary signals of competence and readiness to confront conflict (Antonakis & Dalgas, Reference Antonakis and Dalgas2009; Little et al., Reference Little, Burriss, Jones and Roberts2007). Consequently, leaders with more masculine and dominant faces are perceived as stronger and more competent in conflictual contexts (Clifford, Reference Clifford2020; Eriksson, Reference Eriksson2018; Hayes, Reference Hayes2005; Laustsen & Petersen, Reference Laustsen and Petersen2017, Reference Laustsen and Petersen2020; Tigue et al., Reference Tigue, Borak, O’Connor, Schandl and Feinberg2012; Winter, Reference Winter2010).
In contrast, in cooperative contexts or times of peace, where internal cohesion and stability are prioritized, leaders with traits that convey warmth and trustworthiness are preferred. These leaders are perceived as prosocial and oriented toward collective well-being (Fiske et al., Reference Fiske, Cuddy and Glick2007; Oosterhof & Todorov, Reference Oosterhof and Todorov2008; Ferguson et al., Reference Ferguson, Owen, Hahn, Torrance, DeBruine and Jones2019). In such scenarios, voters tend to value empathy, cooperation, and the ability to maintain harmonious relationships, showing a preference for more feminine or friendly faces (Laustsen & Petersen, Reference Laustsen and Petersen2016; Blaker et al., Reference Blaker, Spisak, Tybur, Kandrik and Arvey2020).
Thus, facial cues influence leadership perception in a context-dependent manner, reflecting individuals’ psychological adaptation to specific social challenges (Van Vugt & Grabo, Reference Van Vugt and Grabo2015; Ferguson et al., Reference Ferguson, Owen, Hahn, Torrance, DeBruine and Jones2019).
The Specific Role of the Naïve Population: The Child Population
This reliance on facial cues is especially pronounced when observers lack other information, making naïve populations particularly susceptible and vulnerable to such biases (Antonakis & Eubanks, Reference Antonakis and Eubanks2017). The term naïve population refers to those people with little or no prior knowledge about a candidate or leader, leading them to rely on superficial cues, such as facial appearance, when forming impressions and making decisions. Research shows that when people have limited information about potential leaders, they often use cognitive or heuristic shortcuts based on appearance to make leadership decisions, leading to significant facial bias (Antonakis & Eubanks, Reference Antonakis and Eubanks2017; Olivola et al., Reference Olivola, Eubanks and Lovelace2014; Rule & Ambady, Reference Rule and Ambady2008).
Antonakis and Eubanks (Reference Antonakis and Eubanks2017) demonstrated that the less knowledge or familiarity observers have with leaders, the more likely they are to rely on any available cues—including facial appearance—to make decisions. Similarly, Lenz and Lawson (Reference Lenz and Lawson2011) found that among heavy television (TV) viewers—considered more susceptible to visual manipulation—candidates with high facial competence could receive up to 16% more votes compared to those with lower facial competence. In contrast, among low-TV consumers, who are less vulnerable to such visual biases, this difference was reduced to just 8 percentage points.
Ahler et al. (Reference Ahler, Citrin, Dougal and Lenz2017) also showed that including candidates’ photographs on the ballot led voters—especially those with low political knowledge—to favor candidates with advantageous facial traits, such as higher perceived competence or attractiveness. Voters with greater political knowledge appeared immune to this influence, whereas low-information voters changed their initial voting choice in 9% of cases after seeing the photos.
Age is another key factor in facial evaluation, acting as a moderator of political knowledge or ignorance (Baltes & Smith, Reference Baltes and Smith2008). Younger voters, who tend to have lower political interest and knowledge, are more likely to rely on low-information heuristics, such as facial appearance (Goerres, Reference Goerres2007). Franklin and Zebrowitz (Reference Franklin and Zebrowitz2016) found that young adults tend to base their vote on perceived facial competence and attractiveness, whereas older adults prefer candidates with a more mature and less baby-faced appearance, likely because they associate maturity with greater competence. This suggests that older adults value experience and wisdom more, while young adults prioritize charisma and attractiveness. Furthermore, older adults appear to be less influenced by facial biases due to their greater engagement and knowledge of the political process compared to young adults (Baltes & Smith, Reference Baltes and Smith2008). For this reason, children are often used as a reference group for “naïve” or uninformed populations (Ahler et al., Reference Ahler, Citrin, Dougal and Lenz2017; Antonakis & Eubanks, Reference Antonakis and Eubanks2017).
Various studies also show that facial appearance judgments are highly consistent across individuals and remain stable over time (Ewing et al., Reference Ewing, Caulfield, Read and Rhodes2015, Reference Ewing, Sutherland and Willis2019; Jessen & Grossmann, Reference Jessen and Grossmann2016; Siddique et al., Reference Siddique, Sutherland, Palermo, Foo, Swe and Jeffery2022, Reference Siddique, Sutherland, Jeffery, Swe, Gwinn and Palermo2023; Todorov et al., Reference Todorov, Oh, Uddenberg and Albohn2025). Cogsdill et al. (Reference Cogsdill, Todorov, Spelke and Banaji2014) demonstrated that the tendency to infer traits from minimal facial information emerges early in childhood and does not require extensive social experience or prior knowledge. Indeed, there is a high degree of agreement between trait judgments made by children and adults (Charlesworth et al., Reference Charlesworth, Hudson, Cogsdill, Spelke and Banaji2019; Cogsdill et al., Reference Cogsdill, Todorov, Spelke and Banaji2014; Cogsdill & Banaji, Reference Cogsdill and Banaji2015).
An illustrative example is the study by Antonakis and Dalgas (Reference Antonakis and Dalgas2009), who showed that Swiss children aged 5 to 13—who had no knowledge of U.S. politics—were able to predict U.S. election outcomes based solely on candidates’ faces. In a similar experiment using pairs of candidates for the French parliament (matched for race and gender), these children correctly identified the winner 71% of the time. These findings suggest that although real voters may consider additional information, their actual choices remain anchored in initial impressions derived from facial appearance (Todorov et al., Reference Todorov, Mandisodza, Goren and Hall2005).
Therefore, previous research shows the relevance of voters’ political knowledge and experience with respect to vote choice (Ahler et al., Reference Ahler, Citrin, Dougal and Lenz2017; Antonakis & Eubanks, Reference Antonakis and Eubanks2017; Lenz & Lawson, Reference Lenz and Lawson2011). The potential influence of the appearance effect among the naïve population in being swayed by facial traits such as competence, attractiveness, and facial dominance (Antonakis & Dalgas, Reference Antonakis and Dalgas2009; Giacomin & Rule, Reference Giacomin and Rule2020; Lenz & Lawson, Reference Lenz and Lawson2011). Broad agreement has been demonstrated between children’s and adults’ facial choices and ratings, and evidence of shared social processing (Charlesworth et al., Reference Charlesworth, Hudson, Cogsdill, Spelke and Banaji2019; Cogsdill et al., Reference Cogsdill, Todorov, Spelke and Banaji2014; Cogsdill & Banaji, Reference Cogsdill and Banaji2015; Mascaro & Sperber, Reference Mascaro and Sperber2009). Likewise, it can be seen how facial traits have been associated with the role of leader, mainly the traits of competence and facial dominance (Giacomin & Rule, Reference Giacomin and Rule2020; Petersen & Laustsen, Reference Petersen and Laustsen2020; Todorov et al., Reference Todorov, Mandisodza, Goren and Hall2005) and how these have greater presence depending on one hand on the sociopolitical context and how this is perceived by the voting population (Laustsen & Petersen, Reference Laustsen and Petersen2017, Reference Laustsen and Petersen2020; Spisak, Dekker et al., Reference Spisak, Dekker, Krüger and Van Vugt2012; Spisak, Homan et al., Reference Spisak, Homan, Grabo and Van Vugt2012) and on the other hand on the individual characteristics (gender, race, culture, or age) of the candidate and the voters (Franklin & Zebrowitz, Reference Franklin and Zebrowitz2016; Livingston & Pearce, Reference Livingston and Pearce2009; Rule et al., Reference Rule, Ambady, Adams, Ozono, Nakashima, Yoshikawa and Watabe2010; Rule & Ambady, Reference Rule and Ambady2008).
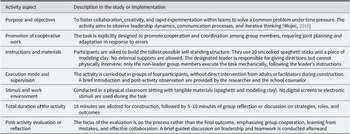
Considering the relationship between facial traits and situational factors from the perspective of evolutionary and social psychology, as well as the role of political unawareness in decisions potentially biased by appearance, this study aims to explore leadership preferences in cooperative contexts in naïve populations. Specifically, the objective is to examine the extent to which low facial dominance scores, associated with trustworthy/empathetic leadership, can predict electoral success in cooperative contexts among naïve populations. To this end, participants were placed in a cooperative situation using the Marshmallow Challenge Activity group technique (Wujec, Reference Wujec2010), in which they built a free-standing structure with spaghetti and modeling clay while following the directions of a nonparticipating leader (see Appendix 1). They then choose between different faces of leaders, each of which had been previously evaluated on a facial dominance scale by the general population.
On the other hand, the present study seeks to analyze the potential perceptual–decision association between adults and children in relation to facial dominance. Specifically, the objective is to examine whether children’s leadership decisions align with adults’ evaluations of facial dominance. This would facilitate the identification of patterns of indirect correspondence in the social processing of facial cues. For this purpose, we intend to use a sample of adults of legal age and a sample of children between the ages of 9 and 12, which will allow us to test and compare their responses in relation to the facial dominance variable and voting preference.
The main hypothesis is that a lower score in facial dominance will correlate positively with being chosen as a leader among a naïve population in cooperative contexts. As a second hypothesis, it is expected that there will be a perceptual–decisional alignment between the evaluation of facial dominance in the general population and the choice of faces in the child population.
Study 1. Face Perception and Facial Dominance Scores in the Adult Population
In this first study, the standardized facial dominance and the hybrid faces of political candidates in the 2019 Spanish elections are evaluated in terms of their facial dominance by the general population. The objective is to categorize and rank the available faces on a facial dominance scale, obtaining an average score for each candidate that can be used in subsequent studies. Ultimately, this study seeks to establish an objective and standardized score for the facial dominance of the seven faces that will serve as an empirical basis for analyzing how this variable influences perceptions of leadership and voting decisions in diverse social contexts.
Method
Participants
To collect ratings of facial impressions, each participant rated the faces on a single facial dominance trait. Data were collected from a total of 567 individuals. The entire sample is composed of older adult participants ranging in age from 18 to 92 years (M = 43.56, standard deviation [SD] = 14.89). Approximately equal numbers of men and women participated (49.7% women; .9 did not specify).
Stimuli
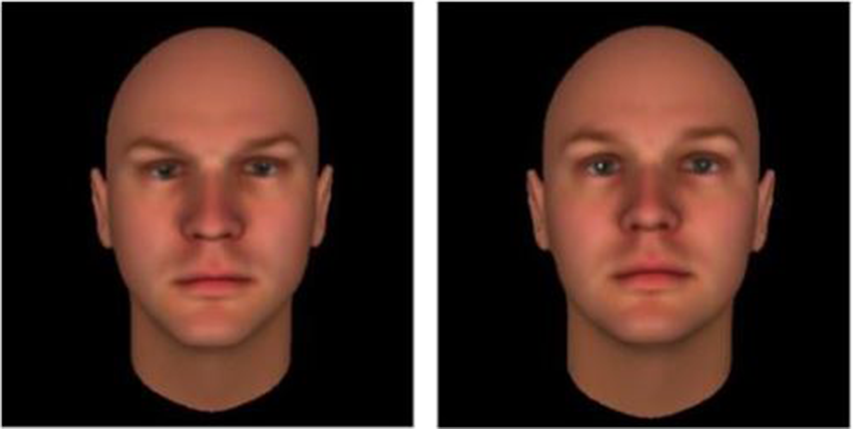
Two types of facial stimuli were used: images of standardized facial dominance faces and neutralized images of the faces of Spanish political candidates. The two standardized faces represent opposite extremes of the facial dominance construct. One is configured for a high dominance score and the other for a low score (see Figure 1). These two faces come from the database created by Oosterhof and Todorov (Reference Oosterhof and Todorov2008).
Standardized faces.
Note: Left dominant face and right nondominant face.

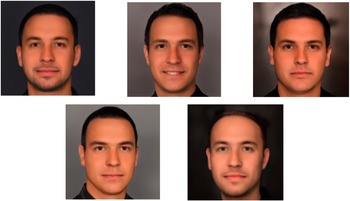
For the neutralized faces of the political candidates (see Figure 2), the test images are hybrids containing a mixture of 50% real faces of each of the 2019 election candidates (Santiago Abascal, Pablo Casado, Pablo Iglesias, Albert Rivera, and Pedro Sánchez) and 50% neutral-expressive faces from the open database created by Oosterhof and Todorov (Reference Oosterhof and Todorov2008). The real faces of the politicians come from posters of the 2019 election campaign. The hybrid faces were created using Artbreeder 2.0. This procedure ensured natural and coherent facial appearances while minimizing potential ideological biases by providing a common, neutral baseline. Visual properties such as luminance, contrast, resolution, and facial symmetry were not modified in order to preserve the inherent morphological features of each face that are responsible for perceived differences in dominance. It is essential to maintain these natural facial cues, given that attributes such as facial symmetry are known to influence social perception and attractiveness (Fink et al., Reference Fink, Neave, Manning and Grammer2006; Harun et al., Reference Harun, Adam, Abdullah and Rusli2023; Rhodes et al., Reference Rhodes, Proffitt, Grady and Sumich1998).
Neutral faces of political candidates.
Note: From left to right and then top to bottom: Santiago Abascal, Pablo Casado, Albert Rivera, Pedro Sánchez, Pablo Iglesias.

Measures
Dominance in standardized faces. To measure the dominance of standardized faces, we followed the methodology previously used in studies such as Oh et al. (Reference Oh, Dotsch, Porter and Todorov2020) and Oosterhof and Todorov (Reference Oosterhof and Todorov2008). For this, a nine-point Likert-type scale is used with the question: “How dominant do you find this person?”, where one represents “not at all dominant” and nine represents “extremely dominant.” This measure is used to validate the results and ensure that the participants’ judgment in assessing facial dominance is correct. Thus, the standardized “very dominant” face should have a higher mean score than the “not very dominant” face.
Dominance in the faces of the political candidates. To measure the dominance of these faces, we followed the methodology previously used in studies such as Oh et al. (Reference Oh, Dotsch, Porter and Todorov2020) and Oosterhof and Todorov (Reference Oosterhof and Todorov2008). For this, a nine-point Likert-type scale is used with the question: “How dominant does this person seem to you?”, where one represents “not at all dominant” and nine represents “extremely dominant.”
Sociodemographic measurements. Data on age, gender, and educational level are taken for the demographic description of the sample.
Procedure
An online questionnaire with the faces and test items is created on Google Forms. The test is distributed to participants via social media using a snowballing technique. Participants are instructed to rate their first impressions of the faces and that there are no right or wrong answers. The faces are shown once each in random order, and there is no time limit for responding.
Data Analysis
Descriptive analyses, comparison of means, and bivariate correlations were performed for a nonparametric sample. The statistical program IBM Statistical Package for the Social Sciences (SPSS) v29.0 and Jamovi 2.6.22 were used for the elaboration of graphs. Thurstone’s law of comparative judgment (Thurstone, Reference Thurstone1927; Thurstone & Chave, Reference Thurstone and Chave1929) was used to obtain scalar values of the choices, and then, correlational analyses were performed between the preferences of the different faces.
Results
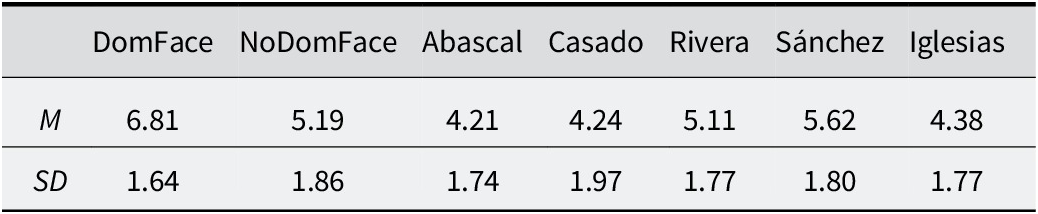
As shown in Table 1, the results obtained for the standardized dominant face have higher dominance scores than the standardized nondominant face. As for the hybrid candidate faces, the highest dominance score is obtained for the image based on Pedro Sánchez (M = 5.62, SD = 1.8) and the lowest for the image based on Santiago Abascal (M = 4.21, SD = 1.74).
Mean dominance scores

Table 1. Long description
The table consists of eight columns and three rows. The header row identifies the categories from left to right as follows: an empty cell, DomFace, NoDomFace, Abascal, Casado, Rivera, S á n c h e z, and Iglesias.
The second row displays the Mean M values:
- DomFace: 6.81
- NoDomFace: 5.19
- Abascal: 4.21
- Casado: 4.24
- Rivera: 5.11
- S á n c h e z: 5.62
- Iglesias: 4.38
The third row displays the Standard Deviation S D values:
- DomFace: 1.64
- NoDomFace: 1.86
- Abascal: 1.74
- Casado: 1.97
- Rivera: 1.77
- S á n c h e z: 1.80
- Iglesias: 1.77
Before comparing the samples and conducting inferential analyses, the distribution of the data was examined using the Kolmogorov–Smirnov and Shapiro–Wilk normality tests. The results showed that the significance values for all variables (FaceDOM, FaceNODOM, Abascal, Casado, Rivera, Sánchez, and Iglesias) were lower than .05 in both tests (p < .001), indicating that the distributions deviated significantly from normality. Subsequent analyses were therefore performed using nonparametric statistical tests, which are more appropriate for data that do not meet the normality assumption.
A Wilcoxon signed-rank test for related samples was conducted to compare facial dominance ratings between two standardized faces, dominant and nondominant. The results showed a significant difference in scores (W = 96546, p < .001), indicating that participants rated the dominant face significantly higher than the nondominant face. The same test was applied to the ratings of politicians evaluated as more dominant (Sánchez) and less dominant (Abascal). The results also showed a significant difference in scores (W = 89615, p < .001), indicating that participants rated the dominant politicians’ faces significantly higher than the nondominant ones.
Both comparisons reported very large effect sizes, with rank–biserial correlations of .911 and .751, respectively, suggesting a robust and consistent difference between the compared conditions. These findings support the validity of the results and the consistency of participants’ criteria in determining facial dominance.
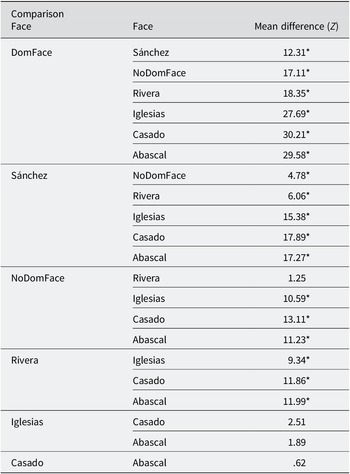
In addition, a nonparametric repeated measures analysis of variance (ANOVA) (Friedman test) was conducted to examine differences in facial dominance ratings across the seven faces. The results showed a statistically significant difference, χ2 (6) = 1015, p < .001, with a medium effect size and Kendall’s W = .30, according to the criteria established by Cohen (1988). Post hoc comparisons using the Durbin–Conover test, with the Bonferroni correction to control for type I error arising from multiple comparisons, revealed significant differences between most pairwise conditions. However, there are three faces whose dominance scores do not appear to differ significantly. These are the faces of Abascal, Casado, and Iglesias. All three belong to the less dominant end of the variable, constituting a group of faces categorized as “not very dominant.” Table 2 summarizes these results.
Pairwise comparisons (Durbin–Conover test)

Table 2. Long description
The table consists of three columns: Face, Face, and Mean difference open parenthesis Z close parenthesis. Asterisks indicate p is less than .001.
* Dom Face compared to: Sánchez 12.31 asterisk; No Dom Face 17.11 asterisk; Rivera 18.35 asterisk; Iglesias 27.69 asterisk; Casado 30.21 asterisk; Abascal 29.58 asterisk.
* Sánchez compared to: No Dom Face 4.78 asterisk; Rivera 6.06 asterisk; Iglesias 15.38 asterisk; Casado 17.89 asterisk; Abascal 17.27 asterisk.
* No Dom Face compared to: Rivera 1.25; Iglesias 10.59 asterisk; Casado 13.11 asterisk; Abascal 11.23 asterisk.
* Rivera compared to: Iglesias 9.34 asterisk; Casado 11.86 asterisk; Abascal 11.99 asterisk.
* Iglesias compared to: Casado 2.51; Abascal 1.89.
* Casado compared to: Abascal .62.
Note: * p < .001.
Conclusion
The findings demonstrate a clear differentiation in perceived facial dominance between standardized dominant and nondominant faces, with dominant faces receiving significantly higher ratings. Similarly, political candidate faces varied in dominance ratings, with Pedro Sánchez’s face rated as the most dominant and Santiago Abascal’s face as the least dominant. The Wilcoxon signed-rank tests revealed significant differences with large effect sizes. The observed differences confirm that the standardized stimuli successfully represent high and low dominance as intended, consistent with prior work by Oosterhof and Todorov (Reference Oosterhof and Todorov2008) on facial dominance perception. Given these data, a degree of reliability can be assumed in the facial judgments made by participants.
Furthermore, the nonparametric repeated measures analysis indicated significant differences across the seven faces, grouping Abascal, Casado, and Iglesias as consistently less dominant. These results validate the reliability of participants’ judgments of facial dominance and highlight meaningful variation within political faces, supporting the relevance of facial cues in social and political perception.
Study 2. Face Perception and Nondominant Leadership Preference in Naïve Population
In the second study, a sample of children is used with the intention that appearance bias will be essential in the choice of leader. Participants are induced into a cooperative situation by hypothesizing that the faces most likely to be chosen will be those with the lowest facial dominance scores. The dominance scores given by the general population in study 1 are taken as a reference. In addition, the aim is to analyze whether the children’s face selection criteria are consistent with the facial dominance categorization previously carried out on the general population sample. The hypothesis is that there is a consistent criterion between the facial dominance assessment of the general population and the face selection of the child population.
Method
Participants
In order to evaluate the perceptual–decision correspondence in the inference of facial features between adult and child populations, an initial measurement of the facial dominance variable (Study 1) was first carried out with a sample of adults. Subsequently, these assessments were compared with the leadership choices made by a sample of children in the present study (Study 2), in order to analyze the existence of an indirect association between adult perception of dominance and children’s decisions. The sample consisted of 85 participants aged 9 to 12 years (M = 10.55, SD = .57). 40% were female, and 60% were male. Of the total sample, 97.6% were Spanish and 2.4% were of another nationality.
The study was approved by the Ethics Committee of the Autonomous Community of Aragon (CEICA; PI22/393) and conducted in accordance with the principles of the Declaration of Helsinki. Informed consent was obtained from all participants, as well as parental consent and child assent in the case of minors.
Stimuli
Study 2 used the same faces standardized in facial dominance and neutralized images of the faces of Spanish political candidates used in Study 1 (see Figures 1 and 2).
Measures
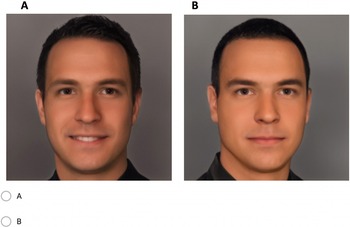
Leadership preference: 11 items from the 10 binary comparisons of the 5 neutral faces of the political leaders [N(N-1)/2] and a combination with the standardized faces. They are presented in random order, with the faces placed an equal number of times on the left and right sides of the screen. The question is the one used by Todorov et al. (Reference Todorov, Mandisodza, Goren and Hall2005): “Which of the two people would you choose as a leader?” (see Figure 3).
Which of the two people would you choose as leader?

Sociodemographic measures: Age, gender, and nationality used for the demographic description of the sample.
Procedure
The sample participated in a leadership dynamic called “the Marshmallow Challenge Activity” (Wujec, Reference Wujec2010). The goal of the activity is for the children to identify the role of a leader in a cooperative problem-solving context, the actions involved, and the importance of group cohesion and the decisions made in the final outcome (see Appendix 1). At the end of the activity, the children are given an online questionnaire (Google Forms) to complete individually, anonymously, and without a time limit. They have to answer the questions according to their first impressions, and there are no right or wrong answers. Each face is shown four times (paired once with every other face) in random order.
Results
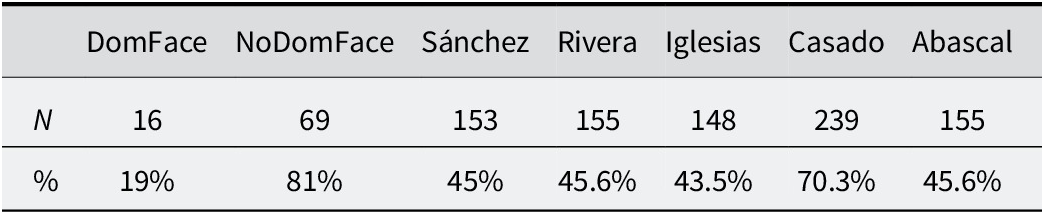
First of all, the votes received by each political face in a total of 340 voting opportunities were added up. Sánchez, Rivera, Iglesias, and Abascal were chosen about 45% of the time, a result close to random. In contrast, Casado stood out with 70.3% of the choices, and the standardized nondominant face was the most chosen with 81% versus 19% for the dominant face (see Table 3).
Total votes obtained and percentage of success in the election

Table 3. Long description
The table consists of eight columns and three rows.
Row 1 (Headers): The first cell is empty, followed by DomFace, NoDomFace, Sánchez, Rivera, Iglesias, Casado, and Abascal.
Row 2 (N values):
- DomFace: 16
- NoDomFace: 69
- Sánchez: 153
- Rivera: 155
- Iglesias: 148
- Casado: 239
- Abascal: 155
Row 3 (Percentage values):
- DomFace: 19 percent
- NoDomFace: 81 percent
- Sánchez: 45 percent
- Rivera: 45.6 percent
- Iglesias: 43.5 percent
- Casado: 70.3 percent
- Abascal: 45.6 percent
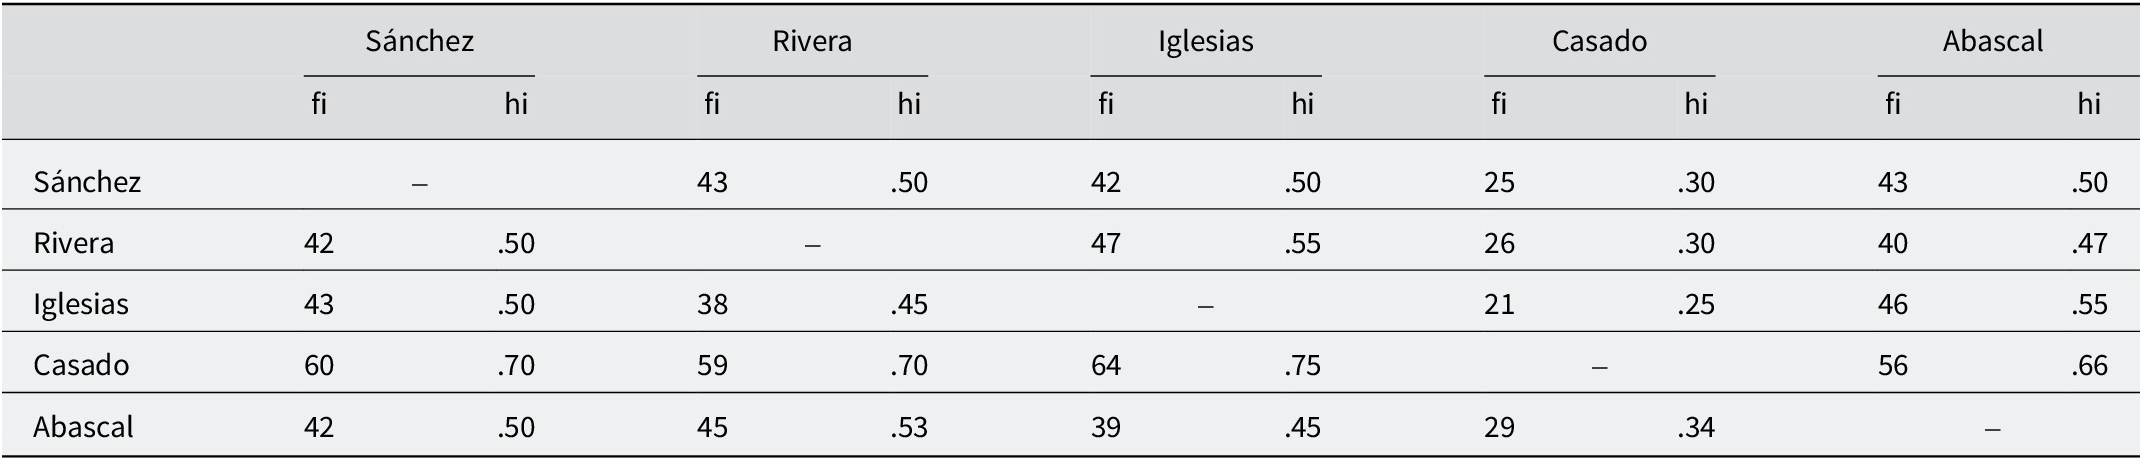
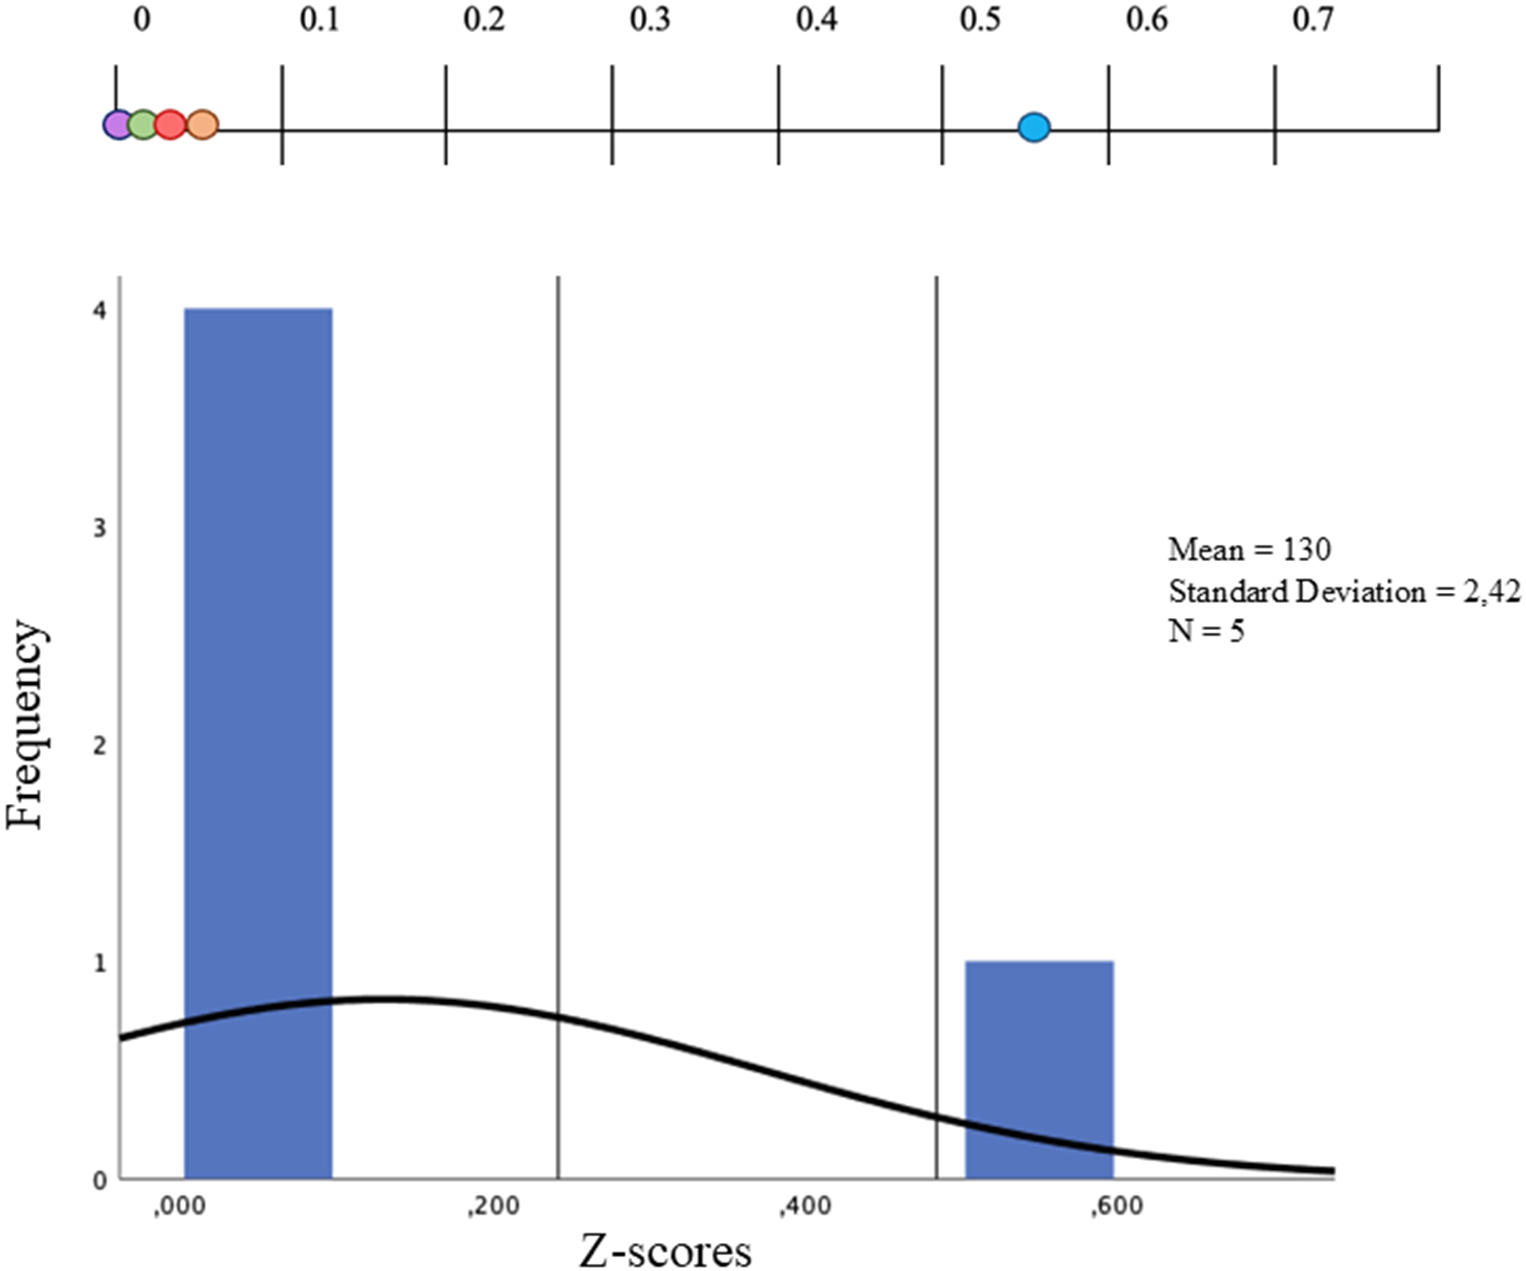
Second, Thurstone’s law of comparative judgment (Thurstone, Reference Thurstone1927; Thurstone & Chave, Reference Thurstone and Chave1929) was applied to derive scalar values representing participants’ preferences for each face based on pairwise comparisons. After converting the scores into Z-scores (see Tables 4 and 5), it was observed that Casado’s face stands out with a value 2 SDs above the rest. The other candidates have very similar values, with little dispersion (see Figure 4).
Matrix of absolute frequencies and relative frequencies

Table 4. Long description
The table is a 5 by 5 matrix comparing Sánchez, Rivera, Iglesias, Casado, and Abascal. Each cell contains two values: f i (absolute frequency) and h i (relative frequency).
* Row 1, Sánchez: vs Rivera (43, .50); vs Iglesias (42, .50); vs Casado (25, .30); vs Abascal (43, .50).
* Row 2, Rivera: vs Sánchez (42, .50); vs Iglesias (47, .55); vs Casado (26, .30); vs Abascal (40, .47).
* Row 3, Iglesias: vs Sánchez (43, .50); vs Rivera (38, .45); vs Casado (21, .25); vs Abascal (46, .55).
* Row 4, Casado: vs Sánchez (60, .70); vs Rivera (59, .70); vs Iglesias (64, .75); vs Abascal (56, .66). These values are highlighted in bold.
* Row 5, Abascal: vs Sánchez (42, .50); vs Rivera (45, .53); vs Iglesias (39, .45); vs Casado (29, .34).
Diagonal cells where an individual is compared to themselves are marked with a dash.
Note: The number on the left represents the absolute frequency, and the number on the right represents the relative frequency. The scores belong to the face in the left column in their choice with the complementary face in the row above.
Z-score matrix

Table 5. Long description
The table consists of 5 rows and 9 columns. The columns are labeled: Sánchez, Rivera, Iglesias, Casado, Abascal, M, Z, and Order.
* Row 1: Sánchez. Values are .–000 for Sánchez, M is minus .104, Z is .032, and Order is 3rd.
* Row 2: Rivera. Values are .000 for Sánchez, dash for Rivera, M is minus .092, Z is .044, and Order is 2nd.
* Row 3: Iglesias. Values are .000 for Sánchez, minus .13 for Rivera, dash for Iglesias, M is minus .136, Z is 0, and Order is 5th.
* Row 4: Casado. Values are .52 for Sánchez, .52 for Rivera, .68 for Iglesias, dash for Casado, M is .426, Z is .562, and Order is 1st.
* Row 5: Abascal. Values are .000 for Sánchez, minus .07 for Rivera, minus .13 for Iglesias, minus .41 for Casado, dash for Abascal, M is minus .122, Z is .014, and Order is 4th.
Distribution of the Z-scores corresponding to the frequency with which each candidate was elected.
Note: Position of the scores from left to right: Iglesias (0); Abascal (.014); Sánchez (.032); Rivera (.044); and Casado (.562).

Figure 4. Long description
The top section is a horizontal number line ranging from 0 to 0.7. Five colored dots represent the candidates. Clustered near 0 are Iglesias at 0, Abascal at .014, Sánchez at .032, and Rivera at .044. A single blue dot for Casado is isolated to the right at .562.
The bottom section is a histogram. The Y-axis represents Frequency from 0 to 4. The X-axis represents Z-scores from .000 to .600.
* A tall blue bar at the .000 mark reaches a frequency of 4.
* A shorter blue bar at the .600 mark reaches a frequency of 1.
* A black normal distribution curve is overlaid, peaking at approximately .150 and tapering off toward .600.
* Text on the right side indicates Mean equals 130, Standard Deviation equals 2,42, and N equals 5.
Given that choices between faces derive from data with a multilevel structure, we employed generalized linear mixed models (GLMMs), which allow the use of all available trial-level information and provide more robust estimates than analyses based on stimulus-level aggregated means. We first analyzed the block of standardized faces, among which each participant made a single choice. The GLMM revealed a significant effect of facial dominance, χ2 (1) = 55.5, p < .001. The results for the dominance variable (β = 1.80, standard error [SE] = .24) indicate that participants were less likely to select the high-dominance face and more likely to select the low-dominance face. The near-zero variance of the participant-level intercept reflects highly consistent response patterns across individuals. These findings confirm that the standardized faces reliably represent distinct levels of dominance and that participants were sensitive to this manipulation.
In contrast, the GLMM applied to the five hybrid faces of political candidates did not show a significant effect of facial dominance, χ2 (1) = .02, p = .878, indicating that variations in dominance among these stimuli did not influence the likelihood of being selected. However, candidate identity had a significant effect, χ2 (3) = 55.85, p < .001. Some faces were selected more frequently than others, with Casado being the most frequently chosen in this set (β = − 1.02, SE = .16, p < .001). This pattern suggests that, for these stimuli, identity-related idiosyncrasies played a more relevant role in guiding participants’ choices than facial dominance.
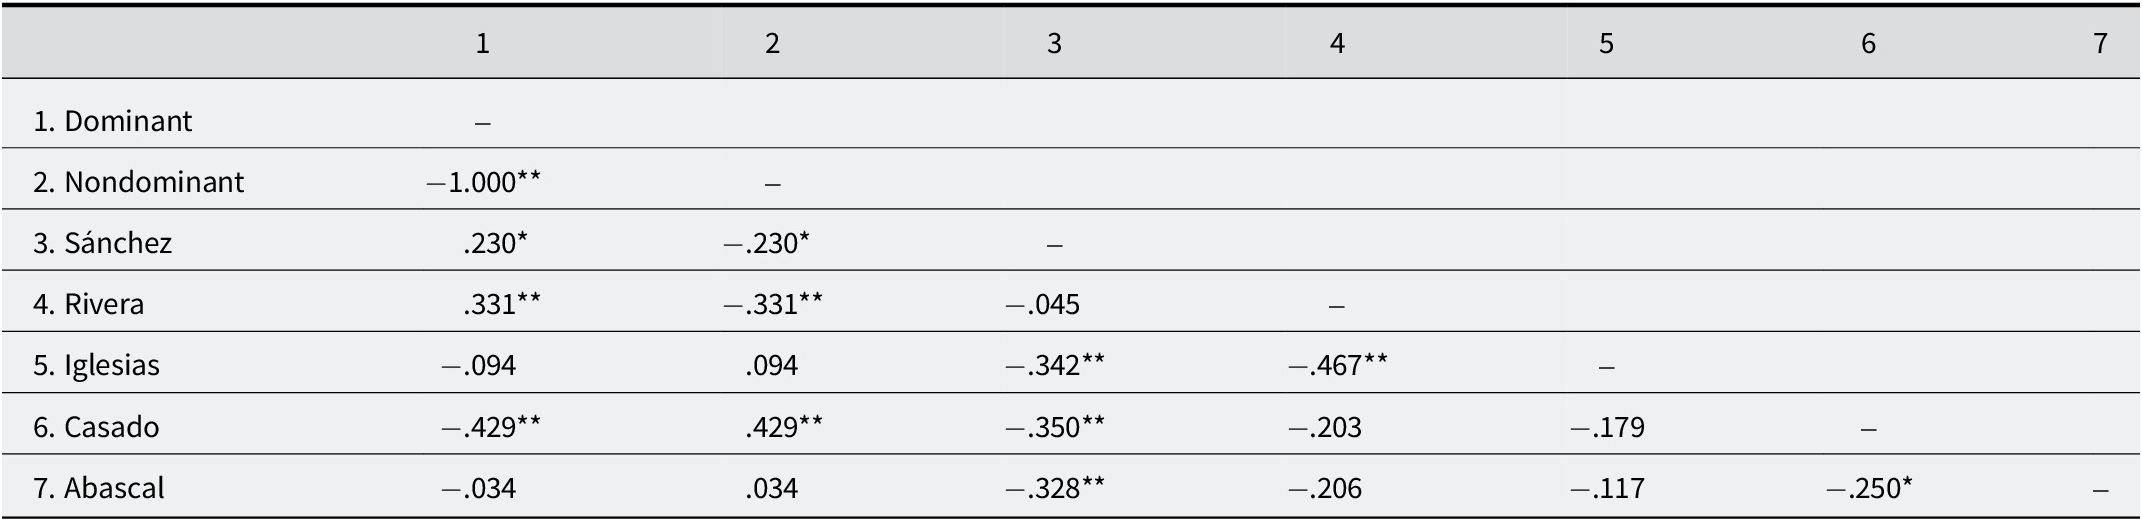
On the other hand, significant correlations were observed between the choices of the different candidates. The faces of Casado and Abascal, previously categorized as “not very dominant” in Study 1, correlated negatively with that of Sánchez, identified as “dominant” (see Table 6). Likewise, Casado’s face showed a negative correlation with the standardized dominant face and a positive correlation with the nondominant face. In contrast, the choices of Sánchez and Rivera were positively associated with the standardized dominant face and negatively with the choice of Iglesias, previously categorized as the third least dominant face.
Correlations between candidate votes

Table 6. Long description
The table consists of 7 numbered rows and 7 numbered columns. The diagonal is marked with dashes.
* Row 1, Dominant: No correlations.
* Row 2, Nondominant: Correlates with Dominant at minus 1.000 (significant at p less than .01).
* Row 3, Sánchez: Correlates with Dominant at .230 (p less than .05) and Nondominant at minus .230 (p less than .05).
* Row 4, Rivera: Correlates with Dominant at .331 (p less than .01), Nondominant at minus .331 (p less than .01), and Sánchez at minus .045.
* Row 5, Iglesias: Correlates with Dominant at minus .094, Nondominant at .094, Sánchez at minus .342 (p less than .01), and Rivera at minus .467 (p less than .01).
* Row 6, Casado: Correlates with Dominant at minus .429 (p less than .01), Nondominant at .429 (p less than .01), Sánchez at minus .350 (p less than .01), Rivera at minus .203, and Iglesias at minus .179.
* Row 7, Abascal: Correlates with Dominant at minus .034, Nondominant at .034, Sánchez at minus .328 (p less than .01), Rivera at minus .206, Iglesias at minus .117, and Casado at minus .250 (p less than .05).
Note: ** p < .01; * p < .05.
These results reflect a clear segmentation between two groups of candidates according to their perceived dominance profile: on the one hand, Sánchez and Rivera (dominant), and on the other, Casado, Abascal, and Iglesias (nondominant). Negative correlations between members of different groups suggest mutually exclusive choice patterns (see Figure 5). In addition, a negative correlation was found between Casado and Abascal, which could be explained by a strong preference for Casado over Abascal when both compete directly.
Factorial model of correlational analysis.
Note: S.F. (standardized face). Green lines represent positive correlations, and red lines negative ones. Dominance or nondominance subgroups are represented in blue and orange, respectively.

Figure 5. Long description
At the top are two rectangular headers. On the left is a blue box labeled D O M I N A N T S dot F dot and on the right is an orange box labeled N O D O M I N A N T S dot F dot.
Below these, the diagram maps relationships between two groups of oval nodes. The blue group on the left includes S Á N C H E Z and R I V E R A. The orange group on the right includes I G L E S I A S, C A S A D O, and A B A S C A L.
Correlations from D O M I N A N T S dot F dot include:
- A positive green line to S Á N C H E Z at point 2 3 0 asterisk.
- A positive green line to R I V E R A at point 3 3 1 double asterisk.
- A negative red line to I G L E S I A S at negative point 4 2 9 double asterisk.
Correlations from N O D O M I N A N T S dot F dot include:
- A negative red line to S Á N C H E Z at negative point 2 3 0 asterisk.
- A positive green line to C A S A D O at point 4 2 9 double asterisk.
Direct correlations between individuals include:
- S Á N C H E Z has negative red lines to I G L E S I A S at negative point 3 4 2 double asterisk, C A S A D O at negative point 3 5 0 double asterisk, and A B A S C A L at negative point 3 2 8 double asterisk.
- R I V E R A has negative red lines to I G L E S I A S at negative point 3 3 1 double asterisk and C A S A D O at negative point 4 6 7 double asterisk.
- C A S A D O has a negative red line to A B A S C A L at negative point 2 5 0 asterisk.
Conclusion
These findings indicate that, whereas facial dominance clearly influenced participants’ choices when standardized faces—constructed to vary exclusively along this dimension—were used, choices within the set of hybrid faces were driven primarily by idiosyncratic characteristics of the individual candidates rather than by facial dominance. Casado received a significantly higher selection score than the remaining candidates, who showed comparable values to one another. Therefore, the hypothesis is partially confirmed with standardized stimuli with a higher degree of control but loses strength in trial-by-trial models that better reflect the complexity of real decisions.
Moreover, the correlational analyses revealed a preference pattern divided into two perceptual subgroups: dominant candidates (Sánchez and Rivera) and nondominant candidates (Casado, Abascal, and Iglesias), with opposite choice tendencies between the two groups. This pattern suggests that participants form coherent representations of facial dominance and are able to make preference-based decisions grounded in these perceptions.
Discussion
This study explores the influence of facial appearance on leadership preference in cooperative contexts, evaluating decisions based exclusively on facial features. A child sample, with low political knowledge, was used to analyze the impact of possible perceptual biases on decision-making. An adult sample was also included to examine whether there is evidence of shared social processing among different age groups in inferring personality traits from facial appearance.
Study 1 classifies the facial dominance of a set of visual stimuli obtained from official photographs of Spanish politicians’ election posters (Sánchez, Rivera, Iglesias, Casado, and Abascal, from highest to lowest score). Based on the results of Study 1, the data obtained in the second study reveal different main findings. Initially, with regard to the absolute frequencies of the votes, the faces perceived as less dominant were the most highly rated in a cooperative context. Casado’s face, in particular, received 70.3% of the votes, a figure that significantly surpassed the results of the other candidates. The standardized nondominant face obtained 81% preference, thereby supporting the initial hypothesis that, in cooperative scenarios, leaders exhibiting lower facial dominance are more likely to be elected.
However, analyses using GLMMs allow us to refine this interpretation by differentiating between the standardized stimuli and the hybrid faces used in this study. In the case of standardized faces, participants consistently showed a lower probability of choosing the high-dominance face, which clearly supports the hypothesis under controlled conditions. However, when hybrid faces were analyzed, which are closer to natural stimuli and incorporate idiosyncratic features specific to each identity, dominance ceased to be a significant predictor of choice, with differences attributable to particular facial characteristics being observed, as in the case of Casado, who was selected more frequently than the rest. This result is consistent with the possibility that decisions are influenced by idiosyncratic attributes (such as facial and emotional expressiveness or previous associations with leadership styles) that are not limited by facial dominance scales (Landwehr & Wänke, Reference Landwehr and Wänke2023; Olivola et al., Reference Olivola, Eubanks and Lovelace2014; Re et al., Reference Re, Hunter, Coetzee, Tiddeman, Xiao, DeBruine, Jones and Perrett2013). Taken together, these results suggest that the hypothesis is partially fulfilled: Facial dominance guides choice in controlled stimuli, but in more naturalistic stimuli, additional influences linked to facial identity emerge that would attenuate the effect of dominance.
The preference observed for less dominant faces in cooperative contexts is consistent with the negative correlation between facial dominance and traits such as trustworthiness, warmth, or babyface appearance (Oliveira et al., Reference Oliveira, Garcia-Marques, Dotsch and Garcia-Marques2019; Oliveira & Garcia-Marques, Reference Oliveira and Garcia-Marques2022; Sutherland et al., Reference Sutherland, Oldmeadow, Santos, Towler, Michael Burt and Young2016). Although these dimensions were not measured directly, it is plausible that less dominant faces were perceived as more trustworthy or cooperative because of their negative correlation with facial dominance (Oosterhof & Todorov, Reference Oosterhof and Todorov2008).
Considering that children’s ability to recognize and judge dominance in faces emerges early (Cogsdill et al., Reference Cogsdill, Todorov, Spelke and Banaji2014; Galusca et al., Reference Galusca, Mermillod, Dreher, Van Der Henst and Pascalis2023) and that the consistency of their judgments approaches that of adults from the age of 5–6 (Cogsdill et al., Reference Cogsdill, Todorov, Spelke and Banaji2014; Sakuta, Reference Sakuta2022), it would be expected that in conflictive contexts, the same criteria as adults would be maintained and more dominant faces would be preferred according to evolutionary leadership theories (Spisak, Dekker et al., Reference Spisak, Dekker, Krüger and Van Vugt2012; Van Vugt, Reference Van Vugt2006; Van Vugt et al., Reference Van Vugt, Hogan and Kaiser2008; Laustsen & Petersen, Reference Laustsen and Petersen2020). Furthermore, the utilization of a child sample characterized by limited political knowledge serves to mitigate the influence of political candidate recognition bias and thereby consolidates the impact of the appearance effect on the election of a candidate (Ahler et al., Reference Ahler, Citrin, Dougal and Lenz2017; Antonakis & Eubanks, Reference Antonakis and Eubanks2017; Lenz & Lawson, Reference Lenz and Lawson2011).
Second, the results show a clear correspondence between the perception of dominance in the child and adult populations. Those children who choose dominant standardized faces also tend to select candidates with high scores in facial dominance according to the scores given by adults. This tendency is observed in both dominant and nondominant faces. This consistency between the two groups confirms the second hypothesis and suggests a perceptual–decisional association of feature inference from faces, agreeing with previous studies (Charlesworth et al., Reference Charlesworth, Hudson, Cogsdill, Spelke and Banaji2019; Cogsdill et al., Reference Cogsdill, Todorov, Spelke and Banaji2014; Cogsdill & Banaji, Reference Cogsdill and Banaji2015; Siddique et al., Reference Siddique, Sutherland, Palermo, Foo, Swe and Jeffery2022, Reference Siddique, Sutherland, Jeffery, Swe, Gwinn and Palermo2023). Moreover, the children’s choices evidence two subgroups of candidates with opposite choice patterns: one dominant and one nondominant, whose choices are negatively related to each other, supporting the consistency of the criteria used for the choice of a candidate.
The association between adults’ facial dominance ratings and children’s leadership choices suggests an inferential correspondence rather than a direct perceptual consensus. Although children did not explicitly evaluate dominance, their consistent preference for faces categorized by adults as either high or low dominant indicates a perceptual–decisional alignment that may reflect shared social processing mechanisms. This pattern supports the notion that children are sensitive to facial cues that adults associate with social dominance, even if such sensitivity operates at an implicit or behavioral level.
Research has demonstrated that children as young as three years old can accurately differentiate “baby faces” in adult faces (Cogsdill et al., Reference Cogsdill, Todorov, Spelke and Banaji2014; Montepare and Zebrowitz-McArthur, Reference Montepare and Zebrowitz-McArthur1989; Sakuta, Reference Sakuta2022). This supports their judgment of less dominant faces and their ability to differentiate them from more dominant faces. In a similar vein, Charlesworth et al. (Reference Charlesworth, Hudson, Cogsdill, Spelke and Banaji2019) posit that children are capable of assessing character and predicting social behaviors quickly from the appearance of facial features.
It is worth noting the facial expression that distinguishes the face of the most voted candidate from the rest (Casado), specifically the smile. Todorov et al. (Reference Todorov, Said, Engell and Oosterhof2008) suggest that accessible facial expressions, such as the smile, can generalize to stable dispositions such as friendly appearance, which could reduce the perception of dominance. According to Todorov et al. (Reference Todorov, Oh, Uddenberg and Albohn2025), positive facial expressions, such as smiling, are closely linked to favorable evaluations, including the perception of trustworthiness. These expressions play a key role in how faces are interpreted socially, influencing decisions to approach or avoid others (Jones & Kramer, Reference Jones and Kramer2021).
In studies with children, Keating and Bai (Reference Keating and Bai1986) observed that children tended to associate non-smiling faces of adults with dominance when these expressions were contrasted with smiling ones. Similarly, Keating et al. (Reference Keating, Mazur, Segall, Cysneiros, Kilbride, Leahy, Divale, Komin, Thurman and Wirsing1981) supported the universal and significant association between smiling and happiness, and between non-smiling and dominance, in adults from different cultures. These findings suggest that smiling would act as a facial signal that facilitates decision-making and that its presence on Casado’s face could have influenced his perception as a less dominant and more cooperative leader.
A relevant limitation of the present study is that it only considered the dimension of facial dominance, without including the assessment of perceived trustworthiness as included in previous studies of cooperative contexts (Engell et al., Reference Engell, Todorov and Haxby2010; Ferguson et al., Reference Ferguson, Owen, Hahn, Torrance, DeBruine and Jones2019; Little et al., Reference Little, Burriss, Jones and Roberts2007; Rezlescu et al., Reference Rezlescu, Duchaine, Olivola and Chater2012; Spisak, Dekker et al., Reference Spisak, Dekker, Krüger and Van Vugt2012). Given that both traits constitute fundamental axes in social perception (Oosterhof & Todorov, Reference Oosterhof and Todorov2008), their joint analysis could offer a more complete understanding of leadership judgment in different contexts. Future research should simultaneously address the dimensions of dominance and trustworthiness, contrasting their relative influence in cooperative and conflictive scenarios, in order to elucidate how each trait contributes to the process of leader selection and legitimization based on situational demands.
Conclusions
The findings suggest that facial expressions influence leadership-related decisions, with the impact varying according to contextual factors. This finding aligns with the proposal of van Vugt and Grabo (Reference Van Vugt and Grabo2015), who, from an evolutionary-contingent perspective, suggest that contextual assessments of leadership ability could be linked to the perceived ability to deal with different intergroup challenges across human evolution. Despite the controversies and conflicting results regarding the accuracy of perceptions about traits such as dominance or trustworthiness (Todorov et al., Reference Todorov, Olivola, Dotsch and Mende-Siedlecki2015), the data from our study provide further evidence that face-based stereotypical impressions influence social judgments with some predictive ability.
The GLMM analyses showed that facial dominance exerted a clear and robust effect on children’s choices when stimuli were highly standardized, suggesting that in controlled contexts participants rely strongly on this dimension when forming social judgments. This pattern aligns with functional models of face evaluation (Oosterhof & Todorov, Reference Oosterhof and Todorov2008) and with evidence of early sensitivity to these dimensions in childhood (Cogsdill et al., Reference Cogsdill, Todorov, Spelke and Banaji2014; Charlesworth et al., Reference Charlesworth, Hudson, Cogsdill, Spelke and Banaji2019). In contrast, dominance did not predict trial-by-trial choices for hybrid faces, likely because expressive cues such as smiling known to modulate dominance perceptions (Galinsky et al., Reference Galinsky, Erol, Atanasova, Bohus, Krause-Utz and Lis2020; Horn et al., Reference Horn, Matuszewska, Gkantidis, Verna and Kanavakis2021; Trichas & Schyns, Reference Trichas and Schyns2012; Trichas et al., Reference Trichas, Schyns, Lord and Hall2017) compete with structural facial traits.
Furthermore, the results corroborate previous research indicating that this tendency to form judgments based on a limited amount of facial information emerges early in childhood, independent of prolonged social experience (Charlesworth et al., Reference Charlesworth, Hudson, Cogsdill, Spelke and Banaji2019; Cogsdill et al., Reference Cogsdill, Todorov, Spelke and Banaji2014; Cogsdill & Banaji, Reference Cogsdill and Banaji2015; Ewing et al., Reference Ewing, Caulfield, Read and Rhodes2015, Reference Ewing, Sutherland and Willis2019; Jessen & Grossmann, Reference Jessen and Grossmann2016; Siddique et al., Reference Siddique, Sutherland, Palermo, Foo, Swe and Jeffery2022, Reference Siddique, Sutherland, Jeffery, Swe, Gwinn and Palermo2023). Indeed, the shared sensitivity to facial signals of dominance among both age groups supports findings that suggest a widespread and consistent predisposition among children and adults in such assessments (Charlesworth et al., Reference Charlesworth, Hudson, Cogsdill, Spelke and Banaji2019; Cogsdill et al., Reference Cogsdill, Todorov, Spelke and Banaji2014; Cogsdill & Banaji, Reference Cogsdill and Banaji2015).
In sum, these patterns support the idea that dominance is relevant for social perception, although its weight depends on the level of stimulus control and on the expressive cues accompanying the face, in line with research highlighting the interaction between structural facial traits and expressive signals in social impression formation (Giacomin & Rule, Reference Giacomin and Rule2020; Landwehr & Wänke, Reference Landwehr and Wänke2023; Todorov et al., Reference Todorov, Olivola, Dotsch and Mende-Siedlecki2015). However, while these responses may have an evolutionary basis and some adaptive functionality, it is critical to emphasize the importance of critical thinking in interpreting social cues. Overreliance on quick judgments based on appearances can perpetuate biases and reinforce stereotypes that affect objective decision-making. It is essential to mitigate the risk of misjudgments and promote fairer and more informed social interactions by fostering reflective and conscious attitudes toward social and perceptual intuitions.
Data availability statement
The materials needed to conduct the research and for its replication can be found in the Open Science Framework online public repository. These can be accessed through the following link: https://osf.io/egjck/overview?view_only=6e89193fb2e14ed6aad18459d3d72f7a.
Acknowledgments
The authors would like to thank Colegio Juan de Lanuza for its collaboration in the development of this study. We also thank Alejandro Díaz-Guerra Romero, from the Universidad Complutense de Madrid, and Jorge Navarro, from the Grupo Decisión Multicriterio Zaragoza (GDMZ), Departamento de Economía Aplicada, Universidad de Zaragoza, for their valuable guidance in data analysis. Finally, we acknowledge the research group S24_23R: “Psicología: Procesos Cognitivos y Sociales” at the Universidad de Zaragoza for their support throughout the project.
Author contribution
S.G.-M. conceptualized the study, curated the data, involved in formal analysis, investigated the data, designed the methodology, administered the project, visualized the data, and wrote the original draft. Á.B. conceptualized the study, investigated the data, designed the methodology, administered the project, supervised the data, validated the data, visualized the data, wrote, reviewed, and edited the manuscript. C.L.-G. provided resources, supervised the data, validated the data, and wrote, reviewed, and edited the manuscript. M.A. administered the project, investigated the data, supervised the data, validated the data, visualized the data, wrote, reviewed, and edited the manuscript.
Funding statement
This research received no specific grant from any funding agency, commercial or not-for-profit sectors.
Competing interests
The authors declare none.
Appendix 1
Characteristics and development of the Marshmallow Challenge Activity

Table A1. Long description
The table consists of two columns: Activity aspect and Description in the study or implementation.
* Purpose and objectives: To foster collaboration, creativity, and rapid experimentation. Aims to observe leadership dynamics, communication, and iterative thinking.
* Promotion of cooperative work: Designed to promote cooperation and coordination, requiring joint planning and adaptation.
* Instructions and materials: Build the tallest self-standing structure using 20 uncooked spaghetti sticks and modeling clay. The leader gives directions but cannot physically intervene; only non-leaders execute the task.
* Execution mode and supervision: Groups of four participants without adult intervention during construction. Researcher and counselor provide introduction and post-activity observation.
* Stimuli and work environment: Physical classroom with tangible materials; no digital screens used.
* Total duration of the activity: 18 minutes for construction, followed by 5 to 10 minutes of group reflection.
* Post-activity evaluation or reflection: Focuses on the process, emphasizing cooperation, learning from mistakes, and effective collaboration through guided discussion.



 Open access

