

Introduction
Large tabular icebergs are second only to penguins as an iconic Antarctic image. The question arises, when and where were they first observed and documented? While the Arctic icebergs that calved from Greenland were known by the indigenous peoples and from early European whaling expeditions, conditions in Antarctica were very different.
Before beginning, it is worth reviewing the conventions for dates. The Old Style (OS) dates refer to the Julian calendar, as opposed to the current Gregorian New Style (NS) calendar (Morse, Reference Morse2024). Until 1752 in the OS calendar, New Year’s Day in Great Britain and its colonies occurred on 25 March. In 1700 for example, between 1 January and 24 March, the OS calendar lagged the NS calendar by a year and ten days; on 25 March, the year increased so that the OS calendar lagged the NS calendar by ten days. For example, 1 February 1699 OS corresponds to 11 February 1700 NS. The use of both calendars permits comparison of Wafer’s book and Halley’s journals with modern sources.
As the successor to Headland’s (Reference Headland2009) compendium of Antarctic expeditions, Headland, Hughes, & Wilkinson (Reference Headland, Hughes and Wilkinson2023a,b) provide 1758 records of recorded European observations of Antarctic icebergs beginning from their first in 1687 OS to 1933. The two oldest are Edward Davis’s 1687 OS observations on the Batchelor’s Delight of icebergs just north of the Antarctic Peninsula (Wafer, Reference Wafer1699, 189) and comet-discoverer Edmond Halley’s encounter in 1699 OS on the HMS Paramore of icebergs north of South Georgia. The account of Davis’s voyage is from a book by the ship’s surgeon Lionel Wafer (Wafer, Reference Wafer1699, summarised in Balch, Reference Balch1902); Halley’s account is from his annotated log (Thrower, Reference Thrower1981). Davis and Wafer were the first to document Antarctic icebergs, while Halley described and sketched the tabular icebergs.
The source of their observations was the westward drift of the icebergs calved from the giant ice shelves around Antarctica into the Weddell Sea, where the Antarctic Peninsula diverts many of them along its east side into the Southern Ocean and South Atlantic and for some past the island of South Georgia [54.4°S, 36.6°W] (Budge & Long, Reference Budge and Long2018; Martin, Long & Schodlok, Reference Martin, Long and Schodlok2023).
The two men and their iceberg accounts are very different. Davis was a buccaneer captain, where in the late seventeenth century, English buccaneers ravaged the poorly defended Spanish communities of the Pacific coast of Spanish Central and South America. They reached these regions by either crossing the Isthmus of Panama on foot or sailing around Cape Horn. On their return to the Virginia Colony after their iceberg encounter, Davis and Wafer were imprisoned in Jamestown for piracy, but were later released. In 1693 OS, Wafer reclaimed a portion of the ship’s treasure, although the Crown retained £300 to support the founding of William and Mary College in Williamsburg (Preston & Preston, Reference Preston and Preston2005, 320). In contrast, Halley was a temporary Royal Navy captain with his voyage sponsored by the Royal Society and the Admiralty. When he returned to London, he conducted a third and final voyage studying tides in the English Channel.
Because Davis and Halley were the first to record Antarctic icebergs does not mean they were the first to observe them. There are at least two southern hemisphere land areas where currents carry Antarctic icebergs within 50 km of the coast, so that indigenous people with seaborne prowess could have observed them. The first is the east side of the South Island of New Zealand, the Chatham Islands, 875 km to the east, and Enderby Island, which is the most northerly of the Auckland Islands 460 km to the south, all visited or settled by the thirteenth century CE (Anderson, O’Regan, Parata-Goodall, Stevens, & Tau, Reference Anderson, O’Regan, Parata-Goodall, Stevens and Tau2021).
Headland et al. (Reference Headland, Hughes and Wilkinson2023a, Fig. 3) show there were several icebergs observed near the Chatham Islands and South Island, and Cull (Reference Cull2007) describes the visit in November 2005 of an Antarctic iceberg flotilla off the coast Dunedin, New Zealand, with a previous one in 1938 (Cull, Reference Cull2007). As John Dunbier discovered (cited in Cull, Reference Cull2007), this flotilla originated from a single 10 × 10 km2 iceberg in the Mertz-Ninnis Ice Tongue region at 148°W that was transported across the Antarctic Circumpolar Current.
The second is also from Headland et al. (Reference Headland, Hughes and Wilkinson2023a, Fig. 3), which shows a large density of icebergs around Tierra del Fuego [68°S] and along southern South America, on the west to the Gulf of Penas [47.2°S], and on the east to Buenos Aires [34.5°S], and around the Falkland Islands, 530 km to the east. Hamley et al. (Reference Hamley, Gill, Krasinki, Groff, Hall, Sandweiss and Lowell2021) discuss archaeological evidence that suggests the Falklands were visited by indigenous South Americans, whom they hypothesise were in the Falklands between 1275 and 1420 CE, again suggesting a proficiency in small boats (Hamley et al., Reference Hamley, Gill, Krasinki, Groff, Hall, Sandweiss and Lowell2021). All this suggests that South American indigenous people and the Māori may have observed icebergs eight centuries ago.
Edward Davis
In 1684, the Batchelor’s Delight, a forty-gun ship seized from the Danes under the captaincy of John Cook, was approaching Cape Horn [56.0°S, 67.3°W], when on 14 February 1684 OS, they encountered a two-week storm that carried them south to 60.5°S, where they saw no icebergs (Preston & Preston, Reference Preston and Preston2005, 152 ff).
On 3 March 1684 OS (13 March 1685 NS), the wind finally shifted, and they rounded Cape Horn into the Pacific. After a year of privateering along the Pacific coast (Malt, Reference Malt1959; Preston & Preston, Reference Preston and Preston2005) and during the change of captain to Edward Davis following John Cook’s death, Wafer (Reference Wafer1699, 173) joined the ship on 27 August 1685 OS (6 September 1685 NS). In 1687, Davis decided to return to the Atlantic via Cape Horn.
An earthquake that occurred during this leg provides a check on Wafer’s reliability. While they sailed south off the coast of Peru, they experienced a massive earthquake, which as they later learned, occurred at Callao on the Peruvian coast (Wafer, Reference Wafer1699, 189–190). This quake was on 20 October 1687 NS (10 October 1687 OS). Okal, Borrero, and Synolakis (Reference Okal, Borrero and Synolakis2006) show that this earthquake was centred off Pisco [14°S, 76°W], 200 km southwest of Callao, at the boundary between the South American and Nazca Plates [14°S, −77°W], with a magnitude of 8.4–8.7, and that the resultant tsunami caused the “catastrophic destruction” of Pisco. The tsunami was also observed in Japan, with amplitudes of a few 10s of cm (Okal et al., Reference Okal, Borrero and Synolakis2006, 1634–1637).
After reprovisioning at the Juan Fernandez Islands [33.7°S, 78.9°W], the ship continued to Cape Horn. Just as in their earlier east-to-west passage, when the Batchelor’s Delight encountered a two-week storm that carried them to 60.5°S, the ship was again caught in a “terrible storm,” this one lasting about three weeks. It carried them far to the south, where because of clouds, they could not determine their latitude until Christmas Day 1687 OS (4 January 1688). At this date, Wafer gives their latitude as 62.75oS, 2.25o farther south than their previous passage. There was no longitude given, “nor did we know what course to steer, having but very indifferent seamen aboard … I remember that upon Christmas Day 1687, we were just clear of the storm, and in the latitude we mentioned, off Cape Horn (Wafer, Reference Wafer1699, 192–193).” This implies that the sky was cloud-free on Christmas Day OS, so that they could determine the latitude from a sun shot. At this position, they did not report icebergs.
A paragraph later in his book, Wafer (Reference Wafer1699, 193) repeats himself in slightly different words, saying “In all our passage round Terra del Fuego the weather was so stormy, for three weeks that we lay to the southward of Cape Horn, and the sun and stars so obscured, that we could take no observation of our latitude, yet by our reckoning, we were in very near 63°S.” This raises the unanswerable question: was their latitude on Christmas Day (OS) from a sun shot, or from dead reckoning?
Figure 1 compares a chart of the tip of the Antarctic Peninsula, a possible track of the ship in green that agrees with Wafer’s description, and the 1999–2009 iceberg trajectories in red of the Weddell Sea iceberg outflow from the Brigham Young University/National Ice Center (BYU/NIC) data set (Budge & Long, Reference Budge and Long2018; Stuart & Long, Reference Stuart and Long2011), where the smallest trackable iceberg has a length of 5–10 km (Martin, Long & Schodlok, Reference Martin, Long and Schodlok2023).
Google Earth Pro chart of the region around the northern Antarctic Peninsula, showing a hypothetical cruise track in green that agrees with Wafer’s description of the ship positions and the satellite iceberg trajectories in red. The text discusses the positions marked by the letters “A” and “B” and gives a further description. Non-commercial use of Google Earth Pro map data ©2024 and the other data sources listed on the image.
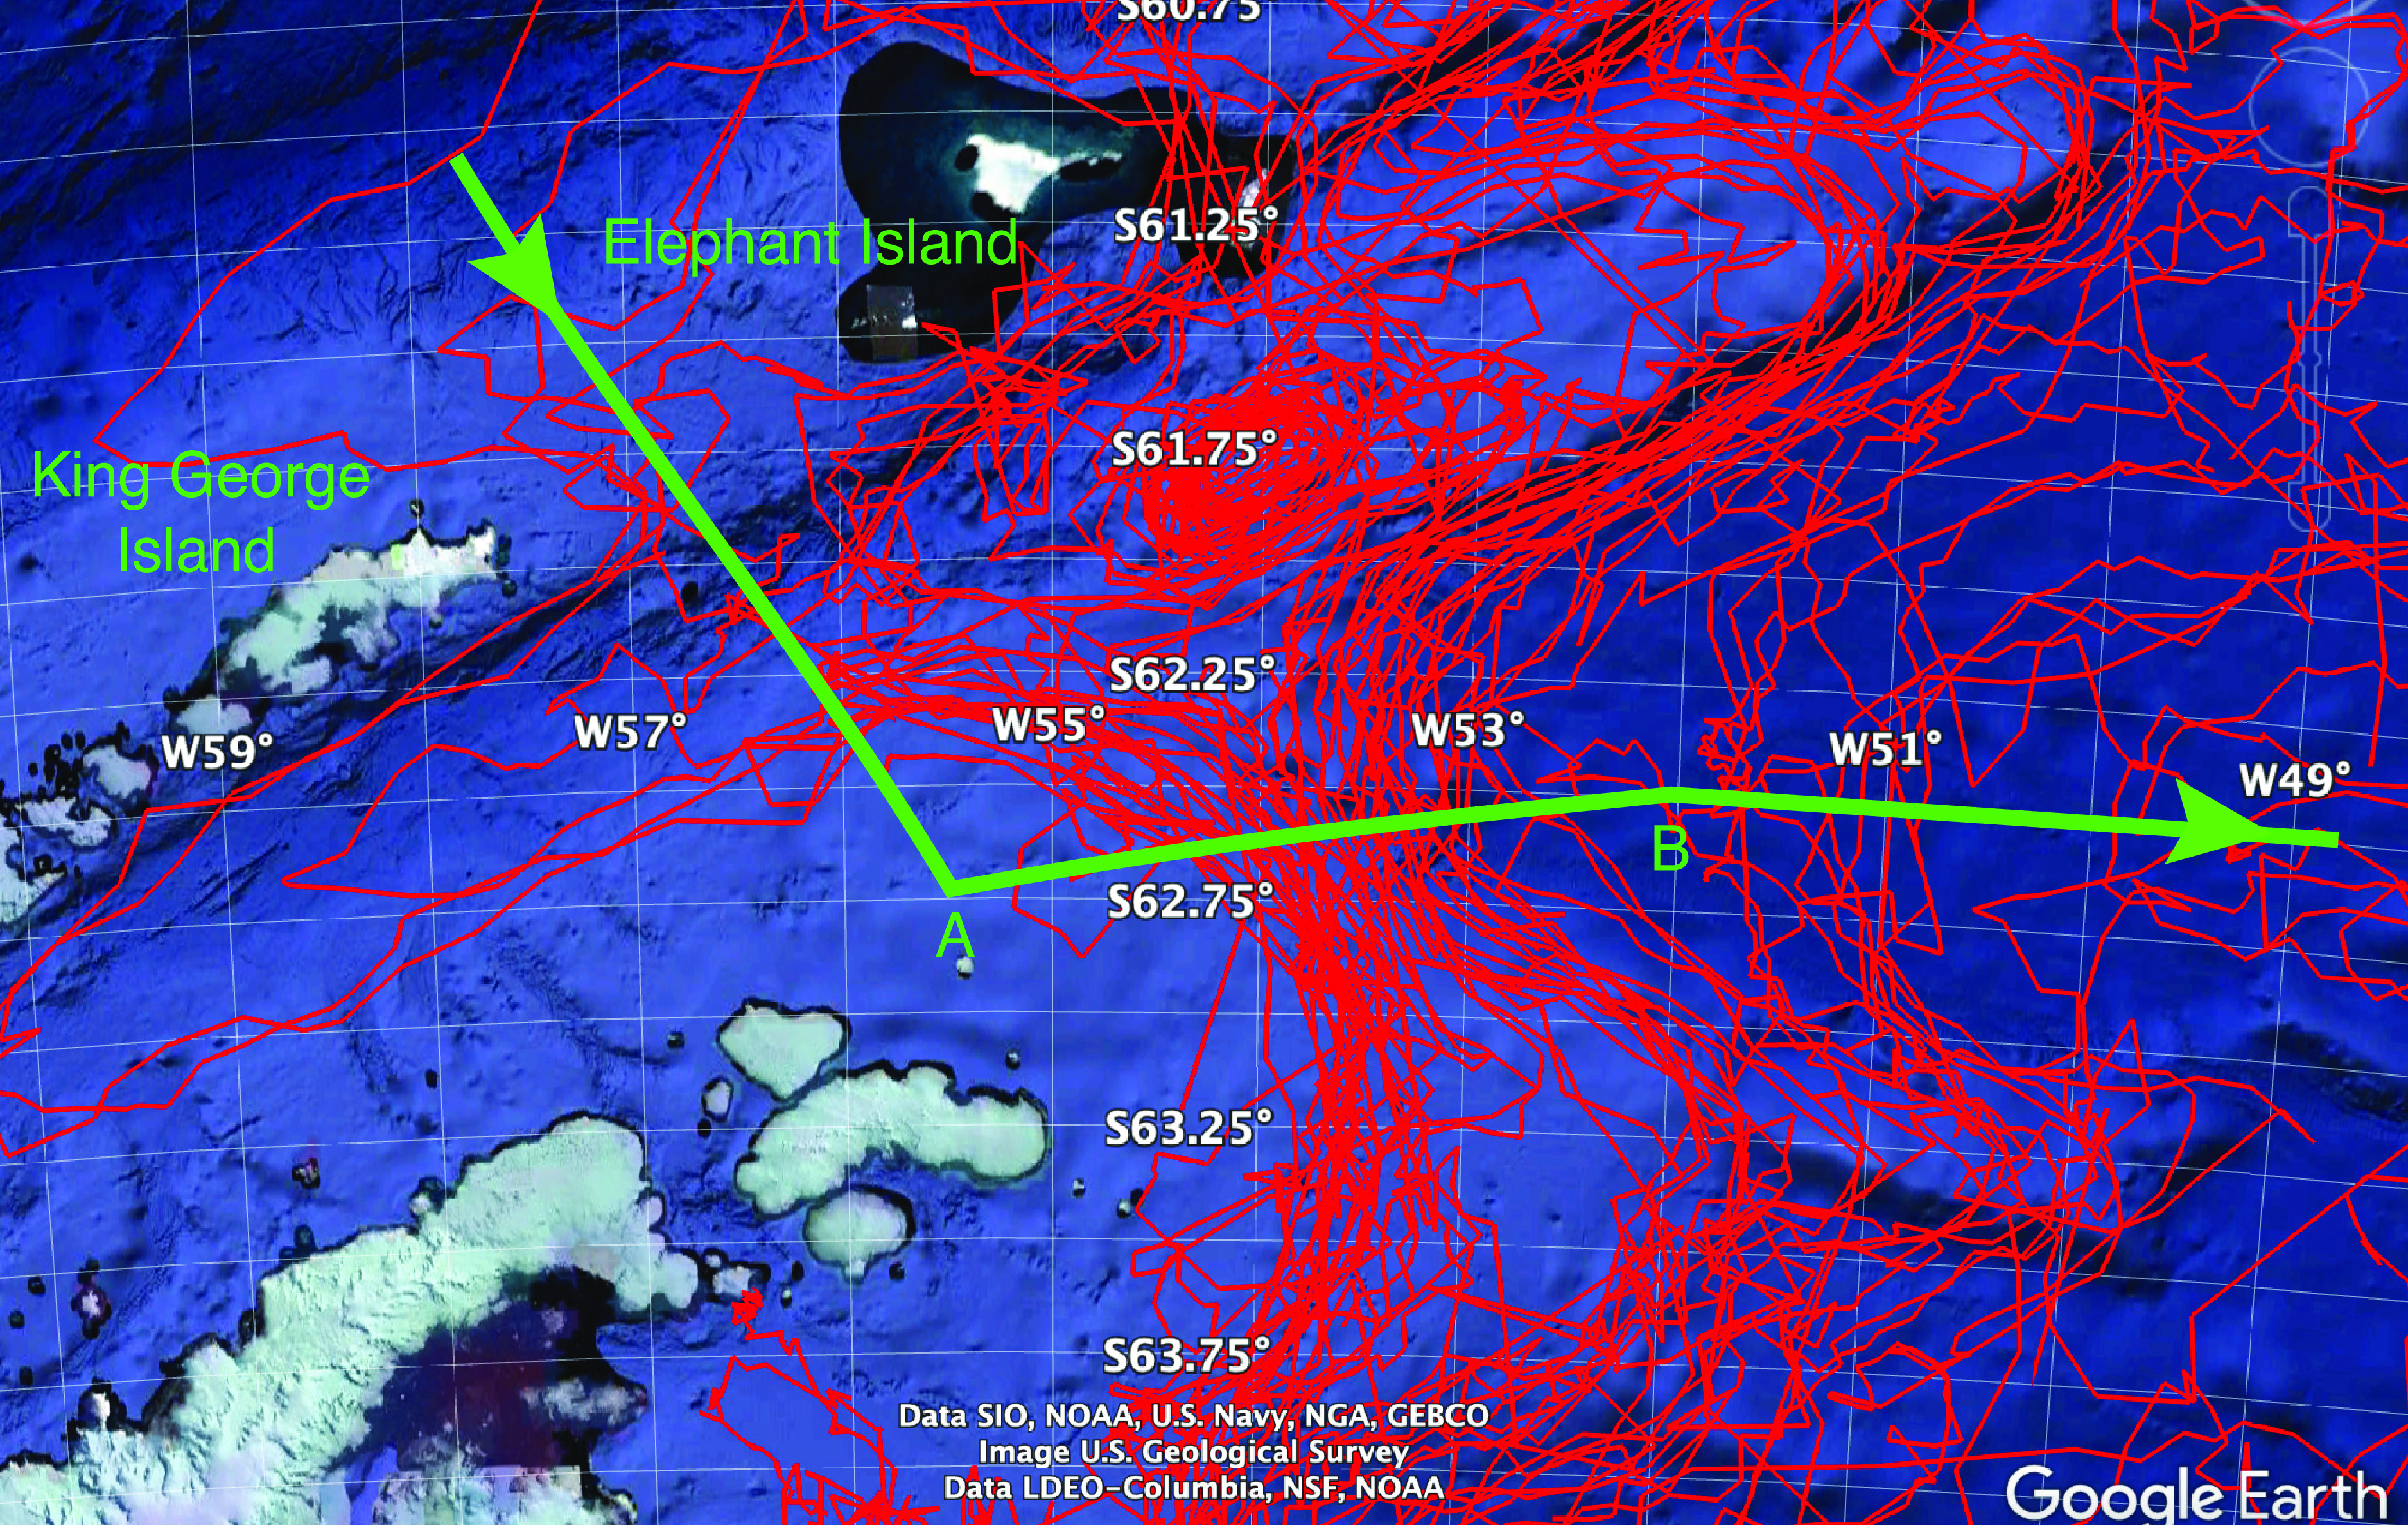
As the previous section discusses, a stream of icebergs flows north along the east side of the Antarctic Peninsula. At the northern tip of the peninsula, Figure 1 shows that this stream bifurcates, with part turning west and part continuing north, leaving an iceberg-free region just north of the peninsula at about 62.75°S, corresponding to the position of the Christmas Day 1687 OS sun shot and point “A” on the ship track.
After this measurement, Davis turned the ship to what he thought was north, and although he and the crew observed no land, they “met several islands of ice, which at first seemed to be land.” These were significant icebergs, measuring in length from half a mile or so (1 km) to “a league or two (5–10 km),” which matched the minimum resolution of the BYU/NIC data set. “The biggest seemed, as we sailed by them, which we did before the wind for several days, to be about 4 or 500 feet high (120–150 m). We sounded near them but found no ground, so that it may reasonably be concluded they were afloat; and perhaps reached as deep into the water, as their height was above it (Ibid, 193).” From Figure 1, the width of the dense iceberg plume along the ship track extended from 53.0°W to 54.3°W, with a width of 70 km.
“The islands appeared to us so plain at night, that we could easily see how to steer clear of them. But there were some which lay under water, which we could not possibly shun, but sometimes they would shake our ship, yet they never did us much damage.” The underwater ice was probably a mixture of brash and grand-piano-sized growlers that they could ride over without damaging the ship’s bottom.
After several days of sailing toward what they thought was north, at their next undated opportunity for a sun shot (point B on Figure 1), they found that their latitude had only changed from 62.75oS to 62.5oS. This corresponds to a north-south distance of 28 km, an absurdly small distance for several days of sailing. At this position, they no longer observed icebergs. Problems with their compass meant they had been sailing east, not north.
In their navigation, they assumed that their compass had a westerly variation of three points, where the classic compass has 32 points of direction, or 11.25° per point, so that three points are 34°. They later discovered that the correction should have been three points of easterly variation, meaning that their total error was 68°, so that the course they thought was nearly north (north-by-east or 11.25°), was nearly to the east (east-by-north, or 79° (Ibid, 218–219). At 62.5oS, the densest concentration of icebergs in the BYU/NIC data set lies between 53oW and 55oW.
After leaving the icebergs, they planned to sail north into the South Atlantic to the latitude of the River Plate, along which they would sail west to Buenos Aires (Ibid, 193–194). Continuing for apparently several days without correcting their compass, Wafer (Reference Wafer1699, 194) states “when we came to have a good observation, we found that we had gone to the east.” They immediately changed course and sailed north without seeing land to the latitude of Buenos Aires and the River Plate [34.6°S, 58.4°W], which meant they remained west of the South Sandwich Islands. They thought they would be ∼100 leagues (∼500 km) offshore when they reached that latitude. Instead, they were much further east at 500 leagues offshore (2,500 km) [34.6°S, 29.1°W]. This led to serious morale problems with the crew.
“After running some hundreds of leagues to the west in the latitude of Buenos Aires, and yet finding no land, our men were out of heart, fearing we were still on a wrong course, and in danger of perishing at sea through want of provisions; having little food and less water (Ibid, 194–195).” Their water supplies were restored by a rainstorm, and a flight of insects from land convinced the men they were on the right path, so they eventually reached the city.
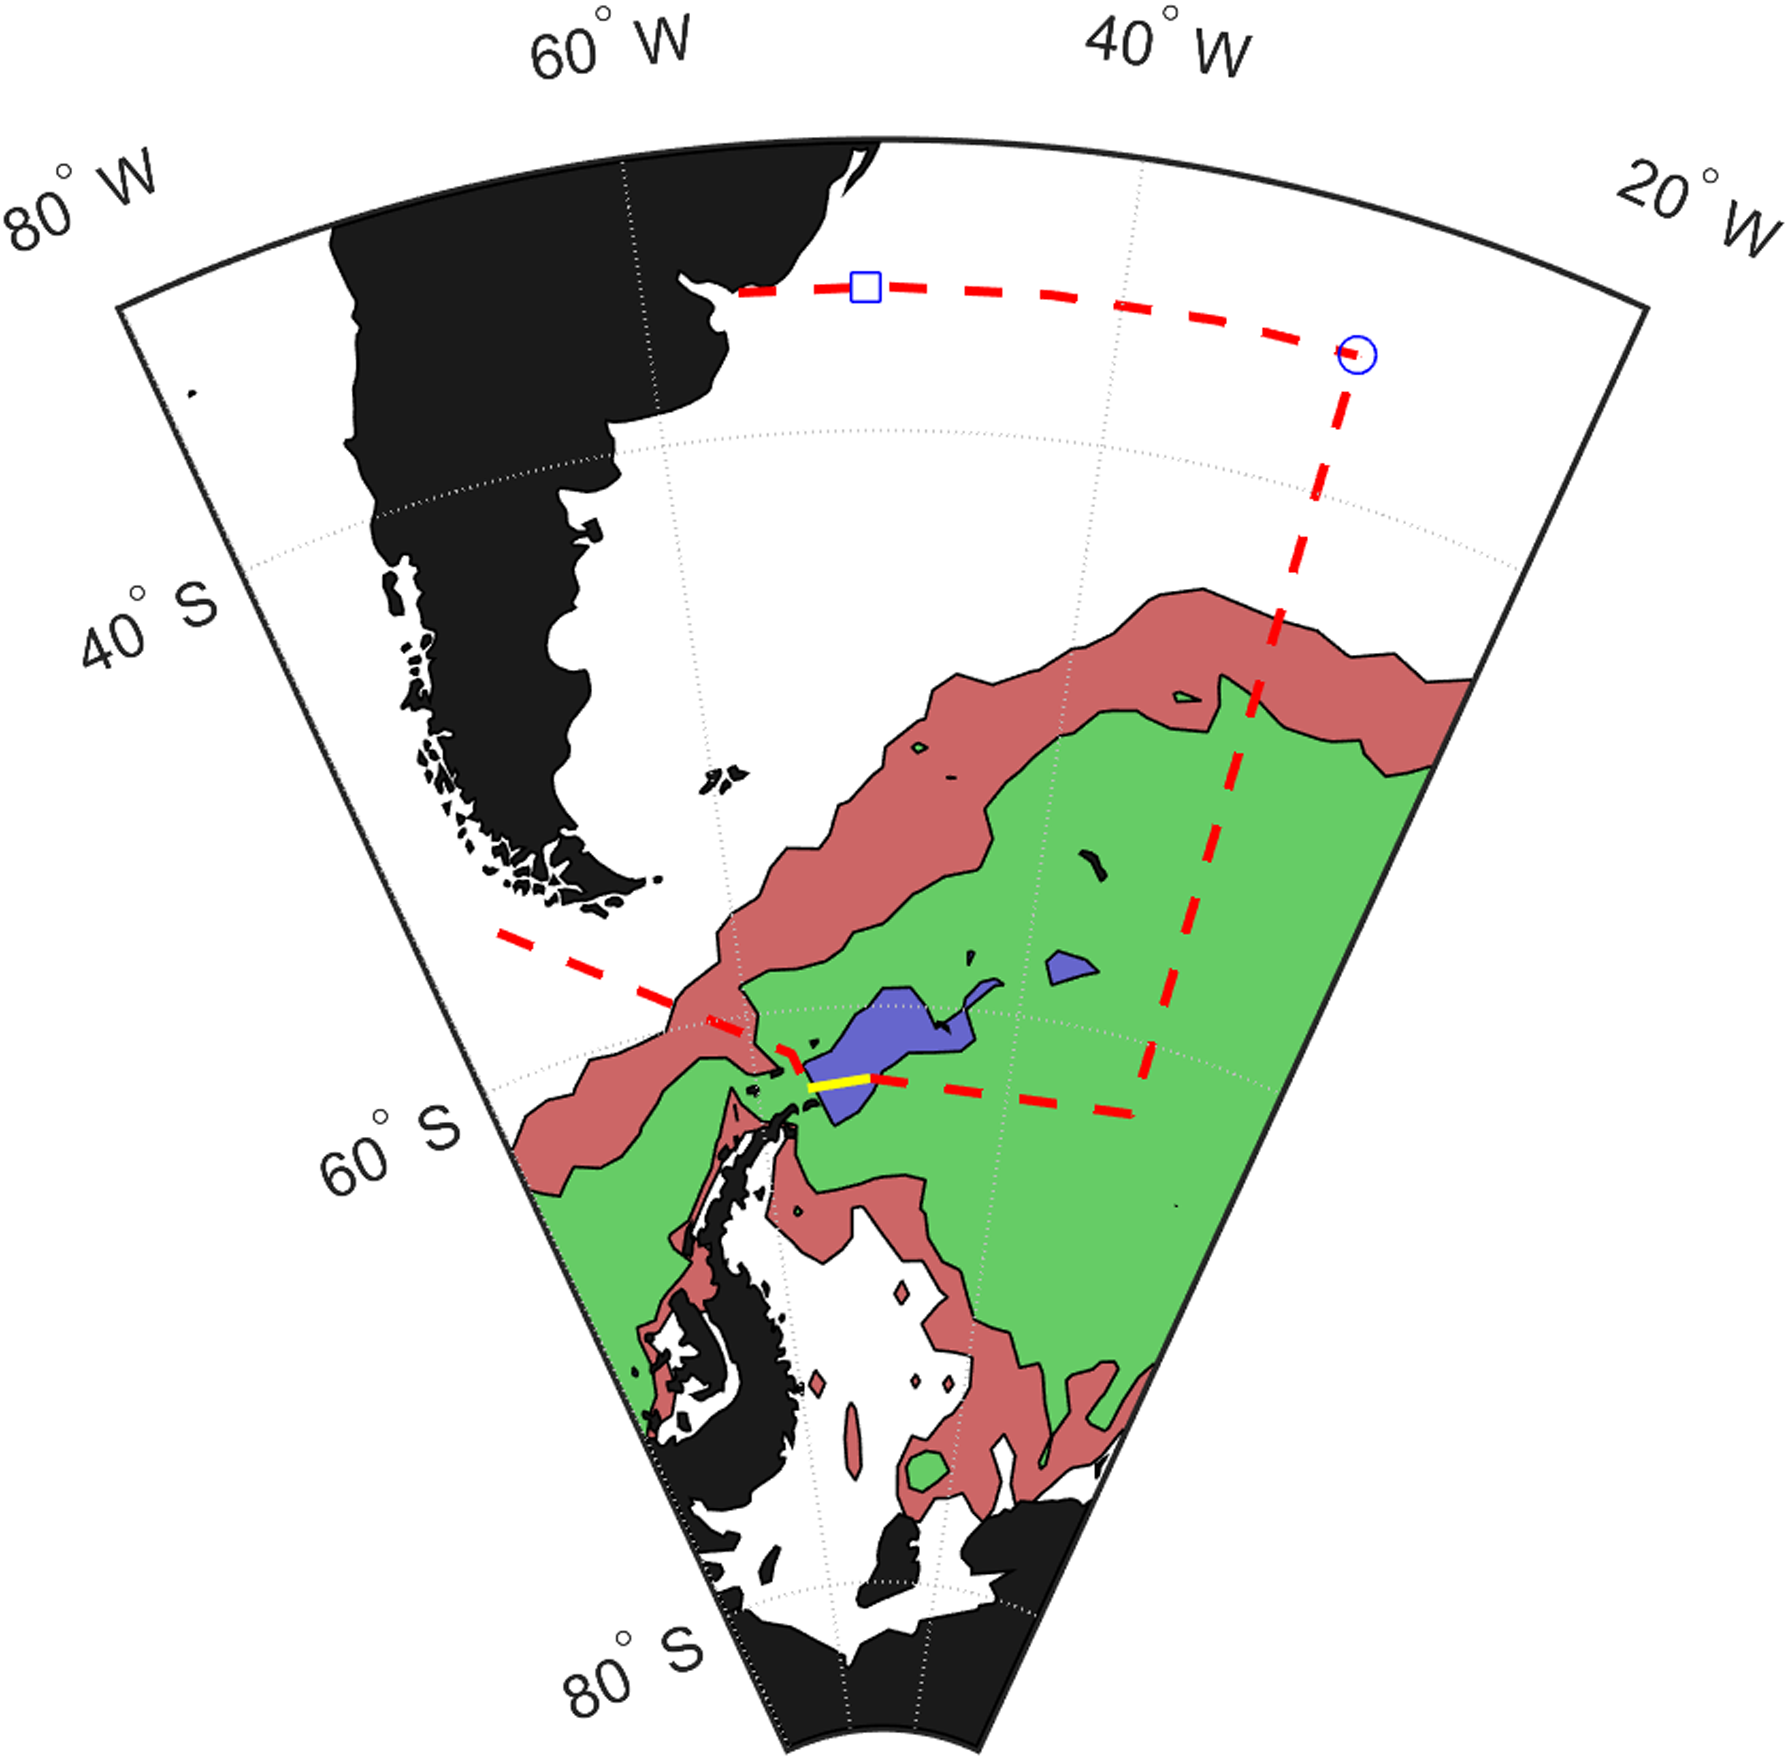
Figure 2 shows the track of the Batchelor’s Delight in red, its iceberg encounter in yellow, and the iceberg concentrations from the Altiberg iceberg data set (Altiberg, 2024; Tournadre, Bouhier, Girard-Ardhuin, & Rémy, Reference Tournadre, Bouhier, Girard-Ardhuin and Rémy2016). This altimetric-derived data set shows for 1991–2019, the probability of encountering an iceberg of more than 3-km length in a 100 × 100 km2 area. The figure shows that the ship crossed a high-probability iceberg region near the Antarctic Peninsula and then spent the rest of the journey in areas of much lower probability.
Chart of the South Atlantic and that portion of the Southern Ocean containing the Drake Passage showing the proposed cruise track for Davis (dashed red line) and the region of iceberg encounters (yellow line segment). The line at 35oS is the line of their destination at the latitude of the River Plate and Buenos Aires, the square shows their proposed waypoint, the circle their actual. The contours show the Altiberg (2024) probability of encountering an iceberg in a 100×100 km2 area, with the outer contour of 0.003% (brick-red), middle contour of 0.03% (green) and inner contour of 0.3% (blue), and black for land. See text for further description.
Edmond Halley
In March 1693 OS, the 36-year-old astronomer Edmond Halley and his colleague Benjamin Middleton submitted a one-page proposal to The Royal Society of London. This asked the society for help in obtaining a small vessel from the British Admiralty that they would use in a global oceanic survey of magnetic declination. Halley argued that a knowledge of this phenomenon might provide a way to determine longitude at sea, a problem of critical importance to the Admiralty (Thrower, Reference Thrower1981, 29–30; Morant, Reference Morant2014).
Halley was a trained scientist and a prodigy. At age twenty while he was at Oxford and before completion of his degree, he had sailed with an assistant to St. Helena in the South Atlantic, where he set up an observatory to map the southern sky. On his return, he received his degree by royal mandate, and at age 22, was elected a Fellow of the Royal Society. Halley was young, vigorous, and adventurous, and eager to perform the measurements. On 12 April 1693 OS, the President of the Society, Sir Robert Southwell, issued a letter that “promised to use his endeavours towards obtaining such a vessel (Thrower, Reference Thrower1981, 251).” With the additional endorsement of Queen Mary and the Treasury, on 12 July 1693 OS, the Admiralty ordered that a vessel be built at the Deptford yards (Ibid, 251–253).
An invaluable resource for Halley’s voyages is the book by Norman Thrower, published in 1981, titled The Three Voyages of Edmond Halley in the Paramore 1698–1701. It contains a detailed description of Halley’s preparation for his voyages, annotated copies of his logbooks, the related Admiralty and Royal Society documents, and a separate folio containing three charts.
By April 1694 OS, the ship, a small three-masted square-rigger named the Paramore and a member of a class of coastal vessels called “Pinks,” was ready for launch. It had a 16-m deck length, a 6-m width, a 3-m draft, and a 13-m main mast height (Ibid, 254). It carried about twenty people. It was an odd choice for a deep-water voyage, because it was designed for work in shallow water and had a flat bottom. This made the Paramore “leewardly,” meaning when it sailed close to the wind, it slipped downwind, not the best behaviour for an iceberg encounter (Ibid, 31, 44).
Two years later, the Admiralty commissioned Halley as “Master and Commander” in the Royal Navy, an unusual position for someone who had not advanced through the ranks. Beginning in October 1698 OS, with the scope of his voyages now limited to the Atlantic, Halley made three voyages on the Paramore, two in the Atlantic and one in the English Channel. At this time, even though ships were sailing around the Cape of Good Hope and through the Straits of Magellan, the central region of the South Atlantic remained unexplored. Before his first voyage, the Admiralty, with their archaic spelling modernised, directed Halley “to stand … into the south, till you discover the coast of Terra Incognita, supposed to lie between the Straits of Magellan (54oS) and the Cape of Good Hope (34oS) (Ibid, 268–269).”
Alexander von Humboldt later stated that Halley’s voyages were the first to be undertaken for purely scientific reasons (Ibid, 15–16, footnote 1, 69). Halley’s success in obtaining funds and a ship for his work set a precedent that continues to the present, where large-scale science depends not only on government funding but on the approval of a national society or academy.
Halley’s first voyage began on 20 October 1698 OS (30 Oct 1698 NS) and ended prematurely on 12 June 1699 OS (22 June 1699 NS), with most of his time spent in the North Atlantic. It ended because although Halley had the rank of captain, the first lieutenant and other officers were insubordinate and in one case disobeyed his orders. One reason for their treatment of Halley was the bitterness generated among the officers by Halley’s appointment as captain, rather than his coming up through the ranks. Although these officers were acquitted in the subsequent court-martial, they received a severe reprimand (Ibid, 286). Despite these disciplinary issues, the Admiralty agreed to support Halley’s second voyage. As Section 4 shows, about 70 years later, this event influenced the Admiralty’s choice of James Cook for his epic voyages.
Before his second voyage, Halley wrote a letter to the Admiralty that “entreated” the Navy Lords to issue new orders that included a directive not only to search for new lands between the straits and the cape but for reasons not clear from the record, to search specifically between 50o and 55oS (Ibid, 299–300). The Admiralty obliged. His new orders directed Halley that if he did not find land at lower latitudes, to explore the “unknown southlands” in the South Atlantic within his desired latitude band and asked him to map any unknown lands and make observations of any undiscovered islands (Ibid, 300–302). The unintended consequence of these new orders was to direct him into the stream of icebergs that flows out of the Weddell Sea.
The daily entries in Halley’s journal use the OS calendar and nautical time. The nautical day runs from noon to noon, so that the nautical day of 10 February, for example, begins at noon on 9 February civil time and ends at noon on 10 February civil time. In the following and to match his log, Halley’s descriptions and positions below are in nautical OS time, with the NS dates in parentheses.
Halley’s second voyage began on 16 September 1699 OS (26 Sept 1699 NS), when he left England with a new crew. After stopping in Rio de Janeiro in December to replenish supplies, on 29 December 1699 (6 Jan 1700), they sailed southeast into the central South Atlantic. Except for cloudy days, when latitude was estimated from dead reckoning, Halley determined it from sextant observations of the sun at local noon; because there were no marine chronometers, the daily longitude was determined by dead reckoning from an estimation of the distance travelled each day from a known longitude, in Halley’s case, Rio de Janeiro. The accuracy of the solar latitude determination from a sextant is about 10 km, his longitudinal accuracy is unknown.
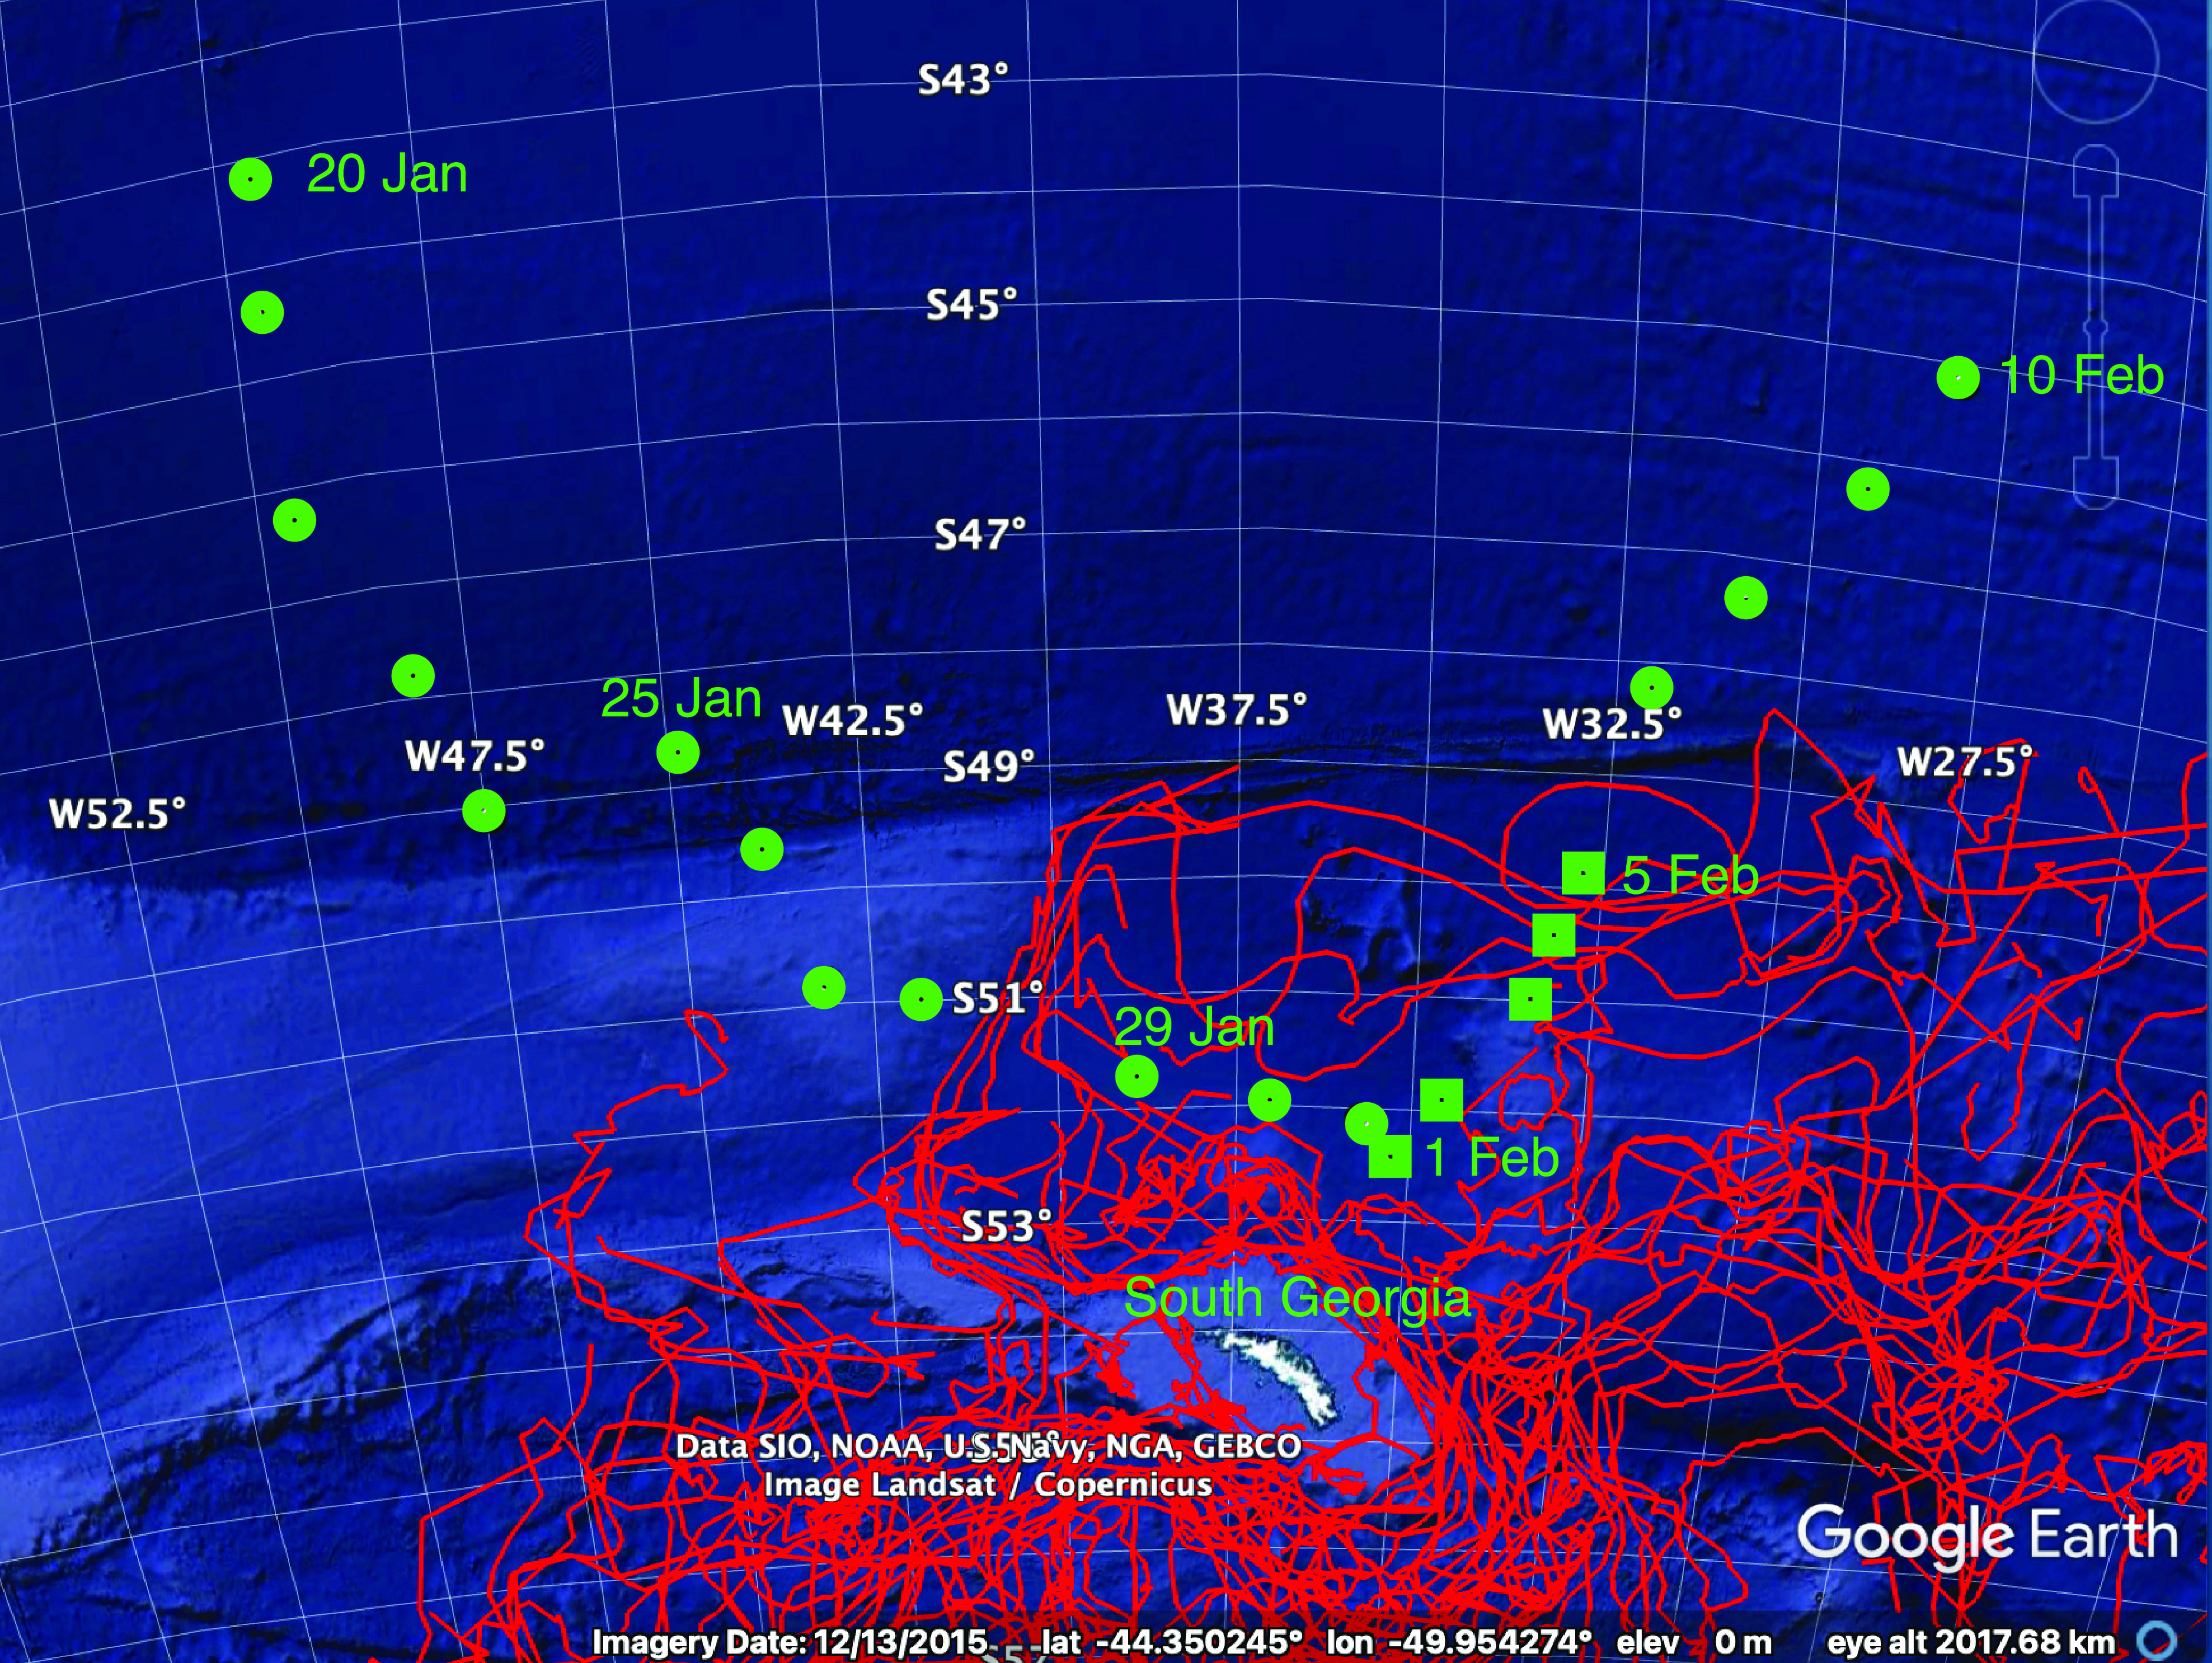
For 20 January–10 February 1699 OS (20 Jan–20 Feb 1700 NS), Figure 3 shows Halley’s daily positions listed in Table 1 of the supplementary material, and the 1999–2009 BYU/NIC iceberg trajectories of the Weddell Sea iceberg outflow. The figure shows his approach to South Georgia, and his iceberg encounters on 1–5 February OS.
Google Earth Pro chart of region around South Georgia, showing Halley’s positions during his approach. The circles show his daily positions in iceberg-free waters; the squares, his iceberg observations; and the red lines, the 1999–2009 BYU/NIC iceberg trajectories. The dates adjacent to the symbols are for 1699 OS, corresponding to Halley’s logbook. See text for further description. Non-commercial use of Google Earth Pro map data ©2024 and the other data sources listed on the image.
Halley’s approach to the icebergs
As he sailed southeast out of Rio de Janeiro, the weather on his traverse remained warm until 25 January 1699 (4 Feb 1700) when at 48.7oS, he noted “it was so cold as to be scarce tolerable to us used to warm climates.” In the afternoon, strong southwesterly winds forced them to sail northeast. A day later at 49.6oS, “it was so cold upon deck…that it froze in the wind…,” which he found “extraordinary in the height of summer.” At the height of the austral summer and the southern equivalent latitude of London [51.5oN], his log entries show he was bewildered by the cold (Ibid, 157–161).
This decrease in temperature was probably due to the Paramore transiting the Antarctic Circumpolar Current (ACC) (Thompson, Reference Thompson2008). The 1,000-km wide Drake Passage between the Antarctic Peninsula and South America allows the ACC to circle the globe. The ACC is 25,000-km long, with characteristic speeds of 0.5 m s−1, a volume flow of 170 × 106 m3 s−1, and widths of about 1,000 km (Thompson, Reference Thompson2008). In the South Atlantic, it lies between 40oS and South Georgia. The ACC separates the warm temperate waters to its north from the cold polar waters to the south. One effect of the current and its frontal systems is that the ocean surface temperature does not decrease uniformly toward the pole; instead, and consistent with Halley’s observations, the temperature remains at moderate values north of the ACC, decreases sharply across it, and approaches freezing south of it.
On 27 January 1699 (6 Feb 1700) at 50.8 S, he crossed 50oS and “ordered the crew to steer …ESW (112.5°) till I obtain the latitude of 55oS, being the limit prescribed in my particular instructions.” He gave his men a full ration of rum “while the cold lasts.” On 28 January 1699 (7 Feb 1700) at 50.4oS, there were gales with heavy fog. On 29 January 1699 (8 Feb 1700), in more fog, he experienced “ …very cold–misty rainy uncomfortable weather…”
On 30 January 1699 (9 Feb 1700) at 51.9oS, during strong below-freezing winds, Halley wrote that the combination of the weather “in these cold tempestuous climates” and their exposure to the sun could endanger his men’s health, “who are all very tender by being so long near the sun.” On 31 January 1699 (10 Feb 1700) at 52.1oS, even though the weather was sunny, it remained below freezing with “no abatement of the cold.”
The iceberg encounters
On 1 February 1699 (11 Feb 1700), Halley reached his furthest south of 52.4oS, just north of South Georgia [54.4oS, 36.6oW]. In the afternoon, Halley sighted what appeared to be three large white islands, flat on top, bordered by vertical cliffs and covered with snow (Figure 4).
Halley’s sketch of the three icebergs. “NE, E, ESE” are compass directions, “A, B, C” identify the different icebergs. Redrawn from Halley’s log with scale added (Ibid, 162). This is the first known sketch of Antarctic tabular icebergs.

Although their height suggested they were land, there were no signs of “any tree or green thing on them.” The largest, “B,” measured 9 km at its waterline, and its 60 m height loomed over the ship. His men noted the resemblance of the islands to the vertical chalk cliffs of the southeast English coast and named island “A,” Beachy Head. Halley described the ice as follows: “The cliffs…were full of blackish streaks which seemed like a fleet of ships… (Ibid, 162).”
In the evening of 1 February 1699 (11 Feb 1700), the winds came up accompanied by fog, so Halley, worried about being blown onto the icebergs, kept his distance. The next morning, the fog lifted, and Halley approached them. In bright sun, he observed that island “A” consisted entirely of ice “of an incredible height.” Given his fear of the Paramore being destroyed, he abandoned his goal of reaching 55oS and began to sail north. As Figure 3 shows, this kept him in the region of large iceberg concentrations.
Halley provided more information on this encounter in a letter to the British Admiralty, written two months later from St. Helena, and dated 30 March 1700 (9 April 1700): “We fell in with great islands of ice of so incredible a height and magnitude that I scarce dare write my thoughts, at first we took it for land with chalky cliffs, and the top all covered with snow, but we soon found our mistake by standing in with it, though it could not be less than 200 feet high [60 m] and five miles [9 km] in front…[We] could not get ground in 140 fathom [260 m] [of water].
It was nothing but ice… Yet I conceived it was aground, ice being … little lighter than water and not above an eighth part above the surface when it swims. It was then the height of summer, but we had no … sign of it but long days; it froze both night and day, whence it may be understood how these bodies of ice are generated being all ways increased and never thawing (Ibid, 306–307).” From current ocean bottom bathymetry, the water depth at the position of this iceberg encounter is 3,940 m, so the icebergs were not grounded (GEBCO, 2024).
For comparison with modern observations, Figure 5 shows a 10 December 2018 photograph of tabular iceberg A-57A as named by the US National Ice Center and taken in the Bransfield Strait between the South Shetland Islands and the tip of the Antarctic Peninsula. Unlike Halley’s icebergs, A-57A has a known origin. Satellite images showed that in 2008, it calved from the Ronne Ice Shelf, and remained adjacent to the ice shelf until 2014, when it began its northward drift (Schuman, Reference Schuman2019).
Iceberg A-57A taken on 10 December 2018 at 62.5oS, 56.9oW from the cruise ship Seabourn Quest in the Bransfield Strait region of the northern Antarctic Peninsula (Courtesy CT Productions, www.wearectproductions.com, with permission).
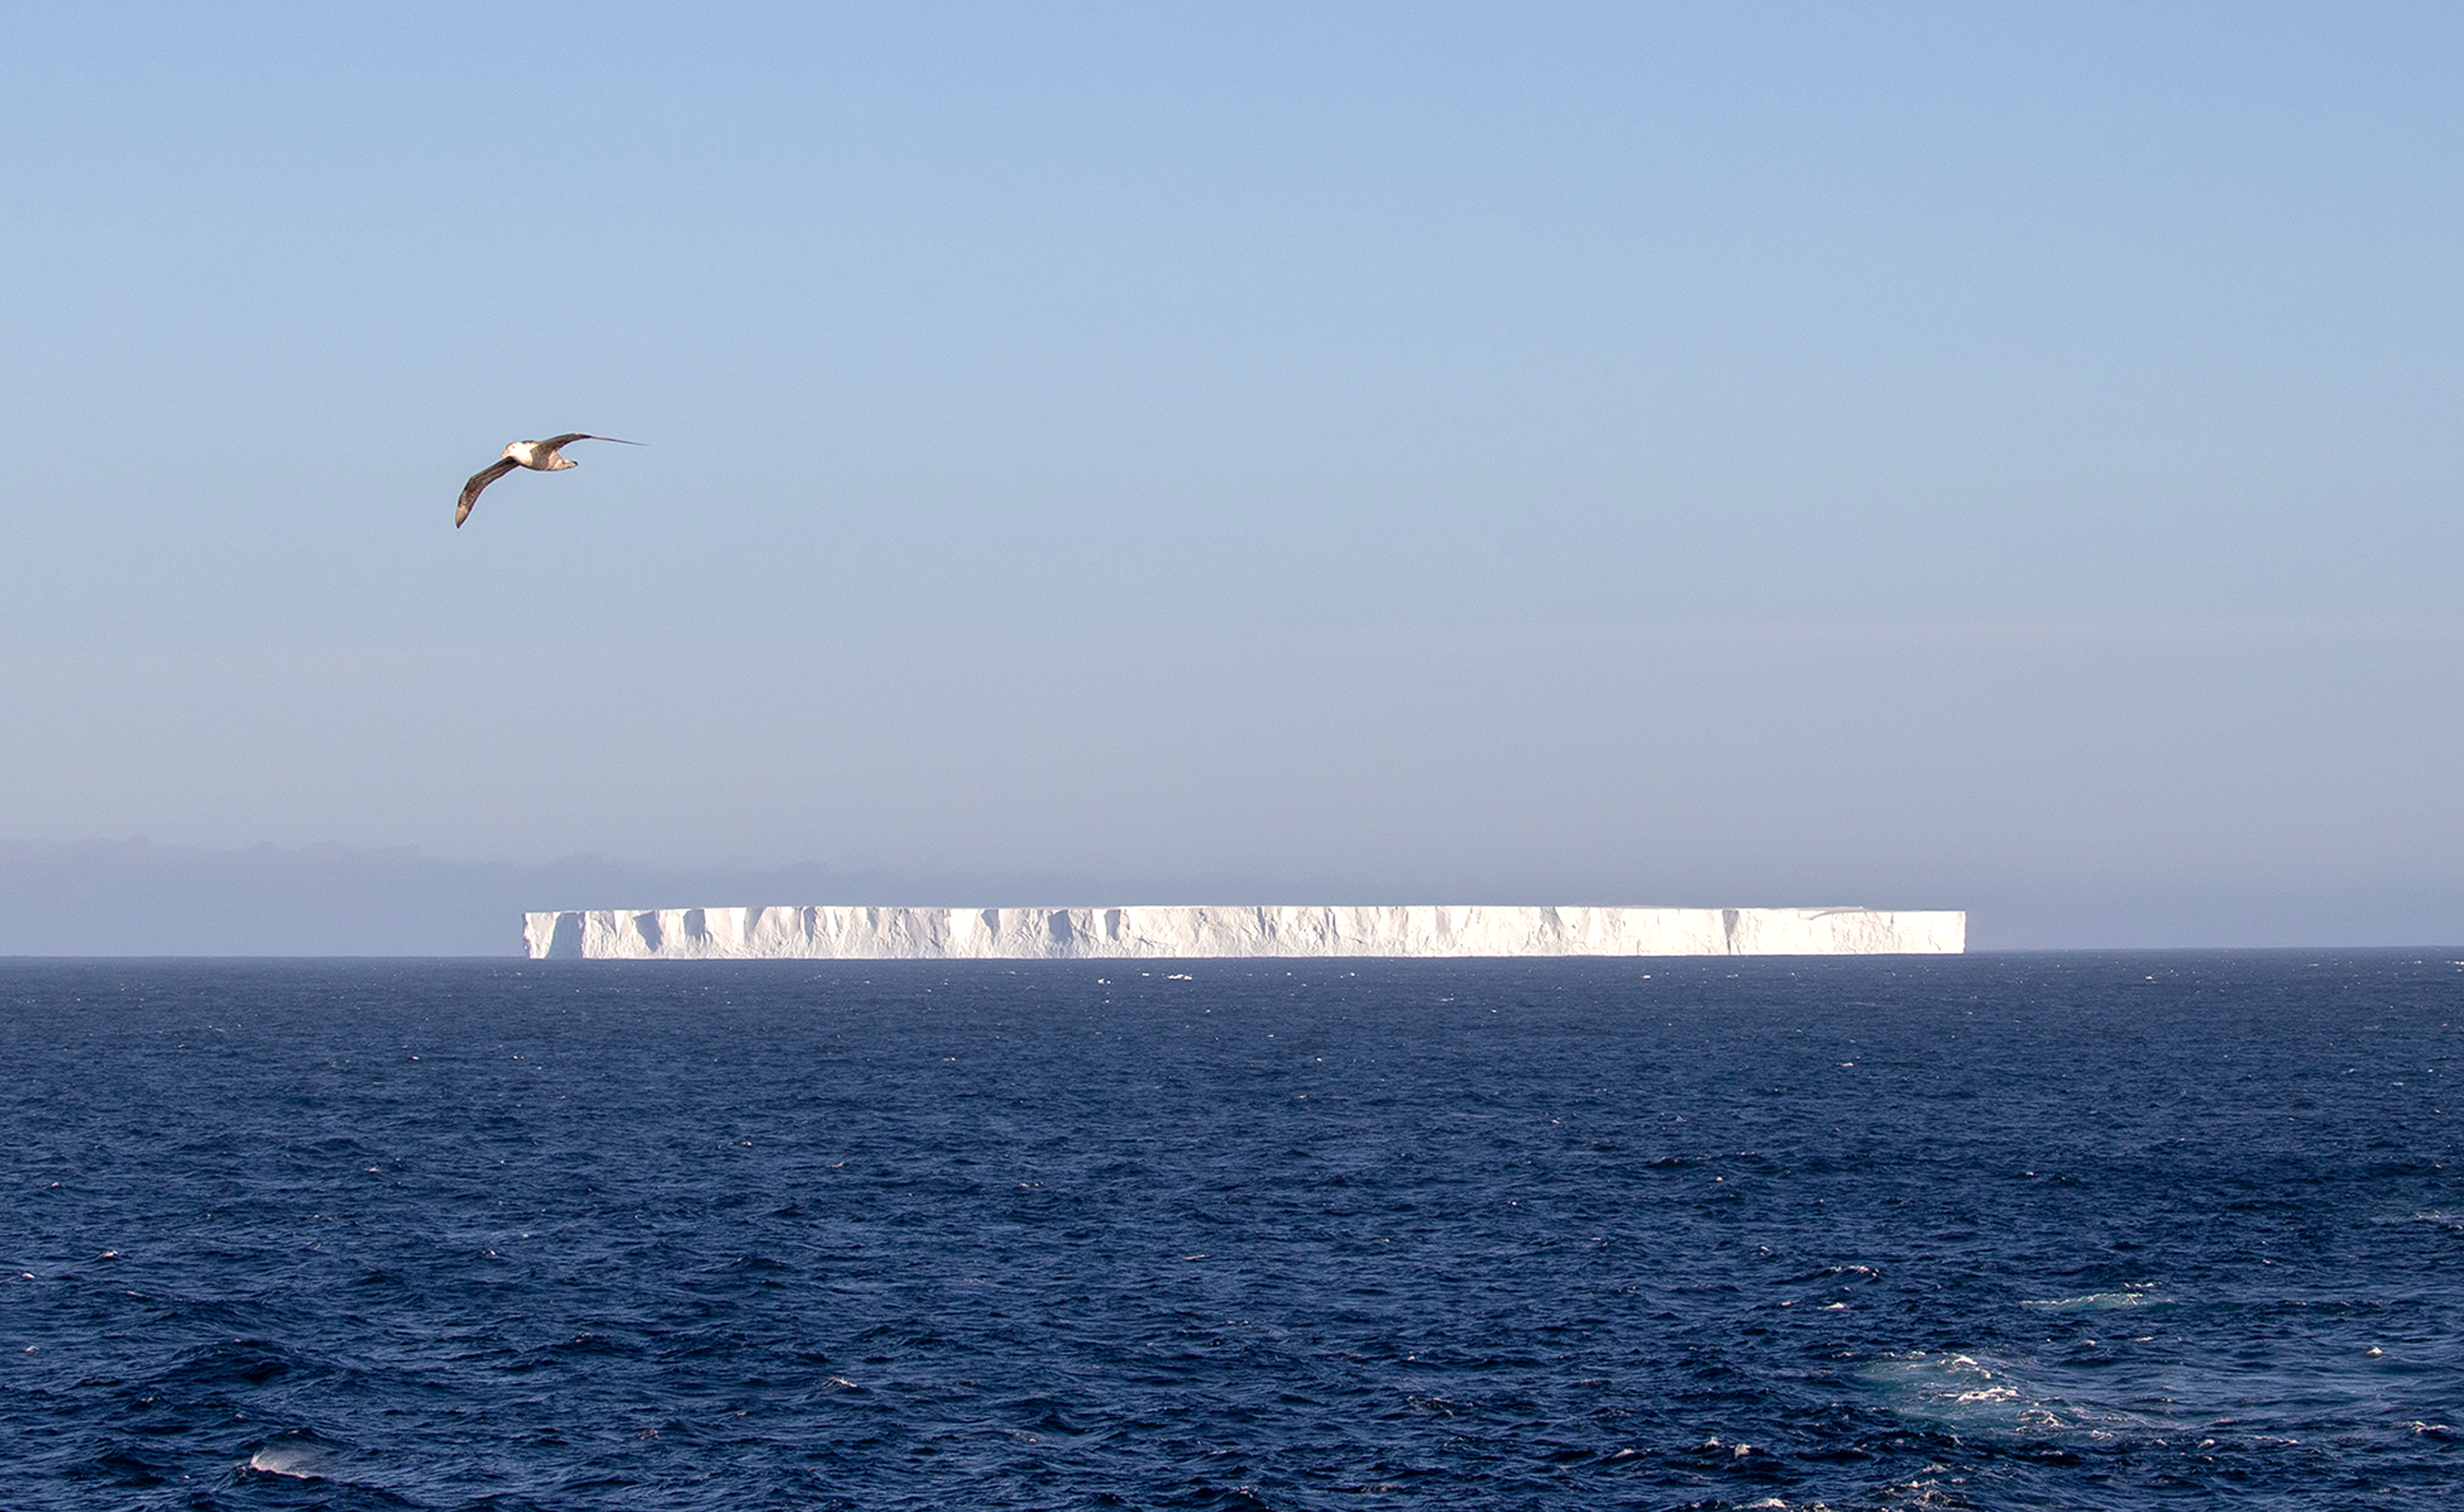
A coincident satellite image from 10 December 2018 showed that A-57A measured 26 km long, 6 km wide, and from its estimated 40 m above-waterline height or freeboard, was about 300 m thick, consistent with its origin. The photograph shows the flat top and steep sides characteristic of tabular icebergs, as well as the dark vertical shadings shown in Halley’s sketch.
In the evening of 2 February 1699 (12 Feb 1700) at 51.9oN, because of poor visibility, thick fog, and their fear of striking an iceberg, the Paramore stopped sailing north. Between 11 and 12 pm that night, their most frightening experience occurred when in a ship that tended to slip downwind, they found themselves surrounded by icebergs in such a thick fog that they could see no further than 200 m.
Then a “mountain of ice,” a giant wall with a height at least twice that of the ship, loomed out of the fog at their bow. When they tacked to avoid it, another iceberg appeared directly ahead, and they tacked again. Less than a quarter of an hour later, a third iceberg appeared at their bow, and to avoid being blown against it, they tacked once more, and in Halley’s words, “got clear: God be praised (Ibid, 164).”
In the afternoon of the next day, 3 February 1699 (13 Feb 1700), at 51.0oS, they encountered an abundance of large and small pieces of ice, “as hard and white as alabaster,” which Halley feared would strike the ship. Because of dense fog that evening, he kept all crew members on watch, but they saw no ice until close to noon, when “a great high island passed us to windward.” On 4 February 1699 (14 Feb 1700) at 50.4oS, they passed three icebergs to their east. Finally, in the afternoon of 5 February 1699 (15 Feb 1700) at 49.9oS and to their east, they saw their last iceberg, after which a southerly gale carried them far enough north to reach iceberg-free waters (Ibid, 164).
Consequences of Halley’s discoveries
Halley believed that although he had been unable to sound the ocean depth, the ice islands were grounded. He argued that the islands of ice were stationary, accreted ice from the cold weather at the height of summer, and with no evidence whatsoever, were touching the bottom. Thrower (Reference Thrower1981) speculates that Halley’s refusal to see these ice islands as floating, rather than fixed to the bottom, and to ignore the possibility that they may have drifted over a great distance may have been due to his desire to have fulfilled his Admiralty orders and discovered new lands (Ibid, 306, 315). In any case, Halley missed the opportunity to infer from these large drifting icebergs, the presence of the vast ice-covered continent to the south.
Halley also failed to publish his logbooks. Although in 1700, Halley described his discovery of the ice islands in a letter to the Admiralty and in a communication to the Royal Society, it was not until 1773 that the geographer Alexander Dalrymple published Halley’s logbooks of his first two voyages (Ibid, 69). These appeared after Captain James Cook departed on his second voyage, the Antarctic circumnavigation, and were too late to affect Cook’s planning.
Halley had one important effect on Cook’s expedition. In 1767, the Admiralty decided to send a ship to the South Pacific to observe the 1769 transit of Venus. Its purpose would be to refine the distance of the earth from the sun. The leading candidate for the command of this expedition was the same Alexander Dalrymple who was to edit Halley’s journals, whom the Royal Society endorsed.
Dalrymple made the condition that for him to take the job, he must have the rank of captain. The First Lord of the Admiralty Sir Edward Hawke refused this request, saying “he would rather cut off his right hand than give command of a Navy vessel to someone not educated as a seaman.” Hawke’s objection to Dalrymple was based on the insubordination and refusal to take orders that Halley experienced from his officers in 1699. The candidate who was acceptable to both the Royal Society and the Admiralty was the cartographer and naval officer James Cook, who subsequently commanded two of his three voyages, and before his death in Hawaii, part of the third (Kerr, Reference Kerr1815).
Conclusions
The authors describe two early observations of Antarctic icebergs, one just north of the Antarctic Peninsula by Davis, the other north of South Georgia by Halley. Both sets of observations were within Weddell Sea outflow. The tabular shape of the icebergs that Halley recorded and sketched is consistent with modern observations. Halley’s largest error was to assume his icebergs were grounded, perhaps due to his desire to satisfy the Admiralty’s desire to discover new lands. Davis correctly assumed the icebergs were floating, provided no longitude observations, and his observations are consistent with an east-west traverse across the stream of icebergs that exit the Weddell Sea.
Supplementary material
To view supplementary material for this article, please visit https://doi.org/10.1017/S0032247425000026
Data
The BYU/NIC data can be downloaded at www.scp.byu.edu/iceberg. The supplementary material gives Halley’s daily positions during the iceberg encounter. The Altiberg data can be downloaded at the ftp site described at https://cersat.ifremer.fr/fr/Data/Latest-products/Altiberg-a-database-for-small-icebergs
Acknowledgments
The authors thank Chris Schuman for providing the identification and origin of tabular iceberg A-57A. S. M. thanks Kate Morant for her help with Halley’s journals, and David Long for the iceberg time series in Figures 1 and 3. They also thank editors Hester Jiskoot and Trevor McIntyre for their help and three anonymous reviewers for their comments.
Author contributions
S. M. and G. B. conceived of the study, S. M. digitised the Halley iceberg data and did most of the Halley analysis, G.B. initiated the Davis analysis and prepared Figure 2. Both authors contributed to the analysis and writing of the manuscript.
Financial support
For G. B., the analysis, preparation, and publication of this paper were partly funded by a Leverhulme Trust Emeritus Fellowship to G.B. (grant no. EM-2022-042). For S. M., his work received no grant from any funding agency, commercial, or not-for-profit sectors.
Competing interests
The authors declare none.


 Open access