

Introduction
Coat colour and patterning in animals is dependent on the relative concentrations of black eumelanin and brown pheomelanin synthesised and secreted into the medulla of the growing hair shaft by melanocytes (Ortonne and Prota, Reference Ortonne and Prota1993). Based on these two pigments alone the diversity of colours is considerable, ranging from pure black, through shades of brown, red and yellow to, in some cases, a complete absence of functioning melanocytes, yielding a white coat. The biosynthetic pathway for the two types of melanin is initially shared, the pathways subsequently diverging as pheomelanin phenolic intermediates become conjugated with cysteine. As such, both pigments are derived from a common precursor, namely tyrosine. This amino acid can stimulate melanogenesis, as shown by Slominski in Reference Slominski1989. Tyrosine can be sourced directly from the diet, or generated by the hydroxylation of the essential amino acid phenylalanine (Schallreuter, Reference Schallreuter, Kothari, Chavan and Spencer2008). Other co-factors are known to be important in the biosynthesis of melanins, such as cysteine, glutathione and copper. Copper is a metal ion cofactor for tyrosinase, the critical regulatory enzyme for melanogenesis (Hearing and Jiménez (Reference Hearing and Jiménez1987). Therefore, although hair colour is fundamentally determined by genetics, there is still the potential for nutrition to play a significant role in its expression. Previous work has demonstrated this influence in both cats and dogs. A number of studies have been conducted which illustrate the importance of nutrition to pigmentation in black animals. Morris et al. (Reference Morris, Yu and Rogers2002) showed that feeding a diet with reduced levels of Phe and Tyr to black kittens resulted in the development of red coats which then reverted to black when they were returned to their original diet of commercial pet food. The dietary requirement of these two amino acids for maintaining a completely black coat was twice that needed to ensure normal kitten growth (Anderson, Reference Anderson, Rogers and Morris2002). Similarly, Watson et al (Reference Watson, Servet, Hervera and Biourge2015) showed that if the concentration of total Tyr was raised from 1.5 to 2.4 g/Mcal, and total Phe from 2.5 to 3.4 g/Mcal there was a significant reduction in the degree of reddening of puppies' coat after four months of feeding, as detected by spectrophotometry.
A further anomaly of canine hair colour, often observed in white breeds, is an aberrant reddening or yellowing colouration of the coat. This phenomenon has been associated with seasonal changes, moulting and hair treatments, although there is little scientific evidence to support any of these associations directly. A further possibility is that nutrition again plays a role. However, a link between nutrition and the discoloured ‘reddening’ of white coats in dogs has not previously been made. This trial was conducted to examine if, by controlling intake of Tyr/Phe and copper towards the lower end of the currently recommended daily intake for adult (NRC, 2006; 2.23 g/Mcal Phe/Tyr; 1.8 m g/Mcal copper), it was possible to reduce the level of red pigmentation in the coat of white dogs. Spectrophotometry was used to detect changes in the amount of pigmentation of the hair coat, and questionnaires used to assess owners' subjective opinion of hair colour.
Materials and methods
The study group consisted of 26 healthy Swiss white shepherd dogs (11 male, 15 female), between two and eight years old, recruited from five breeders across France. Bitches were not pregnant during the study, and no clipping, stripping or shaving of the dogs' coat was permitted for the duration of the trial. Washing with water was permitted to clean the coat however. Dogs were split into two groups of 13; the allocation process was primarily designed to balance the two groups for sex and age, as well as ensuring that, as far as possible, an equal number of animals could be fed each of the two diets at each participating breeder location. The feeding period lasted for four months, with the aim of incorporating a cycle of hair shedding/regrowth, i.e. shedding of the winter coat and re-growth of the summer coat (March-July), thereby allowing changes in pigmentation to occur. One group of dogs were fed exclusively on the control diet and the other group exclusively on the test diet. The nature of the two diets was blinded to the breeders. Diet design was based on the need to provide carefully controlled levels of biochemical precursors Phe + Tyr (Table 1: Control 4.82 g/Mcal; Test, 3.02 g/Mcal) and a cofactor (copper levels in Control were13.28 ppm and in Test diet 8.93 ppm) of melanin production. National Research Council minimum requirements for all nutrients were exceeded in both diets (NRC, 2006). Diet specifications for key components are shown in Table 1. Feeding of both diets was in accordance with the intake guidelines (110 kcal/kg^0.75, based on calculations from Burger, Reference Burger1995) associated with the diets for maintaining a healthy body weight. Breeders were requested to indicate if any aspect of the feeding protocol was breached, and report any health issues associated with the dogs.
Composition of Test and Control diets.

N.B. Free amino acid values denote the amount supplemented into the diet as the free form. NRC recommended minima for Phe + Tyr 2.23 g/Mcal and Cu 1.8 m g/Mcal.
Colour assessment of the dogs' coat was performed using a spectrophotometer (Spectro-guide® 45/0, gloss, BYK Gardner, Brant Industries, Germany) according to the CIE Lab colour measurement system (Hunter Associates Laboratory, Inc. Reston, VA, USA). Colour was determined as a numeric value of a* (red to green axis, 100 to -100) and b*(yellow to blue axis 100 to -100). Lightness is determined as L* on a numerical scale (from black = 0 to white = 100). Measurements were taken at the start of the study and then after two and four months of feeding either the control or test diets. Five individual measurements were performed at four body sites for each time point (site 1 left shoulder; site 2 right shoulder; site 3 withers; site 4 rump). Care was taken to ensure that the same body locations were measured at each time point.
Breeders were requested to complete a study questionnaire at each sampling time-point (for questionnaire details see Appendix A). The questionnaire was primarily designed to determine the opinion of the breeder regarding coat colour changes during the study and to highlight any variation from the protocol or health issues of their dogs. A different set of questions was used for the start of the study, designed to gain more background information on coat colour changes and potential sources thereof. Questions 5 and 6 were exactly the same for all time-points however.
Statistical analyses were performed with the JMP version 12 and the SAS version 9.3 software (SAS Institute Inc., Cary, N.C., USA).
Firstly, correlation matrices of L*a*b parameters were calculated using Spearman's rho coefficient. A Principal Component Analysis (PCA) was performed and the first PCA axis (explaining 75% of total variance) was used to create a synthetic variable embedding these three correlated parameters (Table 2).
Summary of L, a, b and Lab-PCA results for T = 0 and T = 4 month time points

*Lab PCA is calculated from the first PCA axis as follows: Lab PCA = +0.952a + 0.846b-0.793L. Means not sharing a letter differ significantly P < 0.05
Subsequently, linear mixed models were used to assess the influence of diet (two levels) on hair colour evolution (L, a, b and the Lab synthetic Lab parameter). Diet and site of measurement were defined as fixed effects in this model. As each site of measurement on a dog was not independent, site effect was modelled as a repeated effect within each dog. Moreover, this model was adjusted by the individual site value of the respective parameter at initialization for each dog (before the diet group differentiation). This initial value was added as a covariate in the mixed models, as these were not found to be well balanced between the two diet groups. Normality of residuals distribution of each model was checked. When residuals were not normally distributed, quantitative variables (outcome and covariate) were ranked before being non-parametrically analysed.
Results and discussion
Hair colour in animals is primarily determined by genetics; however it is clear that certain exogenous or environmental factors can also play an important role. For example, photo-bleaching of dark hair or photo-yellowing of white hair can occur upon exposure to UV light, particularly when in combination with humid conditions and/or high temperatures. The chemistry of such changes is not fully understood, but amino acids, and in particular the aromatic amino acids, are vulnerable to destruction or polymerisation by UV light and oxygen exposure (Busch-Kschiewan, Reference Busch-Kschiewan, Zentek, Wortmann and Biourge2004). The same group proposed that the appearance of a reddish colouration in white coated dogs is due to the presence of pigments called pheomelanins wherein their quality, density or distribution could underlie observed changes. Nutrition is a further factor which has been shown to influence hair colouration, specifically via the synthesis and deposition of eumelanin and pheomelanin in the hair shaft. Studies have clearly demonstrated that the intake of amino acids Phe and Tyr in both cats and dogs can influence colour expression in black animals. Yu et al. (Reference Yu, Rogers and Morris2001) and Morris et al. (Reference Morris, Yu and Rogers2002) demonstrated that if black kittens were provided with diets containing reduced levels of Tyr and Phe, red coats were observed. Anderson et al. (Reference Anderson, Rogers and Morris2002) then confirmed that eumelanin production in black kittens could be compromised by a lack of Phe and Tyr in the diet, with twice as much of these amino acids needed for a black coat as was required for normal growth alone. More recently this effect was replicated in dogs by Watson et al (Reference Watson, Servet, Hervera and Biourge2015), where black pigmentation was again optimised by increasing dietary Tyr/Phe over and above basic growth requirement, as detected by a reduction in the a* parameter (CIE Lab System; L* for the light-dark axis, a* the red-green axis and b* the yellow-blue axis) using spectrophotometry. A link between nutrition and development of pigment in the coat of white dogs has not previously been demonstrated. Our study investigated such a connection by controlling intake of Tyr/Phe and copper towards the lower end of the currently recommended daily intake for adult (NRC, 2006; 2.23 g/Mcal Phe/Tyr; 7.2 ppm copper). Twenty five of the 26 six dogs completed the study; one was unable to continue after the two month measurements for a non-health related reason. Overall compliance during the study was very good and breeders reported that all dogs were fed exclusively with the experimental diets offered. Acceptance of the diet was excellent and no refusals were reported. Except for minor health issues, (two cases of vomiting, one case of slight lameness, and one localised skin infection which was not near any of the four coat measurement sites) dogs remained healthy for the duration of the study. No health issues were reported which could be associated with diets. The breeders did not report any significant changes in the weight or body condition for any of their dogs, and environmental factors were kept consistent throughout the study for the dogs.
Four body sites were selected for spectrophotometer measurements, two along the back where discolouration is more commonly seen and two on the sides where the development of off-white is less reported (based on responses from breeder questionnaire, see Figure 1).
Showing typical areas of off-white discolouration along the back of the study animals (rectangles) and body site 2–4 used for spectrophotometry measurements (site 1 was located opposite to site 2).

It was considered that these four sites would therefore provide a reliable representation of the overall coat patterning, as well as changes in coat colour during the study. The time zero readings showed anticipated variability between the different body sites. There was no difference for L*, a* or b* between the sites 1–2 (left and right respectively). In addition, there was no difference for parameter L between these two sites and site 3. However, there was a significant difference for L between sites 1 and 4, sites 2 and 4, and sites 3 and 4. There were also significant differences for all other body site comparisons for parameters a and b. Therefore, although readings from time zero measurements indicated that the colour and lightness for the two sides was comparable, there was a progressive increase in colour/off-white when comparing sites from the sides to the withers and finally to the rump.
Group allocation at the start of the study was based on balancing sex, age and, in order to control for environmental factors, the need to feed an equal number of dogs each diet at each breeder's location. Unfortunately, group allocation based on balancing the spectrophotometer values was not possible at the time and analysis of the a and b values across the two diet groups at T0 showed significant variation between groups (a* p = 0.025; b* p = 0.022). This variation had to be accommodated within the statistical model used for data analysis. For each of the parameters evaluated, the data were statistically analysed for colour evolution and were adjusted for time zero values as part of the mixed-model used. Therefore, in effect, each dog and each coat site of each dog was treated as its own control in the model. Longitudinal measurements for L, a and b were subsequently made at time zero and after two and four months.
An observation from the study was the lack of independence of the three primary parameters. Normally, when applying the CIE Lab system each value is treated as an individual measure of the colour space in order to provide an overall readout. In the current study there were a number of reasons for creating the PCA-based Lab synthetic parameter, principally that the values for L, a and b were found to be correlated (Spearman's rho: L-a r = −0.69; L-b r = −0.41; a-b r = 0.75) and by creating a single value to represent L, a and b the α-risk inflation (Type 1 error) could be reduced. The use of the Lab parameter reduced the overall T0 effect (P = 0.069). Therefore, the construction of a synthetic variable from the first dimension (axis) Principle Component Analysis of L, a and b (75% of the total variance) permitted analysis of the data in a simplified form. The application of this method has only been demonstrated for the specific experimental conditions used here for coat colour determination. However, it may be that such an approach could have value in other situations where the CIE Lab method is employed.
The study was designed to span the spring and summer period when moulting would be common for the study dogs, thereby allowing time for the growth of a new hair-coat and potentiating colour change. When looking at the data from the four sites individually no dietary differences could be detected at either two or four months of feeding. When the data for all body sites were combined there were no differences detected between the test and control groups at two months for any of the individual parameters. However, after four months a significant overall reduction in parameter a* was detected (P < 0.02), indicating a reduction in the amount of red colouration in the hair-coat of dogs fed the Test diet (Figure 2; Table 2).
Evolution of parameters L, a and b between time zero and four months (T4T0) feeding dogs the test or control diet. Covariate L at T0 (P < 0.001), a at T0 (P < 0.001), b at T0 (P < 0.001). Box and Whisker plots showing median, 25% and 75% for data ranges.

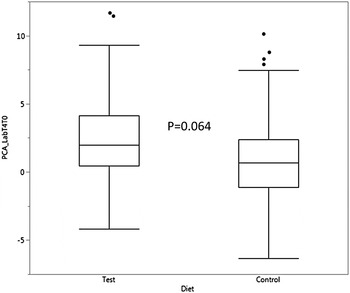
No differences associated with diet were seen for the other parameters, although the synthetic Lab showed a trend towards colour reduction in the dogs fed the Test diet (P = 0.064, Figure 3). In addition, factorial analysis showed that, not surprisingly, a* contributed most to the variance of the Lab synthetic, followed by b* and L* respectively.
Evolution of PCA derived parameter Lab between time zero and four months (T4T0) feeding dogs the test or control diet. Covariate PCA Labrank, P < 0.001. Box and Whisker plots showing median, 25% and 75% for data ranges.
Busch-Kschiewan et al. (Reference Busch-Kschiewan, Zentek, Wortmann and Biourge2004) previously employed the CIE Lab system in a study on white dogs illustrating agreement between spectrophotometry and visual assessment. In addition, Shekar et al. (Reference Shekar, Duffy, Frudakis, Montgomery, James, Sturm and Martin2008) showed that dimension a* of CIE Lab spectrophotometric index is a good approximation of pheomelanin concentration in hair, as it measures a continuum of the red-green spectra. A lower a* value therefore normally reflects a lower hair pheomelanin concentration, manifesting as a less reddened hair shaft. Although not proven definitively in this study, the decline in the a* parameter after four months was attributed to the reduced Phe + Tyr and copper intake resulting in a reduction in the melanin content of the hair.
These results indicated that limiting the provision of Phe/Tyr and copper was effective in reducing the coat discolouration. The feeding duration required to detect the effect was four months, with no change detectable at two months. It is likely that the period to response is due to the time required to replace sufficient hairs, through moulting and regrowth, for the colour change to become detectable via spectrophotometry. A longer period of feeding may have potentiated a greater change in this respect, but it was not feasible to keep the group of breeding animals out of reproduction for a longer duration.
Coat colour rating scores from Question 6 of the questionnaire are shown in Table 3.
Responses to question 6: On the scale below how would you score your dog's current coat colour (1 – Very poor; 10 Perfect). Scores for individual dogs are shown for the beginning and end of the study.

*Test group, time zero vs final scores P = 0.011. Control group, time zero vs final scores P = 0.209.
Responses to question 6 illustrated a significant improvement in breeders' opinion of coat ‘colour’ (or whiteness) between the beginning and the end of the study for dogs fed the Test diet. There is no significant difference in the scores to question 6 for animals maintained on the control diet. It was concluded that at four months of feeding, the owners, who were blinded to the treatment groups, perceived a reduction in colour in the coat of their dogs when fed the Test diet. There was no significant change in average score at two months for either group. Question 5 did not demonstrate a significant difference in the responses between the two groups at any time point.
Conclusions
Swiss white shepherd dogs maintained for four months on a diet of 3.02 g/Mcal Phe + Tyr and 8.93 ppm copper showed reduced levels of off-white discolouration in their hair coat, manifested as a significant reduction in the a* (red) parameter of the CIE Lab system. A similar change in pigmentation was not observed in dogs fed the control diet. Owners also detected an improvement in the level of hair pigmentation for the dogs on the test diet. No health issues associated with the diets were observed during the study. The study illustrates the role nutrition can play in mammalian hair colour and shows that careful management of the intake of specific nutrients could be a means by which the expression of hair pigmentation can be controlled.
Acknowledgement
The authors would like to thank Royal Canin SAS for the financial support of this trial work
Declaration of Interest
The authors Adrian Watson, Vincent Biourge, Alex Feugier and Laurence Le Verger are employees of Royal Canin SAS
Appendix A
Questionnaire for breeders at start of study
-
1. Have you noticed changes in hair colour of your dog during the year?
-
2. Are there particular times of the year where you see a change?
-
3. Have you noticed a change in coat colour associated with a change in diet?
-
4. Are there particular parts of your dog's body which are affected by coat colour changes?
-
5. How important is your dog's coat colour to you? (1 -not important at all; 10 - extremely important) 1 2 3 4 5 6 7 8 9 10
-
6. Is there something you are currently doing to change the colour or your dog's coat? If yes, what?
-
7. How would you score the current colour of your dog's coat (1 - very bad; perfect 10)
1 2 3 4 5 6 7 8 9 10
Questionnaire for breeders at T = 2 and 4 months
-
1. Has your dog been eating the study diet alone since the start of the study?
-
2. If not, what other food (including snacks / treats / human food) has your dog eaten? Please indicate quantity.
-
3. Have you had any problems associated with the study diet, for example refusals? If so, how often?
-
4. Overall how satisfied are you with the study diet? (1 – completely dissatisfied; 10 – completely satisfied)
-
5. Would you say that the coat colour of your dog has improved since the start of the study?
-
6. On the scale below how would you score your dog's current coat colour (1 – Very poor; 10 Perfect)
1 2 3 4 5 6 7 8 9 10


 Open access