

Introduction
This paper presents research, which sought to explore the process of concordance among general practitioners (GPs), nurse prescribers (NPs) and pharmacist prescribers (PPs) in primary care in the United Kingdom. Concordance has been defined as occurring when ‘the patient and the healthcare professional participate as partners to reach an agreement on when, how and why to use medicines drawing on the expertise of the health care professional as well as the experiences, beliefs and wishes of the patient’ (Royal Pharmaceutical Society of Great Britain, 1997). Although there has been some confusion about the meaning of concordance (Jordan et al., Reference Jordan, Ellis and Chambers2002), it bears a strong similarity to the process of shared decision making as described by Charles et al. (Reference Charles, Gafni and Whelan1997). Indeed a conceptual review of shared decision making found 31 separate concepts to describe the process, although only two concepts, patient values/preferences and giving options, appeared in more than half of the definitions (Makoul and Clayman, Reference Makoul and Clayman2006). Concordance resonates strongly with these concepts and, it is argued here, is seen as being consistent with a shared decision-making approach where at least one of the treatment options involves a medicine.
Aided by a politically driven ideology endorsing patient-centred communication as being synonymous with good patient care, of which shared decision making is a part (De Haes, Reference De Haes2006), research involving shared decision making has increased dramatically in recent years. With this increase has come the development of a wide range of instruments to assess the process of shared decision making. Systematic and structured literature reviews have considered instruments, which assess the physician’s perception of the decision-making process (Légaré et al., Reference Légaré, Moher, Elwyn, LeBlanc and Gravel2007), those that use direct or indirect observation of consultations that involve choices (Elwyn et al., Reference Elwyn, Edwards, Mowle, Wensing, Wilkinson, Kinnersley and Grol2001) and a review, which has evaluated instruments exploring the decision-making process (Dy, Reference Dy2007). The reviewed measures came in a variety of formats: observer completed, using patient or health care professional report and using questions, rating scales, checklists or the presence/absence of defined behaviours. More recently, the need to capture both patient and professional perspectives in shared decision making (dyadic measures) has emerged as an important issue in measurement (Légaré et al., Reference Légaré, Turcotte, Robitaille, Stewart, Frosch, Grimshaw, LaBrecque, Ouimet, Rousseau, Stacey, van der Weijden and Elwyn2012).
The range of definitions of shared decision making and the diverse range of measures has meant that determining the impact of shared decision making on outcomes has been difficult. Researchers have examined different aspects of the communication involved in shared decision making and then measured these effects in different ways. One review took a concordance perspective to investigate two-way communication about medicines between patients and professionals (Stevenson et al., Reference Stevenson, Cox, Britten and Dundar2004). They found that professionals rarely asked the patient their preference for a particular medicine, tended not to discuss their ability to adhere and did not always encourage patients to ask questions about their medicines (Stevenson et al., Reference Stevenson, Cox, Britten and Dundar2004). Another systematic review investigated the effects of shared decision making on patient satisfaction, adherence and health status (Joosten et al., Reference Joosten, DeFurentes-Merillas, de Weert, Sensky, van der Staak and de Jong2008). Of the 11 included studies, which compared a shared decision making intervention with a control intervention, five demonstrated no benefit and in the remaining six, only one demonstrated an increase in patient satisfaction. Improvement in well-being was demonstrated in two studies, with improved adherence in one. The authors concluded that shared decision making may be most beneficial in chronic conditions and where a shared decision-making intervention contains more than one session (Joosten et al., Reference Joosten, DeFurentes-Merillas, de Weert, Sensky, van der Staak and de Jong2008), a conclusion supported in a recent randomised controlled trial involving shared decision making in asthma (Wilson et al., Reference Wilson, Strub, Buist, Knowles, Lavori, Lapidus and Vollmer2010). While there is a continued need for more evidence on the impact of shared decision making on patient outcomes, the health policy agenda advocating informed patient choice and patient-centredness remains strong. Increasingly, the implementation of shared decision making involves the use of decision aids to provide evidence-based information to support patient decision making (Elwyn et al., Reference Elwyn, Latimer, Coulter, Walker, Watson and Thomson2010).
In the United Kingdom, due to the expansion of prescribing to new prescribers (other than doctors and dentists), other health professionals have now also entered the frame of this debate. Although nurses had been able to prescribe from a limited formulary earlier before 2004, it was at this time that legislative changes were introduced to enable supplementary prescribing, described as ‘a voluntary partnership between the responsible independent prescriber (a doctor or a dentist) and a supplementary prescriber (nurse or pharmacist) to implement an agreed patient specific clinical management plan with the patient’s agreement’ (Department of Health, 2005: 11). Although this paper focuses specifically on nurse and pharmacist prescribing, the authority to prescribe (within their clinical competence) has also been extended to include optometrists, physiotherapists, podiatrists and radiographers. Since 2006 nurses and pharmacists have been able to become full independent prescribers for any medical condition upon completion of an approved training course. As an independent prescriber, they are able to assess, and be responsible for, ‘patients with undiagnosed or diagnosed conditions and for decisions about the clinical management required, including prescribing’ (Department of Health, 2006). Within this role, nurse and pharmacist (supplementary and independent) prescribers, like their doctor counterparts, are responsible for prescribing decisions and take on a key role in shared decision making during their consultations with patients (Bond, Blenkinsopp and Raynor, Reference Bond, Blenkinsopp and Raynor2012). To this end, the National Prescribing Centre (now part of the National Institute for Health and Care Excellence) has identified a core set of nine prescribing competencies, initially developed for new prescribers such as nurses and pharmacists, but now applicable to all prescribers including doctors (National Prescribing Centre, 2012). Statements associated with the activities or outcomes that (good) prescribers should demonstrate within the shared decision making competency are shown in Table 1. This research focuses on the questioning skills associated with competencies 7 and 8 and the outcomes related to competencies 5, 9 and 13 (Table 1).
Shared decision making competencies (with parents, care-givers or advocates where appropriate)Footnote a

a Taken from the national prescribing centre. A single competency framework for all prescribers.
NPs and PPs come from a different educational tradition to doctors with regard to their basic training before they became prescribers. Historically, doctors have had sole control over the prescribing process and although concerns have been expressed that this dominance could be diminishing (Britten, Reference Britten2001; Willis, Reference Willis2006), more recent studies have suggested that NPs and PPs have not challenged the dominance of medicine in their new role as prescribers (Weiss and Sutton, Reference Weiss and Sutton2009; Cooper et al., Reference Cooper, Bissell, Ward, Murphy, Anderson, Avery, James, Lymm, Guillaume, Hutchinson and Radcliffe2011). Given the different educational, professional and sociological roots of doctors, NPs and PPs, this study sought to explore the process of shared decision making across these three prescriber groups. For example, due to different perceived levels of professional status (Charles-Jones et al., Reference Charles-Jones, Latimer and May2003; Cooper et al., Reference Cooper, Anderson, Avery, Bissell, Guillaume, Hutchinson, James, Lymm, McIntosh, Murphy, Radcliffe, Read and Ward2008), would patients find it easier to express a treatment preference to a nurse or PP? Would pharmacists, due to their professional focus on medicines, find it easier to discuss treatment rationales or medication options? The aim of this study was to explore the process of how NPs, PPs and GPs negotiated medication decisions in their interactions with patients, in particular, exploring specific components of shared decision making. Specific research objectives were to compare GPs, NPs and PPs with respect to
-
1. Whether treatment options were offered
-
2. Whether the patient’s view about treatment options was elicited
-
3. Whether different treatment decision characteristics were related to patient outcomes such as satisfaction, adherence and perceived practitioner empathy.
Methods
Theoretical framework
To evaluate the effect of whether shared decision making influences patient outcomes, audio-recordings of prescriber–patient consultations were coded by researchers to assess aspects of the prescribing decision-making process such as whether treatment options were offered by the prescriber and whether the patient’s view was elicited about options. These findings were then related to a range of patient outcomes such as patient satisfaction, empathy, perception of role in decision making and adherence captured on a self-completed questionnaire. The theoretical rationale behind this investigation was that doctors’ use of collaborative communication when setting treatment goals has been associated with improved patient outcomes (Naik et al., Reference Naik, Kallen, Walder and Street2008). As noted by Street et al. (Reference Street, Makoul, Arora and Epstein2009), consultation communication can affect patient outcomes directly or, more probably, through proximal outcomes such as satisfaction, adherence or perceptions of empathy. Yet, methodologically, to investigate these relationships is challenging. The way statements or questions are constructed in an interaction are influenced by the specific medical and social context and, importantly, follow a sequence influenced by previous statements or questions in the interaction (Heritage, Reference Heritage2010). As such, any attempt at sense making of consultation recordings is inherently interpretive: an attempt by the researcher to attach meaning to an interaction with which they were not involved. This will result in interpretations influenced by the researcher’s own attitudes, perspectives and experiences. Nonetheless, while there is a core interpretative element to coding consultation data, the overall research approach follows a post-positivist design, which assesses causes that influence outcomes (Creswell, Reference Creswell2009). This is done through careful measurement of an objective reality (patient–prescriber consultations) and its effect on behaviours or views (patient self-report of outcomes on questionnaires). While the methods used are mixed (observation and questionnaires), our approach follows a practice mixed methods perspective, where methods emerge ‘bottom up’ to address pragmatic research questions (Creswell and Tashakkori, Reference Creswell and Tashakkori2007).
The consultations
Following NHS ethical approval, research and development permission was obtained in 36 Primary Care Trusts (PCTs) across southern and central England and Wales. GPs, NPs and PPs were recruited with the support of local Primary Care Research Networks (PCRNs). The PCRNs recruited research-active practices locally through newsletters, the PCRN website and reminder electronic emails lists. The research officers (J.P., R.R.) visited interested practices and gave them more information about the study. Because of the nature of recruitment, it was not possible to calculate an overall response rate for recruited professionals.
All consenting health professionals saw patients in a consulting room and were provided with an audio recorder. They were asked to record consultations with consenting patients. Patients received a patient information sheet either through the post or on arrival for their appointment. Consent from patients was obtained in the waiting room before their appointment. Included patients had to be over 16 and able to give their informed consent. In an effort to exclude consultations where a medicine decision was unlikely, patients were asked if they thought their consultation might involve a discussion about a medicine. While not every patient knew if a medicine were to be discussed, it was possible to exclude particular consultations where a medicine discussion was clearly unlikely (eg, antenatal appointment, new patient to practice, hospital post operative review). At the time of consent, patients were also given a patient questionnaire with a pre-paid envelope to complete and return after their consultation. Patients were asked to state the number on the envelope at the beginning of the consultation so that consultation recordings could be matched to returned patient questionnaires.
Audio-recordings
The research team analysed the audio-recordings using a data collection form based on the previous work of Chewning et al. (Reference Chewning, Sleath, Shah, Devellis and Yon2006) who had developed a consultation coding protocol using the Concordance Coding Tool (CONNECT). The data collection form focused on medication/treatment decision making and examined decision-making activities, their duration and sequence. Minor modifications to the data collection form were made following discussion among the three researchers (J.P., R.R., M.W.). Consultations were not fully transcribed but ‘coded’ for specific issues. Particular variables and their respective coding categories used in this analysis are shown in Table 2.
(Selected) information collected about each prescribing decision

The patient questionnaire
The patient questionnaire consisted of five main elements: satisfaction, patient preference for role in decision making, adherence, empathy and the amount of medicines information received. Satisfaction used a previously validated satisfaction scale, which was rated on a five-point Likert rating scale from strongly agree to strongly disagree (Baker, Reference Baker1990). A standard patient preference scale for measuring involvement in decision-making scale (Degner and Sloan, Reference Degner and Sloan1992) was used. This used a five-point scale ranging from an active to a shared to a passive role in decision making. This was asked three times: in relation to their preferred role ‘in general’ with the doctor, their actual experience with the prescriber they saw and their preference with a nurse prescriber (for NP patients), with a pharmacist prescriber (for PP patients) or with a chemist (for GP patients) as it was considered that GP patients would be more likely to have experience of seeing a chemist than an NP or PP. Adherence was measured using four self-reported adherence statements using the Reported Adherence to Medication scale, which uses two five-point Likert scales (Horne et al., Reference Horne, Weinman and Hankins1999). Empathy was measured using the 10 statements from the CARE empathy scale (Mercer et al., Reference Mercer, Maxwell, Heaney and Watt2004) and there were three questions from the Local Health Services Questionnaire from NHS Surveys about the amount of medicine information received (Martin, Reference Martin2008). Patients were also asked to provide demographic information. Further details of the questionnaire are available on request.
In accordance with Baker (Reference Baker1990), the satisfaction scale consisted of 18 statements or items, which were divided into three subscales and a general satisfaction scale (Table 3). It was considered that some of the statements might not be relevant for some patients and therefore, unlike the original Baker satisfaction scale, patients were allowed to tick a ‘not applicable’ box. Upon return of the questionnaires, there were a large number of items ticked ‘not applicable’ by patients, which would have resulted in the loss of response from 22 to 82 patients (out of 275), depending on the satisfaction subscale (using listwise deletion). For this reason, satisfaction questionnaires were coded such that a patient’s mean response was calculated based on the number of items within a subscale, which were completed (so if only four out of five statements within a subscale were completed, the mean response was calculated for four statements). This led to a higher number of usable questionnaires (11 to 17 cases missing, depending on the subscale), although those where there was genuine missing data were still deleted.
Statements and subscales within the satisfaction scale (14)
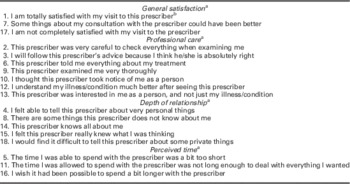
a Individual items within each subscale were reversed where appropriate such that higher satisfaction scores equalled greater satisfaction.
b The type of prescriber (GP, nurse or pharmacist) was substituted here in the different versions of the questionnaire.
Data analysis
Data were entered into PASW v18 for analysis. Data were initially analysed descriptively. Because of the skewed nature of data distribution, differences between prescriber groups were analysed using a Kruskal Wallis test. Associations between decision process variables and demographic data were analysed using appropriate non-parametric tests with a P-value<0.05 taken as significant. Multiple regression was used to investigate the effect of key decision process and demographic variables on patient satisfaction, patient self-reported adherence and patient perception of practitioner empathy.
Results
There were 51 prescribers recruited over the period from October 2009 to September 2011. These comprised 20 GPs, 19 NPs and 12 PPs from 36 practices in 14 PCTs in England (Table 4). Consultations included patients presenting with acute conditions (eg, chest, throat, urinary infections, acute pain due to injury, skin conditions) and those with new or managed chronic conditions (eg, hypertension, diabetes, asthma, depression and cardiovascular conditions). Prescribers worked in either an open clinic (any condition but more likely to be acute conditions) or condition-led clinic dealing with chronic conditions (eg, hypertension, diabetes). Open clinics accounted for 72% (383/533) of the consultations (210/383, 55% by GPs, 173/383, 45% by NPs, 0% by PPs). Condition-led clinics accounted for 28% (150/533) of the consultations recorded (3/150, 2% by GPs, 36/150, 24% by NPs and 111/150, 74% by PPs). With a median consultation length of 15.75 min (Table 4), pharmacists had significantly longer consultations than either GPs (9.96 min) or NPs (9.92 min) [K−W χ 2(2533)=62.1, P<0.0001].
Demographic and descriptive characteristics of prescribers

Prescribing decisions
Of the 533 consultations recorded, 421 (79%) involved a prescribing decision with most, 366 (87%) involving one prescribing decision (Table 5). Of the 482 prescribing decisions, 223 (46%) were made in GP consultations, 159 (33%) in NP consultations and 100 (21%) in PP consultations. Examples of the types of decisions made during these consultations are provided in Table 6.
Number of prescribing decisions by consultation

Examples of prescribing decisions made in the consultations

GP=general practitioner; NP=nurse prescribers; PP=pharmacist prescriber.
Patients were given medication/treatment options in 21% of prescribing decisions, were provided with a rationale for a proposed medication (pre-decision) in 28% of decisions, the prescriber elicited the patient’s preference for treatment in 18% of decisions and the patient expressed a treatment preference in 24% of prescribing decisions (Table 7). When a treatment preference was expressed, it was usually (87/118, 74%,) adopted by the prescriber. The patients that expressed a preference that the prescriber adopted were more likely to give a positive response to the prescriber’s treatment decision compared with those whose prescriber did not adopt the patient’s preference [χ 2 (24 117)=40.2, P=0.02, Cramer’s V=0.29]. In the majority of prescribing decisions (74%), the patient asked no questions, with one question being asked in 102 (21%) of prescribing decisions.
Tasks undertaken in prescribing decisions by prescriber type

a Significantly different across the prescriber groups at <0.05% (see text).
b Four missing values such that total n=478.
Twelve out of 20 of the GPs were male and four out of the 12 PPs were male. All of the NPs were female. Consultations with female GPs were more likely than those with male GPs to elicit the patient’s preference about treatment (31/103, 30% of consultations involving female GPs versus 12/119, 10% of consultations involving male GPs; χ 2 (1222)=14.2, P<0.001, φ=0.25).
As shown in Table 7, PPs were more likely to ask the patient for their preference about the medication regimen than either NPs or GPs [χ 2 (2482)=6.6, P=0.036, Cramer’s V=0.12]. They were also more likely to provide treatment options than either GPs or NPs (χ 2 (2482)=9.5, P=0.009, Cramer’s V=0.14). However, patients were more likely to ask questions in GP consultations compared with NP or PP consultations (χ 2 (2, 478)=7.73, P=0.021, Cramer’s V=0.13). Other variables (patient expressing a medication/treatment preference or prescriber providing a rationale for a medication/treatment pre-decision) were not significantly different across prescriber groups (Table 7).
Patient questionnaires
There were 275 (out of 532, response rate 51%) returned patient questionnaires. There were 117 from GP patients, 101 from NP patients and 57 from PP patients (Table 8). Of the 275 patients, 63% were female and 99% were White/British. Patients had a mean age of 59 (SD=17.7) and the majority (56%) left full-time education age 16 or less. As shown in Table 8, PPs saw significantly more male patients than nurses or GPs [χ 2 (2273)=12.6, P=0.002, Cramer’s V=0.22], their patients were also more likely to be older (χ 2=27.0, df=2, P<0.0001) and to have left school at age 16 or less [χ 2 (2272)=19.6, P=0.003, Cramer’s V=0.19].
Demographic background of patients completing questionnaire by prescriber type (n=275)

a Missing data from two respondents.
b Missing data from four respondents.
c Missing data from 12 respondents.
d Missing data from three respondents.
In addition to asking their experiences with the prescriber they saw, all patients were asked what role in treatment decision making they prefer in general with their doctor. Forty-four per cent (121) preferred an active or collaborative role in decision making with 154 (56%) preferring a more passive role. Age was related to decision-making preference such that older patients were more likely to prefer that the doctor made the decision (Spearman’s ρ=0.17, P=0.006). Patient gender was also associated with role preference such that women were more likely to prefer a more active role in decision making than men [χ 2 (2273)=11.44, P=0.003, Cramer’s V=0.205]. For NP and PP patients, patient preference for involvement did not significantly change when asked for their preference with regards to a doctor or a nurse or PP suggesting that the patient’s preference for involvement in decision making does not vary with prescriber type. It was possible to compare the patient’s expectations of their prescriber with regards to who should make the decision with what they actually experienced in the consultation. For example, NP patients were asked for their expectations of who should make the decision with a NP and this compared with what they actually experienced in the consultation. For the majority of patients (66%, 176/266), their expectations for their role in decision making (active, shared or passive) matched what they received in the consultation. There was no difference on any of the satisfaction scales between those whose expectations matched their actual experience and those whose did not.
There was a high level of patient self-reported adherence with 62% (158/255) disagreeing or strongly disagreeing that they had difficulties taking their medicines. Overall ratings of practitioner empathy were high with a mean (SD) score of 43 (7.4) out of a total possible score of 50 (n=207). There was no difference in patient self-reported adherence or patient perceptions of practitioner empathy across the prescriber groups.
All of the self-reported patient outcomes (satisfaction, adherence and empathy) were explored in relation to each other, to prescriber type and to consultation length. Median satisfaction scores, with higher values indicating greater satisfaction, were 4.33 for general patient satisfaction (n=262), 4.14 for professional care (n=260), 3.60 for depth of relationship (n=258) and 4.0 for perceived time (n=254). A Kruskal Wallis test revealed a statistically significant relationship in the general satisfaction and professional care scales across the three prescriber groups, with NPs receiving a higher level of patient satisfaction than patients of GPs or PPs (χ 2=12.88, df=2, P=0.002 for General Satisfaction; χ 2=6.85, df=2, P=0.03 for Professional Care). Median and mean satisfaction scores and their values across the different prescriber groups are shown in Table 9. Consultation length was unrelated to satisfaction, adherence or empathy (Table 10). Patient satisfaction was similarly unrelated to adherence, although higher perceptions of practitioner empathy were significantly associated with increased patient satisfaction on all four of the satisfaction scales (Table 10). All patient satisfaction scales were correlated with each other.
Patient satisfaction scores by prescriber type

GP=general practitioner; NP=nurse prescribers; PP=pharmacist prescriber.
**Significant at P<0.05. Higher scores indicate greater satisfaction.
a Comparisons between prescriber groups using a Mann–Whitney U-test.
b Satisfaction scores were a percentage out of 100 with 5 being the maximal score of 100%. These were determined regardless of the number of items completed. For this reason, the values for the range are not necessarily whole numbers.
Correlations between different patient outcomes (n=275)*

*Values shown are Spearman’s ρ correlation coefficient, the significance level and number of respondents; **significant at a level of <0.05; and ***significant at a level of <0.01.
Relating prescribing decisions to patient outcomes
In consultations where prescribing decisions were made, most (87%) involved one prescribing decision (366/421). For ease of analysis, if more than one prescribing decision was made in a consultation, only the first prescribing decision was related to patient questionnaire data. However it is recognised that in consultations where more than one decision was made, the patient could have completed the questionnaire in relation to other decisions made in the consultation. Of the 275 returned patient questionnaires, 192 of these could be matched with a corresponding prescribing decision. Although, as noted above, consultation length was unrelated to any of the patient outcomes, it was considered that length of time spent describing treatment options might be a more accurate measure of shared decision-making process, which could be relevant to patient outcomes. It was found that the more time spent by the prescriber describing treatment options in the consultation was significantly associated with increased general satisfaction (Spearman’s ρ=0.29, P=0.05), professional care (Spearman’s ρ=0.41, P=0.005) and depth of care satisfaction (Spearman’s ρ=0.35, P=0.017). Increased time describing treatment options was also associated with increased patient adherence (Spearman’s ρ=−0.3, P=0.05) and greater perceived prescriber empathy by the patient (Spearman’s ρ=0.46, P=0.004). The length of time spent describing treatment options was not related to prescriber type. Variables created from the prescribing decision data (Table 2) along with prescriber and patient demographic information were entered into a multiple regression equation using the following dependent variables: patient satisfaction scales, patient self-reported adherence and patient perceptions of practitioner empathy. None of the variables significantly predicted the dependent variables, with all models explaining a low level of variance (<20%).
Discussion
This study explored how NPs, PPs and GPs, in their consultation interactions with patients, made treatment decisions and related this to several self-reported patient outcomes. The findings suggest that concordance, or shared decision making with regards to medicine taking, is only occurring to a limited extent; in only a quarter of consultations were patients given treatment options or provided a rationale for a proposed medication/treatment (Table 7). In only a fifth of consultations did the prescriber elicit the patient’s preference for treatment and in a quarter did the patient express a treatment preference. This is despite the suggestive evidence found in this study that spending longer discussing treatment options was associated with greater patient satisfaction, adherence and in rating the prescriber as more empathic. While it is acknowledged that discussing treatment options or asking the patient’s preference for treatment are skills, which may not need to be demonstrated in every consultation, such a low frequency of occurrence suggests they are unlikely to be a routine part of consultation practice for most prescribers.
These findings have similarities with Latter et al.’s (Reference Latter, Maben, Myalla and Young2007) study of NPs. They found that, while almost all nurses (99%) self-reported that they practised concordance, during observed consultations it was found that in only 39% of consultations were the benefits and risks of treatment options explained. However, in other aspects of involvement (explaining the condition, checking the patient’s understanding) they did well (Latter et al., Reference Latter, Maben, Myalla and Young2007). In a study of NPs working in diabetes care, Sibley et al. (Reference Sibley, Latter, Richard, Lussier, Roberge, Skinner, Cradock and Zinken2011) recorded 59 NP–patient consultations in which there were 260 medicines discussions. The most frequent theme, ‘medication named’ was found in 89% (231/260) of the medicines discussions, whereas asking the patient’s opinion was mentioned infrequently (20%, 51/260) and giving the reasons for the medication discussed rarely (8.5%, 22/260) (Sibley et al., Reference Sibley, Latter, Richard, Lussier, Roberge, Skinner, Cradock and Zinken2011). Both of these studies support earlier research with 20 GPs, which found little evidence of the first two characteristics necessary for shared decision making, namely that both the doctor and patient are involved in decision making and that both share information (Stevenson et al., Reference Stevenson, Barry, Britten, Barber and Bradley2000).
In terms of differences between prescribers, these findings (Table 7) suggest that PPs may be better at some medicine-related tasks, such as asking for the patient’s preference and in giving treatment options, than either NPs or GPs. This could be due to the types of patients PPs see, such that pharmacists are more likely, due to their professional background, to see patients where a medication issue is discussed. Nonetheless, the level of asking the patient their preference and providing options was still low (25% and 32%, respectively). Greenhill et al. (Reference Greenhill, Anderson, Avery and Pilnick2011) similarly reported a low level among pharmacists of the skills relevant to encouraging patient participation in the consultation, although they only investigated 18 consultations across five pharmacists, who were not PPs. In contrast, in Courtenay et al.’s (Reference Courtenay, Carey, Stenmer, Lawton and Peters2011) qualitative study with dermatology patients of NPs, patients reported being actively involved in their treatment decision making and felt their views were incorporated into treatment plans. Similar findings using self-report were found in Knapp et al.’s study of pre-registration pharmacists, medical and nursing students’ attitudes to partnership in medicine taking. They found that nursing students were significantly more in agreement with the concept of concordance compared with medical students and pre-registration pharmacists (Knapp et al., Reference Knapp, Raynor, Thistlethwaite and Jones2009). Finally, in their study of family physicians in Canada, Towle et al. (Reference Towle, Godolphin, Grams and LaMarre2006) found that competencies in partnership (encouraging the patient to be involved in the decision) and ideas (asking the patient their thoughts about choices) were observed in most consultations. However, in a follow-up discussion group, physicians considered the competency of partnership problematic, having difficulty in trusting the patient to behave responsibly when they felt a sense of responsibility for them (Towle et al., Reference Towle, Godolphin, Grams and LaMarre2006). It is likely that these concerns about partnership are relevant for NPs and PPs as well.
Also of note was the higher level of satisfaction of patients of NPs compared with patients of GPs and PPs. In Drennan et al.’s (2011) study of hospital NPs in Ireland, which similarly used the Baker Consultation Satisfaction Questionnaire, high levels of patient satisfaction were found. Drennan et al. provide mean satisfaction scores for three of the four subscales (eg, the depth of relationship subscale was omitted). Converting their findings to be comparable with ours, this results in strikingly similar satisfaction scores, with our findings of 4.31, 3.79 and 4.29 on the professional care, perceived time and general satisfaction scales (Table 9), nearly identical with Drennan et al.’s corresponding findings of 4.51, 3.78 and 4.29. Similarly, comparing these findings with those of Baker (Reference Baker1990) for GPs (and converting the scales so they are comparable), our findings of 4.01, 4.13, 3.67 and 3.58 on the general satisfaction, professional care, depth of relationship and perceived time subscales are considerably higher than those found in 1990, which were 2.95, 3.01, 2.5 and 2.53, respectively, reflecting, potentially, greater satisfaction with care 20 years later.
One of the few previous studies comparing patient satisfaction across professional groups similarly found a higher level of patient satisfaction with nurse practitioners in primary care compared with GPs (Seale et al., Reference Seale, Anderson and Kinnersley2005). Seale et al. explained their findings as being due to the increased provision of information in nurse practitioner consultations, as well as the longer consultation length, neither of which were found to be significant in this research.
Our findings are in agreement with previous research, which found that younger people and women were more likely to prefer a more active role in decision making (Robinson and Thomson, Reference Robinson and Thomson2001; Say et al., Reference Say, Murtagh and Thomson2006; Cullati et al., Reference Cullati, Courvoisier, Charvet-Bérard and Perneger2011). Yet only 44% of our patients completing the questionnaire preferred an active or collaborative role in decision making. This is in contrast to findings of Chewning et al. (Reference Chewning, Bylund, Shah, Arora, Guegeun and Makoul2012) who found that, in studies published in or after 2000 in general practice populations, the majority of patients favoured a more active role in decision making in 59% of the studies reviewed. Although Chewning et al. (Reference Chewning, Bylund, Shah, Arora, Guegeun and Makoul2012) also found that British patients were more passive than patients from the United States. However, in comparing expectations with actual experience, the majority of patients (66%) did receive the level of involvement in decision making that they thought should occur. This is in contrast to Cox et al. (Reference Cox, Britten, Hooper and White2007) where GPs accurately assessed the patient’s level of involvement in only 32% of the consultations, with GPs overestimating the patient’s preference for involvement in 45% of the consultations. While other authors (Krupat et al., Reference Krupat, Rosenkranz, Yeager, Barnard, Putnam and Inui2000) have suggested that patient satisfaction declines when the orientation of the doctor differs from the orientation of the patient, particularly when the patient is more patient centred than the doctor, we found no difference in patient satisfaction between those whose experienced role matched their expectations compared with those where it did not.
Limitations
While there were initially 533 consultations, this only represented consultations from 12 PPs (as they were difficult to recruit). Further, when the sample was reduced to match prescribing decisions with returned patient questionnaires, the resulting number of matched consultations (192) was relatively small; the findings are drawn from, in particular, a small number of pharmacists, which may not be generalisable to the wider prescriber population. Also, due to the number of statistical tests performed, a significance level of P<0.05 may have been too generous, with the results prone to type 1 error due to multiple testing. An important caveat is also related to the context in terms of the clinical conditions observed. One reason why there may have been a low level of discussion about medication decision preferences may be because either there were few options available for that clinical decision or that the discussion involved a repeat prescription where options were unlikely to be discussed. Given the wide range of methods for capturing shared decision making, this research used a method, which was very task or transaction focused (Epstein and Street, Reference Epstein and Street2011) in terms of describing the decision-making process. This is just one way to measure the decision-making process and it is recognised that there may be other, better ways of describing decision making, which would have led to different findings. In addition, although we could record whether we thought, for example, the expression of options had occurred, previous research has suggested that there is a difference between observer descriptions or ratings of shared decision making and the patient’s experience of it (Edwards and Elwyn, Reference Edwards and Elwyn2006; Wunderlich et al., Reference Wunderlich, Cooper, Divine, Flocke, Oja-Tebbe, Stange and Lafata2010). Therefore, we do not know whether our process for capturing the decision-making process was what the patient experienced. We also did not have access to video and therefore have no knowledge of the patient’s body language or other non-verbal features of the interaction, which could have informed how we coded the data.
This paper focused quite narrowly on the treatment decision-making process and it is recognised that a more holistic approach to analysing consultations, including assessing the patients’ ideas, concerns and expectations, are vital aspects of the shared decision-making process. This is particularly relevant given the findings that patient perceptions of practitioner empathy were so strongly associated with patient satisfaction. Other aspects of the consultation from this research, including prescriber responses to patients’ cues and concerns and their use of an opening solicitation, have been published elsewhere (Riley et al., Reference Riley, Weiss, Platt, Taylor, Horrocks and Taylor2012; Weiss et al., Reference Weiss, Platt, Riley, Taylor, Horrocks and Taylor2013). An important limitation was that, for simplicity of analysis, we only used the first decision discussed in the consultation and matched this with the patient survey data. Subsequent decisions may have related differently to the patient outcome data. In addition, we did not record the number of medications patients were taking, which may be an important covariate, and our measure of adherence was self-report, which may not reflect actual patient behaviour. Finally, we accept that consultation length is a key confounder in these findings. Although consultation length did not affect patient satisfaction, PPs did have significantly longer consultations and this could have influenced their willingness and perceived sense of space in the consultation to discuss options and treatment rationales within the consultation.
Conclusion
This paper explored elements of the shared decision-making process through a comparison of GPs, NPs and PPs. The findings underline the relatively low level at which shared decision making is occurring, even from those new prescribers likely to have had their training relatively recently. The findings also suggest that PPs may exhibit the tasks around giving options and asking the patient’s preference slightly more often than NPs or GPs; perhaps because of their traditional role associated with medicines. In addition, patients of NPs were more satisfied, giving satisfaction scores strikingly similar to previous research with NPs in secondary care. Interestingly, across all prescriber groups, as the length of time a prescriber spent giving treatment options increased, so did patient satisfaction, adherence and patient perceptions of the prescriber’s empathy. While acknowledging the limitations of trying to measure such a complex process, these findings suggest that engaging in shared decision making can have some benefit. Yet measurement remains an issue. Defining the activities, tasks or competencies associated with shared decision making, which can also be measured, remains elusive. Developing tools that capture shared decision-making tasks such as ‘deals sensitively with emotions’ or ‘creates a relationship which does not encourage the expectation of a prescription’ are challenging to operationalise. Nonetheless, the shared decision-making community needs to persist in its efforts towards understanding, describing and enabling these processes, to fully elucidate possible benefits to the patient.
Acknowledgements
The authors gratefully acknowledge the kind assistance of the patients and professionals that participated in this study. The views expressed in this paper are those of the authors and not necessarily those of the Leverhulme Trust.
Financial Support
The Leverhulme Trust Grant R/00 351/X.
Conflicts of Interest
None.
Ethical Standards
The authors assert that all procedures contributing to this work comply with the ethical standards of the relevant national and institutional guidelines on human experimentation, as approved by the Wiltshire Research Ethics Committee 09/0104/21, and with the Helsinki Declaration of 1975, as revised in 2008.


