

Introduction
The climate of the Canadian Arctic is characterized by low interannual variability in precipitation and by high inter-annual variability in summer air temperature. Thus, changes in the annual mass balance of ice caps and glaciers in the region are strongly linked to variations in summer climate and snow/ice melt (Reference Oerlemans and ReichertOerlemans and Reichert, 2000; Reference KoernerKoerner, 2005). US National Centers for Environmental Prediction/ National Center for Atmospheric Research Reanalysis 1 (NCEP/NCAR R1) data (dating back to 1948) indicate that the highest regional mean summer air temperatures at 700 hPa geopotential height in the 64 year record (1948–2012) occurred between 2000 and 2012, and especially after 2005 (Reference Sharp, Burgess, Cogley, Ecclestone, Labine and WolkenSharp and others, 2011). Summer melt records derived from variations in the abundance of melt layers in ice cores from four ice caps in the Canadian Arctic show that recent melt rates are the highest in the past 4 ka and approach those seen in the Holocene thermal maximum, ~9 ka BP (Reference FisherFisher and others, 2012; Reference ZdanowiczZdanowicz and others, 2012). Approximately 1 47 000 km2 of the 540 000 km2 of ice caps and glaciers outside Greenland and Antarctica are found in the Canadian Arctic. As a result of the post-2005 summer warming, this region has emerged as one of the most important regional non-ice-sheet sources of global sea-level rise (Reference GardnerGardner and others, 2011).
From the 1960s until the early 21st century, firn compaction on ice caps in Arctic Canada occurred under conditions of relatively consistent mean annual air temperatures (MAATs) and annual snow accumulation rates (Reference KoernerKoerner, 1977; Reference Gardner and SharpGardner and Sharp, 2007; Reference Colgan and SharpColgan and Sharp, 2008; Reference Hörhold, Kipfstuhl, Wilhelms, Freitag and FrenzelHörhold and others, 2011). As a result, firn depth–density profiles were likely relatively constant over time, as assumed in Sorge’s law (Reference BaderBader, 1954). However, observations on Penny Ice Cap, Baffin Island, show significant recent increases in firn density and ice fraction and 10–15 m firn temperatures that are consistent with observations of increasing air temperature and melt rates since the mid-1990s (Reference ZdanowiczZdanowicz and others, 2012). Here we explore whether similar changes in the firn profile have occurred on Devon Ice Cap, Nunavut, located further north in the Canadian Arctic, and evaluate the extent to which they may influence the interpretation of altimetrically determined rates of surface height change on these ice caps in terms of changes in ice-cap mass balance.
We present the results of an ice-coring campaign conducted in spring 2012 that was designed to measure profiles of firn density, ice content and temperature in the accumulation zone of Devon Ice Cap. Twenty ice cores were recovered from sites in the summit region of the ice cap (1800–1900 m a.s.l.) and along an 18 km long section of the ‘CryoSat line’ . This transect extends south from the summit region of the ice cap and spans elevations from 1400 to 1800 m a.s.l. These cores are coincident in location with 34 firn cores drilled between 2004 and 2011, while the cores recovered at 1800 m a.s.l. are comparable in location with deep ice cores drilled in 1971 and 1972 (Reference KoernerKoerner, 1977; Reference Paterson and ClarkePaterson and Clarke, 1978). Using this spatially and temporally rich dataset, we describe the physical and thermal impacts of recent summer warming and associated melting on the upper 15 m of the firn layer of Devon Ice Cap.
Study Site
Devon Ice Cap (~14 000 km2) is located on the eastern end of Devon Island in Canada’s Queen Elizabeth Islands (Fig. 1) and is one of the larger ice masses in the Canadian Arctic. The ice cap and its outlet glaciers extend from sea level to 1920 m a.s.l. Historically, the accumulation zone included a quasi-dry-snow zone (where surface melt occurred in some but not all years), a percolation zone, a wet-snow zone and a superimposed ice zone (Reference KoernerKoerner, 1977).
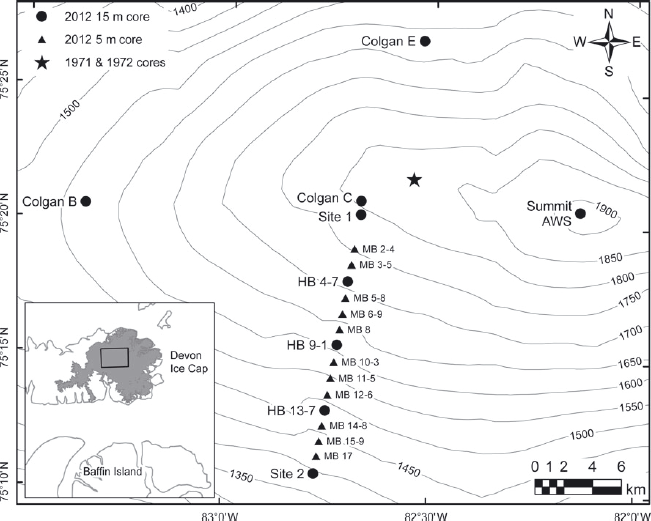
Fig. 1. Devon Ice Cap location and fieldwork sites. Between site 1 and site 2, MB indicates a mass-balance stake and HB indicates a mass-balance stake with a HOBO air temperature sensor. The associated numbers indicate the approximate distance (km) from site 1. At least two cores were recovered at every site indicated with a circle or a triangle.
Devon Ice Cap has a multi-decadal record of in situ observations, starting in 1961. These include annual surface mass-balance measurements, firn-/ice-core records, air temperature measurements from automatic weather stations (AWSs) and HOBO air temperature sensors, and repeated kinematic GPS and ground-penetrating radar (GPR) surveys (Reference Boon, Burgess, Koerner and SharpBoon and others, 2010). In 2004, three AWSs and 15 HOBO air temperature sensors were installed along the entire CryoSat line, which spans an elevation range of 400–1800 m a.s.l. Along this line, mass-balance stakes were placed approximately every 1 km and HOBO air temperature sensors approximately every 3 km. Within the accumulation zone, AWSs were located near the ice-cap summit and at sites 1 and 2 (Fig. 1).
The summit AWS is located on the southern flank of the summit ridge at 1900 m a.s.l. Site 1 is on the southwestern side of the summit plateau and marks the upper limit of the CryoSat line (1 800 m a.s.l.). Site 2 is located 18 km down the transect from site 1, at 1400 m a.s.l. HOBO air temperature sensors were mounted on mass-balance stakes located at 4.7, 9.1 and 13.7 km from site 1.
Datasets and Methods
Firn cores
We analysed 54 firn cores that were recovered from 20 distinct locations on the ice cap in either April or May between 2004 and 2012 (Fig. 1). Forty of the 54 cores extended to depths of 2.5–5.0 m and the remaining 14 cores to depths of 15–21 m. Cores were recovered using a Kovacs MK II corer with an internal barrel diameter of 9 cm. The stratigraphy and density profiles from these firn cores provide information about environmental conditions on the ice cap in the years prior to their recovery.
While a significant number of ice cores from Devon Ice Cap are available for analysis, the dataset has some limitations. Ice cores recovered prior to 2012 were collected as components of past experiments and not for the explicit purpose of updating the melt record. For example, only the top 3 m of the 20 m ice cores recovered in 2004 were documented. In 2006, ice cores with depths ranging from 2.5 to 3.2 m were recovered at most of the mass-balance poles along the CryoSat line. The lengths of these cores limit the depth range over which firn profile changes along the CryoSat line can be investigated.
To derive firn density profiles, the mass and length of each core section were measured in the field. Core section lengths (generally 20–40 cm) were determined by natural breaks created during the coring process. Observations of firn-core stratigraphy were made using two methods. Prior to 2012, firn stratigraphy was documented by direct visual logging of the core either in the field or after return to a cold laboratory. Firn types (e.g. dry firn, wetted firn, soaked firn) and ice layers were differentiated on the basis of firn density and air bubble content/size. Firn cores recovered in 2012 were documented with a Fuji FinePix S9000 digital camera modified to capture visible and infrared (IR) wavelengths between 330 and 1200 nm. The full length of each core was laid out on the ice-cap surface next to a 30 m survey tape and shaded with a neutral gray backdrop. Sections of firn core 1 m in length were photographed twice, first with a filter blocking wavelengths <850 nm and then with a filter blocking wavelengths <1000 nm.
On the ice cap, IR photography was considerably faster than manually logging cores, allowing for a larger number of cores to be sampled during the short field season. In the IR photographs, ice layers show up as dark gray layers, while firn layers remain white with observable texture patterns that allow for the distinction of different ice crystal types and sizes. Differentiating ice and firn in the photographs is straightforward, but there is more subjectivity in classifying the different types of firn. Firn stratigraphy was therefore plotted using two classes: firn and ice. This simplification was made in order to reduce the impact of classification biases resulting from different observers and the subjective description of firn types and characteristics. In this paper, layers plotted as firn were originally described as either dry firn, depth hoar, wetted firn, soaked firn or icy firn. While this simple classification limits detailed comparisons of firn stratigraphies, it greatly improves our confidence that we are observing true physical changes rather than observer- related changes in firn classification.
Ice fraction
The ice fraction is a simple metric to describe the firn profile. Spatial and temporal changes in the ice fraction reflect variations in both the amount of melt occurring at the surface and the extent to which meltwater infiltrating the firn refreezes within the firn body. To form ice layers within the firn column and/or the winter snowpack, infiltrating meltwater must come into contact with snow and/or firn at subfreezing temperatures. Firn temperatures measured at 1 m depth intervals in the upper 1–8 m of boreholes at sites 1 and 2 in 2012 ranged between −16°C and −22°C. These temperatures are sufficiently low to allow significant internal refreezing of surface-derived meltwater following the onset of surface melt in late spring and early summer.
The simplified ice fraction of each core section was calculated following Reference KoernerKoerner (1977) and Reference FisherFisher and others (2012):
Expressed as a percentage, the simplified ice fraction equals the sum of the thickness of the ice layers T i (mw.e.) divided by the total length of the ice core L (mw.e.) multiplied by 100. Since only bulk densities were measured in the field, ice layers were assigned a density of 875 kg m−3, the mean density of a sample of core sections containing 100% ice. The ice fraction was calculated for the entire length of each core using the stratigraphic record to identify ice layers and the density profile to calculate the total length (mw.e.) of the firn column. No correction was made for flow-induced layer thinning, since the top 18.5 m of firn is assumed to have undergone negligible flow-induced deformation (Reference PohjolaPohjola and others, 2002).
Density changes
Empirical firn depth–density relationships provide a simple and effective method for calculating the firn density profile in polar regions. Such empirical relationships are typically based on Sorge’s law (a steady-state firn depth–density profile), which applies where accumulation rates and summer melt conditions are constant over time (Reference BaderBader, 1954). To assess the continued validity of these empirical depth–density relationships, 15 m firn density profiles for the Colgan B, C and E sites were compared with the theoretical firn density profile calculated using the depth–density equation found in Reference Cuffey and PatersonCuffey and Paterson (2010, p.19).
Here density at a prescribed depth (ρ(z)) is a function of the density of ice (ρ i), the density of the spring snowpack (ρ s), the depth (z) and a site constant (zρ ). For Devon Ice Cap, the mean densities of ice (875 kg m−3) and snow (320 kg m−3) were calculated from ice cores and snow pits. The site constant was calculated from the 2004/05 firn profiles using a least-squares method to determine the best fit. For the three core sites Colgan B, C and E, the best-fitting site constants were calculated to be 19, 11 and 10, respectively.
Thickness changes
To assess the potential impact of changes in the firn densification rate on the ice-cap surface elevation, changes in the thickness of a surface layer containing 1.25 m w.e. were estimated from repeat measurements of density profiles at individual locations. The value of 1.25 m w.e. equates to the water equivalent of the minimum available core length in 2006. Previous work using chemical analysis of ice cores and the depth of the 1963 ‘bomb layer’ (a horizon line resulting from the atmospheric fallout of thermonuclear bomb testing and measured by down-borehole 137Cs gamma spectrometry) found net accumulation rates in the study area to be ~0.23 m w.e. a−1 (Reference Mair, Burgess and SharpMair and others, 2005; Reference Colgan and SharpColgan and Sharp, 2008). Given this accumulation rate, 1.25 m w.e. of firn would represent 5.4 years of net accumulation. This method of estimating near-surface firn thickness changes does not account for densification below the depth of 1.25 mw.e. and assumes that winter accumulation rates are constant from year to year, an assumption that is consistent with annual (2004–12) measurements of spring snowpack depths made at multiple locations along the CryoSat line between 1350 and 1850 m a.s.l. These measurements show a trend of only ~+0.01 m a−1 over the 8 year period.
To provide a context for assessing the significance of the magnitude of the computed changes in firn thickness since 2004, surface height changes for the period 2004–12 were calculated by comparing repeat airborne laser altimeter profiles measured along the CryoSat line in the spring of 2004 and 2012. On 2 May 2004, an elevation profile was measured with a Riegl LMSQ-280 laser scanner (www.riegl.com) mounted on the Alfred Wegener Institute’s Dornier 228 aircraft. On 4 May 2012, the elevation profile was remeasured as part of Operation IceBridge using NASA’s Airborne Topographic Mapper (ATM) on board a P-3B aircraft (http://nsidc.org/data/ilatm1b.html). The vertical accuracies of both datasets are estimated to be 110 cm. The net change in surface height was calculated at 10 m intervals along the CryoSat line by differencing the elevations of points measured in 2004 and 2012 that were located within 3 m of each other. To assess the relationship between changes in local firn properties and rates of surface height change, annual surface height change measurements along the CryoSat line were aggregated into five 100 m elevation bins covering the altitude range 1350–1850 m a.s.l.
Firn temperatures
Firn temperature profiles were measured in seven of the 15 m boreholes drilled in 2012 using 10 kΩ negative temperature coefficient (NTC) thermistors (accuracy 10.1°C). The thermistor string design and installation followed Reference Humphrey, Harper and PfefferHumphrey and others (2012). Assembled thermistor strings were laboratory-calibrated using an ice bath to verify accuracy. Following extraction of a firn core, a thermistor string was weighted and suspended in the borehole to ensure that the wire was taut and reached 15 m depth. Dry snow and core shavings were used to backfill the hole. To determine the duration of the thermal disturbance caused by drilling and backfilling of the borehole, a data logger (Campbell Scientific CR10X) was attached to the site 1 thermistors immediately after burial. These thermistors were read using three-wire half bridges; readings stabilized within 3 hours and remained constant for the following 16 days. This timescale for stabilization of firn temperatures is consistent with the observations of Reference Humphrey, Harper and PfefferHumphrey and others (2012) and indicates that: (1) thermal energy added or removed as a result of drilling and backfilling had dissipated into the surrounding firn by the time that profile measurements were made; and (2) the observed temperatures reflect the local firn temperature. All thermistors were left to stabilize for a minimum of 24 hours before measurements were made using a Uni-Trend UT33C multimeter. Thermistors were measured on 3 or 4 days, and readings were averaged to minimize the effect of measurement error. The mean standard deviation of firn temperature readings was 0.58°C and the range of standard deviations was 0.23–1.11 °C.
The 2004 firn temperature at site 1 was measured during the installation of the CryoSat line. This measurement was taken by suspending a HOBO temperature sensor 10 m down the borehole and allowing it to record for 24 hours. The method used to record the 2012 temperatures was similar to that used in 1971 and 1972, as detailed by Reference Paterson and ClarkePaterson and Clarke (1978). It incorporated redundancy and measurement verification by installing pairs of thermistors spaced 2–5 m apart down the length of the borehole.
MAATs were calculated using data from the AWSs at the summit (established in 1997) and site 2 (established in 2004) and from the HOBO air temperature sensors at HB 4-7, HB 9-1 and HB 13-7 (all established in 2004). Owing to equipment malfunctions and data loss, only one continuous year of temperature measurements was recorded at the site 1 AWS, so these data were excluded from the analysis. At the summit and site 2 AWS, Campbell Scientific 107B and 107F thermistors (accuracy ±10.4°C) were installed in Campbell Scientific Gill radiation shields 1–2 m above the spring snow surface; they measured temperature every minute and recorded hourly averages. At HB 4-7, HB 9-1 and HB 13- 7, air temperatures were recorded with HOBO Pro Series and HOBO Pro Series v2 loggers (accuracy ±0.7°C) installed in Onset RS1 radiation shields positioned 1.0–1.5 m above the spring snow surface. The height range of temperature sensors is primarily a result of the seasonal cycle of accumulation, ablation and firn compaction. The sensor heights are typically at a minimum in the spring following winter accumulation and at a maximum in the fall following summer ablation and firn compaction. Measurements from a Campbell Scientific SR50 sonic ranger located on the site 2 AWS show that sensor height varies by ~0.5 m annually. As a result of equipment failure and the extreme environmental conditions on the ice cap, data gaps are present in all the temperature records. Only complete years of records were used to calculate the MAAT. The MAAT values for the summit, HB 4-7, HB 9-1, HB 13-7 and site 2 were calculated using 9, 4, 5, 2 and 6 years of data, respectively. The start of a year is defined by the spring date (mid-April to mid-May) on which the weather station was serviced and data were downloaded. The service date, rather than a fixed date, was chosen to define the beginning of a year because it allowed for the maximum number of years to be used in the MAAT calculations.
For comparison, and to extend the air temperature records, the 700 hPa MAAT over the ice cap was calculated from the NCEP/NCAR R1 project (Reference KalnayKalnay and others, 1996). Reference Sharp, Burgess, Cogley, Ecclestone, Labine and WolkenSharp and others (2011) demonstrated that mean summer surface air temperatures in the accumulation zones of Devon and Agassiz Ice Caps were well correlated with the 700 hPa NCEP/NCAR R1 mean summer air temperatures over the respective ice cap.
Results and Discussion
Firn stratigraphy
A recent increase in the number and thickness of ice layers in the top 3 m of firn is apparent at all sites. This is especially evident at the Colgan B, C and E core sites (Fig. 2), for which we have 15 m observations for 2004/05 and 2012. The shallower cores recovered in 2012 along the CryoSat line (Fig. 3) also show an increase in ice content relative to the cores retrieved in 2004/06, and the spatial pattern of change clearly illustrates that the upper limit of firn containing ice layers accumulated over multiple years has shifted to higher elevations since 2004/05.

Fig. 2. Comparison of 15 m 2004/05 versus 2012 firn stratigraphy at Colgan B, C and E sites.

Fig. 3. Comparison of 3 m 2004/06 versus 2012 firn stratigraphy at selected sites along the CryoSat line. Gray indicates no data, where the 2006 cores were <3 m.
To quantify the change in stratigraphy between 2004/05 and 2012, we calculated the simplified ice fraction for each year for the Colgan B, C and E core sites (Table 1). At Colgan B and E, the ice fraction increased at each site from 31.1% and 51.4%, respectively, in 2004/05 to 45.0% and 58.5%, respectively, in 2012. The ice fractions for the Colgan C core site can be compared with those reported for the deep cores drilled in 1971 and 1972 as the sites are separated horizontally by ~7 km but by only ~15 m in elevation (Reference KoernerKoerner, 1977). The ice fraction in the top 20 m of the 1971/ 72 cores was ~15%, which is similar to that observed in 2004 (16.4%), but by 2012 it had increased to 30.3%. Linear regressions of the NCEP/NCAR 700 hPa air temperatures over the summit of Devon Ice Cap against time for the period 2005–12 show the mean December, January and February temperature has decreased by 0.19°C while the mean June, July and August air temperature has increased by 0.16°C. The resulting 0.35°C increase in summer/winter temperature contrast may be a contributing factor to the observed increase in ice content of the firn (cf. Reference Pfeffer and HumphreyPfeffer and Humphrey, 1998).
Table 1. Percent ice fraction calculated from water equivalent for Colgan B, C and E sites

Comparing the 2012 stratigraphic plots for the three Colgan sites with those from 2004/05, it is evident that there has been a notable decrease in the number of very thin ice lenses. We believe that this is a result of using the photographic method to record firn stratigraphy in the field in 2012. While the pictures were taken at the highest quality setting and stored in a RAW file format to avoid detail loss due to file compression, some millimeter-scale ice lenses that were visible in the field are not visible in the images. There are two possible explanations for the apparent disappearance of millimeter-scale ice layers in the 2012 images. The first is that an experienced human observer may be able to record a more detailed stratigraphy when viewing a firn core directly than when viewing IR images of it. Unfortunately, we do not have in situ stratigraphic logs from 2012 to verify this hypothesis. The second is that increased melt rates since 2004/05 have resulted in millimeter-scale ice layers being replaced by the thicker ice layers that are visible in 2012. The disappearance of millimeter-scale ice layers has ramifications for the calculation of ice fraction presented above. The values for 2012 are likely underestimated relative to the values from 2004/05, but despite this the ice fraction at all three Colgan sites increased between 2004/05 and 2012.
Shallow cores recovered along the CryoSat line reveal changes in the distribution of snow and firn facies within the accumulation zone since 2004 (Fig. 3). At that time, site 1 was located near the boundary between the quasi-dry-snow zone and the percolation zone, and site 2 was located in the wet-snow zone (Reference BellBell and others, 2008). These facies are visible in the core stratigraphy from 2004, in which site 1 has discrete sub-decimeter-thick ice layers and site 2 has meter-thick ice layers separated by firn layers. Surveys made in the 1960s located the superimposed ice zone between 1100 and 1300 m a.s.l. on the southern side of Devon Ice Cap (Reference KoernerKoerner, 1970). By 2012, cores composed almost entirely of ice were retrieved from locations between site 2 (1400 m a.s.l.) and MB 11-5 (1550 m a.s.l.), indicating that the lower limit of the wetted snow zone and the upper limit of the superimposed ice zone had increased in elevation by ~150 m since 2004. Increased surface melt since 2005 has resulted in large volumes of meltwater being stored in the upper firn column as infiltration ice. After several consecutive years of substantial internal accumulation, the infiltration ice layer appears to have become impermeable to meltwater percolation. As a result, meltwater from subsequent years refreezes on top of the previous summer’s ice layer and the superimposed ice zone has effectively extended up-glacier over the top of residual firn that is now hydrologically isolated from the glacier surface.
The effects of climatic change can also be seen in the 15 m firn profiles measured in 2012 at HB 9-1, HB 13-7 and site 2 along the CryoSat line. In Figure 4, we compare the stratigraphy of the bottom third of each core with that of the top third of the core to assess decadal-scale changes. The 1963 ‘bomb layer’ provides a scale for time as a function of depth in the recovered cores. It was found at 10.2–10.6 m depth in three cores drilled south of the summit between 1367 and 1504 m a.s.l. in 2000 and at 11.5 m in a core drilled at 1525 m a.s.l. in 2005 (Reference Mair, Burgess and SharpMair and others, 2005; Reference Colgan and SharpColgan and Sharp, 2008). The depth of the bomb layer was not measured in 2012, but, based on its depth in 2000 and 2005, we believe that the 15 m cores recovered in 2012 represent at least 50 years of net accumulation. There are clear changes in ice fraction and firn density between the lower and upper halves of the firn cores from all three sites. At site 2 and HB 13-7, near-continuous ice is visible down to 6.5 and 5.5 m, respectively. At HB 9-1, the impact of higher melt rates is evident from the higher ice fraction in the top 5.5 m of the core, although the core from this site is not yet composed entirely of ice. The increase in near-surface firn density over time is also evident at higher elevations. The impermeability of the infiltration/superimposed ice layer has ramifications for calculations of the meltwater storage potential of the underlying firn and for the likelihood of supraglacial runoff from this part of the accumulation area of the ice cap, as it appears unlikely that pore space in the underlying firn will ever be homogeneously filled with infiltration ice.

Fig. 4. 15 m firn stratigraphy in 2012 at HB 9-1, HB 13-7 and site 2 on the CryoSat line. 15 m of firn stratigraphy represents at least 50 years of net accumulation, allowing for a comparison of decadalscale changes in summer melt conditions.
Firn density
Given the recent increase in the ice content of cores from all sites, an increase over time in the density of the top 2.5–3.0 m of firn was anticipated. To assess the magnitude of changes in firn density at the three Colgan core sites, density profiles from 2004/05 are plotted alongside those from 2012 (Fig. 5). Profiles from 2004/05 show a general trend of increasing density with depth, but this trend is not evident in the 2012 profiles, in which densities increase upwards in the top 3–4 m. This change is clearly illustrated by plots of the difference between the 2004/05 and 2012 density profiles. In the density difference plots, there are a number of layers in the top 3 m for which the density change exceeds two standard deviations of the mean density in the bottom 10 m of the core. This demonstrates that the density changes observed in the top 3 m of the firn layer are well above what is attributable to historically normal climatic variability. Firn density increases significantly upwards in the top 3 m of the Colgan B and C cores. At Colgan E, there is more variability in the pattern of firn density changes in the top 3 m, but the increases are larger than the decreases. At depths >3 m, the changes in firn density tend to be slightly negative. A peak in the magnitude of density decrease is evident between 3 and 4 m depth at all sites. One possible explanation for this is that a thick ice lens known to have formed in 2005 (the first year of extreme melt) created an impermeable barrier for both meltwater percolation and the transport of sublimated water vapor, causing the formation of a well-developed depth hoar layer below the ice layer. As a result, in subsequent years, meltwater that would typically have percolated downwards and refrozen to increase the density of deeper firn layers, instead pooled and refroze on top of the 2005 ice layer, increasing the density higher in the firn profile.

Fig. 5. Measured and empirically derived (thick gray line) firn density profiles for Colgan B, C and E sites. The firn density change is the 2012 firn density less the 2004/05 firn density. The dashed lines represent ±2 standard deviations from the mean change of the bottom 10 m.
Empirical relationships provide a method for calculating the firn density profile in the absence of in situ observations. Since these relationships are based on the assumption of steady-state climatic conditions, it is important to assess their validity under changing climatic conditions. Figure 5 compares the measured 15 m firn density profiles for the Colgan B, C and E sites with the empirically derived firn density profile (thick gray line). Here it is apparent that the density of the top 2.5–3.0 m of firn has increased to well above the expected values. For the full length of all three cores, the mean percentage difference between the empirically estimated and measured densities increased from 16.1% to 33.8% over the period from 2004/05 to 2012. For the top 4 m, the mean difference increased from 33.1% to 67.3% over the same period. This clearly suggests that, during periods of climate warming, the use of Sorge’s law to estimate the density of material added to, or removed from, the surface of a firn layer over time is problematic.
Based on the density profiles from the Colgan sites, the top 3 m of firn appear to have been affected most strongly by increasing meltwater penetration and refreezing, resulting in density increases. To expand the scope of our analysis of density changes, we calculated the average density of a 2.5 m thick column of firn (measured downwards from the firn surface) for each of the shallow core sites along the CryoSat line that were sampled in 2004/06 and 2012 and for the three Colgan sites that were sampled in 2004/05 and 2012 (Table 2). All sites show a higher average density in the top 2.5 m of the profile at the time of the most recent coring than at the time of first coring. The average density increase ranged between 13.0% and 80.3% and was generally larger at elevations below MB 11-5 (~1490 m a.s.l.) than above that location. Above MB 11-5, the mean change in average density was 25.7 ± 8.5%; below MB 11-5, it was 44.1 ± 16.7%.
Table 2. Average density of a 2.5 m deep column of firn (kg m−3)

Assuming a constant snow accumulation rate, the observed density increase in the upper 3 m of the firn can be interpreted as being largely a response to increased surface melt and internal refreezing. It also provides an indication of the ability of firn layers to absorb meltwater. Since increased ice content indicates a reduction in available pore volume, it is very likely that the thickness of the firn layer that contains a given mass of water has decreased since the mid-2000s. Again, assuming constant accumulation rates, this would have resulted in a lowering of the ice-cap surface. This effect should be taken into account when estimating the mass change associated with altimetrically determined lowering of the ice-cap surface.
Firn thickness changes
Firn thicknesses associated with the upper 1.25 m w.e of each core in 2004/06 and 2012 are presented in Table 3. The rate of decrease in the thickness of this layer over time ranges from 0.021 to 0.168 m a−1 . The largest rates were found in the region between MB 10-3 and MB 15-9 (1430–1575 m a.s.l.) where there has been significant accumulation of infiltration ice within the firn since 2004.
Table 3. Firn thickness (m) calculated from the density profile of a 1 m2 surface layer that is 1.25 m w.e. deep
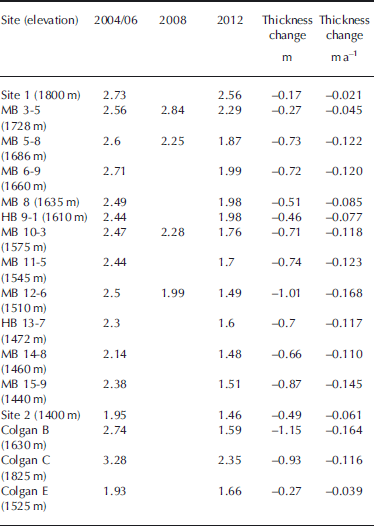
To determine whether the thinning of the uppermost part of the firn column that has been affected by more rapid densification could have caused changes in the elevation of the ice-cap surface, we compared the computed thinning rates with available measurements of surface height change in the study region. Repeat airborne laser altimetry surveys conducted in 1995 and 2000 found that the summit region of Devon Ice Cap was thickening at a rate of 0.20 m a−1 (Reference AbdalatiAbdalati and others, 2004). Using mean annual net accumulation rates and measurements of ice discharge from the summit region through a series of flux gates, Reference Colgan, Davis and SharpColgan and others (2008) calculated the mean rate of ice-cap thickness change between 1963 and 2003 to be 0.01 ± 0.12 m w.e. a−1.Repeat airborne laser altimetry measurements made between 2004 and 2012 suggest that the 1995–2000 trend of increasing surface elevation in the summit region now appears to have been reversed (Table 4). Mean rates of surface elevation change over the 2004–12 period ranged from −0.077 m a−1 in the 1750–1850 m elevation bin to −0.252 m a−1 in the 1350–1450 m bin. These changes are attributable to some combination of variability in the winter snowpack thickness and density, changes in the rate of firn densification over the full depth of the firn profile, changes in the rate of ice flow and (especially at lower elevations) changes in meltwater runoff.
Table 4. Comparison of calculated firn thickness changes from Table 3 and surface height changes measured by repeat airborne laser altimetry for the period 2004–12

Observed rates of change in the thickness of the end-ofwinter snowpack have been relatively constant (+0.01 m a−1) and are both small and of opposite sign to the observed rates of surface elevation change. The period of observation (2004–12) is likely too short for significant changes in the rate of ice flow to have occurred, as ice flow in the high-elevation region of Devon Ice Cap is governed by rates of ice deformation rather than basal sliding or bed deformation (Reference Burgess, Sharp, Mair, Dowdeswell and BenhamBurgess and others, 2005). Although we lack the data required to estimate the change in the rate of firn densification for the full firn profile, it is clear that the estimated rates of change in the thickness of the upper 1.25 m w.e. of the firn layer alone are large relative to the magnitude of observed surface elevation changes. This is particularly apparent in the upper two elevation bins (1650–1750 and 1750–1850 m a.s.l.), where the increase in firn density can account for 77% and 90% of the observed surface height change, respectively. This strongly suggests that more rapid firn densification is contributing significantly to the recently observed decrease in surface elevation of the summit region of Devon Ice Cap. Since this acceleration of firn densification is linked to increased storage of meltwater as ice layers within the firn, it is probable that the latent heat released during refreezing will have raised the firn temperature at 10–15 m depth (the level at which the annual cycle of variations in air temperature no longer affects the firn temperature) relative to both historic measurements and the MAAT.
Firn temperatures
The difference between firn temperatures at 10–15 m depth and local MAATs provides an indication of the magnitude of meltwater penetration and refreezing. In the absence of internal refreezing, the 10–15 m firn temperature approximates the MAAT (Reference Paterson and ClarkePaterson and Clarke, 1978; Reference Humphrey, Harper and PfefferHumphrey and others, 2012). When internal refreezing occurs within the firn, however, latent heat is released and can warm the surrounding firn. Firn temperature profiles were measured in boreholes drilled at sites ranging in elevation from 1400 to 1900 m a.s.l. The MAAT at site 2 is −17.7°C while the 10 and 15 m firn temperatures are −14.6°C and −14.3°C, respectively (a difference of +3.1–3.4°C). At the summit, where the MAAT is −20.5°C, the 10 and 15 m firn temperatures are −18.9°C and −18.5°C, respectively (a difference of only +1.6–2.0°C) (Fig. 6a). This suggests that, as expected, the magnitude of firn warming due to latent heat release during refreezing decreases with increasing elevation.

Fig. 6. (a) MAAT and firn temperatures across the elevation range of the accumulation zone. (b) MAAT and firn temperature observations on the summit plateau for 1971/72, 2004 and 2012.
The longest time series of firn temperatures is available for the summit plateau, a very broad ridge to the west of the icecap summit with elevations ranging from 1800 to 1825 m a.s.l. The 1971 and 1972 ice cores were drilled ~8 km northeast of site 1, at 1825 m a.s.l. Reference PatersonPaterson and others (1977) reported the MAAT for these core sites in 1971 and 1972 as −23°C. The summit AWS, which is 100 m above these core sites, had a MAAT for the period 1997–2008 of −20.5°C, suggesting warming of perhaps 2.5°C since the early 1970s. To put these observations into perspective, the 700 hPa MAATs from the NCEP/NCAR R1 are shown in Figure 7. Although there is a large degree of variability, linear regression suggests that the MAAT has increased by ~1.5°C since 1990 and ~1.8°C since 1970.

Fig. 7. NCEP/NCAR 700 hPa MAAT for the summit region of Devon Ice Cap.
Figure 6b shows the observed firn temperatures on the summit plateau in 1971/72, 2004 and 2012. In 1971/72, firn temperatures at 10 and 15 m were −23.2°C and −23.1°C, respectively. In 2004 the 10 m firn temperature at site 1 (located on the southwestern edge of the summit plateau) was −21.3°C, but by 2012 the firn temperature at that location had risen to −17.5°C at 10 m and −17.4°C at 15 m. Thus, while the MAAT has increased by ~1.8°C since 1970, the 10 and 15 m firn temperatures have increased by ~5.7°C. Between 2004 and 2011, the 10 m firn temperature at site 1 rose by 3.8°C. Based on a linear regression from 2004 to 2011, the MAAT rose by 1.0°C, leaving 2.8°C of warming that could be attributed to warming by latent heat released by freezing meltwater.
The potential rise in firn temperature at 15 m that could be attributed to latent heat released by refreezing of meltwater can be estimated from the gain in mass of the top 2.84 m of the firn (depth to the bottom of the major ice layers) since 2004. Although the source of latent heat is assumed to be located at the top of the firn column (because ice build-up in the upper part of the firn column limits vertical percolation of meltwater), it is assumed to raise the firn temperature uniformly across the upper 15 m of the profile. At site 1, the latent heat released between 2004 and 2012 will have been sufficient to warm the upper 15 m of firn by 2.5°C. The total warming due to air temperature changes and latent heat released during refreezing is therefore ~3.5°C, which is comparable to the measured warming (3.8°C).
These observations are consistent with recent observations from western Greenland and Penny Ice Cap, Baffin Island (Reference Humphrey, Harper and PfefferHumphrey and others, 2012; Reference ZdanowiczZdanowicz and others, 2012). In western Greenland, 10 m firn temperature rose by 0.45–2.6°C a−1 between 2007 and 2009 (Reference Humphrey, Harper and PfefferHumphrey and others, 2012). Reference ZdanowiczZdanowicz and others (2012) reported a MAAT in the summit region of Penny Ice Cap of −16°C between 1992 and 2000. Based on a regression of the NCEP/ NCAR 700 hPa air temperatures against time, the MAAT rose by 0.8°C over the period 2000–11. Firn temperatures at 10 m depth remained stable (−13°C) in measurements taken between 1953 and 2000. However, measurements taken at 9 m depth showed that the firn temperature rose by 10°C from 2000 to 2011. The observations at Devon and Penny Ice Caps strongly suggest that the recent rise in 10–15 m firn temperatures has been driven primarily by latent heat released by refreezing meltwater.
Summary and Conclusions
Airborne laser altimetry measurements made in 1995 and 2000 (Reference AbdalatiAbdalati and others, 2004) showed that the higher-elevation regions of Devon Ice Cap were increasing in elevation. However, both airborne laser altimetry and field measurements show that the surface elevation in this region decreased between 2004 and 2012 and that net annual accumulation in the higher-elevation regions of Devon Ice Cap was increasingly being stored as either infiltration ice or firn with a higher density than that which existed prior to 2004. Changes in firn stratigraphy, density and temperature all indicate higher melt rates and increased infiltration and refreezing of meltwater within the firn layer. This strongly suggests that part of the surface height decreases detected by repeat altimetry measurements may be attributed to accelerated firn densification rather than to mass loss.
Evidence of firn profile changes is found in the growth of thick ice layers in the uppermost 3 m of the firn layer and in the upward migration of the upper limit of >1 m thick multiyear ice layers from ~1300 to ~1550 m a.s.l. An inflection is now evident in the 15 m firn depth–density profiles, with higher densities in the upper 3 m than in the region between 5 and 10 m depth. The average density of the top 2.5 m of firn has also increased sharply (by an average of 36% since 2004). As a result, firn depth–density profiles computed using Sorge’s law no longer compare favorably with measured profiles. Calculated rates of change in the thickness of a 1.25 m w.e. layer of firn between 2004/06 and 2012 ranged from −0.021 to −0.168 m a−1 and are significant in comparison with the magnitude of surface height changes derived from repeat airborne laser altimetry (−0.077 to −0.252 ma−1). Air temperature changes and increased latent heat release by refreezing meltwater raised 10 m firn temperatures near the ice-cap summit from −23°C in 1971/ 72 to −21.3°C in 2004 and −17.5°C in 2012. Of the observed 3.8°C rise in firn temperature since 2004, 1.0°C is attributable to increasing MAAT and 2.5°C is attributed to the increasing latent heat release from the refreezing of meltwater within the firn layer.
Earlier studies focusing on the response of arctic glaciers and ice caps to climate warming suggested that they would be capable of self-buffering against a warming climate due to their thermal inertia and ability to absorb and retain meltwater within firn (Reference DowdeswellDowdeswell and others, 1997; Reference Jansson, Hock and SchneiderJansson and others, 2003). More recently, Reference Harper, Humphrey, Pfeffer, Brown and FettweisHarper and others (2012) calculated the meltwater storage capacity of the Greenland ice sheet under the implicit assumption that the pore space of the entire firn column would ultimately be filled with infiltration ice. The firn layer of Devon Ice Cap still provides a degree of buffering against rising air temperatures (because its pore volume has not yet been filled with infiltration ice and its temperature is still well below the freezing point). However, summer warming since 2005 has resulted in increased surface melting and major changes in the physical and thermal properties of the firn layer. These include the accumulation of decimeter- to meter-thick infiltration ice layers in the upper 4 m of firn (which continues to have spring temperatures well below freezing) and increases in 10–15 m firn temperatures that are driven primarily by the latent heat released by refreezing of the infiltrating meltwater.
Rising firn temperatures and densification of the upper layers of the firn will, in time, encourage more rapid densification below the depth to which meltwater percolates. Additionally, increased firn density and thicker ice layers will alter the thermal conductivity of the firn profile. The development of thick ice layers will also, and perhaps more significantly, change the path along which meltwater flows by increasing the resistance to vertical percolation and promoting the likelihood of supraglacial runoff and horizontal percolation. These changes have significant implications for interpreting altimetrically measured surface elevation changes in regions where surface melt, infiltration and refreezing are occurring in terms of changes in climatic mass balance. Assuming that rates of snowfall and vertical strain remain unchanged, more rapid firn densification will cause thinning of the firn layer and lowering of the ice-cap surface. Initial estimates for two locations on Devon Ice Cap suggest that this process could account for between 77% and 90% of measured rates of surface lowering over the period of observation. Thus it is not safe to assume that lowering of the surface of high-elevation regions of ice caps subject to climate warming necessarily (or simply) indicates loss of mass from those regions. Furthermore, the increase in ice content of the upper part of the firn since 2004 has reversed the vertical gradient of firn density as a function of depth. It now shows a trend of increasing density towards the surface. This reversal of the depth–density profile means that the use of Sorge’s law to estimate the density of firn inferred to have been removed from the ice cap during the period of surface warming is problematic.
Therefore, it is reasonable to conclude that outside the dry-snow zone in periods of climate warming (at least in their initial phases) estimation of rates of mass loss from measurements of surface elevation change in the accumulation zones of glaciers and ice caps is only possible if the temporal and spatial distribution of surface meltwater production, infiltration and refreezing can be modeled reliably. While these processes are currently parameterized in existing models (e.g. Reference Ettema, Van den Broeke, Van Meijgaard, Van de Berg, Box and SteffenEttema and others, 2010), most of them assume homogeneous infiltration of meltwater into firn, while observations suggest that infiltration is commonly heterogeneous. In the absence of in situ measurements against which these models can be validated, studies have relied on inter-model comparison and sensitivity studies to test the quality of the parameterizations (Reference Reijmer, Van den Broeke, Fettweis, Ettema and StapReijmer and others, 2012). This makes it very difficult to assess whether current models are adequate for the task and suggests a need for both more field measurements of changing firn properties during climate warming and a model intercomparison exercise designed to evaluate how well existing models can simulate observed changes.
Acknowledgements
We thank the Natural Sciences and Engineering Research Council of Canada (Discovery Grant to M.S. and Canada Postgraduate Scholarship to P.B. and G.G.), the Canadian Circumpolar Institute and the Northern Scientific Training Program (Indian and Northern Affairs Canada) for financial support. The Polar Continental Shelf Program (Natural Resources Canada) provided some logistical support for the fieldwork. Support for D.B. was provided by the Climate Change Geoscience Program, Earth Sciences Sector, Natural Resources Canada. The Alfred Wegener Institute for Marine and Polar Research measured the 2004 surface elevation profile as part of the CryoSat2 calibration/validation field campaign. The Nunavut Research Institute and the communities of Resolute Bay and Grise Fjord granted permission to conduct research on Devon Ice Cap. Special thanks go to everyone who helped conduct fieldwork on Devon Ice Cap between 2004 and 2012. Finally, we thank two anonymous reviewers for suggestions that greatly improved the quality of this paper.


