

Fertility in human populations is a complex phenomenon produced by a multifactorial arrangement of genetic and environmental antecedents (Tropf et al., Reference Tropf, Stulp, Barban, Visscher, Yang, Sneider and Mills2015). Particular attention has been paid to the role of cognitive variables in determining fertility outcomes. Negative associations between cognitive ability and fertility were first intuited by Galton (Reference Galton1869), when he noted that individuals from lower socio-economic status backgrounds tended to produce larger families than those from higher status backgrounds. Early studies utilizing direct measurements of cognitive ability (i.e., IQ tests) and sibling number (as an indicator of the reproductive success of the previous generation) corroborated Galton's intuition, via the finding of negative correlations between the two (e.g., Lentz, Reference Lentz1927). These findings led to the prediction that IQ scores may decline over the course of generations due to selection pressures stemming from these negative associations. However, longitudinal studies comparing cohorts evaluated in the early decades of the 20th century with those evaluated in subsequent decades found the opposite trend, that is, an apparent increase in IQ (Cattell, Reference Cattell1950), consistent with what is now termed the Flynn effect.
Interest in the question of the causes and implications of the negative relationship between IQ and fertility subsequently waned, until the 1990s, when Lynn (Reference Lynn1996) proposed that the selection pressure stemming from the negative association might be reducing the more heritable variance components of IQ (which he termed genotypic IQ), the effects of which are being masked by environmental improvements (such as increased access to micronutrients) enhancing the more environmentally sensitive variance components of IQ (phenotypic IQ). Lynn also suggested that educational attainment (essentially the amount of time spent in education) may be a major cause of this negative relationship, as higher ability individuals might trade fertility against the opportunity to acquire skills and knowledge, an effect that should be especially strong among females, given their relatively narrower fertility window. Consistent with this trade-off model, negative associations have been directly observed between educational attainment and fertility, both across cultures (Meisenberg, Reference Meisenberg2008) and time (Skirbekk, Reference Skirbekk2008). Meisenberg (Reference Meisenberg2010) utilized structural equation modeling to analyze factors mediating the relationship between IQ and fertility among a large, nationally representative sample of the U.S. population. Consistent with the trade-off model, it was found that educational attainment partially mediated the negative relationship between the two. Meisenberg furthermore found indications of more strongly negative correlations between educational attainment and fertility among the female population.
Recent developments involving genome-wide association studies (GWAS) have yielded evidence that certain single-nucleotide polymorphisms (SNPs; termed ‘hits’) have robust (genome-wide significant) associations with individual differences in educational attainment and also IQ (e.g., Rietveld et al., Reference Rietveld, Medland, Derringer, Yang, Esko, Martin and Koellinger2013; Rietveld et al., Reference Rietveld, Esko, Davies, Pers, Turley, Benyamin and Koellinger2014). Increased power has led to the discovery of dozens of these ‘hits’, which when concatenated into polygenic ‘risk’ scores (PGS), seem to predict a portion of the individual variation in both educational attainment and IQ across several large databases (Okbay et al., Reference Okbay, Beauchamp, Fontana, Lee, Pers, Rietveld and Benjamin2016; Selzam et al., Reference Selzam, Krapohl, von Stumm, O'Reilly, Rimfeld, Kovas and Plomin2016). One potential use for these PGS values is in investigating their role as antecedents of fertility. Two studies have attempted to do precisely this. Beauchamp (Reference Beauchamp2016) utilized a large and representative sample of the population of the United States born between 1931 and 1953, sourced from the U.S. Health and Retirement Study (HRS). It was found using regression analysis that an educational attainment PGS negatively predicted fertility (measured as relative lifetime reproductive success). The magnitude of the association, coupled with a correction for the ‘missing’ heritability of educational attainment, led Beauchamp to predict that attained education should decline at a rate of 1.5 months per generation due to genetic selection. A second study (cf. Conley & Domingue, Reference Conley and Domingue2016; Conley et al., Reference Conley, Laidley, Belsky, Fletcher, Boardman and Domingue2016), also utilizing data from the U.S. HRS but this time from samples born between 1919 and 1955, replicated Beauchamp's finding of negative associations between an educational attainment PGS and completed fertility; however, the apparent secular increase in the strength of the negative phenotypic association between the two was not paralleled by a corresponding secular increase in the strength of the genetic association.
Unlike Meisenberg (Reference Meisenberg2010), neither Beauchamp (Reference Beauchamp2016, cf. Woodley of Menie, Reference Woodley of Menie2016) nor Conley and co-workers (Reference Conley, Laidley, Belsky, Fletcher, Boardman and Domingue2016) examined IQ directly, nor was the possibility of mediation considered. In point of fact, these researchers treat educational attainment as a phenotype, and as a potential target for selection. Educational attainment is better conceptualized, however, as an outcome of facultative calibration during childhood and young adulthood in response to the action of heritable characteristics such as IQ, with which it shares ≈60% of its (linkage pruned) genetic variance (Okbay et al., Reference Okbay, Beauchamp, Fontana, Lee, Pers, Rietveld and Benjamin2016). Thus, as Lynn predicted, it is likely the trade-off between the opportunity to acquire skills and knowledge, and fertility evoked by a high-IQ individual's genetic affinity for the specific set of environments embodied in the educational system, rather than a genetic disposition towards lower fertility per se, that should result in reduced fertility among such individuals. Consistent with this is the relatively low additive heritability of fertility in modern populations (≈0.30; Tropf et al., Reference Tropf, Stulp, Barban, Visscher, Yang, Sneider and Mills2015), which indicates considerable potential plasticity in response to environmental mediators such as years of schooling. Furthermore, genes for higher IQ do not seem to suppress intrinsic fertility, as indicated by the presence of small-magnitude positive phenotypic correlations with indicators of reproductive fitness potential, such as sperm quality (Arden et al., Reference Arden, Gottfredson, Miller and Pierce2009). This is also consistent with the observation that among Western population, in the absence of factors such as universal education prior to the 19th century, potential proxies for IQ such as social status actually seem to have been positively phenotypically associated with fitness outcomes (Skirbekk, Reference Skirbekk2008).
In the present study, the question of the potential mediating role of educational attainment on the relationship between IQ, PGS, and fertility will be considered in relation to newly released cognitive PGS data from the National Longitudinal Study of Adolescent to Adult Health (Add Health), as utilized in a recent publication by Domingue and colleagues (Reference Domingue, Belsky, Conley, Harris and Boardman2015).
Methods
Data
Data for the current study were drawn from the Add Health, a longitudinal and nationally representative sample of American youth enrolled in middle or high school during the 1994–1995 academic year (Harris et al., Reference Harris, Florey, Tabor, Bearman, Jones and Udry2009). Participants were recruited using a multistage cluster design resulting in the selection of 132 schools (80 high schools and 52 middle schools) stratified by region, urbanicity, school type, ethnicity, and size. Students at each selected school were asked to participate in the study, with a total of over 90,000 students completing the in-school portion. A sub-sample of these students was asked to participate in the more comprehensive in-home portion of the study. In total, 20,744 participants aged between 12 and 21 (and 17,700 of their primary caregivers) completed the Wave I in-home interview, which covered a wide variety of topics, including physical and mental health, delinquent behavior, physical development, and family interactions. The second wave of the study was completed between 1995 and 1996 and included 14,738 participants who also completed the Wave I interview. Wave III of the study was completed between 2001 and 2002, when participants were aged between 18 and 28 years, and included 15,197 of the original participants. Based on the amount of time that elapsed between the Wave II and Wave III interviews (approximately 5–6 years), the survey instruments utilized were updated to tap more age-appropriate topics such as romantic relationships, civic participation, and contact with the criminal justice system. Finally, the fourth and most recent wave of interviews was completed between 2007 and 2008, when participants were aged between 24 and 34 years. A total of 15,701 participants from the in-home sample completed the Wave IV interview.
Nested within the full sample of in-home participants is a sub-sample of over 3,000 pairs of individuals from the same household (including twin and sibling pairs; for more information on sampling procedures and the composition of the sibling sub-sample, see Harris et al., Reference Harris, Halpern, Smolen and Haberstick2006). Members of the sibling sub-sample who participated in the fourth wave of the study were also asked to provide a saliva sample for DNA extraction.Footnote 1 Approximately 96% of the sibling sub-sample provided saliva samples (for additional details, see Harris et al., Reference Harris, Halpern, Haberstick and Smolen2013). After a series of quality control (QC) and quality assurance (QA) steps, genome-wide data were made available for a total of 1,886 participants (905 males and 981 females; for a more detailed description of the QC/QA procedures, see McQueen et al. (Reference McQueen, Boardman, Domingue, Smolen, Tabor, Killeya-Jones and Harris2015)). The final analytic sample was restricted to those individuals with valid genome-wide information (n = 1,886). Compared to omitted participants, members of the final analytic sample had a significantly greater number of children (t = -5.27, p < .001), pregnancies (or a significant other who had been pregnant; t = -5.00, p < .001), and number of live births (t = -5.29, p < .001), but had significantly lower levels of verbal IQ (t = 4.11, p < .001) and educational attainment (t = 6.29, p < .001), and were younger (t = 3.41, p < .001). The final analytic sample also included a significantly greater proportion of Caucasian participants (χ2 = 55.46, p < .001), but the proportion of male participants was not significantly different from those Wave IV participants who were excluded from the final analytic sample (χ2 = 1.85, p = .17). Means, proportions, minimum and maximum values, and sample sizes for all measures included in the current study are presented in Table 1. Descriptive statistics are presented for the full sample as well as the sex-restricted sub-samples.
Descriptive Statistics for the Full Sample and Male and Female Sub-samples

The wave at which each set of measures were collected are presented in parentheses.
Measures
Fertility
Fertility was measured using three items from the Wave IV interview tapping reproductive success. More specifically, female participants were asked to report the number of times they had been pregnant (including a current pregnancy and pregnancies that resulted in an abortion, miscarriage, or stillbirth), the total number of live births that resulted from such pregnancies, and the total number of living children at the time of the interview. Male participants were asked a similar set of questions, but the pregnancy item was modified to reflect the number of times each respondent had ‘made a partner pregnant’. Female participants reported a greater number of living children (M = 1.38, SD = 1.25; t = 6.69, p < .001)Footnote 2 , pregnancies (M = 1.83, SD = 1.66; t = 5.86, p < .001), and live births (M = 1.28, SD = 1.26; t = 6.83, p < .001) compared to male participants (M = 0.98, SD = 1.20; M = 1.37, SD = 1.78; M = 0.89, SD = 1.19, respectively). The construction of the fertility measure is discussed in more detail below.
Verbal IQ
Verbal IQ was measured using the Picture Vocabulary Test (PVT), a modified version of the Peabody Picture Vocabulary Test - Revised (PPVT-R), which was administered during Wave I interviews between the ages of 12 and 21. Scores on the PVT were measured continuously and standardized by age (M = 97.13, SD = 14.43). The difference in PVT scores between male (M = 97.88, SD = 14.57) and female (M = 96.44, SD = 14.27) participants was significant (t = -2.12, p = .03). Strictly speaking the PPVT test series measures verbal ability; however, it has been found to correlate strongly with measures tapping other cognitive domains, indicating that it is a good measure of general intelligence (g) also (Dunn & Dunn, Reference Dunn and Dunn1997).
Educational attainment
During Wave IV interviews, participants were asked, ‘What is the highest level of education you have achieved to date?’ Responses were coded categorically as follows: 1 = 8th grade or less; 2 = some high school; 3 = high school graduate; 4 = some vocational school after high school; 5 = completed vocational school; 6 = some college; 7 = completed a 4-year college degree; and 8 = additional college beyond a 4-year degree (M = 5.45, SD = 1.85). Females reported significantly greater levels of educational attainment relative to males (t = 5.11, p < .001).
Polygenic educational attainment score
During Wave IV interviews, saliva was collected using the Oragene collection method and genotyping was conducted with the Illumina HumanOmni1-Quad v1 platform (Harris et al., Reference Harris, Halpern, Haberstick and Smolen2013; McQueen et al., Reference McQueen, Boardman, Domingue, Smolen, Tabor, Killeya-Jones and Harris2015). After QC procedures, valid data were available for 940,862 SNPs (for more information, see McQueen et al. (Reference McQueen, Boardman, Domingue, Smolen, Tabor, Killeya-Jones and Harris2015)). Using information from the genome-wide database, polygenic educational attainment scores (PGS) were calculated for each participant. More specifically, SNPs included in the genetic database were matched with SNPs identified in a large-scale GWAS of educational attainment (Rietveld et al., Reference Rietveld, Medland, Derringer, Yang, Esko, Martin and Koellinger2013). Each of the identified SNPs were then multiplied by the effect size estimated in the GWAS, summed, and then z transformed (M = 0, SD = 1) to create the PGS (for additional details, see Domingue et al. (Reference Domingue, Belsky, Conley, Harris and Boardman2015)).
Statistical covariates
Three demographic covariates were also included in the estimated models. First, Wave I age was measured continuously in years (M = 16.02, SD = 1.72) and was not significantly different between males and females (t = -1.43, p = .15). Second, race was measured dichotomously such that 0 = Caucasian (54.24%) and 1 = all other races (45.76%). The distribution of the examined race categories was not significantly different across sex (χ2 = 0.22, p = .64). Domingue et al. (Reference Domingue, Belsky, Conley, Harris and Boardman2015) found that the PGS predicted both educational attainment and verbal IQ to an approximately equal degree in both Whites and Blacks. Race is nevertheless controlled in the present analysis, as it is a potential source of confounding population stratification on the distribution of PGS and the outcome measures. Third, sex was included in all models analyzing the full sample and was coded 0 = female (52.01%) and 1 = male (47.99%).
Plan of Analysis
Models were estimated in three steps. First, zero-order correlations were estimated in an effort to examine the potential bivariate associations. The second step of the analysis involved a series of measurement models aimed at identifying a fertility factor. Confirmatory factor analysis (CFA) was used to identify the latent fertility measure using the three indicators from Wave IV (total number of pregnancies, live births, and children). Since the CFA included only three indicators, the resulting model was just-identified (i.e., the number of estimated parameters was equal to the degrees of freedom), resulting in uninterpretable fit parameters (e.g., χ2 = 0.00, p = 1.00). Despite this limitation, the magnitude (and accompanying p values) of the standardized factor loadings can be used as a secondary indicator of the extent to which the estimated model taps the underlying latent construct of fertility. Since the results of preliminary analyses revealed that all of the indicators included in the fertility measurement model significantly differed between males and females, a series of multi-group CFA (MGCFA) models were estimated to test for measurement invariance across sex. Comparative model fit was estimated using likelihood ratio tests (LRTs), the results of which are distributed in χ2 units.
The third and final step of the analysis involved the estimation of a series of structural equation models (SEMs) examining the direct and indirect pathways between the PGS, educational attainment, verbal IQ, and fertility. Based on the primary objectives of the current study, four specific pathways were examined. First, the direct pathway between the PGS and fertility was examined. Second, in an effort to identify the potential mechanisms that ultimately connect previously observed associations between PGS and fertility, two indirect pathways were examined, with verbal IQ and highest level of educational attainment included as potential mediators. An additional indirect pathway, in which educational attainment mediated the association between verbal IQ and fertility, was also examined. Third, in an effort to identify potential mechanisms that ultimately connect PGS and educational attainment, verbal IQ was also entered into the SEM as a potential mediating variable between the PGS and highest levels of educational attainment. All models included controls for age, race, and sex (in models examining the full analytic sample). In an effort to examine the potential moderating effects of sex, additional multi-group SEMSs were also estimated. The resulting indirect effects for males and females were compared using difference tests and z scores. Directly in line with previous research (MacKinnon et al., Reference MacKinnon, Lockwood, Hoffman, West and Sheets2002; MacKinnon et al., Reference MacKinnon, Lockwood and Williams2004; Preacher & Hayes, Reference Preacher and Hayes2008), the standard errors, and corresponding confidence intervals, for the indirect pathway models were estimated using bootstrapping procedures with 5,000 replications.
All models were estimated using Mplus 7.4 (Muthén & Muthén, 2008–2012). Measurement models were estimated using a maximum likelihood estimator with robust standard errors (MLR), while SEMs (due to the presence of a categorical educational attainment measure) were estimated using a weighted least squares estimator with robust standard errors (WLSMV), and missing data were handled using full information maximum likelihood (FIML) estimation. Model fit was assessed using χ2, the comparative fit index (CFI), the Tucker-Lewis Index (TLI), and the root mean square error of approximation (RMSEA). The following conventional cut-off values were used to evaluate acceptable model fit: CFI ≥ 0.95; TLI ≥ 0.95; and RMSEA ≤ 0.06 (for more information, see Hu and Bentler (Reference Hu and Bentler1999)).
Results
Bivariate Correlations
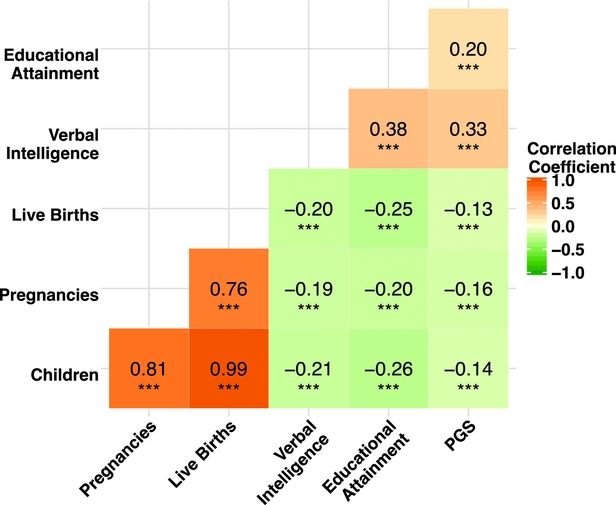
The results of the zero-order correlations are presented as a heat map in Figure 1, along with the corresponding coefficients and accompanying significance levels. In an effort to aid in interpretation, darker colors indicate larger correlation coefficients. As indicated in the figure, all of the examined study variables were significantly (p < .001) associated with one another at the bivariate level. The fertility measures were all strongly associated with one another, with correlations ranging between r = 0.76 (the association between pregnancies and live births) and r = 0.99 (the association between number of children and live births). In addition, the fertility measures were negatively associated with verbal IQ, educational attainment, and the PGS, providing preliminary evidence that the association between genetic influences and fertility may be mediated by educational influences. Finally, verbal IQ, educational attainment, and the PGS were all modestly associated with one another.
Heat map displaying zero-order correlation coefficients for study measures.
Note: Pearson correlation coefficients presented. Darker colors indicate larger correlation coefficients. PGS = polygenic score. ***p < .001.
Measurement Models
The next step in the analysis involved the estimation of a series of measurement models assessing the latent fertility measure. The first measurement model included the full analytic sample and allowed the three fertility indicators to freely load on a single latent factor. As mentioned above, due to the limited number of indicator variables, this model is just-identified and yielded perfect (yet trivial) fit indices. Despite this limitation, a number of findings from the analyses provide tentative evidence that the indicator variables are tapping a single underlying latent construct. First, the results of the zero-order correlations indicated that the fertility measures were all strongly correlated with one another. Second, the standardized factor loadings from the measurement model were large, ranging between 0.760 (total number of pregnancies) and 0.997 (total number of live births), and statistically significant (p < .001). Third, a supplemental measurement model (results not presented, but available upon request) in which the resulting latent fertility factor was regressed on the statistical covariates (age, race, and sex) was estimated in an effort to increase overall degrees of freedom, allowing for the estimation of fit indices. Despite a significant χ2 estimate (which is sensitive to sample size), the resulting model provided an adequate fit to the data (χ2 = 26.58, df = 6, p < .001; CFI = 0.98; TLI = 0.95; RMSEA = 0.04).
Based on these findings, a series of MGCFA models were estimated to test for measurement invariance across sex. Subsequently, restrictive models were tested against the configural model (i.e., all parameters freed across both groups) using LRTs. The resulting models indicated both metric (Δχ2 = 4.47, df = 2, p = .11) and scalar invariance (Δχ2 = 6.76, df = 4, p = .15). However, constraining the residual variances to equality (i.e., residual variance invariance) significantly worsened overall fit (Δχ2 = 14.00, df = 7, p = .05). Finally, constraining the variance of the fertility factor to equality across groups (i.e., factor variance invariance) did not worsen fit (Δχ2 = 8.55, df = 5, p = .13), but constraining factor means to equality resulted in worsened fit (Δχ2 = 47.74, df = 6, p < .001). Based on these results, the residual variances of the indicators and the means of the fertility factor were freely estimated across sex, but all other parameters were constrained to equality. The resulting MGCFA fit the data closely (χ2 = 8.55, df = 5, p = .13; CFI = 0.99; TLI = 0.99; RMSEA = 0.03).
Structural Equation Models
The next step in the analysis involved the estimation of a series of SEMs aimed at examining the direct and indirect pathways between the study measures. The SEM examining the full analytic sample, along with standardized path coefficients and accompanying robust standard errors, is presented in Figure 2. Since only theoretically relevant paths were estimated, the resulting model was over-identified, effectively allowing the estimation of fit indices (df = 11), with the resulting model providing an adequate fit to the data (χ2 = 28.23, df = 11, p < .01; CFI = 0.99; TLI = 0.99; RMSEA = 0.03). The results indicated a negative, but non-significant association between the PGS and fertility (β = -0.045, p = .11), but positive and significant associations between the PGS and both verbal IQ (β = 0.19, p < .001) and educational attainment (β = 0.11, p < .001). Educational attainment was also significantly associated with fertility (β = -0.28, p < .001), indicating that participants with higher levels of education had overall lower rates of fertility. The association between verbal IQ and fertility was also negative, but only marginally significant (β = -0.05, p = .049). Finally, the association between verbal IQ and educational attainment was positive and significant (β = 0.39, p < .001).
Structural equation model for the full sample.
Note: Standardized coefficients presented with robust standard errors in parentheses. Solid paths were significant at the p < .05 level and dashed path coefficients had accompanying p values that were greater than .05. The model was estimated using a weighted least squares estimator with robust standard errors and included age, race, and sex as covariates.

The next step of the analysis involved the estimation of a multiple group model in an effort to examine direct and indirect pathways among the male and female sub-samples. The multiple group model fit the data closely (χ2 = 30.28, df = 22, p = .11; CFI = 0.99; TLI = 0.99; RMSEA = 0.02) and the results are presented in Figure 3. The top panel of the figure presents the results for the male sub-sample. The overall pattern of results converged with findings from the full sample. The association between the PGS and fertility remained non-significant (β = -0.07, p = .07), but the associations between the PGS and both verbal IQ (β = 0.21, p < .001) and educational attainment (β = 0.11, p = .004) were both positive and significant. In addition, the association between educational attainment and fertility was negative and significant (β = -0.24, p < .001) and the association between verbal IQ and educational attainment was positive and significant (β = 0.40, p < .001). The primary divergence from the pattern of findings observed in the full sample was a non-significant association between verbal IQ and fertility (β = -0.05, p = .27). The results from the female sub-sample are presented in the bottom panel of the figure and were highly similar to the findings from the male sub-sample. Once again, the association between the PGS and fertility was non-significant (β = -0.03, p = .51), but the associations between the PGS and both verbal IQ (β = 0.18, p < .001) and educational attainment (β = 0.11, p < .001) were significant. Furthermore, the associations between educational attainment and both fertility (β = -0.32, p < .001) and verbal IQ (β = 0.40, p < .001) were significant. Similar to the results from the male sub-sample, the association between verbal IQ and fertility was non-significant (β = -0.06, p = .07).
Structural equation model for the male and female sub-samples.
Note: Standardized coefficients presented with robust standard errors in parentheses. Solid paths were significant at the p < .05 level and dashed path coefficients had accompanying p values that were greater than .05. All models were estimated using a weighted least squares estimator with robust standard errors and included age, race, and sex as covariates.

The final step of the analysis involved the estimation of a series of indirect pathways aimed at examining the potential mechanisms that mediate the association between PGS and both educational attainment and fertility. The results of the indirect pathway models are presented in Table 2. The model examining the full sample provided an adequate fit to the data (χ2 = 28.23, df = 11, p = .003; CFI = 0.99; TLI = 0.99; RMSEA = 0.03) and revealed that verbal IQ significantly mediated the association between the PGS and educational attainment (b = 0.083, p < .001). Educational attainment (b = -0.033, p < .001) also significantly mediated the association between PGS and fertility, while the indirect pathway involving verbal IQ approached significance (b = -0.011, p = .067). Finally, educational attainment also significantly mediated the association between verbal IQ and fertility (b = -0.008, p < .001). The multiple group model also provided an adequate fit to the data (χ2 = 37.39, df = 25, p = .053; CFI = 0.99; TLI = 0.99; RMSEA = 0.02). The results for the male sub-sample revealed that verbal IQ significantly mediated the association between PGS and educational attainment (b = 0.090, p < .001). In addition, educational attainment significantly mediated the association between PGS and fertility (b = -0.026, p = .010) and verbal IQ and fertility (b = -0.006, p < .001). The association between PGS and fertility was not mediated by verbal IQ (b = -0.010, p = .293). The results from the female sub-sample were similar, with verbal IQ significantly mediating the association between PGS and educational attainment (b = 0.078, p < .001), but this did not significantly mediate the association between PGS and fertility (b = -0.012, p = .127). Finally, educational attainment significantly mediated the association between PGS and fertility (b = -0.040, p = .002) and the association between verbal IQ and fertility (b = -010, p < .001). The difference between the observed indirect effects for the male and female sub-samples were compared using a z score and are presented in the final columns of the table. The results of the difference tests revealed non-significant differences between all of the examined indirect effects, indicating that the examined pathways were not significantly moderated by sex.
Indirect Path Coefficients for the Full Sample and the Male and Female Subsamples
Unstandardized coefficients presented with bias-corrected 95% confidence intervals (5,000 bootstrap replications) in parentheses. The presented z scores (along with accompanying p values) test the difference between the direct and indirect effects across males and females. Models were estimated using a weighted least squares estimator with robust standard errors and included age, race, and sex (in the full model) as covariates. PGS = polygenic score.
Discussion
The results of the SEMs were consistent with the expectation that verbal IQ should mediate the relationship between PGS and educational attainment. The direct effect of IQ on educational attainment is furthermore consistent with the expectation that the latter is (in part) an outcome variable of the former, rather than the other way around. This inference of causation accords with the finding that the direct effect of education on IQ is at the level of specific cognitive skills and competencies, rather than at the level of g (Ritchie et al., Reference Ritchie, Bates and Deary2015), which is the more genetically substantive variance component of IQ (Rimfeld et al., Reference Rimfeld, Kovas, Dale and Plomin2015). Hence, the path PGS ✶ IQ ✶ Educational attainment would appear to be justified in as much as the PVT test functions in these models as a good proxy for g (e.g., Dunn & Dunn, Reference Dunn and Dunn1997). The presence of direct paths from PGS to both verbal IQ and educational attainment are furthermore consistent with the existence of substantial shared genetic variance between the two measures (Okbay et al., Reference Okbay, Beauchamp, Fontana, Lee, Pers, Rietveld and Benjamin2016).
Also consistent with expectations is the finding that educational attainment mediates the relationship between verbal IQ and the latent fertility measure. Importantly, the PGS did not significantly directly predict fertility once the pattern of mediation was taken into consideration. In this sample, the genetic disposition towards a given level of IQ does not therefore entail a direct fitness penalty. Instead, the negative correlation with fertility is largely a function of individuals with different cognitive genotypes actively seeking out different degrees of exposure to education, which is in turn traded against fertility. The significant direct path from verbal IQ to fertility (which was only found in the mixed-sex model) furthermore suggests the independent action of additional unmodeled IQ-dependent factors on fertility.
The results of the SEMs were robust in controlling for age, race, and sex (in the first model). The results of a multiple group SEM furthermore revealed no significant indications of dimorphism in the strength of the path coefficients, which runs contrary to the expectation that females should be more sensitive to the effects of education on fertility.
One difference between the present study and the study of Beauchamp (Reference Beauchamp2016), in particular, concerns the nature of the PGS variable. In the case of the present study, the PGS variable derives from the study of Rietveld et al. (Reference Rietveld, Medland, Derringer, Yang, Esko, Martin and Koellinger2013), who found three loci to be reliable predictors of educational attainment. The PGS variable employed by Beauchamp was sourced from a more recent and much larger GWAS analysis (Okbay et al., Reference Okbay, Beauchamp, Fontana, Lee, Pers, Rietveld and Benjamin2016), which found associations between educational attainment and 74 loci — a considerably larger number. Examining the pattern of mediation using the more recent PGS would be an important step in determining the robustness of these results.
Another important difference between the present study and those of Beauchamp (Reference Beauchamp2016) and Conley et al. (Reference Conley, Laidley, Belsky, Fletcher, Boardman and Domingue2016) concerned their use of a sample that was in completed fertility (e.g., the participants of the sub-sample of the HRS utilized by Beauchamp were aged between 50 and 70 years). The mean age of our Wave IV participants by contrast is 28.4 years (with ages ranging from 24 to 34 years). Fertility is typically complete by the mid-40s for both males and females in the West (although males can continue to produce children into their sixth decade of life, in practice relatively few of them do so, with only around 2.5% of males continuing or starting to produce children after the age of 45; Boschini et al., Reference Boschini, Håkanson, Rosén and Sjögren2011). At age 29, males in the United States have completed approximately 51.5% and females 50.8% of their fertility (see Martinez et al., Reference Martinez, Daniels and Chandra2012, Tables 3 and 4, pp. 15–16). This is important as it has been noted that incomplete fertility inflates the negative association between fertility and IQ, largely because those with higher IQ are typically older when they start producing offspring, thus a larger proportion of high-IQ individuals will register as childless in their 20s than in their 40s (Neiss et al., Reference Neiss, Rowe and Rodgers2002; Vining, Reference Vining1982; Reference Vining1995). It is thus possible that the present results may have been somewhat different had the sample been in completed fertility. The effect of education as a mediator might weaken, as those with higher IQs (and who have spent greater amounts of time in education) will have had an opportunity to reproduce, whereas other factors, such as income and also ideology, might also come to play additional and independent roles in determining fertility outcomes at completed fertility (Meisenberg, Reference Meisenberg2010). It is also expected that the sex difference would be more prominent at completed fertility as the larger variance in male reproductive years enables those with a higher IQ to continue reproducing for longer. Higher IQ males are furthermore more tolerant of hypogamy (marrying down) than are females of equivalent ability (Johnson et al., Reference Johnson, McGue and Iacono2012); hence, higher IQ males are less likely than females of equivalent ability to be childless (Kanazawa, Reference Kanazawa2014). This has the effect of attenuating the negative IQ fertility association among males at completed fertility to a greater degree than among females (Woodley of Menie et al., Reference Woodley of Menie, Reeve, Kanazawa, Meisenberg, Fernandes and Cabeza de Baca2016). We nevertheless expect the basic pattern of mediation detected in the present study to persist at completed fertility. This expectation is consistent with Meisenberg's (Reference Meisenberg2010) finding of a role for educational attainment as a mediator of the phenotypic IQ–fertility relationship in a representative sample of the U.S. population much closer to having completed its fertility (aged between 39 and 47 years).
This study is the first to consider the role of mediation in the relationship between educational attainment PGS and fertility, based on the various causal and meditational pathways linking IQ to fertility that have been proposed in previous phenotype-only research. Future efforts should therefore focus on replicating the present findings using other databases in which PGS data along with measures of IQ, educational attainment, and completed fertility are available.


