





Introduction
The occupation and illegal annexation of Crimea by the Russian Federation in February and March 2014 marked the onset of a systematic repressive campaign against the Crimean Tatars, the peninsula’s indigenous people (Skrypnyk and Pechonchyk Reference Skrypnyk and Pechonchyk2016). Since the beginning of the occupation, Russian authorities have established a comprehensive social control system that targets, among other non-compliant citizens, both ordinary Crimean Tatars and community elites, including local politicians, journalists, and clerics (Andreyuk et al. Reference Andreyuk, Moiseeva, Kvitsinska, Koval and Donets2019; Kvitsinska, Andreyuk, and Asanova Reference Kvitsinska, Andreyuk and Asanova2018). The repressive apparatus encompasses a broad repertoire of strategically implemented coercive measures, ranging from administrative pressures and deprivations of liberty to physical violence, including torture and extrajudicial killings. Despite mounting evidence of widespread human rights violations in occupied Crimea, systematic documentation of state repression against Crimean Tatars remains severely limited. Existing accounts are predominantly anecdotal or selective, lacking the systematic and comprehensive data collection needed to empirically study the scope, spatio-temporal patterns, and drivers of repressive practices. This gap significantly hampers our understanding of the phenomenon and limits efforts to establish accountability for these violations of fundamental rights.
To address this critical shortcoming, we introduce a first comprehensive and geo-coded dataset that documents repressive events against Crimean Tatars at a daily level in the period January 2000 to December 2024 (CriTaRep). The dataset thus covers substantial parts of the Peninsula under Ukrainian rule as well as under Russian occupation. CriTaRep v1 includes n = 709 repression events, each annotated with close narrative descriptions and systematically coded variables, including the category and specific type of repression, the number of victims, fatalities, and injuries, the exact location, time, and responsible actors. The dataset distinguishes between 22 inductively derived types of repression, grouped into three overarching categories: (1) deprivation of liberties, including arbitrary searches and arrests; (2) legal and administrative repression, encompassing deportations and bureaucratic coercion; and (3) severe physical repression, including torture, enforced disappearance, and extrajudicial killings. In total, we document more than 2,200 individual victims over the investigation period.
Our data indicate that in the immediate aftermath of the annexation, Russian authorities started a massive campaign and employed highly visible and violent forms of repression, often directed at Crimean Tatar elites, to establish clear “red lines” of permissible behaviour. Over time, the repertoire of coercion became more differentiated and routinised, targeting the broader minority community. After an initial phase of intense repression, we observe a short COVID-19-related slowdown, with repression activities increasing again after the pandemic. Interestingly, the full-scale Russian invasion of Ukraine in February 2022 did not fundamentally change the established patterns or intensities of repression in Crimea. Overall, Russia’s repressive measures appear to follow a highly strategic logic. For instance, arbitrary searches and detentions occur disproportionately on Thursdays — a pattern sufficiently consistent to have become a darkly humorous reference point within the indigenous community.
Our fine-grained event data contributes to a better understanding of the proximate drivers of state repression against ethnic and religious groups (see Botica, Inguanzo, and Mateos Reference Botica, Inguanzo and Mateos2025). Following a contextual overview of state repression against Crimean Tatars in the post-annexation period and a description of key patterns and developments, we empirically explore the factors influencing the timing and intensity of repressive acts. While the underlying causes of the actions of the occupying forces lie in Russia’s autocratization and irredentist-imperialist ambitions, key proximate causes can be identified to explain the temporal variation of repression. To this end, we turn our event dataset into a panel structure and match our data with highly disaggregated data on potential drivers of repression, including the weekly level of sanctions against Russia, the inflation rate in Russia, the level of international awareness, the temporal proximity to cultural events, geographical concentration, as well as the occurrence of Crimean Tatar protests on a daily level.
Our models show that the frequency of repressive actions is significantly and positively associated with resistance activities. Poisson regression models with year-fixed effects demonstrate that same-day protest counts are significantly associated with increased repression events. Our findings underscore the tactically strategic yet reactive nature of authoritarian repression and corroborate core insights from the repression-protest nexus, which posits that state repression both responds to and potentially fuels backlash mobilization (Aytaç, Schiumerini, and Stokes Reference Aytaç, Schiumerini and Stokes2018; Carey Reference Carey2006; Francisco Reference Francisco2004; Schulte and Steinert Reference Schulte and Steinert2023; Sullivan, Loyle, and Davenport Reference Sullivan, Loyle and Davenport2012). Our results resonate with recent studies, which emphasise the adaptive logic of targeted repression against ethnic groups (Beiser-McGrath Reference Beiser-McGrath2019; Koesel and Sarkissian Reference Koesel and Sarkissian2025; Rozenas Reference Rozenas2020). Our new disaggregated repression dataset contributes to a more nuanced empirical understanding of how autocratic states calibrate coercive measures against ethnic minorities in occupied territories.
Background
By the time of Crimea’s annexation, Russian authorities had already accumulated substantial experience in suppressing dissent domestically and swiftly implemented previously tested repressive practices in Crimea (OVD-Info 2025; Rogov Reference Rogov2018; Zhirukhina Reference Zhirukhina2018). While also Ukrainians and other ethnic and religious minorities in occupied Crimea faced persecution, including followers of the Orthodox Church of Ukraine and Jehovah’s Witnesses, the repressive tactics mainly target the Crimean Tatars minority (Coynash and Charron Reference Coynash and Charron2019; Shapovalova and Burlyuk Reference Shapovalova and Burlyuk2016). With a long history of persecution under Russian imperial and Soviet rule, Crimean Tatars maintained a strong cultural identity and their own political and cultural organisations (Muratova Reference Muratova, Zuzanna and Yuliya2022). Driven by the collective trauma of the 1944 deportation, the prolonged struggle to resettle in Crimea, and the quest for political recognition, the Crimean Tatars in post-Soviet Crimea showed a remarkable degree of cohesion and ethno-political mobilisation (Sasse Reference Sasse2007, 190). Their predominantly pro-Ukrainian orientation and opposition to annexation rendered them a primary target of repression. While some Crimean Tatar leaders accepted the annexation or were co-opted into the Russian system, the broader Crimean Tatar community has shown notable resilience in resisting Russia’s occupation of Crimea (Muratova Reference Muratova, Muratova and Zasanska2025; Shynkarenko Reference Shynkarenko2022).
Following the seizure of strategic sites across the majority-Russian peninsula, including the Crimean parliament, by unmarked Russian troops on February 27, 2014, the occupying forces rapidly established a repressive infrastructure aimed at eliminating all individuals considered as potential obstacles to consolidate full control over the Peninsula and its population. This encompassed Crimean Tatar activists, journalists, politicians, and ordinary citizens who openly supported Ukrainian sovereignty, the Euromaidan movement, and opposed the takeover. A distinctive characteristic of this period was the direct involvement of official state institutions, including police forces, the Federal Security Service (FSB), and Russia’s courts and customs. Those state-based actors were considerably supported by non-state paramilitary groups, including local “self-defence” militias, Kremlin-aligned private military companies, and individuals deployed from other Russian regions (Coynash and Charron Reference Coynash and Charron2019; Galeotti Reference Galeotti2016; Rauta Reference Rauta2016).
During this initial phase (2014–2015), Russian law enforcement initiated the first criminal case in Crimea involving alleged ties to the international Islamist group Hizb ut-Tahrir.Footnote 1 This case, launched in early 2015 and later known as the “Sevastopol group,” marked the beginning of systematic repression targeting Muslim groups of Crimean Tatars under the guise of “counterterrorism.” Concurrently, Russian authorities criminalised participation in public gatherings, prosecuting Crimean Tatars involved in pro-Ukrainian protests on February 26 and May 3, 2014. These prosecutions set legal precedents for criminalizing dissent and legitimizing punitive action against opponents of the annexation. Alongside legal repression, Russian authorities dismantled core civil society institutions in Crimea. Independent media faced systematic suppression, culminating in the shutdown of ATR, the only Crimean Tatar television network, and the subsequent prosecution of its staff. Repression also extended to political organisations with potential mobilisation capacity. After a series of targeted actions against its political leadership, the Mejlis of the Crimean Tatar People was designated an extremist organisation. By 2016, a fully operational repressive infrastructure had been institutionalized.
The second phase (2016–2021) saw the expansion and diversification of politically motivated prosecutions, including torture cases, reports about inhumane detention conditions, and increased pressure on lawyers and human rights activists. In this period, large-scale criminal cases were launched under accusations of involvement in the Hizb ut-Tahrir organisation, as well as against activists affiliated with the grassroots human rights movement Crimean Solidarity. The repression linked to Hizb ut-Tahrir prosecutions peaked in 2019, when 37 individuals were targeted. While the pace of new prosecutions slowed slightly during the COVID-19 pandemic, with 12 new cases in 2020 and 10 in 2021, the overall scale of repression remained substantial. To date, at least 127 individuals in Crimea have been prosecuted for alleged association with Hizb ut-Tahrir, 106 of whom are currently imprisoned (OVD-Info 2025). In addition to prosecutions related to alleged association with Hizb ut-Tahrir, there has been at least one documented case (2017) in which Crimean Tatars were charged with participating in the activities of Tablighi Jamaat — a Muslim religious organisation designated as extremist in Russia in 2009 (Kvitsinska, Andreyuk, and Asanova Reference Kvitsinska, Andreyuk and Asanova2018). Russian law enforcement has also pursued politically motivated cases against Crimean Tatars under ordinary criminal charges. A notable example is the 2017 case involving Vedzhie Kashka, a revered veteran of the Crimean Tatar national movement, which led to the prosecution of four Crimean Tatar activists under fabricated criminal allegations (Vorotnikov Reference Vorotnikov2019).
Since 2018, charges of participation in the Noman Çelebicihan Crimean Tatar Volunteer Battalion have become increasingly prevalent. The battalion, founded in 2015 during the food and civic blockade of the peninsula, primarily monitored cargo movement at the administrative border between mainland Ukraine and occupied Crimea. Following Russia’s full-scale invasion of Ukraine in 2022, the battalion was designated a terrorist organisation, leading to a sharp increase in prosecutions under this pretext. These cases have since expanded beyond Crimea to other occupied territories, including parts of the Kherson region. Other politically motivated prosecutions between 2016 and 2021 involved sabotage charges targeting socially active and politically disloyal Crimean Tatars. One of the most prominent cases involved Nariman Dzhelyal, deputy head of the Mejlis, along with brothers Asan and Aziz Akhtemov, who were arrested in 2021 in connection with an explosion at a gas pipeline — charges widely seen as politically driven (Brushnevskaya Reference Brushnevskaya2023). Defense lawyers representing individuals in politically motivated cases have themselves become targets of repression, with authorities frequently employing administrative arrests to intimidate and neutralize defense attorneys.
The third phase started with Russia’s full-scale invasion of Ukraine in February 2022. Despite the dramatically altered geopolitical context, patterns of political repression in occupied Crimea largely continued the trends established in earlier years. Repressive actions against the Crimean Tatar population remained central to Russia’s coercive strategy. Most criminal cases targeting Crimean Tatars continued to be linked to alleged involvement in Hizb ut-Tahrir. Since 2022, at least 38 new prosecutions have been initiated on this basis, four of which predate the invasion. Prosecutions related to alleged membership in the Noman Çelebicihan Volunteer Battalion have also persisted. Since the start of the full-scale war, at least 10 new such cases have been recorded. These prosecutions often concern non-violent protest activities, including participation in the 2015 blockade of Crimea, and are typically based on actions alleged to have occurred between 2015 and 2019. The post-2022 period is also marked by qualitatively new forms of repression linked directly to wartime legislation. In the immediate aftermath of the invasion, Russian authorities began systematically prosecuting Crimean residents, including Crimean Tatars, under newly intensified laws against “discrediting” the Russian armed forces and disseminating so-called “fake information” about military operations. These charges reflect the broader authoritarian trend of criminalising anti-war expression across the Russian Federation (Kuznetsova Reference Kuznetsova2024; McCarthy, Rice, and Lokhmutov Reference McCarthy, Rice and Lokhmutov2023).
Concepts, variables, and coding procedure
The control repertoires of modern autocracies encompass various forms of coercion (Frantz and Kendall-Taylor Reference Frantz and Kendall-Taylor2014; Geddes, Wright, and Frantz Reference Geddes, Wright and Frantz2018; Hellmeier Reference Hellmeier2016; Koesel and Sarkissian Reference Koesel and Sarkissian2025). Against this background, we adopt a broad understanding of repression, which we define as the exercise of coercive power by state institutions over individuals and social groups within a given territory to control or eliminate opposition and dissent (Davenport Reference Davenport2007; Earl Reference Earl2003; Kurian Reference Kurian and George2011; Ritter and Conrad Reference Ritter and Conrad2016). This conceptualisation captures the multidimensional nature of repressive practices, unified by a common feature — the infringement of fundamental human rights. For the purposes of our dataset, this broad definition proves more appropriate than narrower conceptualisations that focus solely on violent state repression, “one-sided” state violence, or only specific categories of human rights abuses (Davies et al. Reference Davies, Pettersson, Sollenberg and Öberg2025; Hafner-Burton Reference Hafner-Burton2005). Our definition excludes unequal treatment and conditions in the form of “structural violence” (Galtung Reference Galtung1969) as well as legitimate law enforcement actions aimed at deterring or punishing criminal behaviour. We recognise the empirical difficulty in differentiating state repression from legal enforcement, particularly when laws themselves restrict basic rights. In our coding process, however, such ambiguity is largely confined to specific types (for example, arrests and detentions). These cases are assessed based on the state’s intent, the legal process followed, and the presence of judicial oversight.
Group-level repression event data remains extremely scarce. Widely used repression datasets such as the Political Terror Scale (Gibney et al. Reference Gibney, Haschke, Arnon, Pisanò, Barrett, Park and Barnes2024) or the CIRI Human Rights Dataset (Mark et al. Reference Mark, Cingranelli, Filippov and Richards2023) offer valuable insights at the country-year level. However, they are not disaggregated by groups and lack the granularity needed to explore repression against a specific ethnic or religious minority over time. The few group-based datasets, such as the Religion and State-Minorities (RASM) dataset, are typically very limited in scope and do not include event-based information (Akbaba and Fox Reference Akbaba and Fox2011). Other large-n event datasets, including ACLED or ICEWS, do not measure repression per se (Boschee et al. Reference Boschee, Lautenschlager, O’Brien, Shellman and Starz2020; Raleigh, Kishi, and Linke Reference Raleigh, Kishi and Linke2023) and are thus of limited utility for our purposes. A second key limitation of existing datasets is their heavy reliance on media reports, typically of widely spoken languages, which introduces significant reporting biases (Demarest and Langer Reference Demarest and Langer2019; Dietrich and Eck Reference Dietrich and Eck2020; Weidmann Reference Weidmann2016) — both in terms of what is reported and which societal groups are reported on. As with other minority groups, this gap also applies to the Crimean Tatars. Although Crimea has received increased attention since Russia’s full-scale invasion of Ukraine in February 2022, state repression targeting the Crimean Tatars remains markedly underreported and, consequently, understudied, reflecting both the effects of repression and state-enforced censorship as well as language barriers.
To address these limitations, CriTaRep draws on first-hand, locally sourced information in Crimean Tatar, Ukrainian, and Russian languages, including reports from close observers on the ground, legal representatives, and human rights defenders embedded in the Crimean Tatar community. These largely untapped sources enable a comprehensive mapping of repression events, many of which go unreported in international media outlets and existing databases. To allow for studies on the impact of the Russian annexation, we coded all documented instances of state repression against Crimean Tatars occurring between January 2000 and December 2024 on the Crimean Peninsula. Our dataset thus covers 14 years of Crimea under Ukrainian rule and 10 years under Russian rule.Footnote 2 All entries were manually compiled following a rigorous verification process to resolve missing or contradictory information. The dataset was compiled through systematic cross-referencing of data from multiple civil society organisations dealing with Crimean Tatar issues, including the Crimean Tatar Resource Center, CrimeaSOS, the Crimean Human Rights Group, and Crimean Solidarity. Source materials include annual and monthly reports, monitoring publications, and a range of textual and audiovisual materials published by these organisations in Ukrainian, Russian, and Crimean Tatar. Source materials for the pre-2014 period included monthly reports for the HCNM office and publications by Radio Free Europe/ Radio Liberty.
In the first step of the coding procedure, we developed detailed descriptive accounts for each event (event_description) and coded the exact date (event_date) and location (location, latitude, longitude) of each repression event, as well as the number of victims (number_victims), the number of injured (injured), and fatalities (killed). We also coded a “pessimist” variable as a higher-end estimate for casualties and fatalities (injured_pessimist, killed_pessimist). For instance, in cases of forced disappearance, we often have to assume the individual has been killed. Our assumption is based on documented patterns in which forcibly disappeared individuals were later found dead, as reported by human rights organizations and investigative bodies (Bariev Reference Bariev2017). CriTaRep includes the identity of the actors responsible for the repression (actor_name), distinguishing among institutional actors such as Centre for Countering Extremism (Centre “E”), Cossacks, court, customs, Federal Security Service (FSB), law enforcement, local authorities, police, self-defence, and special police units (OMON). The identification of perpetrators is based on information documented by human rights organizations and other primary sources. We acknowledge that in some cases, precise attribution to a specific agency is difficult due to overlapping mandates and limited transparency of security structures. In such instances, where the responsible actor could not be determined with sufficient certainty, we used the broader category “law enforcement.” All data were cross-checked by the authors to ensure the highest possible level of consistency and reliability.
In the second step, we used the narrative accounts to inductively categorise the events into specific repression types. We identified 22 distinct types that allow researchers to explore the full repertoire of state repression used in this context (repression_type). In the third step, these types were organized into three higher-order categories: Deprivation of liberty, legal and administrative repression, and physical repression (Table 1). Finally, we classified the victims of repressive actions into seven groups: activists, civilians, politicians, clerics, lawyers, journalists, and businesspersons. Where available, information regarding the victims’ affiliations with political, religious, military, or journalistic organisations was also recorded.
Repression types and categories in CriTaRep

Table 1. Long description
The table consists of two columns titled Category and Type.
Row 1: Category is Deprivation of Liberty. Types include Arbitrary search, Arbitrary search with detention, Arbitrary search with arrest, Detention, Detention with arrest, Detention with interrogation, Arrest, Imprisonment, and Interrogation.
Row 2: Category is Legal / Administrative Repression. Types include Administrative penalty, Administrative pressure, Criminal prosecution, Deportation, and Entry ban.
Row 3: Category is Physical Repression. Types include Extrajudicial killing, Extrajudicial violence, Forced disappearance, Torture, Interrogation with torture, Detention with torture, Detention with violence, and Arbitrary search with violence.
CriTaRep is available in two formats: a) an event-based dataset, with detailed records of individual repression events, and b) a panel-structured dataset, aggregated by event_date, which provides a summary of events and their characteristics per day. This format can be readily aggregated into week-, month-, or year-level units for further spatio-temporal analyses.Footnote 3
Descriptive analysis
Frequency and types of repression
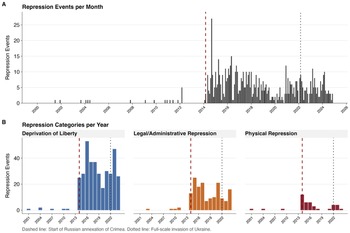
Our data provides empirical evidence of a large-scale repressive campaign that began with the Russian occupation of Crimea in 2014. In the pre-annexation period, we find only isolated instances of repression against Crimean Tatars (n = 19) with an average frequency of 1.3 repressive events per year. Following annexation, this number increases sharply to an annual average of 69 events (n = 690) and remains consistently high throughout the post-annexation period. Aggregating the number of repression events on a monthly basis uncovers a wave-like pattern. A particularly notable escalation occurred five months after the annexation in September 2014, when the first coordinated repression campaign unfolded across the peninsula. This campaign comprised widespread searches, detentions, and administrative prosecutions targeting both prominent Mejlis activists and ordinary civilians. Law enforcement agencies conducted searches in private homes, mosques, and educational facilities, officially citing the search for narcotics, weapons, and prohibited religious literature. Individuals were subsequently detained and subjected to interrogation. We document the forced disappearance of three Crimean Tatars, one of whom was later found deceased. After this initial wave, repression gradually declined, reaching its lowest point during the pandemic year of 2020. In 2021, levels increased again, approaching pre-COVID levels ( Figure 1, Panel A).
Frequency and Types of Repression.

Figure 1. Long description
Panel A is a bar chart titled Repression Events per Month. The Y axis ranges from 0 to 25 Repression Events. The X axis spans from 2000 to 2026. Data remains near zero until early 2014, marked by a red dashed vertical line. Following this line, there is a sharp spike reaching over 25 events in late 2014, followed by sustained activity fluctuating between 5 and 15 events. A second vertical dotted line in early 2022 marks a second phase of activity.
Panel B is titled Repression Categories per Year and contains three sub-charts with a Y axis from 0 to 40.
1. Deprivation of Liberty (blue bars) shows a massive increase after 2014, peaking near 50 events in 2016 and remaining high through 2024.
2. Legal forward slash Administrative Repression (orange bars) shows a significant increase after 2014, with peaks around 25 events in 2015 and 2021.
3. Physical Repression (maroon bars) shows a moderate spike immediately after 2014 and a smaller spike after 2022.
A legend at the bottom indicates the dashed line represents the start of Russian annexation of Crimea and the dotted line represents the full-scale invasion of Ukraine.
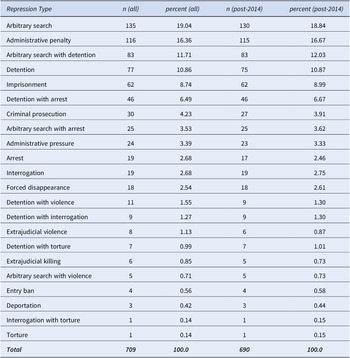
The most prevalent form of repression against Crimean Tatars is deprivation of liberty, which accounts for 69.2 percent of all cases ( Table 2, Panel B). Within this category, the most common modality is arbitrary searches, which account for 135 events (19.5 percent) — the single most frequent repression type in CriTaRep. Typically executed at dawn, these operations are carried out by officers of the Federal Security Service, the Centre for Countering Extremism, or special police units. Arbitrary searches often serve as a prelude to further coercive measures, including detention and subsequent criminal prosecution, as was evident, for example, in all incidents of the so-called “Hizb ut-Tahrir case” (Krym.Realii 2021). Law enforcement personnel often forcibly enter private residences, employing physical violence, particularly against male occupants. Surrounding streets are commonly cordoned off, and so-called “neutral” witnesses, typically selected in advance by security personnel, are present to provide nominal legal cover. Standard procedures also include the confiscation of mobile phones, computers, and other digital devices, while access to legal counsel is often delayed, denied, or otherwise obstructed.
Frequency of repression types in CriTaRep
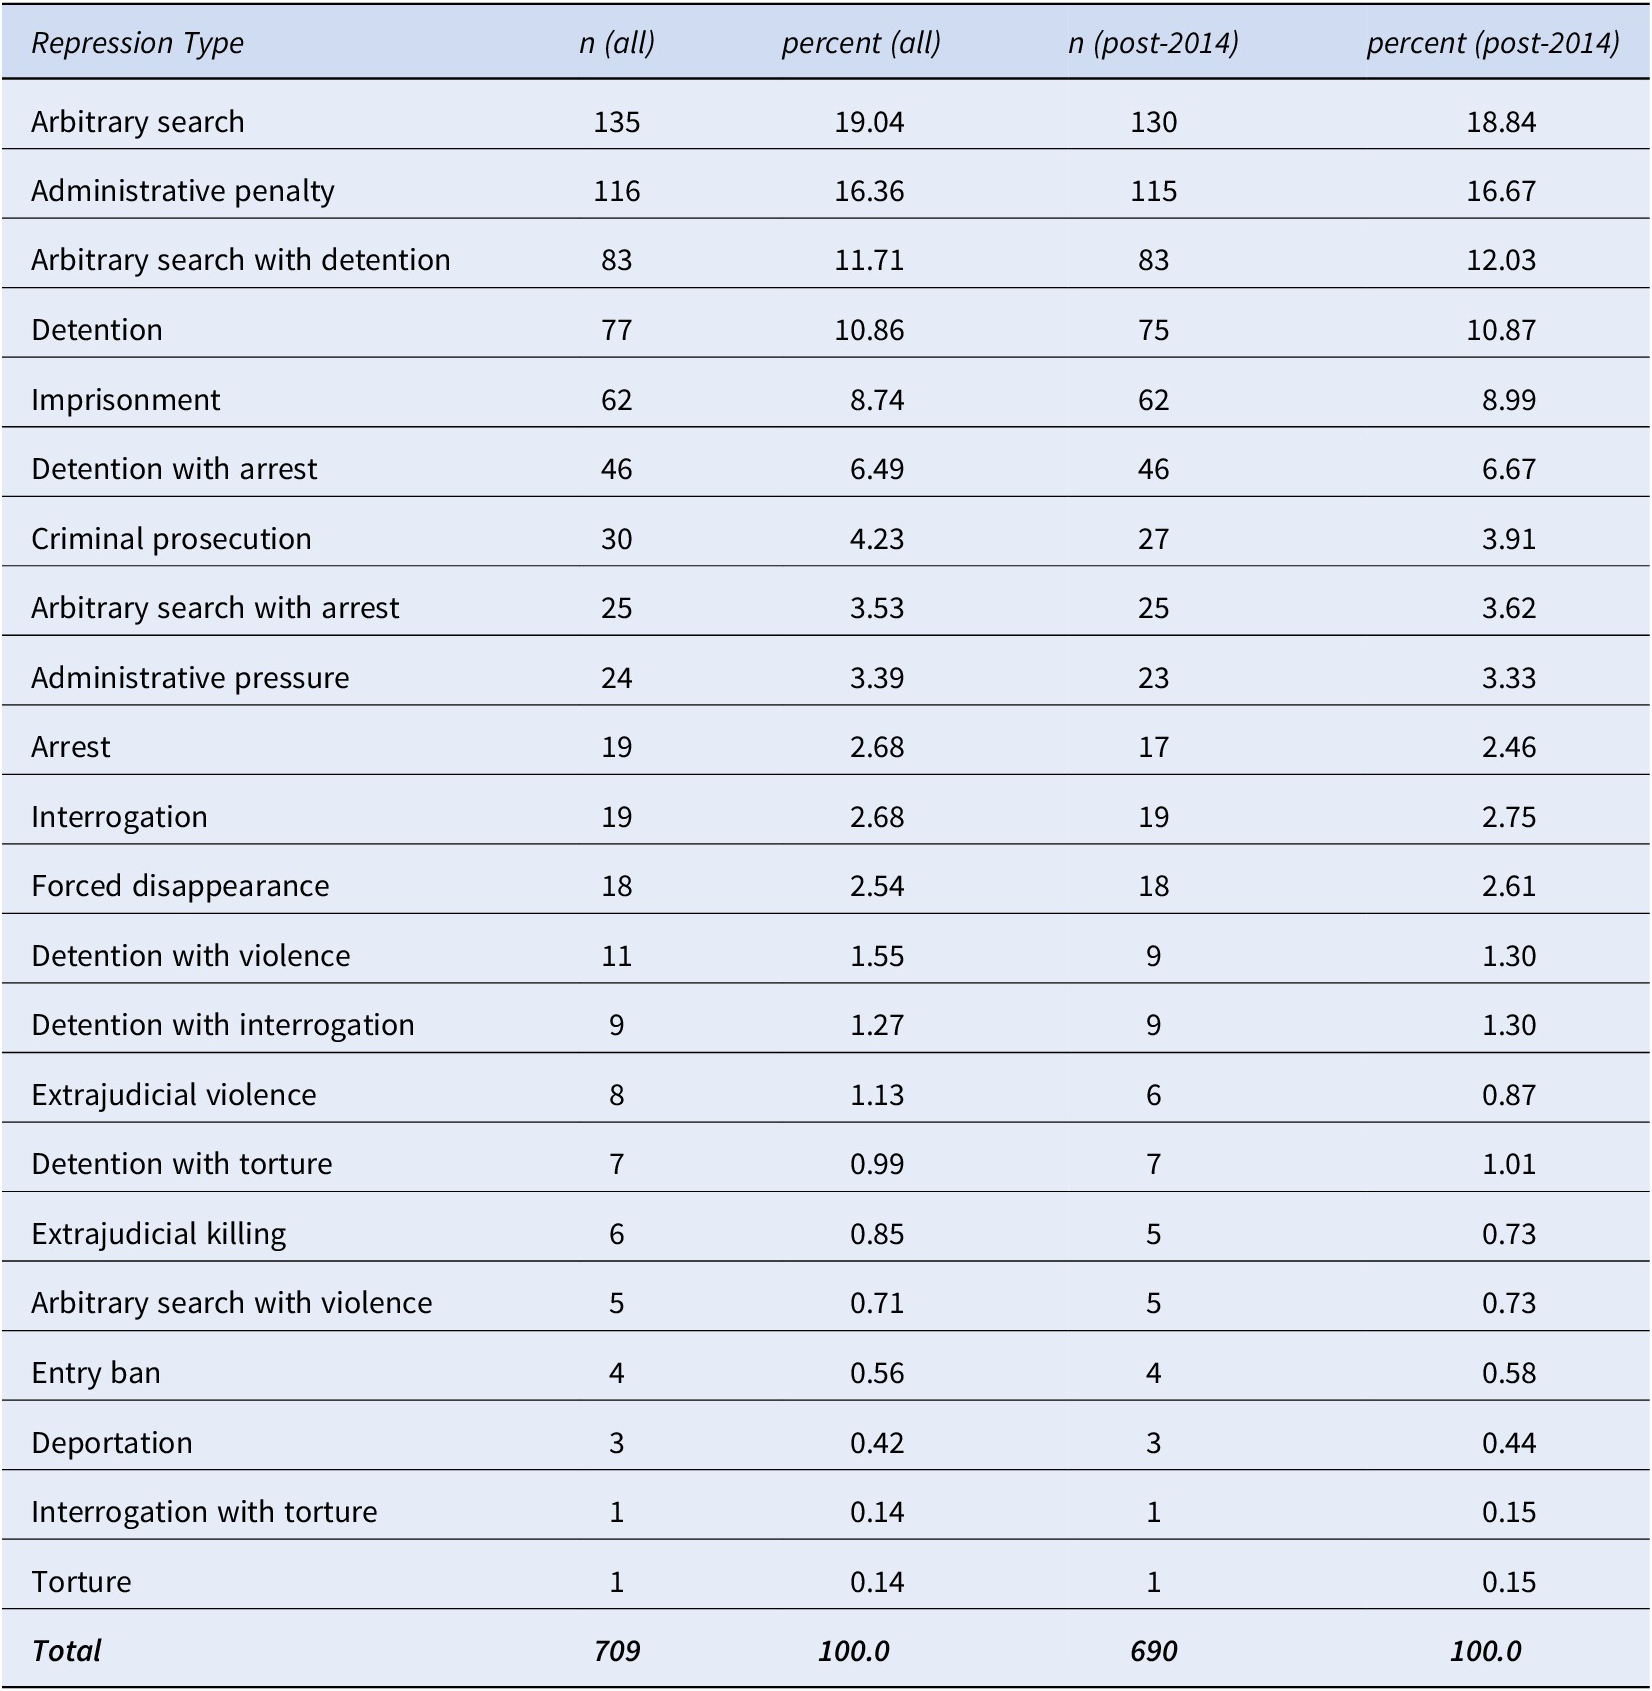
Table 2. Long description
The table consists of five columns: Repression Type, n (all), percent (all), n (post-2014), and percent (post-2014). There are 22 specific repression types listed, followed by a total row.
* Arbitrary search: 135 (19.04 percent all), 130 (18.84 percent post-2014).
* Administrative penalty: 116 (16.36 percent all), 115 (16.67 percent post-2014).
* Arbitrary search with detention: 83 (11.71 percent all), 83 (12.03 percent post-2014).
* Detention: 77 (10.86 percent all), 75 (10.87 percent post-2014).
* Imprisonment: 62 (8.75 percent all), 62 (8.99 percent post-2014).
* Detention with arrest: 46 (6.49 percent all), 46 (6.67 percent post-2014).
* Criminal prosecution: 30 (4.23 percent all), 27 (3.91 percent post-2014).
* Arbitrary search with arrest: 25 (3.53 percent all), 25 (3.62 percent post-2014).
* Administrative pressure: 24 (3.39 percent all), 23 (3.33 percent post-2014).
* Arrest: 19 (2.68 percent all), 17 (2.46 percent post-2014).
* Interrogation: 19 (2.68 percent all), 19 (2.75 percent post-2014).
* Forced disappearance: 18 (2.54 percent all), 18 (2.61 percent post-2014).
* Detention with violence: 11 (1.55 percent all), 9 (1.30 percent post-2014).
* Detention with interrogation: 9 (1.27 percent all), 9 (1.30 percent post-2014).
* Extrajudicial violence: 8 (1.13 percent all), 6 (0.87 percent post-2014).
* Detention with torture: 7 (0.99 percent all), 7 (1.01 percent post-2014).
* Extrajudicial killing: 6 (0.85 percent all), 5 (0.73 percent post-2014).
* Arbitrary search with violence: 5 (0.71 percent all), 5 (0.73 percent post-2014).
* Entry ban: 4 (0.56 percent all), 4 (0.58 percent post-2014).
* Deportation: 3 (0.42 percent all), 3 (0.44 percent post-2014).
* Interrogation with torture: 1 (0.14 percent all), 1 (0.15 percent post-2014).
* Torture: 1 (0.14 percent all), 1 (0.15 percent post-2014).
* Total: 709 (100.0 percent all), 690 (100.0 percent post-2014).
With the exception of the pandemic year 2020, when most forms of coercive activity declined, arbitrary searches remained consistently frequent between 2014 and 2024. Two notable surges are noteworthy: the first in 2016, the second in 2023. The 2016 spike coincided with the transition to a second, institutionalized phase of repression, during which the coercive infrastructure assembled in 2014–2015 was deployed at full capacity. During this phase, mass search operations targeted the homes of Hizb ut-Tahrir activists and members of the Mejlis, mosques operating outside the jurisdiction of the Spiritual Administration of Muslims of Crimea (DUMK), and private homes of civilians perceived as politically disloyal by the occupying authorities. The second surge, recorded in 2023, reflects a broader escalation of coercive practices that followed Russia’s full-scale invasion of Ukraine. During this period, security agencies broadened the scope of “high-risk” categories beyond established targets such as Mejlis and Hizb ut-Tahrir affiliates to include individuals suspected of links to the Noman Çelebicihan Battalion. Many of these individuals had previously resided in the Kherson region, occupied after February 2022, before being detained, transferred to Crimea, and prosecuted under criminal statutes. Additionally, Russian law enforcement increasingly targeted individuals accused of sabotage or of disseminating anti-war content via social media, thereby expanding the range of politically actionable behaviors.
Forms of legal and administrative repression account for 24.9 percent of cases. Within this category, administrative penalties are the most prevalent form of coercive action and constitute the second most frequent repression type in CriTaRep (n = 116, 16.36 percent). As mentioned above, these penalties typically follow earlier intrusions, most often searches of private homes, mosques, or administrative premises associated with Crimean Tatars, and the subsequent initiation of administrative proceedings. Sanctions are frequently imposed on individuals accused of possessing prohibited religious literature, participating in unauthorised public gatherings, conducting missionary activities without formal authorisation, disseminating materials linked to proscribed organisations, or publishing “separatist” (that is, pro-Ukrainian) or allegedly false information about the Russian military on social media. Administrative penalties serve a dual function: they operate both as punitive measures and as instruments of deterrence, aimed at suppressing dissent and restricting religious and political activism.
We categorise 5.8 percent of events as forms of “physical repression” representing the most direct, somatic and extreme forms of state repression. While extremely rare before the annexation under Ukrainian rule, we observe such measures consistently throughout the post-2014 period, with the notable exception of 2019 and 2020, when the frequency of such incidents declined, likely due to COVID-related restrictions. We observe the highest number of violent events in the first annexation year, 2014 ( Figure 1, Panel B). Lacking a fully developed administrative infrastructure, Russian authorities started the occupation of Crimea with a heavy reliance on physical violence as a swift and effective means of establishing behavioural boundaries and silencing dissent. This high-intensity repression functioned as a blunt but proven tool for signalling the severe costs of opposition.
A key driver of the high intensity of repression in the first year is the active involvement of non-state paramilitary actors, such as the “Crimean self-defence” units, Cossack formations, the so-called “Crimean Liberation Army,” as well as members of the political party Russian Unity (Galeotti Reference Galeotti2016; OVD-Info 2025). While a majority of repressive actions in the post-annexation period (94.1 percent) were carried out by state-based actors, including law enforcement agencies (31.9 percent), courts (26.8 percent), the FSB (15.7 percent), and the police (11.0 percent), non-state actors played a significant role in the occupation, often executing acts of violence against individuals opposing annexation. Operating with considerable autonomy and de facto impunity, these actors contributed to the normalization of extrajudicial violence and the broader entrenchment of coercive control during the early stages of Russian rule over Crimea. The practice of enforced disappearances emerged as a systematic and widespread tactic during the initial phase of Russia’s occupation. Throughout the occupation period, at least 18 Crimean Tatars have been subjected to enforced disappearance, a substantial proportion of whom subsequently died. While the absolute number of documented cases is limited, these disappearances had a significant “signalling effect,” generating fear and reinforcing perceptions of pervasive repression among the Crimean Tatar population. Instances of physical violence, including torture and other forms of mistreatment, have been documented in connection with searches, arrests, and interrogations conducted by Russian security forces. Such practices exemplify the broader pattern of repressive strategies deployed to instil fear, suppress dissent, and maintain full control over the Crimean Tatar population.
Repression calendar
Authoritarian regimes rarely repress at random but strategically calibrate when, where, and whom to target. A rich literature shows, for instance, that coercive actions follow episodes of dissent (Lewis and Ives Reference Lewis and Ives2025; Sullivan, Loyle, and Davenport Reference Sullivan, Loyle and Davenport2012) and tend to cluster around focal moments such as cultural holidays, anniversaries, elections, and sports events (Bhasin and Gandhi Reference Bhasin and Gandhi2013; Scharpf, Gläßel, and Edwards Reference Scharpf, Gläßel and Edwards2023; Truex Reference Truex2019). Beyond such reactive patterns to exogenous events, repression may also be driven by endogenous bureaucratic routines, shaped by institutionalized schedules and organizational workflows (Arendt Reference Arendt2006; Gieseke Reference Gieseke2011; Thomson Reference Thomson2024). In China, for instance, the state bureaucracy is heavily involved in digital surveillance (Pei Reference Pei2024; Qiang Reference Qiang2019). In East Germany, the Stasi conducted “conspirative searches,” faked burglaries, which were meticulously prepared and which followed a highly bureaucratic logic (Bundesarchiv 2025).
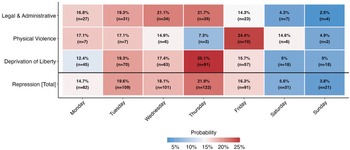
Calculating the probability distribution of each repression category across weekdays, we find that the campaign against Crimean Tatars largely adheres to a weekly rhythm (Figure 2). Repressive actions typically occur between Monday and Friday, with numbers dropping on weekends. Within the workweek, incidents are less frequent on Mondays and Fridays. One exception is physical violence, which also occurs with notable frequency on Saturdays. This reflects the involvement of non-state or semi-official actors, such as paramilitary groups, who are less constrained by bureaucratic schedules. Thursday emerges as the most frequent day for repressive actions against Crimean Tatars, a pattern particularly evident for the most common forms of repression, namely searches and detentions. The concentration of such incidents on Thursdays has not gone unnoticed by journalists and human rights defenders, who have aptly coined the term “Black Thursday” (Evchin and Annitova Reference Evchin and Annitova2019).
Repression Events by Weekday and Type.
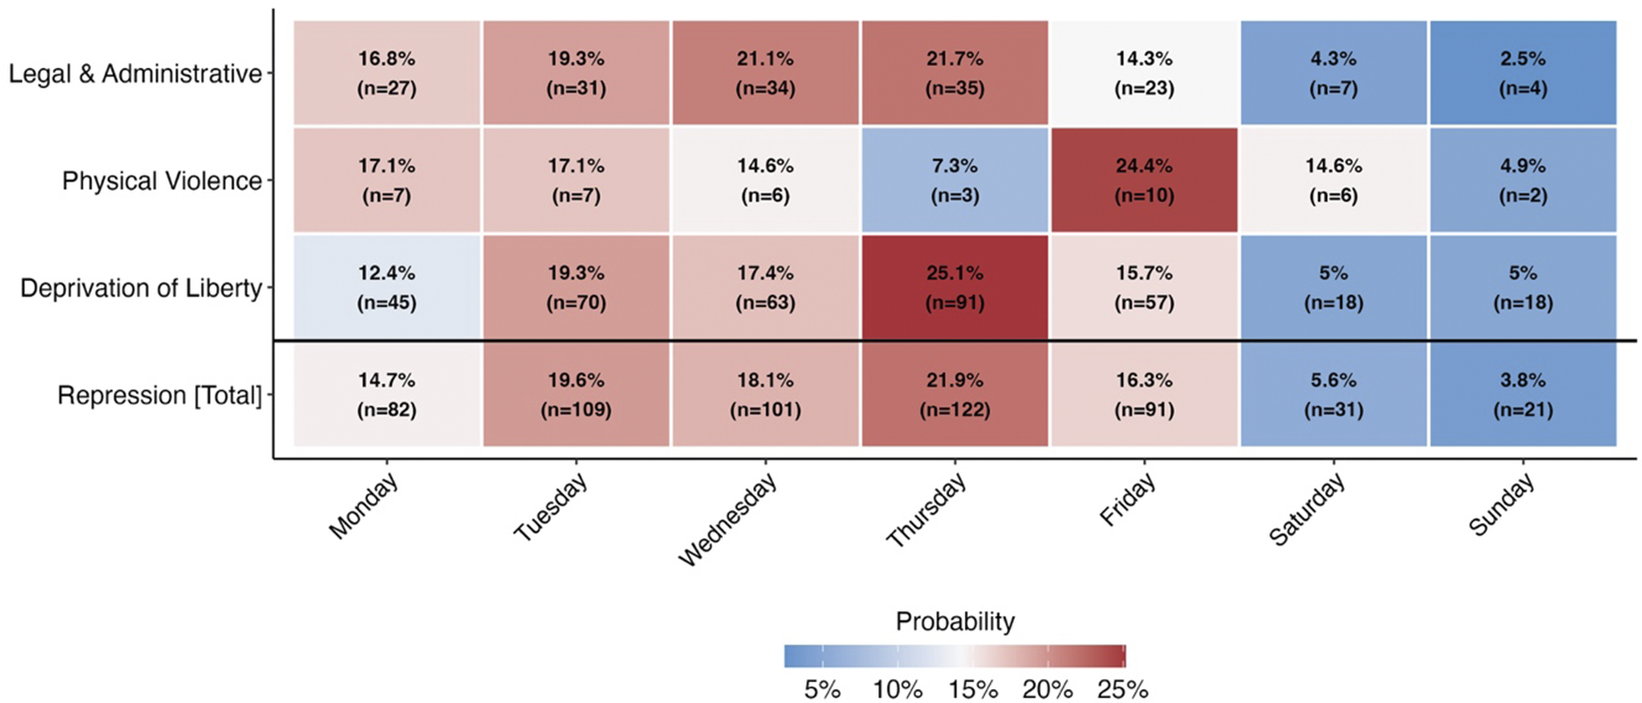
Figure 2. Long description
A heatmap with the x axis representing days of the week from Monday to Sunday and the y axis representing repression types. A color scale at the bottom indicates probability, ranging from blue at 5 percent to red at 25 percent. Each cell contains a percentage and a sample size n.
* Legal and Administrative: Monday 16.8 percent n equals 27. Tuesday 19.3 percent n equals 31. Wednesday 21.1 percent n equals 34. Thursday 21.7 percent n equals 35. Friday 14.3 percent n equals 23. Saturday 4.3 percent n equals 7. Sunday 2.5 percent n equals 4.
* Physical Violence: Monday 17.1 percent n equals 7. Tuesday 17.1 percent n equals 7. Wednesday 14.6 percent n equals 6. Thursday 7.3 percent n equals 3. Friday 24.4 percent n equals 10. Saturday 14.6 percent n equals 6. Sunday 4.9 percent n equals 2.
* Deprivation of Liberty: Monday 12.4 percent n equals 45. Tuesday 19.3 percent n equals 70. Wednesday 17.4 percent n equals 63. Thursday 25.1 percent n equals 91. Friday 15.7 percent n equals 57. Saturday 5 percent n equals 18. Sunday 5 percent n equals 18.
* Repression Total: Monday 14.7 percent n equals 82. Tuesday 19.6 percent n equals 109. Wednesday 18.1 percent n equals 101. Thursday 21.9 percent n equals 122. Friday 16.3 percent n equals 91. Saturday 5.6 percent n equals 31. Sunday 3.8 percent n equals 21.
Overall, repression events peak mid-week between Tuesday and Friday, with a significant drop-off on weekends.
This pattern is not coincidental but driven by legal-strategic considerations aimed at maximizing the psychological impact of coercive measures, as well as by practical operational logic. First, Russian law permits authorities to detain an individual for up to 48 hours without formal charges. When a detention occurs on a Thursday, this effectively allows authorities to hold the person through the weekend, since investigative and detention facilities — including pre-trial detention centers (SIZO) — typically do not operate on weekends, and access to legal counsel is limited or entirely unavailable on Saturdays and Sundays. Consequently, authorities gain two additional days during which the detainee can be subjected to various forms of pressure to extract information or confessions. Second, the preference for Thursday is shaped by the internal scheduling of law enforcement agencies. Mondays through Wednesdays are typically reserved for routine activities such as firearms training, instruction sessions, and other forms of professional development. When searches are planned, central command dispatches officers to the region to conduct the operations on Thursday, allowing them to return to their home base on Friday and spend the weekend with their families (Evchin and Annitova Reference Evchin and Annitova2019). Thus, Thursday emerges as the most practical day for executing repressive actions.
Repression intensities and victims
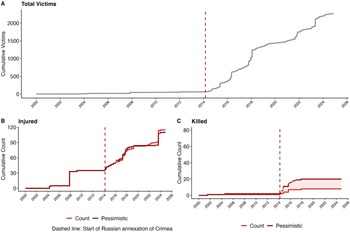
CriTaRep v1 documents a total number of 2,294 victims, with 19 victims before and 2,275 victims after the annexation. The cumulative victim count (Figure 3, Panel A) shows a sharp increase since 2014, driven by durable levels of coercion and episodes of intensified enforcement that coincide with key phases of Russia’s occupation strategy: consolidation (2014–2015) and wartime securitisation (2022–present). Both our main estimate and the upper-bound (pessimistic) assessment of injured Crimean Tatars rise gradually between 2014 and early 2022, followed by a pronounced spike after the full-scale invasion in 2022 (Figure 3, Panel B). While in the pre-invasion period (2014–2021), injuries stem predominantly from coercive searches, detentions, and the policing of public dissent, injuries in the period 2022–2024 are more strongly linked to punitive violence intended to enforce loyalty under conditions of large-scale interstate conflict. Lethal violence is, as discussed above, temporally concentrated in the initial period. After 2016, the curve stabilizes, reflecting both the effectiveness of early high-intensity measures and a subsequent shift toward institutionalized, non-lethal forms of coercion. The near congruence of our main and pessimistic estimates indicates comparatively reliable documentation of both fatalities and injuries.
Repression Intensities over Time.
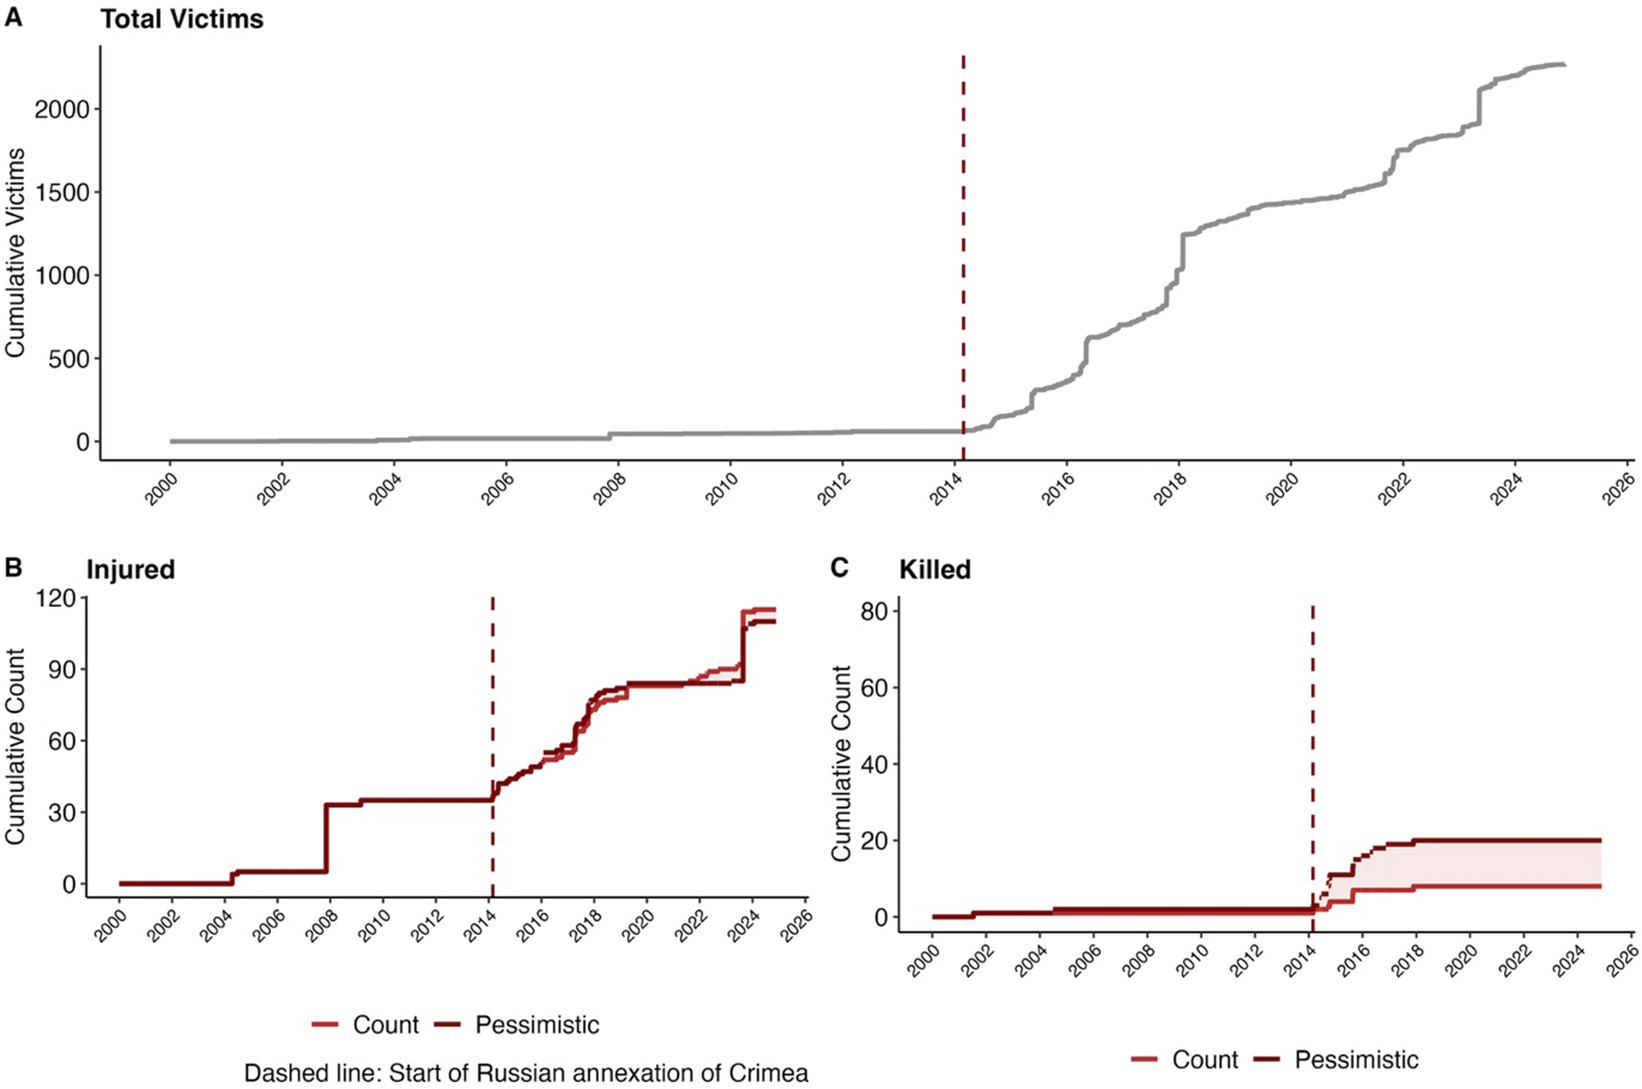
Figure 3. Long description
A multi-panel figure with three line graphs labeled A, B, and C. All graphs share an X axis representing years from 2000 to 2026 and a vertical red dashed line at early 2014 marking the start of the Russian annexation of Crimea.
Panel A, titled Total Victims, occupies the top half. The Y axis is Cumulative Victims from 0 to 2000. The grey line remains near zero until 2014, then shows a steep, stepped exponential increase, reaching over 2000 by 2024.
Panel B, titled Injured, is on the bottom left. The Y axis is Cumulative Count from 0 to 120. Two dark red lines, Count and Pessimistic, track closely. There are minor steps in 2004 and 2008, a significant jump in 2014, and a steady climb to approximately 110 by 2024.
Panel C, titled Killed, is on the bottom right. The Y axis is Cumulative Count from 0 to 80. The lines remain flat near zero until 2014. After 2014, the Count and Pessimistic lines diverge, creating a shaded pink area representing the range between approximately 10 and 20 cumulative deaths by 2024.
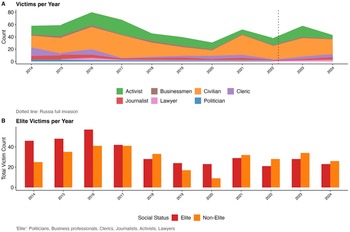
The Russian authorities adapted their repression targets dynamically to certain political and social developments (Figure 4, Panel A). In the first three years, we observe a higher number of elites being targeted compared to civilians (Figure 4, Panel B). With this, the authorities targeted a number of potentially dangerous individuals with mobilisation capacity, including politicians, clerics, journalists, and activists. Once this purge was successful, repressive tactics shifted to a broader approach, moving beyond the targeting of individuals through criminal and administrative proceedings to include more collective forms of repression to implement a more comprehensive control system. By 2016, law enforcement agencies began conducting coordinated raids on public spaces, notably mosques during Friday prayers, as well as markets and cafés, where large groups of Crimean Tatars were detained, interrogated, and subjected to document checks.
Repression Victims by Type and Year in the Post-Annexation Period.

Figure 4. Long description
Panel A is a stacked area chart titled Victims per Year. The x-axis ranges from 2014 to 2024. The y-axis is Count from 0 to 80. A vertical dotted line in 2022 marks the Russia full invasion. The layers from bottom to top are Politician, Lawyer, Journalist, Cleric, Civilian, Businessmen, and Activist. Total counts peak in 2016 at 80, decline to approximately 30 in 2020, rise to 50 in 2021, dip in 2022, and rise again in 2023. Civilians and Activists represent the largest segments throughout the period.
Panel B is a grouped bar chart titled Elite Victims per Year. The x-axis ranges from 2014 to 2024. The y-axis is Total Victim Count from 0 to 40. It compares Elite in red and Non-Elite in orange. Elite includes Politicians, Business professionals, Clerics, Journalists, Activists, and Lawyers. From 2014 to 2017, Elite victims outnumber Non-Elite victims, peaking in 2016 with nearly 60 Elite victims. From 2018 to 2024, the counts are more balanced, with Non-Elite victims slightly outnumbering Elite victims in most years including 2018, 2021, 2022, 2023, and 2024.
Following a decrease in the absolute number of victims, we observe a new increase post-pandemic. The increase in civilian victims in 2021 is primarily attributable to the detention of individuals participating in public demonstrations protesting earlier acts of repression against Crimean Tatars. These arrests frequently took place in the vicinity of court buildings where hearings or sentencing of previously detained individuals were held, indicating a criminalisation of protest and solidarity. In 2023, the rise in repression again involved both collective and individual targeting. Our data shows a dual pattern of victimisation: raids on mosques continued, while additional arrests occurred during protests near court buildings.
Civilians constitute the largest group of individuals subjected to repressive practices in post-2014 Crimea, accounting for nearly half (48.7 percent) of all documented cases in CriTaRep. Following civilians, activists represent the second-largest category of victims (28.2 percent). These individuals are often affiliated with organisations such as the Mejlis, the Qurultay (national congress), Hizb ut-Tahrir, and Tablighi Jamaat, all of which have been consistently targeted by the occupying authorities due to their perceived oppositional stance or mobilizational potential. Clerics represent the third most affected group (9.34 per cent). The relatively higher incidence of repression against this category in the initial two years of the occupation can be explained by the Russian security services’ efforts to exert control over the Spiritual Administration of Muslims of Crimea (DUMK), including through raids on mosques and madrasas under its jurisdiction (Muratova Reference Muratova, Muratova and Zasanska2025). Once DUMK acquiesced to collaboration, repressive measures increasingly targeted religious actors and institutions outside of its control, particularly those critical of its alignment with the occupying authorities. In some cases, these repressive actions occurred with the direct support or cooperation of DUMK-affiliated actors.
Journalists represent 7.18 percent of victims and have been systematically targeted throughout the investigation period. This reflects the regime’s intent to monopolise the information space and shape the narrative of a “Russian Crimea” for both domestic and international audiences. In the early years, repression primarily affected personnel from pre-2014 media outlets, such as the ATR television channel and the newspaper Avdet. As control over the media landscape solidified, the focus shifted to independent civic journalists, particularly those associated with the NGO Crimean Solidarity, and Crimean Tatar journalists based in mainland Ukraine. These individuals have increasingly faced criminal prosecution. Politicians, alongside lawyers and human rights defenders, have also been targeted as part of the broader coercive environment. However, they represent only a smaller proportion of victims with a share of 1.8 percent and 1.98 percent, respectively. While there was originally only a small number of those elites, many fled the country or, in the case of politicians, were co-opted by the Russian authorities. Pressure on legal professionals intensified during 2015–2016 and surged again after Russia’s full-scale invasion of Ukraine in 2022. Repression against non-loyal Crimean Tatar business professionals accounts for 2.87 percent of cases. These incidents, however, appear sporadic and do not reflect a systematic targeting trend.
Geographical patterns
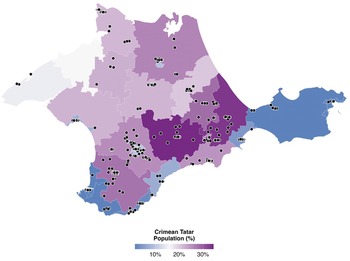
Combining our data with census data, we find that nearly half (46.1 percent) of all recorded instances of repression against Crimean Tatars between 2014 and 2024 occurred within two administrative units of Crimea — Simferopol and the Bakhchisaray region including the city of Bakhchisaray (Figure 5).Footnote 4 The concentration of repressive acts in Simferopol suggests a “classic” imperial tactic: as the centre of the Russian-controlled security apparatus in Crimea, all key state organs responsible for implementing coercive measures, such as the local FSB office, law enforcement agencies, and judicial bodies, are based in the city. Russia pairs direct repression with a strategic extension of courts, judicial institutions, and bureaucracies in key urban centres to govern its annexed territories (Lazarev and Skougarevskiy Reference Lazarev and Skougarevskiy2025). The high incidence of repressive episodes in Simferopol also reflects the prosecution of Crimean Tatars who gathered near these buildings in solidarity with detained individuals or to publicly express dissent against state violence and arbitrary detentions. The elevated level of repression in the Bakhchisaray region is attributable to the comparatively high degree of political mobilisation among the local Crimean Tatar population, as well as their active participation in organisations that Russian authorities have designated as extremist or terrorist, most notably the Mejlis and Hizb ut-Tahrir.
Geographical Distribution of Repression Events.

Figure 5. Long description
The map uses a color gradient from light blue to deep purple to indicate the Crimean Tatar population percentage. A legend at the bottom shows the scale from 10 percent in light blue to 30 percent in deep purple.
* Central and South Central Regions: These areas feature the highest population density, shaded in deep purple. There is a heavy concentration of black dots, indicating a high frequency of repression events in these regions.
* Southwest Coast: This area is shaded in medium purple and shows a dense cluster of black dots along the coastline and inland toward the center.
* Northern and North Central Regions: These areas are shaded in light to medium purple with a moderate scattering of black dots.
* Western Region: This area is shaded in very light blue, indicating a lower population percentage, and contains only a few isolated black dots.
* Eastern Peninsula: The far eastern tip is shaded in solid blue with a small cluster of black dots on the northern coast of the sub-peninsula.
Overall, the black dots representing repression events are most densely clustered in the regions with the highest Crimean Tatar population percentages, particularly in the central and southern parts of the peninsula.
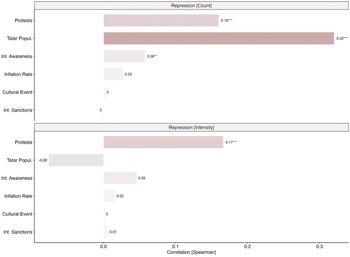
Drawing on our panel dataset, we observe a statistically significant positive correlation between the number of repression events and the share of the Crimean Tatar population per district (ρ = 0.32, p < 0.001; see Figure 6).Footnote 5 While areas with larger Crimean Tatar communities face more frequent repression, there are notable exceptions. For instance, while Crimean Tatars constitute approximately 9.93 percent of Simferopol’s population, over a third of repression cases have occurred in the city (Table 5 in the Supplementary Material). By contrast, in the Belogorsk region, where Crimean Tatars make up over one-third of the population (34.36 percent), only 4.6 percent of recorded repressive incidents took place. Importantly, we find no correlation between repression intensity and indigenous demographic share (ρ = -0.08, p > 0.05). This suggests that while the frequency of repressive events correlates with Crimean Tatar population density, the severity of individual incidents follows different logics — likely shaped by the regime’s perception of threat and the degree of organisational mobilisation within local communities.
Correlation Analysis.

Figure 6. Long description
The figure consists of two panels. The x-axis for both is labeled Correlation [Spearman] ranging from 0.0 to 0.3.
Top Panel: Repression [Count].
* Protests: 0.16 with three asterisks.
* Tatar Popul. [Population]: 0.32 with three asterisks, represented by the longest, darkest brown bar.
* Int. [International] Awareness: 0.06 with two asterisks.
* Inflation Rate: 0.03.
* Cultural Event: 0.
* Int. [International] Sanctions: 0.
Bottom Panel: Repression [Intensity].
* Protests: 0.17 with three asterisks.
* Tatar Popul. [Population]: negative 0.08, shown as a light blue bar extending to the left of the zero baseline.
* Int. [International] Awareness: 0.05.
* Inflation Rate: 0.02.
* Cultural Event: 0.
* Int. [International] Sanctions: 0.01.
Drivers of repression
To explore key drivers of state repression against Crimean Tatars in the post-annexation period, we select relevant factors identified by previous studies. State repressive behaviour may respond to external pressure through international political and economic sanctions imposed on Russia. Research indicates that, although well-intended, sanctions may have a contrary effect and deteriorate human rights conditions (Hultman and Peksen Reference Hultman and Peksen2017; Kang, Lee, and Whang Reference Kang, Lee and Whang2023; Peksen Reference Peksen2009). We operationalize the level of international sanctions using a weekly count variable that measures the aggregate number of new sanctions or extensions of existing sanctions announced by the European Union and the United States in a given week.Footnote 6 Beyond sanctions, the visibility of human rights violations and international awareness thereof may influence the level of state repression against minorities (Heinze and Freedman Reference Heinze and Freedman2010; Mcloughlin Reference Mcloughlin2011). To account for the level of international awareness, we include a monthly count variable quantifying formal reports, declarations, and statements issued by major international organisations that specifically address the situation in Crimea.
To capture resistance levels, we systematically code Crimean Tatar protest events on a daily level. Our primary source consists of news reports from Crimean Solidarity, a civil society organisation that has systematically documented and disseminated footage of Crimean Tatar protests through its YouTube channel and Facebook presence. These platforms contain thousands of videos and posts in Russian and Crimean Tatar languages, documenting resistance to arbitrary searches, judicial proceedings, and broader repressive measures implemented since 2014. To ensure comprehensive coverage and mitigate potential selection bias, we supplement this primary source with materials from KrymRealii, Google News, KrymInform, and Day Kyiv. Building on existing studies that demonstrate the tendency of repressive episodes to cluster around symbolically salient or politically sensitive cultural events, we code the Crimean Tatar cultural calendar (Bhasin and Gandhi Reference Bhasin and Gandhi2013; Truex Reference Truex2019). Our dummy variable gives information on whether there was a Crimean Tatar holiday or commemoration on a specific day.
Finally, we include two structural variables: First, our demographic variable and the percentage of Crimean Tatars residing in the district where a repression event took place; Second, we include the monthly inflation rate in Russia, which serves as a proxy for macroeconomic conditions and the state’s fiscal capacity to conduct repression (Koren and Mukherjee Reference Koren and Mukherjee2022; Mukherjee and Yadav Reference Mukherjee, Yadav, Mukherjee and Yadav2024). To assess the robustness of our findings, we construct a numerical measure of the repression intensity. This continuous variable captures the severity of each repressive incident, based on the repression types included in CriTaRep, and is aggregated into a daily average score. For instance, administrative punishment receives a lower severity weight than instances involving physical violence (see Suppl. Material. for the weighting scheme).
Using Spearman rank-order correlations, we find that the frequency of repression events correlates significantly with three variables (Figure 6): Crimean Tatar population share (ρ = 0.32, p < 0.001), protest activity (ρ = 0.16, p < 0.001), and international awareness (ρ = 0.06, p < 0.01). All other variables — international sanctions, cultural events, and the inflation rate — do not show any substantial associations with our repression variable. By contrast, repression intensity is significantly correlated only with protest activity (ρ = 0.17, p < 0.001) and shows no meaningful association with Crimean Tatar population share (ρ = -0.08, p > 0.05), the level of international awareness, international sanctions, the inflation rate, or the occurrence of cultural events.
To further examine the impact of resistance activities by Crimean Tatars on both the frequency and intensity of repression by the occupying forces, we estimate a series of regression models using our daily-level panel data. This allows us to estimate whether repression increases on days with protests. Given that repression frequency is a count variable, we employ a Poisson regression model of the form:

where protesti represents different temporal specifications of protest activity: on the same day (Model 1), one-day lagged protests (Model 2), seven-day lagged protests (Model 3), one-day leading protests (Model 4), and seven-day leading protests (Model 5). The γⱼ terms capture year fixed effects, which we use to account for factors that vary systematically across years. For repression intensity, which is a continuous average score, we estimate standard linear models with the same control variables:

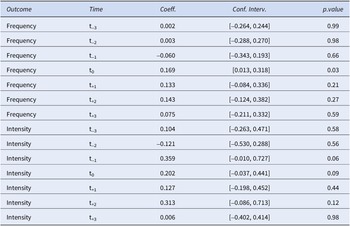
Consistent with our previous findings, protest activity emerges as a significant predictor of repression frequency (Table 3).Footnote 7 In the Poisson models, current-day protest count predicts the expected number of repression events (β = 0.169, p = 0.03), indicating that each protest is associated with an approximately 18 percent increase in daily repression frequency. This effect disappears when protests are lagged or led by up to three days. For repression intensity, the results are more ambiguous. While coefficients for t0 (β = 0.202, p = 0.09), t-1 (β = 0.359, p = 0.06), and t+1 (β = 0.127, p = 0.44) are positive and point in the same direction, none achieves conventional levels of statistical significance (Figure 7). We interpret these findings as tentative empirical evidence that protest increases the frequency and intensity of coercive measures of the occupying forces against the indigenous population.
Summary statistics

Table 3. Long description
The table is organized into five columns: Outcome, Time, Coeff. (Coefficient), Conf. Interv. (Confidence Interval), and p.value.
Frequency Outcome Data:
* t sub minus 3: Coeff. 0.002, Conf. Interv. [minus 0.264, 0.244], p.value 0.99.
* t sub minus 2: Coeff. 0.003, Conf. Interv. [minus 0.288, 0.270], p.value 0.98.
* t sub minus 1: Coeff. minus 0.060, Conf. Interv. [minus 0.343, 0.193], p.value 0.66.
* t sub 0: Coeff. 0.169, Conf. Interv. [0.013, 0.318], p.value 0.03.
* t sub plus 1: Coeff. 0.133, Conf. Interv. [minus 0.084, 0.336], p.value 0.21.
* t sub plus 2: Coeff. 0.143, Conf. Interv. [minus 0.124, 0.382], p.value 0.27.
* t sub plus 3: Coeff. 0.075, Conf. Interv. [minus 0.211, 0.332], p.value 0.59.
Intensity Outcome Data:
* t sub minus 3: Coeff. 0.104, Conf. Interv. [minus 0.263, 0.471], p.value 0.58.
* t sub minus 2: Coeff. minus 0.121, Conf. Interv. [minus 0.530, 0.288], p.value 0.56.
* t sub minus 1: Coeff. 0.359, Conf. Interv. [minus 0.010, 0.727], p.value 0.06.
* t sub 0: Coeff. 0.202, Conf. Interv. [minus 0.037, 0.441], p.value 0.09.
* t sub plus 1: Coeff. 0.127, Conf. Interv. [minus 0.198, 0.452], p.value 0.44.
* t sub plus 2: Coeff. 0.313, Conf. Interv. [minus 0.086, 0.713], p.value 0.12.
* t sub plus 3: Coeff. 0.006, Conf. Interv. [minus 0.402, 0.414], p.value 0.98.
Effects of Protests on State Repression.

Figure 7. Long description
A coefficient plot with a vertical Y axis labeled Coefficient Estimate ranging from negative 0.50 to 0.75. A horizontal X axis represents time periods from t minus 3 to t plus 3. A dashed horizontal line at 0.00 serves as the baseline. Two data series are plotted with dots and vertical error bars representing 95 percent confidence intervals. Red dots represent Frequency Poisson and blue dots represent Intensity O L S.
* At t minus 3, Frequency is at 0.00 and Intensity is slightly positive.
* At t minus 2, Frequency is at 0.00 and Intensity is negative.
* At t minus 1, Frequency is slightly negative while Intensity peaks at approximately 0.35.
* At t, both series are positive, with Frequency near 0.15 and Intensity near 0.20.
* At t plus 1, both series remain positive near 0.15.
* At t plus 2, Frequency is near 0.15 and Intensity is near 0.30.
* At t plus 3, Frequency is near 0.10 and Intensity drops to 0.00.
Error bars for Intensity O L S are generally wider than those for Frequency Poisson across all time periods.
This finding supports our observation that Russian authorities respond swiftly to dissent with coercive measures being tightly coupled to resistance activities of Crimean Tatars. The repression strategy aims not only at immediate crowd control but also at deterring future dissent through intensified punitive measures against the most active participants in the protests. Our qualitative evidence indicates that protest participants are typically targeted through newly initiated administrative and criminal prosecutions; however, whether this translates into measurably more severe repression requires further investigation with a larger sample. The insignificant lead variables support the temporal ordering of protest preceding state repression, though establishing definitive causal claims requires additional analyses to address potential simultaneity and confounding factors. We see further analyses as a promising avenue for future research.
Conclusion
This study introduces CriTaRep v1, the first comprehensive, disaggregated event dataset documenting state repression against Crimean Tatars from January 2000 to December 2024. CriTaRep records over 2,200 individual victims across a diverse range of social categories, highlighting the extensive and systematic nature of Russia’s repressive campaign in annexed Crimea. Our data shows that the Russian authorities quickly established a comprehensive system of social control in Crimea and have maintained a high level of repression since. State repression targeting Crimean Tatars is multifaceted — including administrative harassment, deprivation of liberty, and physical violence — and is carried out in a deliberate and strategic manner. For example, the initial phase of annexation was characterised by intense physical repression and the targeted elimination of oppositional elites. During the post-annexation period, a sustained level of repression has aimed to intimidate ordinary citizens, instil fear, and deter dissent. Periods of increased political activism are often met with a short-term rise in repression, demonstrating an adaptive and calibrated approach to authoritarian governance in annexed territories.
By systematically collecting and manually coding over 700 repression events targeting ethnic group members, we address a critical empirical gap in the comparative study of authoritarian coercion and demographically targeted repression in the widely understudied context of occupation. Drawing on locally sourced, indigenous-language reports, the dataset illustrates the value of such documentation for studying state repression against marginalised populations and addresses critical biases of existing datasets, which do not, or only to a very limited extent, cover repression events against Crimean Tatars. The dataset’s disaggregated structure enables fine-grained analysis of repressive repertoires while maintaining the temporal and spatial precision necessary for rigorous empirical analysis. In this way, we advance beyond existing data available only at the country-year level or those that include only very aggregate measures of repression.
Our findings contribute to three key theoretical debates in the literature on state repression, ethnic conflict, and authoritarian governance. (1) First, our study contributes to existing works on how authoritarian regimes adjust coercive strategies across different phases and targets (Frantz and Kendall-Taylor Reference Frantz and Kendall-Taylor2014; Sullivan Reference Sullivan2016; Rozenas Reference Rozenas2020). The shift from high-intensity violence (2014–2015) to institutionalised administrative coercion (2016–2021) and then to wartime securitisation (2022–present) highlights the temporal dynamics of repressive adaptation. Notably, the 2022 escalation in Ukraine did not fundamentally change established patterns in Crimea, indicating that once institutionalised, repressive infrastructures show remarkable durability. (2) Second, our findings provide further empirical support for the repression-protest nexus, with Poisson regression models demonstrating significant positive associations between protest activity and the frequency of repressive events. Our models provide evidence for same-day responses rather than lagged or pre-emptive reactions to repression. Again, this highlights the reactive and dynamic nature of authoritarian coercion. (3) Third, we advance understanding of bureaucratic repression through our documentation of systematic temporal patterns, particularly the concentration of arbitrary searches on Thursdays. This “Black Thursday” phenomenon exemplifies how organisational routines and legal frameworks shape repression patterns and demonstrates the banality of authoritarian rule (Arendt Reference Arendt2006; Levitsky and Ziblatt Reference Levitsky and Daniel2023).
Despite a careful coding process, several limitations warrant acknowledgement. First, a number of repression events may remain undocumented, which may be itself a consequence of repression and state censorship. Second, we can also not fully rule out the possibility that the sources we use have implicitly or explicitly prioritized certain types of repression (for example, high-profile arrests) over others (for example, subtler forms of intimidation or bureaucratic punishment). This may lead to certain biases in our dataset. Third, and related to the former aspect, the increasing consolidation of the state’s system of social control may result in temporal bias, particularly underreporting of more recent repression occurring under tighter surveillance and restrictions for journalists and civil society actors to document human rights abuses. Fourth, our focus on Crimean Tatars limits generalizability to other minority groups or contexts.
CriTaRep provides an essential empirical foundation for understanding Russian repression in annexed territories against minorities and, more broadly, makes a significant contribution to the theoretical and empirical advancement of the study of demographically targeted repression. In light of the global wave of autocratization and the surge in conflicts worldwide, systematic documentation of minority-targeted state repression is increasingly vital not only for scholarly understanding but also for supporting accountability efforts and upholding human rights standards.
Supplementary material
The supplementary material for this article can be found at http://doi.org/10.1017/nps.2026.10159.
Financial support
This work was partly funded by the Deutsche Forschungsgemeinschaft (DFG, German Research Foundation) — 493809260.
Disclosure
None.



 Open access

