


1. Introduction
The importance of user-centered design increases not only in the context of workplace design in Industry 5.0 but also in general product design due to a rising expectation for personalized products (Reference Saniuk, Grabowska, Fahlevi, Machado and DavimSaniuk et al., 2023). Thus, digital user tests and tools for digital ergonomic evaluations are gaining importance to enable time- and cost-efficient product adjustments in the early stages of the product development process (Reference ChaffinChaffin, 2005; Reference Wolf, Miehling and WartzackWolf et al., 2020).
Integrating digital human models (DHMs) with computer-aided design (CAD) tools provides a method for digital user tests by facilitating simulations of user-product interactions that consider the behavior and properties of both the user and the product. However, users may employ different strategies to perform a specific interaction, resulting in varying postures and movements. These strategies depend on the user, the product, and environmental factors (Reference BubbBubb, 2002) and need to be represented in digital user tests. Consequently, underlying posture and motion prediction models must consider these potential movement strategies (Reference Wolf, Fackler, Reulbach, Wartzack and MiehlingWolf et al., 2022).
DHM software for workplace design, aviation, and automotive industries enables ergonomic assessments based on simulations, including, among others, analysis of visibility, accessibility, or fatigue (Reference Bubb, Fritzsche and DuffyBubb & Fritzsche, 2008; Reference Mühlstedt, Bullinger-Hoffmann and MühlstedtMühlstedt, 2016). The user is represented by a statistical anthropometric population model, which allows for posture prediction from posture data distributions and optimization (Reference Wirsching and FleischerWirsching & Fleischer, 2022). However, deeper ergonomic outcomes such as muscle and joint torques are predominantly neglected in posture prediction approaches for DHM-based ergonomic assessments (Reference Zhang, Nieuwenhuys and ZhangZhang et al., 2025).
Musculoskeletal human models (MHMs), a specific type of DHMs, have the potential to bridge this gap. MHMs provide biomechanical insights into muscles and joints, facilitating more detailed ergonomic assessments that consider not only body posture but also parameters such as joint loads and muscle activations (Reference van der Have, Wang, Van Rossom and Jonkersvan der Have et al., 2023; Reference Zaman, Xiang, Rakshit and YangZaman et al., 2022). Since applying established predictive simulation methods with MHMs in CAD is challenging due to increased dimensionality, leading to high computational costs and reduced real-time capability (Reference Zhang, Nieuwenhuys and ZhangZhang et al., 2025), it is necessary to consider dimension reductions in the methods.
Using known movement strategies, expressed in a behavior card, for posture prediction has proven to be a useful method for representing individual movement strategies with MHMs, particularly for predicting user-product interactions (Reference Wolf, Fackler, Reulbach, Wartzack and MiehlingWolf et al., 2022). By combining data-driven and optimization-based methods, this approach has the potential to address high computational costs, improve real-time applicability, and integrate MHMs in digital user tests. However, a main challenge remains to investigate individual movement strategies using a standardized and low-threshold procedure to derive generalizable and reusable databases.
2. Preliminaries
Reference Wolf, Wagner, Oßwald, Miehling and WartzackWolf et al. (2021, Reference Wolf, Fackler, Reulbach, Wartzack and Miehling2022) presented a predictive framework for user-product interaction modelling with MHMs, especially for application in CAD using known movement strategies.
The approach, depicted in Figure 1, includes affordance features that enable the engineer to select predefined interactions between the human and the product, designated as elementary affordances. The database for the affordance features provides a selection of 31 predefined elementary affordances for hands, feet, eyes, and buttock, including, for example, ‘thumb and fingers grab cuboid, ‘foot touches cylinder medial’, or ‘buttock sits on surface’. By choosing and specifying those elementary affordances, the MHM’s end effector’s positions and orientations, as well as the distribution of bodyweight and external forces, are defined, and the impact of the interaction with the product is represented (Reference Wolf, Wagner, Oßwald, Miehling and WartzackWolf et al., 2021).
Framework for posture prediction with MHMs in CAD (Reference Wolf, Wagner, Oßwald, Miehling and WartzackWolf et al., 2021, Reference Wolf, Fackler, Reulbach, Wartzack and Miehling2022)

Figure 1 Long description
A framework for posture prediction with MHMs in CAD. Panel A: A CAD model of a table with a machine on it. Affordance features include hand grabbing a cylinder and feet touching surfaces. Panel B: A digital human model (DHM) in a predicted posture, with annotations indicating specific actions like hand grabbing a cylinder and feet touching surfaces. Panel C: Another DHM in a different posture, showing coordination patterns and posture adjustments.
To represent the various movement strategies that users apply, behavior cards are used. Behavior cards include a body posture expressed in joint angles and are determined experimentally from motion capturing of user-product interactions (Reference Wolf, Fackler, Reulbach, Wartzack and MiehlingWolf et al., 2022). Subsequent to the motion capturing, movement strategies across various users and environmental conditions (e.g., location of the product relative to the user) are identified manually. The most frequent movement strategies for each environmental condition are summarized into a behavior card. For the identification of movement strategies, quantitative measures, such as median joint angles and range of joint angles, are used. In addition to joint angles for generalized coordinates, the behavior cards include a coordination pattern, particularly weighting factors that specify the allowed adjustments of the respective joint during the subsequent posture prediction (Reference Wolf, Fackler, Reulbach, Wartzack and MiehlingWolf et al., 2022).
The posture prediction for the user-product interaction scenario is then performed in a biomechanical simulation tool, such as OpenSim, by using an inverse kinematic optimization approach. The inverse kinematic optimization considers the specified affordances from the affordance feature as kinematic and dynamic constraints and uses the behavior card as a start solution. Hence, the kinematic optimization aims to keep the body posture from the behavior card as accurate as possible by reducing kinematic errors while fulfilling the constraints. The weighting factors of the coordination pattern determine the allowed magnitude of adjustment for each joint. The use of behavior cards aims to generate a reusable representation of various movement strategies that can also be applied to investigations with different products but similar spatial and global conditions (Reference Wolf, Fackler, Reulbach, Wartzack and MiehlingWolf et al., 2022).
To identify how user-related and environmental parameters influence body posture and movement strategies, Reference Spelly, Scherb, van Remmen, Wartzack, Miehling and DuffySpelly et al. (2025) conducted a pilot study that analysed interactions with a pillar drill machine. The study found that body height, prior experience, and distance were mainly correlated with variations in shoulder and arm joint angles, joint moments, and joint reaction forces.
3. Objective and research question
Using behavior cards and elementary affordances with MHMs and CAD for posture prediction is a promising, evaluated approach for subsequent detailed and individualized ergonomic evaluations (Reference Wolf, Fackler, Reulbach, Wartzack and MiehlingWolf et al., 2022). Yet, the identification of behavior cards is done manually by first capturing experimental data and second, using qualitative observations of movement strategies. To provide behavior card-based posture prediction across several use cases and enable low-threshold and reusable applicability for engineers, two main aspects are required. First, the determination of behavior cards should be standardized and automated. Second, a behavior card library with a decision or mapping tool should be implemented to support the selection of the appropriate behavior card for a given interaction situation by quantifying the effects of user-related and environmental factors.
In order to address those limitations and move towards standardized behavior card determination, we aim to answer the following research question: How to enable standardized behavior card determination from user properties and user location for posture prediction in product development?
We investigate the applicability and precision of two methods for standardized behavior card determination from experimental data: a qualitative approach oriented on Reference Wolf, Fackler, Reulbach, Wartzack and MiehlingWolf et al. (2022) and a quantitative approach based on the impact of user-related and environmental influencing factors. In particular, a cluster-based approach and a linear regression-based approach are applied.
4. Methods
The following section describes the approach of cluster-based and linear regression-based behavior card determination from experimental data. The experimental data used in this study were captured as pilot study data in Reference Spelly, Scherb, van Remmen, Wartzack, Miehling and DuffySpelly et al. (2025).
4.1. Experimental data and data processing
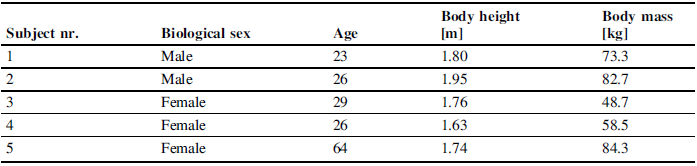
Five healthy, right-handed subjects participated in this study. All participants provided written informed consent with the ethics commission of Friedrich-Alexander-Universität Erlangen-Nürnberg prior to their involvement in the study. Anthropometric and demographic information of each participant is presented in Table 1.
Anthropometric and demographic information about participants

The participant’s motion while operating a pillar drill machine was captured using 17 inertial measurement units (IMUs), sampled at 96 Hz (System Perception Neuron Axis Studio, Noitom Ltd., Beijing, China). The IMUs were attached to the participant’s body segments according to the placement guidelines of the system. The experimental setup included variations of the participant’s standing location. It was randomly varied across three different standing heights (ground, 7 cm above, and 20 cm above) and three different distances (5 cm, 20 cm, and 35 cm). Additionally, trials with self-chosen distances were conducted. All drilling tasks were performed with the right hand. The initial dataset comprised 22 measurements for each subject, including two self-chosen distances and nine location variations, performed at two distinct angular drilling speeds. Altogether, this yielded a total of 110 measurements. Moreover, to enhance the generalizability of the findings to other use cases, this study excludes prior experience as a demographic parameter.
For subsequent analysis of joint angles, musculoskeletal simulation was carried out using OpenSim 4.5 (Reference Seth, Hicks, Uchida, Habib, Dembia, Dunne, Ong, DeMers, Rajagopal, Millard, Hamner, Arnold, Yong, Lakshmikanth, Sherman, Ku and DelpSeth et al., 2018). The interface of Reference Wechsler, Wolf, Fleischmann, Waibel, Molz, Scherb, Shanbhag, Franz, Wartzack and MiehlingWechsler et al. (2023) was applied to transfer IMU data from the bvh format to OpenSim-compatible formats, using the integrated MHM that includes an adjusted dynamic upper-limb model presented by Reference Saul, Hu, Goehler, Vidt, Daly, Velisar and MurraySaul et al. (2015). In our model, the dependent constraints describing the kinematics of the sternoclavicular joints were transformed into independent coordinates. Consequently, the model has 38 internal degrees of freedom (DOFs) in addition to six global DOFs. Joint angles were determined using an inverse kinematics approach with an individually anthropometrically scaled MHM for each participant, obtained from the interface. This study only focuses on the body posture adopted when grasping the lever arm and beginning to drill.
4.2. Behavior card determination
After data preparation and outlier removal, 106 out of 110 measurement points were included in the dataset for behavior card determination.
4.2.1. K-means clustering
For cluster-based behavior card determination, a Principal Component Analysis (PCA) was conducted using selected z-standardized joint angles to reduce data dimensionality and increase the generalizability of the approach across various user-product interactions. We particularly used upper extremity joint angles for PCA, encompassing 16 DOFs, as lower extremity joint angles showed minimal range of motion (ROM) across the dataset, because all tasks were conducted in a standing position. The first two principal components were retained for k-means clustering, as they captured approximately 50 % of the total variance. Including higher-order principal components led to reduced cluster separability, suggesting that these dimensions represented less relevant, individual-specific variations rather than systematic postural patterns. K-means clustering was performed ten times, selecting the final result based on the minimum squared Euclidean distance between cluster points and centroids. The optimal number of clusters was determined using silhouette score (Reference RousseeuwRousseeuw, 1987), which yielded four clusters.
4.2.2. Linear regression
To build the linear regression models, potential predictor variables include user-specific parameters, such as anthropometry, as well as location parameters, such as the distance to the product. Initially, the numeric predictor variables were filtered using the Variance Inflation Score (VIF) to reduce multicollinearity. Variables were retained so that VIF < 5 for each variable, resulting in the inclusion of age, body height, body mass, distance, and height as numerical predictors, along with biological sex as a categorical predictor. Eliminated variables are arm length and inseam height. For each generalized coordinate of the MHM, one regression model was developed, using the full dataset of measurement points and using a forward and backward stepwise predictor selection approach. The Bayesian Information Criterion was used to add and remove predictors, and the prediction term was limited to linear predictors. To evaluate the generalizability and stability of the linear regression models, a 5-fold cross-validation (CV) was executed for each generalized coordinate. The predictive quality of the full model is subsequently compared to the CV models.
5. Results
The results and the quality of the clustering and linear regression approaches are presented, along with an example of the deriving behavior cards.
5.1. K-means clustering
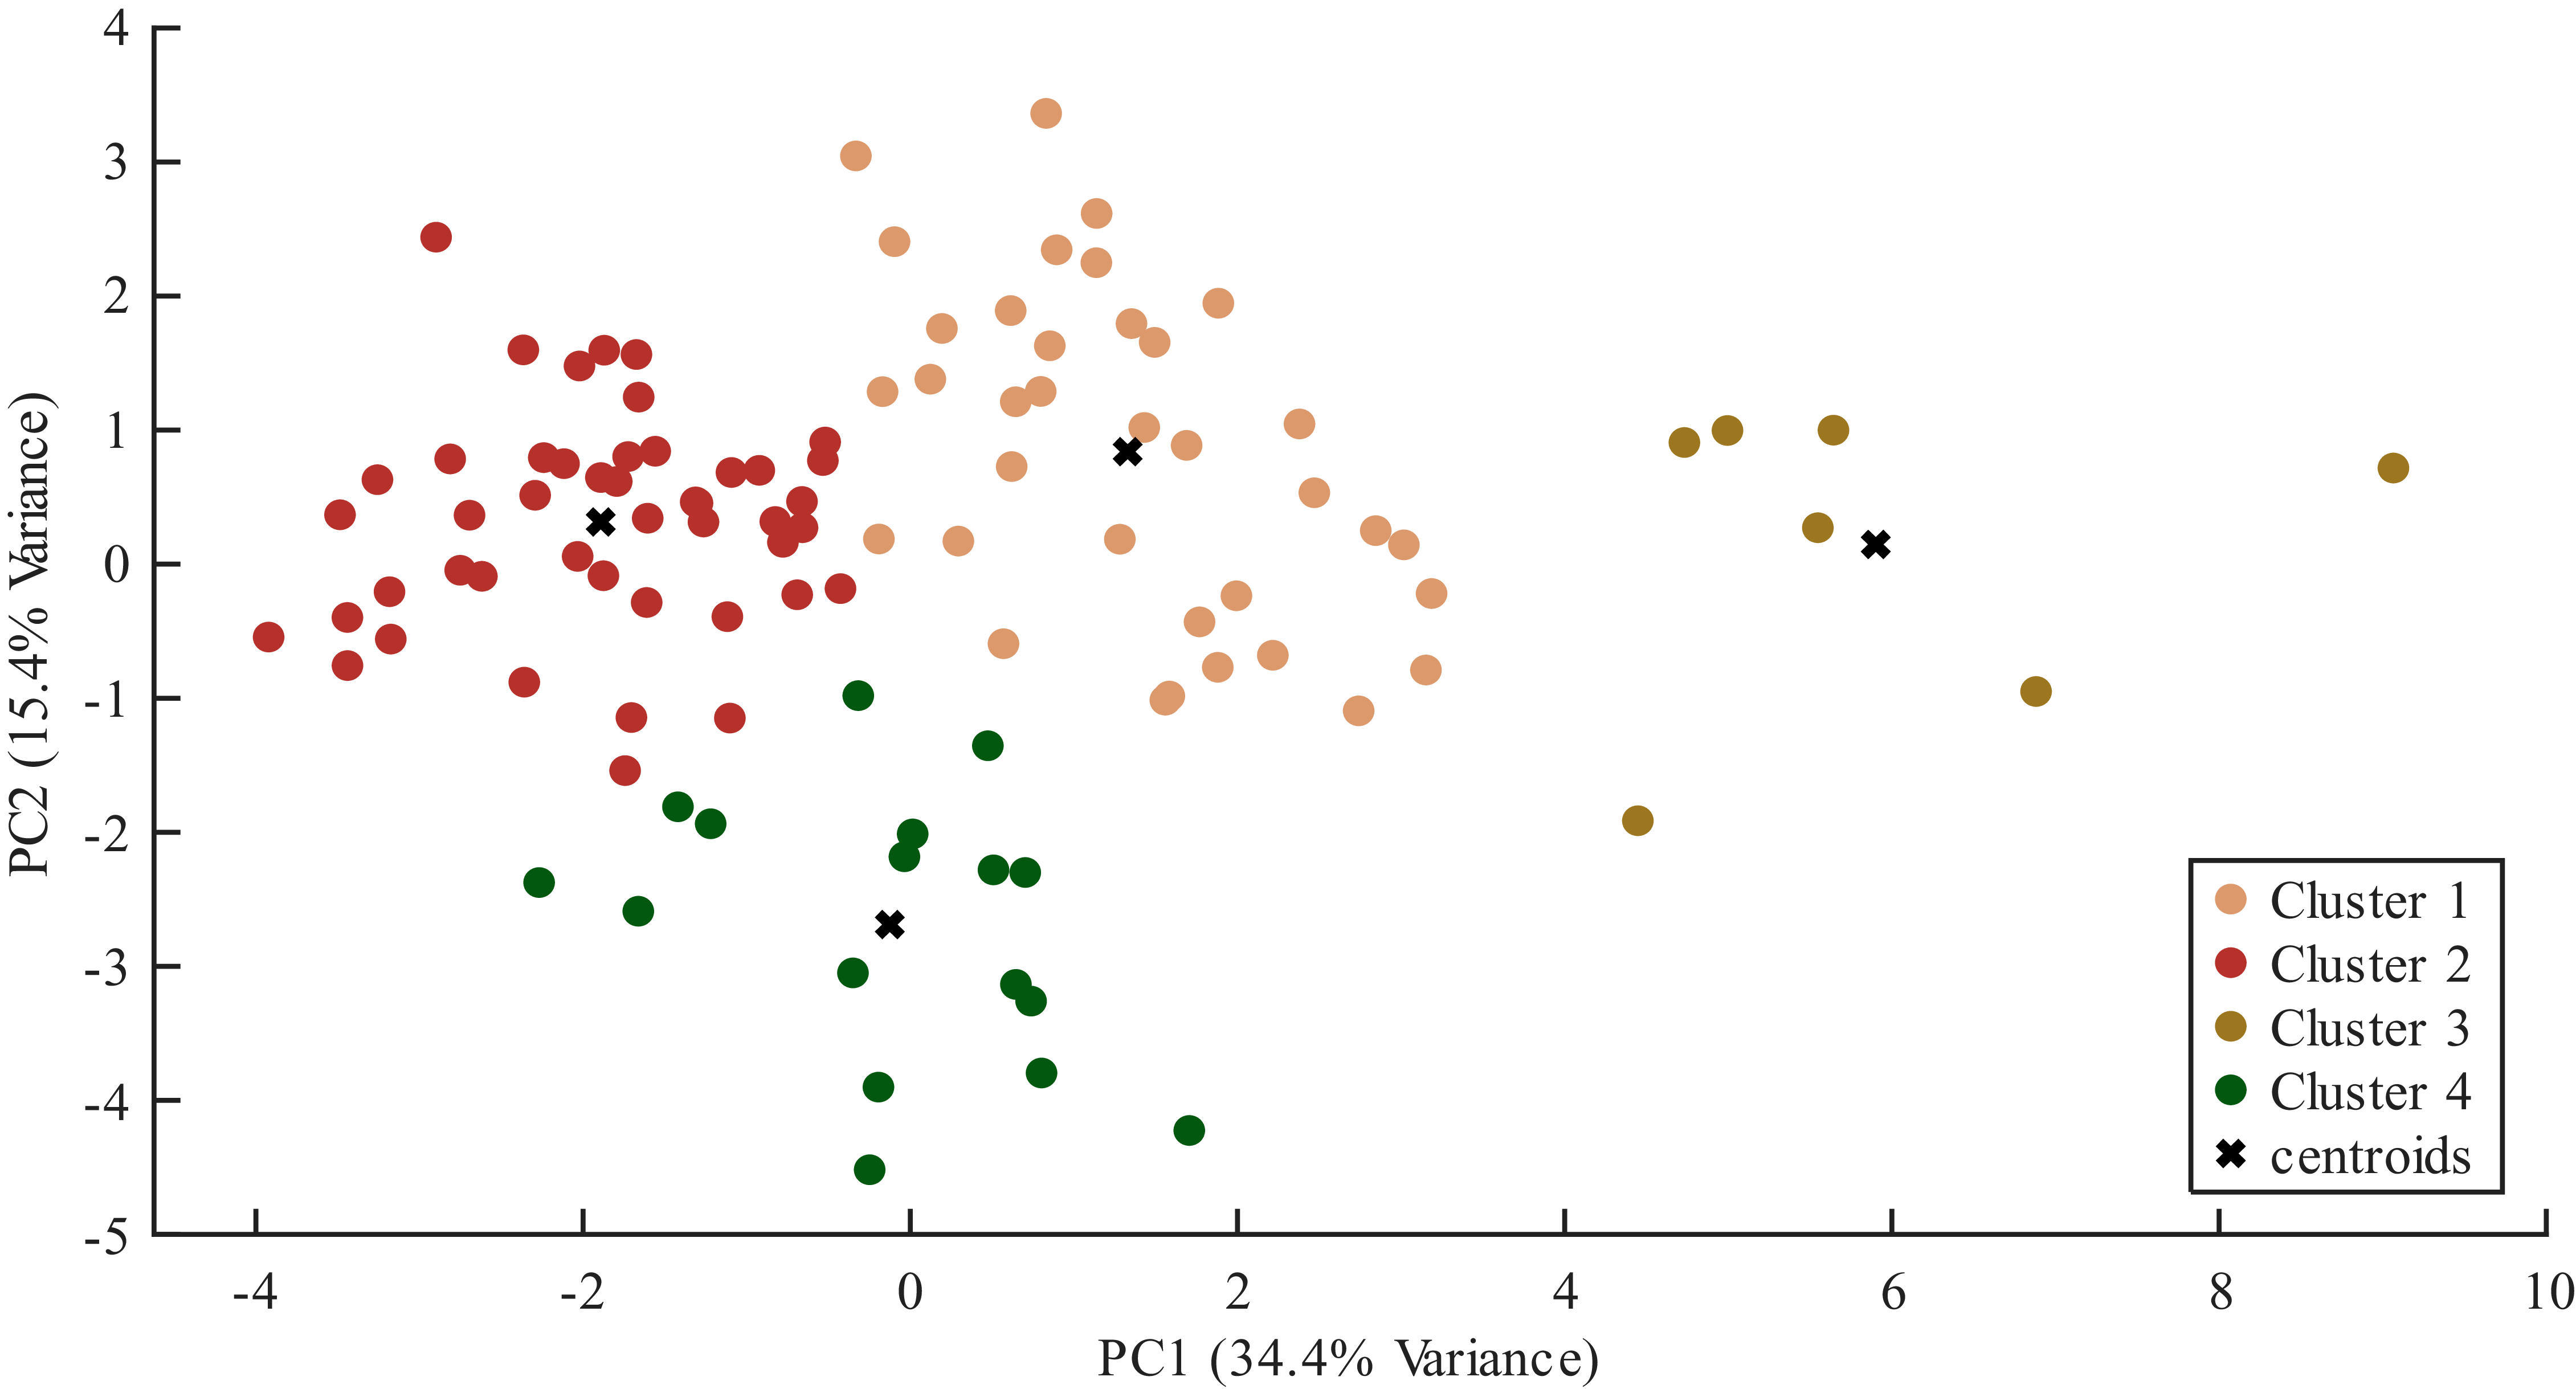
The experimentally observed body postures were clustered into four groups using PCA and k-means clustering. The clusters include 36, 46, 7, and 17 data points, respectively. The mean silhouette score is 0.6259. The clusters in the principal component space are shown in Figure 2.
Clusters in principal component space

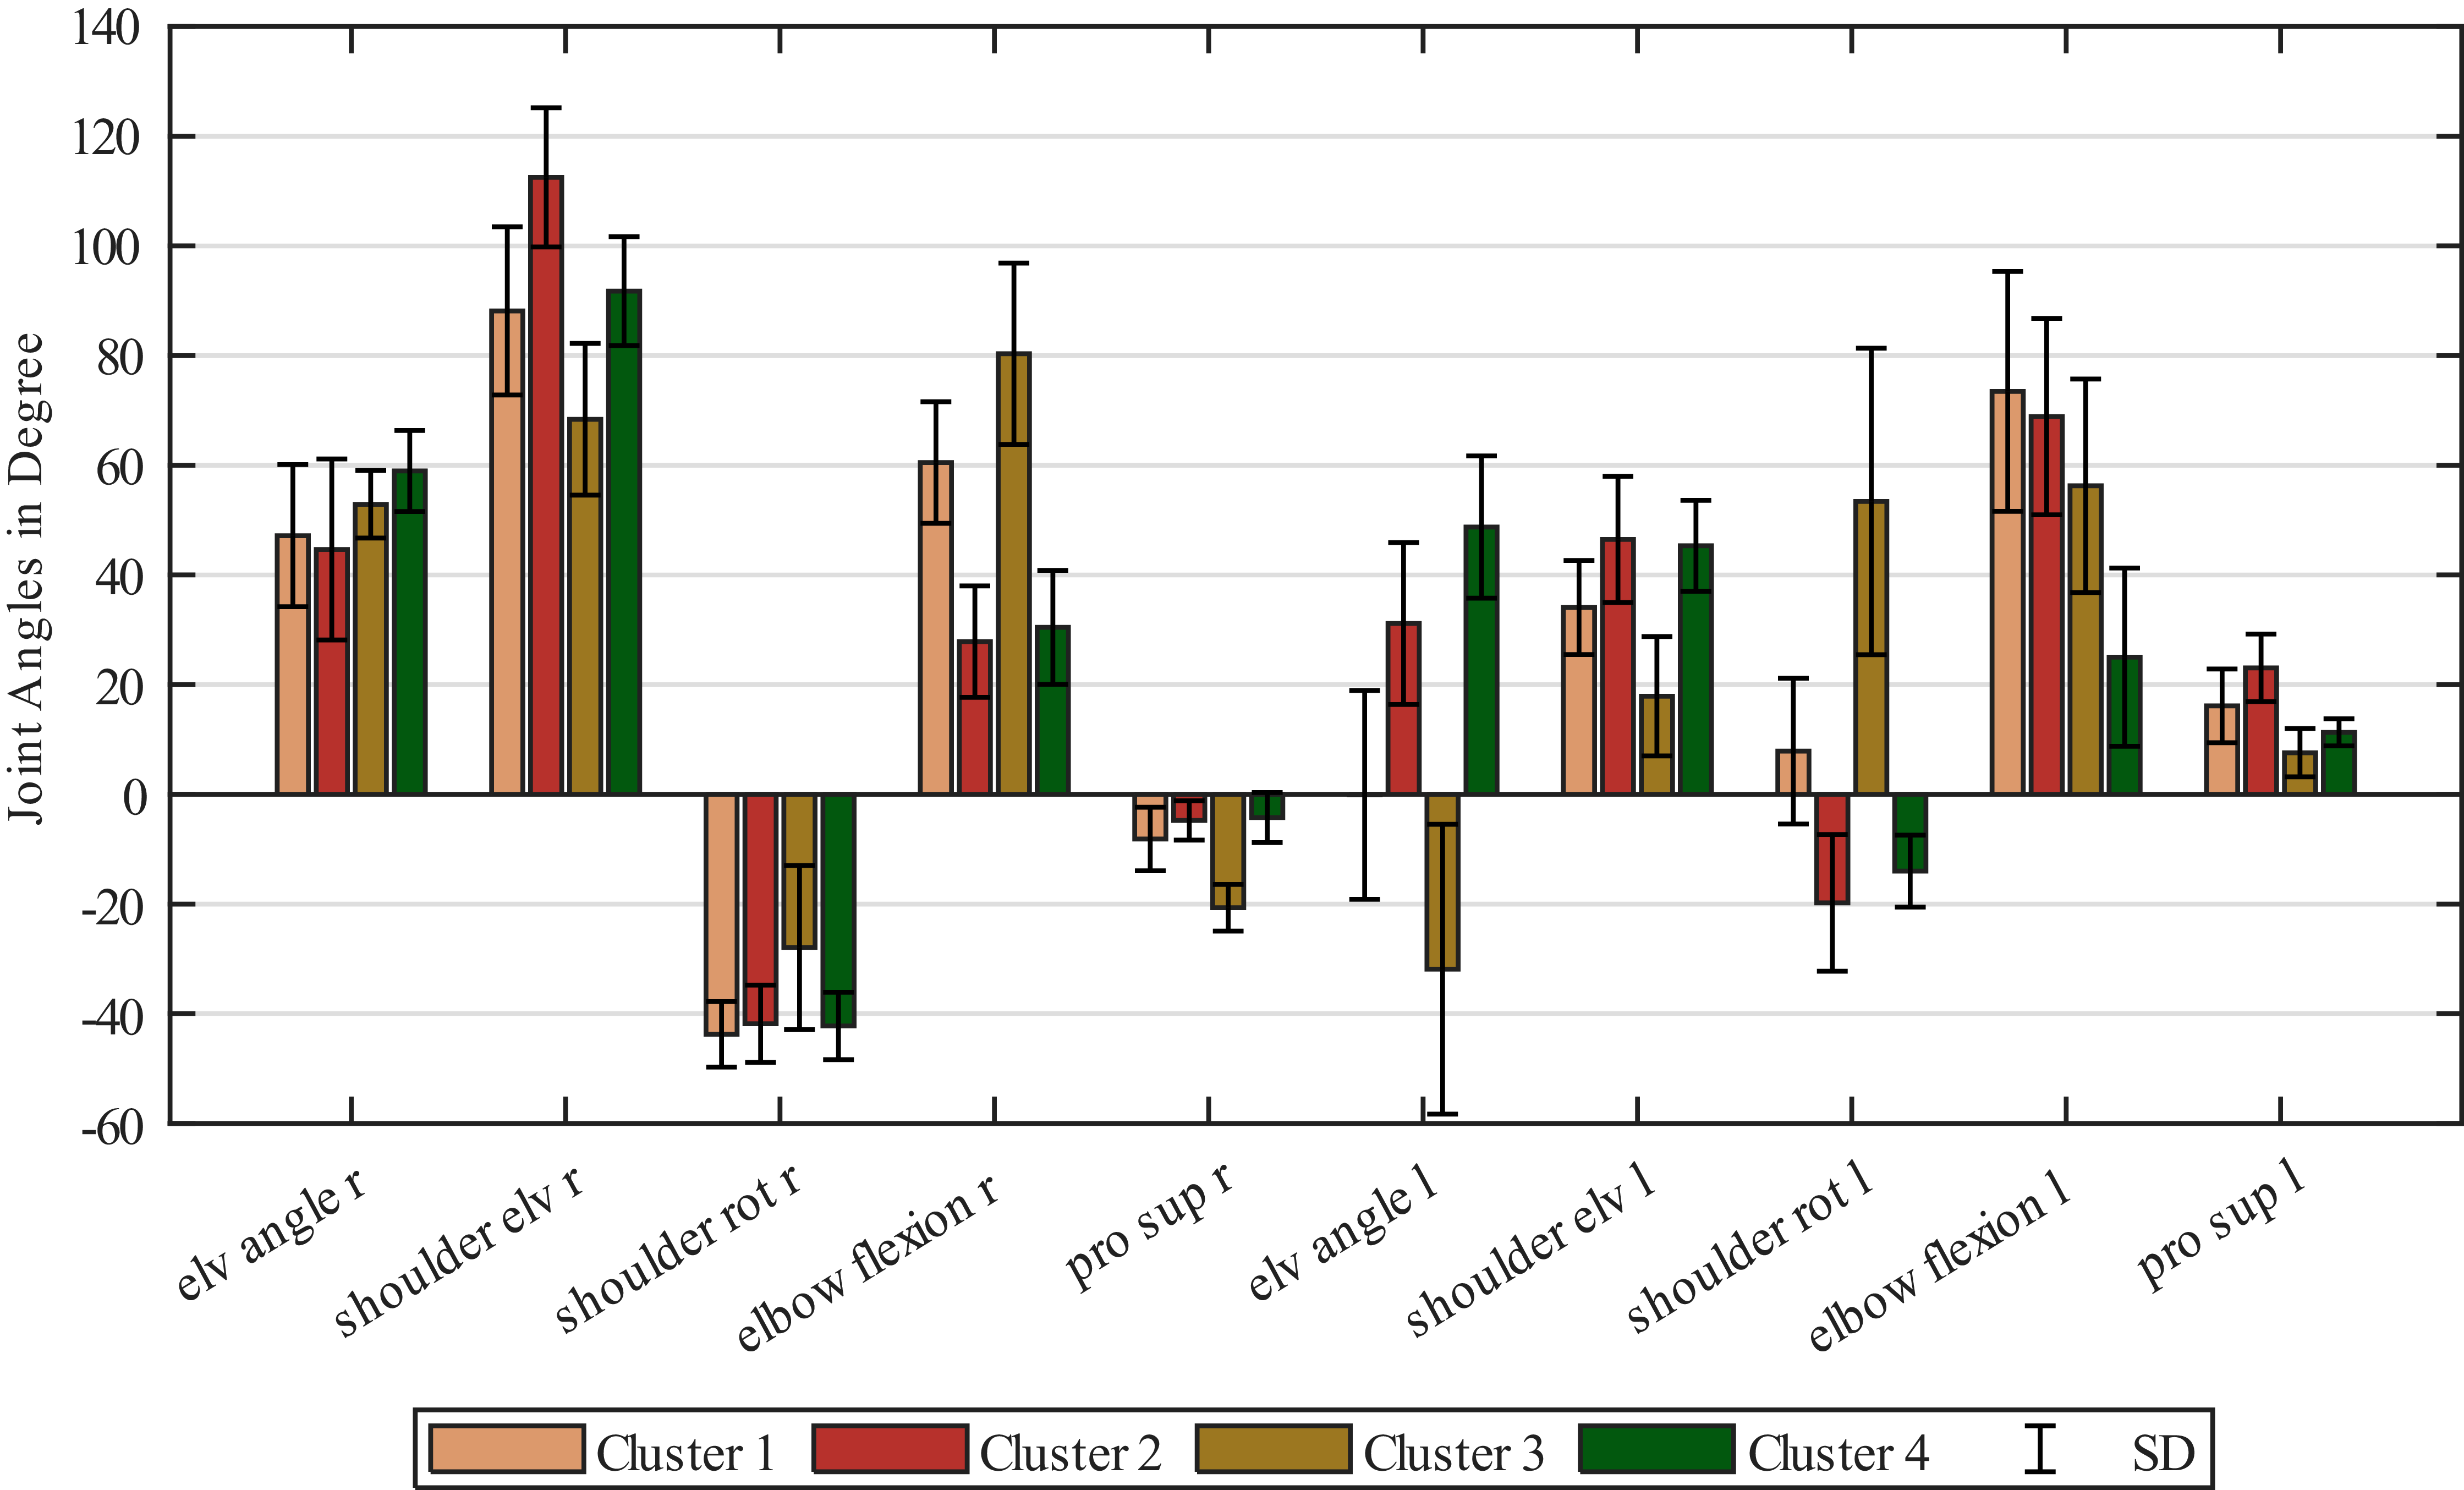
Mean joint angles and SDs for each cluster

Figure 3 Long description
A bar graph compares joint angles in degrees across different clusters. The horizontal axis lists various joint movements such as elevation angle, shoulder elevation, shoulder rotation, elbow flexion, and pro supination for both right and left sides. The vertical axis measures joint angles in degrees, ranging from -60 to 140. The graph includes four clusters, each represented by different colors: Cluster 1 in beige, Cluster 2 in red, Cluster 3 in yellow, and Cluster 4 in green. Each cluster has vertical bars indicating the mean joint angles with error bars representing standard deviations. Notable trends include variations in joint angles across different clusters, with some joints showing significant differences in angles between clusters. For example, shoulder elevation and elbow flexion show substantial variations, while pro supination angles are relatively consistent across clusters.
Figure 3 shows the mean joint angles and standard deviation (SD) for each cluster. For clarity reasons, only selected arm and shoulder coordinates are included in the figure. We observe variations in the average joint angles for each cluster. However, for right-side shoulder rotation, three out of the four clusters show a similar mean joint angle and SD. While we observe maximum SDs of 17° for right-side joint angles, for left-side plane of elevation (elv angle l), shoulder rotation, and elbow flexion, some clusters show an SD of up to 28°.
5.2. Linear regression models
A linear regression model was fit for each generalized coordinate of the MHM, calculating the corresponding joint angle from anthropometric and user location data. The accuracy (correlation coefficients
 ) of the full models for each generalized coordinate compared to the respective CV models is shown in Figure 4. Subtalar and metatarsophalangeal DOFs were excluded from the analysis since no motion was observed. We find the highest model accuracy for right-side shoulder elevation as well as for right- and left-side elbow flexion. Minimum model accuracy occurs for right-side shoulder rotation and left-side ankle angle. Model stability is observed highest for models that show correlation
 . Sternoclavicular joints show high instability. Additionally, we observe maximum root mean squared errors (RMSEs) of the ROM across the dataset of 18 % for the left-side ankle angle, left-side sternoclavicular joint, and left-side wrist pronation and supination. Minimum RMSE of 5 % occurs for right-side shoulder elevation (Figure 5). As an example, the resulting coefficients and predictors for the regression model of right-side shoulder elevation are shown in Table 2.
Linear regression model for right-side shoulder elevation

Quality of CV and full linear regression models for each generalized coordinate

Figure 4 Long description
A scatter plot comparing the accuracy of CV models and full models for various generalized coordinates. The horizontal axis represents different generalized coordinates, while the vertical axis represents the correlation coefficients R squared. The plot includes dozens of data points, with blue circles representing CV models and black crosses representing full models. The data points show varying levels of accuracy for different coordinates, with some coordinates showing higher accuracy for full models and others for CV models. There is no clear overall trend, and the data points are scattered across the plot.
Root mean squared errors (RMSE) between measured and regression-calculated joint angles

5.3. Behavior cards
Regression- and cluster-based behavior cards for one example posture are presented in Figure 6.
 represent the joint angles for the generalized coordinates, and
 are the weighting factors of the coordination pattern that imply the allowed adjustments during kinematic optimization. The cluster-based behavior cards include the mean joint angles of the assigned cluster. The joint angles for the regression-based behavior card were determined using linear regression models based on user and location information. For clarity reasons, we present only selected upper extremity coordinates. The observed differences in joint angles range from no difference in right-side shoulder rotation to 15° in the right-side plane of elevation. The plane of elevation describes the plane in which the shoulder elevation occurs relative to the frontal plane. The weighting factors of the coordination pattern are selected based on the type of interaction and the respective relative relevance of the generalized coordinates.
Examples of cluster-based and regression-based behavior cards

The body postures from the cluster-based behavior card, from the regression-based behavior card, and the respective experimental measurement are presented in Figure 7. A high degree of similarity is observed between regression-based and experimental posture in general. However, in the cluster-based posture, a difference in elbow location, specifically in the plane of elevation, is detectable.
Cluster-based and regression-based behavior card postures and experimental data applied to an MHM

6. Discussion
This study aimed to present a cluster-based and a regression-based approach for standardized behavior card determination for subsequent use in posture prediction with MHMs and application in user-product interaction.
When comparing the regression- and cluster-based behavior cards, we observe similar joint angles for the generalized coordinates. However, the main difference in body posture occurs in the plane of elevation, leading to different right-side elbow locations as shown in Figure 7. This shift can be explained by the distance between the actual measurement point and the cluster mean, reflecting the varying amounts of individuality represented in the respective behavior card. The cluster-based behavior cards are built from cluster means and thus provide a more explorative representation of a posture. The regression-based approach includes a higher representation of the individual user properties.
Four distinct clusters with different interaction strategies in the cluster means (Figure 2) were identified with a silhouette score indicating reasonable cluster separation (Reference Kaufman and RousseeuwKaufman & Rousseeuw, 1990). For the clustering, we used preselected upper body joints. The preselection was based on the type of interaction, which was here an upright standing task, and the resulting fact that the main posture differences occur in the upper body limbs. This preselection was intended to improve the clustering quality compared to clustering based on all DOFs and should be reconsidered when investigating different user-product interactions, e.g., when lower extremity joints are more affected.
A linear regression model was determined for every generalized coordinate of the MHM by using a stepwise approach. We observe various prediction accuracies as seen in Figure 4. The small ROMs in the lower limb coordinates can affect the predictability of the respective joint angles. Additionally, we had to convert two dependent constraints in the MHM into independent DOFs for each shoulder to enable a realistic simulation of all movements, leading to the observation that different joint angle combinations can reach a given posture. This redundancy can explain the very low prediction accuracy in right-side shoulder rotation, the low stability of the CV models for both-side sternoclavicular joints, and the fact that three out of four clusters show similar right-side shoulder rotation.
The cluster-based approach was based on the qualitative approach of Reference Wolf, Fackler, Reulbach, Wartzack and MiehlingWolf et al. (2022), in which different interaction strategies were identified for each environmental condition through manual observation. Here, our goal was to identify different interaction strategies using k-means clustering to automate and generalize the approach and improve applicability to larger datasets. We determined the clusters without a preceding extraction of the location conditions. While this makes the approach more generalizable to other interaction situations, it will increase the complexity when selecting a behavior card from a potential behavior card library.
In the regression-based approach, the impact of user-related and environmental factors determines the posture shown on the behavior card. This approach already partially incorporates a mapping tool for selecting the appropriate behavior card for a given interaction situation without the presence of experimental data. Here, the coefficients were forced to be linear, which enables direct conclusions about the influence of individual factors. Increasing the coefficient power and allowing coefficient combinations could improve the prediction accuracy, but also increase the complexity of findings and mapping.
The main limitation of this study is the size of the dataset, which reduces the generalizability of the results, particularly for the regression coefficients and clusters. Although variations in the experimental setup increased the heterogeneity of our dataset, it is important to mention the small number of participants in this study. Both k-means clustering and linear regression approaches enable low-threshold database extension when experimental data is already present. It is also necessary to note that, to date, only one specific point during the interaction is included in our dataset.
Another limitation occurs in determining the coordination pattern. The weighting factors were determined manually based on the qualitative relevance of each joint to the investigated user-product interaction. To achieve a standardized procedure, an advanced approach should be applied that considers the type of user-product interaction as well as either the quality of the regression model or the distance to the cluster centroid.
7. Summary & outlook
In this paper, two methods for standardized determination of behavior cards were investigated to support deeper digital ergonomic evaluations of user-product interaction in early phases of the product development process. Therefore, a cluster-based and a regression-based behavior card were determined from experimental data, and it was found that first, both approaches deliver postures similar to the experimental data, and second, both approaches show applicability for standardized behavior card determination from user properties and user locations. However, for both methods, a reduction in accuracy was observed for joint angles with a small or no range of motion across the dataset.
In the future, the determined behavior cards should be validated for posture prediction using elementary affordances in kinematic optimization, and the validity of the determined cluster and regression models should be tested on unknown data. We are also conducting an experimental study with a similar setup to the pillar drill machine to determine whether the models obtained here can be transferred to other tasks involving vertical arm motion. From this, it is necessary to build databases and a mapping for elementary and recurring interactions to increase the generalizability and applicability of the prediction models. The mapping of user properties and location conditions to a behavior card could be done using regression models or by using distances to cluster centroids. Additionally, a transfer from posture to motion prediction should be considered.
Acknowledgement
This work was partly funded by the Deutsche Forschungsgemeinschaft (DFG, German Research Foundation) – SFB 1483 – Project-ID 442419336, EmpkinS. Additionally, the authors would like to thank all study participants for their time and valuable contributions.




 Open access

