




Introduction
Nova Scotia, Canada, is a temperate, coastal province surrounded by the Atlantic Ocean on the eastern coast of Canada, with moderate summers and cold winters. Historically, the province’s climate has supported a relatively low richness of mosquito (Diptera: Culicidae) species and a paucity of mosquito-borne diseases compared to that of central Canada and more southerly latitudes. However, annual average temperatures and frost-free days have increased in Nova Scotia over the last 60 years (Garbary and Hill Reference Garbary and Hill2021) because of climate change, and we can expect further warming and increased precipitation and humidity to occur in this region (Province of Nova Scotia 2022). Species that previously have been limited in their ranges and abundance by the length and severity of Nova Scotia winters may now proliferate, thereby elevating the risk associated with mosquito vectors and associated vector-borne diseases. Indeed, Nova Scotia is already a national hotspot for the transmission of arthropod-vectored Lyme disease, thanks to climate-driven range expansion of blacklegged ticks (Ixodes scapularis Say) (Ixodida: Ixodidae) (Hatchette et al. Reference Hatchette, Johnston, Schleihauf, Mask, Haldane and Drebot2015). Furthermore, within the next 30–50 years, models predict that Nova Scotia may become suitable habitat for Aedes albopictus Skuse and could potentially support Aedes aegypti Linnaeus by 2080, two tropical mosquitoes of concern (Khan et al. Reference Khan, Ogden, Fazil, Gachon, Dueymes, Greer and Ng2020). Finally, mosquito-borne viruses that already occur in some regions of Canada – for example, West Nile virus (Flaviviridae) and eastern equine encephalitis virus (Togaviridae) – may spread to provinces, including Nova Scotia, where their burden potentially could increase over time (Ng et al. Reference Ng, Rees, Lindsay, Drebot, Brownstone, Sadeghieh and Khan2019). In this way, mosquito-borne diseases may represent the next zoonotic challenge for Nova Scotians.
The potential for vector-borne disease increasing with climate change requires surveillance as a proactive tool to monitor changes in mosquito abundance and richness. However, Nova Scotia currently does not employ routine surveillance of mosquitoes or their pathogens. Ogden (Reference Ogden2002) conducted the last survey of mosquitoes in Nova Scotia more than 20 years ago in response to the introduction of West Nile virus into the eastern United States of America. Ogden (Reference Ogden2002) recorded 23 species of mosquitoes in the province, 13 of which are considered competent vectors of West Nile virus, including Culex pipiens Linnaeus (Rochlin et al. Reference Rochlin, Faraji, Healy and Andreadis2019). Since that survey, Nova Scotia and the surrounding Atlantic provinces have experienced few cases of West Nile virus (Public Health Agency of Canada 2024), and surveillance of mosquitoes has lapsed. However, in 2007, provincial entomologists detected and documented the invasive species, Aedes japonicus (Theobald), outside of routine surveillance (Peach and Matthews Reference Peach and Matthews2022), by which time this species had already spread to three different Nova Scotia counties. This rapid spread illustrates the ability of invasive mosquitoes to proliferate undetected without regular surveillance.
Aside from the threat of invasive species, we can also expect changes in the abundance and community composition of the species currently established in Nova Scotia in response to changing environmental factors. The habitats of many species in the region are specific to salt marshes and wetlands (Ogden Reference Ogden2002), which have been lost or heavily disturbed by human activity as Nova Scotia’s human population has grown (Province of Nova Scotia 2024a). A warming climate may also allow for increased overwintering success, accelerated growth, and increased abundance of mosquitoes (Walsh et al. Reference Walsh, Glass, Lesser and Curriero2008; Baril et al. Reference Baril, Pilling, Mikkelsen, Sparrow, Duncan and Koloski2023). Increasing urbanisation and population growth may favour changes in the composition and abundance of mosquitoes in areas where many people live (Chaves et al. Reference Chaves, Hamer, Walker, Brown, Ruiz and Kitron2011; Lee et al. Reference Lee, Wasserman, Gan, Wilson, Rahman and Yek2020). Whether changes in mosquito community composition and abundance will impact the incidence of our most common arboviruses, such as West Nile virus, eastern equine encephalitis virus, and California Serogroup viruses (e.g., Peribunyaviridae) (Chaves et al. Reference Chaves, Hamer, Walker, Brown, Ruiz and Kitron2011; Roche et al. Reference Roche, Rohani, Dobson and Guégan2013; Ng et al. Reference Ng, Rees, Lindsay, Drebot, Brownstone, Sadeghieh and Khan2019), is unclear; however, a proactive approach to monitoring these changes will allow for preparedness within public health measures. Finally, because mosquitoes fill roles other than disease transmission within ecosystems, including pollination (Shannon et al. Reference Shannon, Richardson, Lahondère and Peach2024) and as prey (Gonsalves et al. Reference Gonsalves, Law, Webb and Monamy2013), tracking changes in their populations would help to predict potential cascading impacts within ecosystems.
To address the current and projected changes in mosquito populations, Nova Scotia requires an updated baseline of mosquito richness and abundance, as well as continued surveillance, to improve understanding of the current and future risks of mosquito-borne diseases in response to climate change. To create this baseline, we collected both mosquito adults and larvae from a range of habitats (e.g., wetlands, artificial containers, and roadside ditches) across multiple ecoregions (i.e., areas identified according to ecological land classifications, as defined by climate, elevation, and topography by the Nova Scotia government; Province of Nova Scotia 2017) and all counties in Nova Scotia from 1 May to 25 October in both 2021 and 2022 to coincide with the months that mosquitoes are active in the province (Wood et al. Reference Wood, Dang and Ellis1979; Ogden Reference Ogden2002).
Methods
Site description
We conducted this study in Nova Scotia, a province on the east coast of Canada. The province is part of Maritime Canada. It covers approximately 55 284 km2 in area, with 2342 km2 of inland water (Statistics Canada 2019).
Collection of larvae
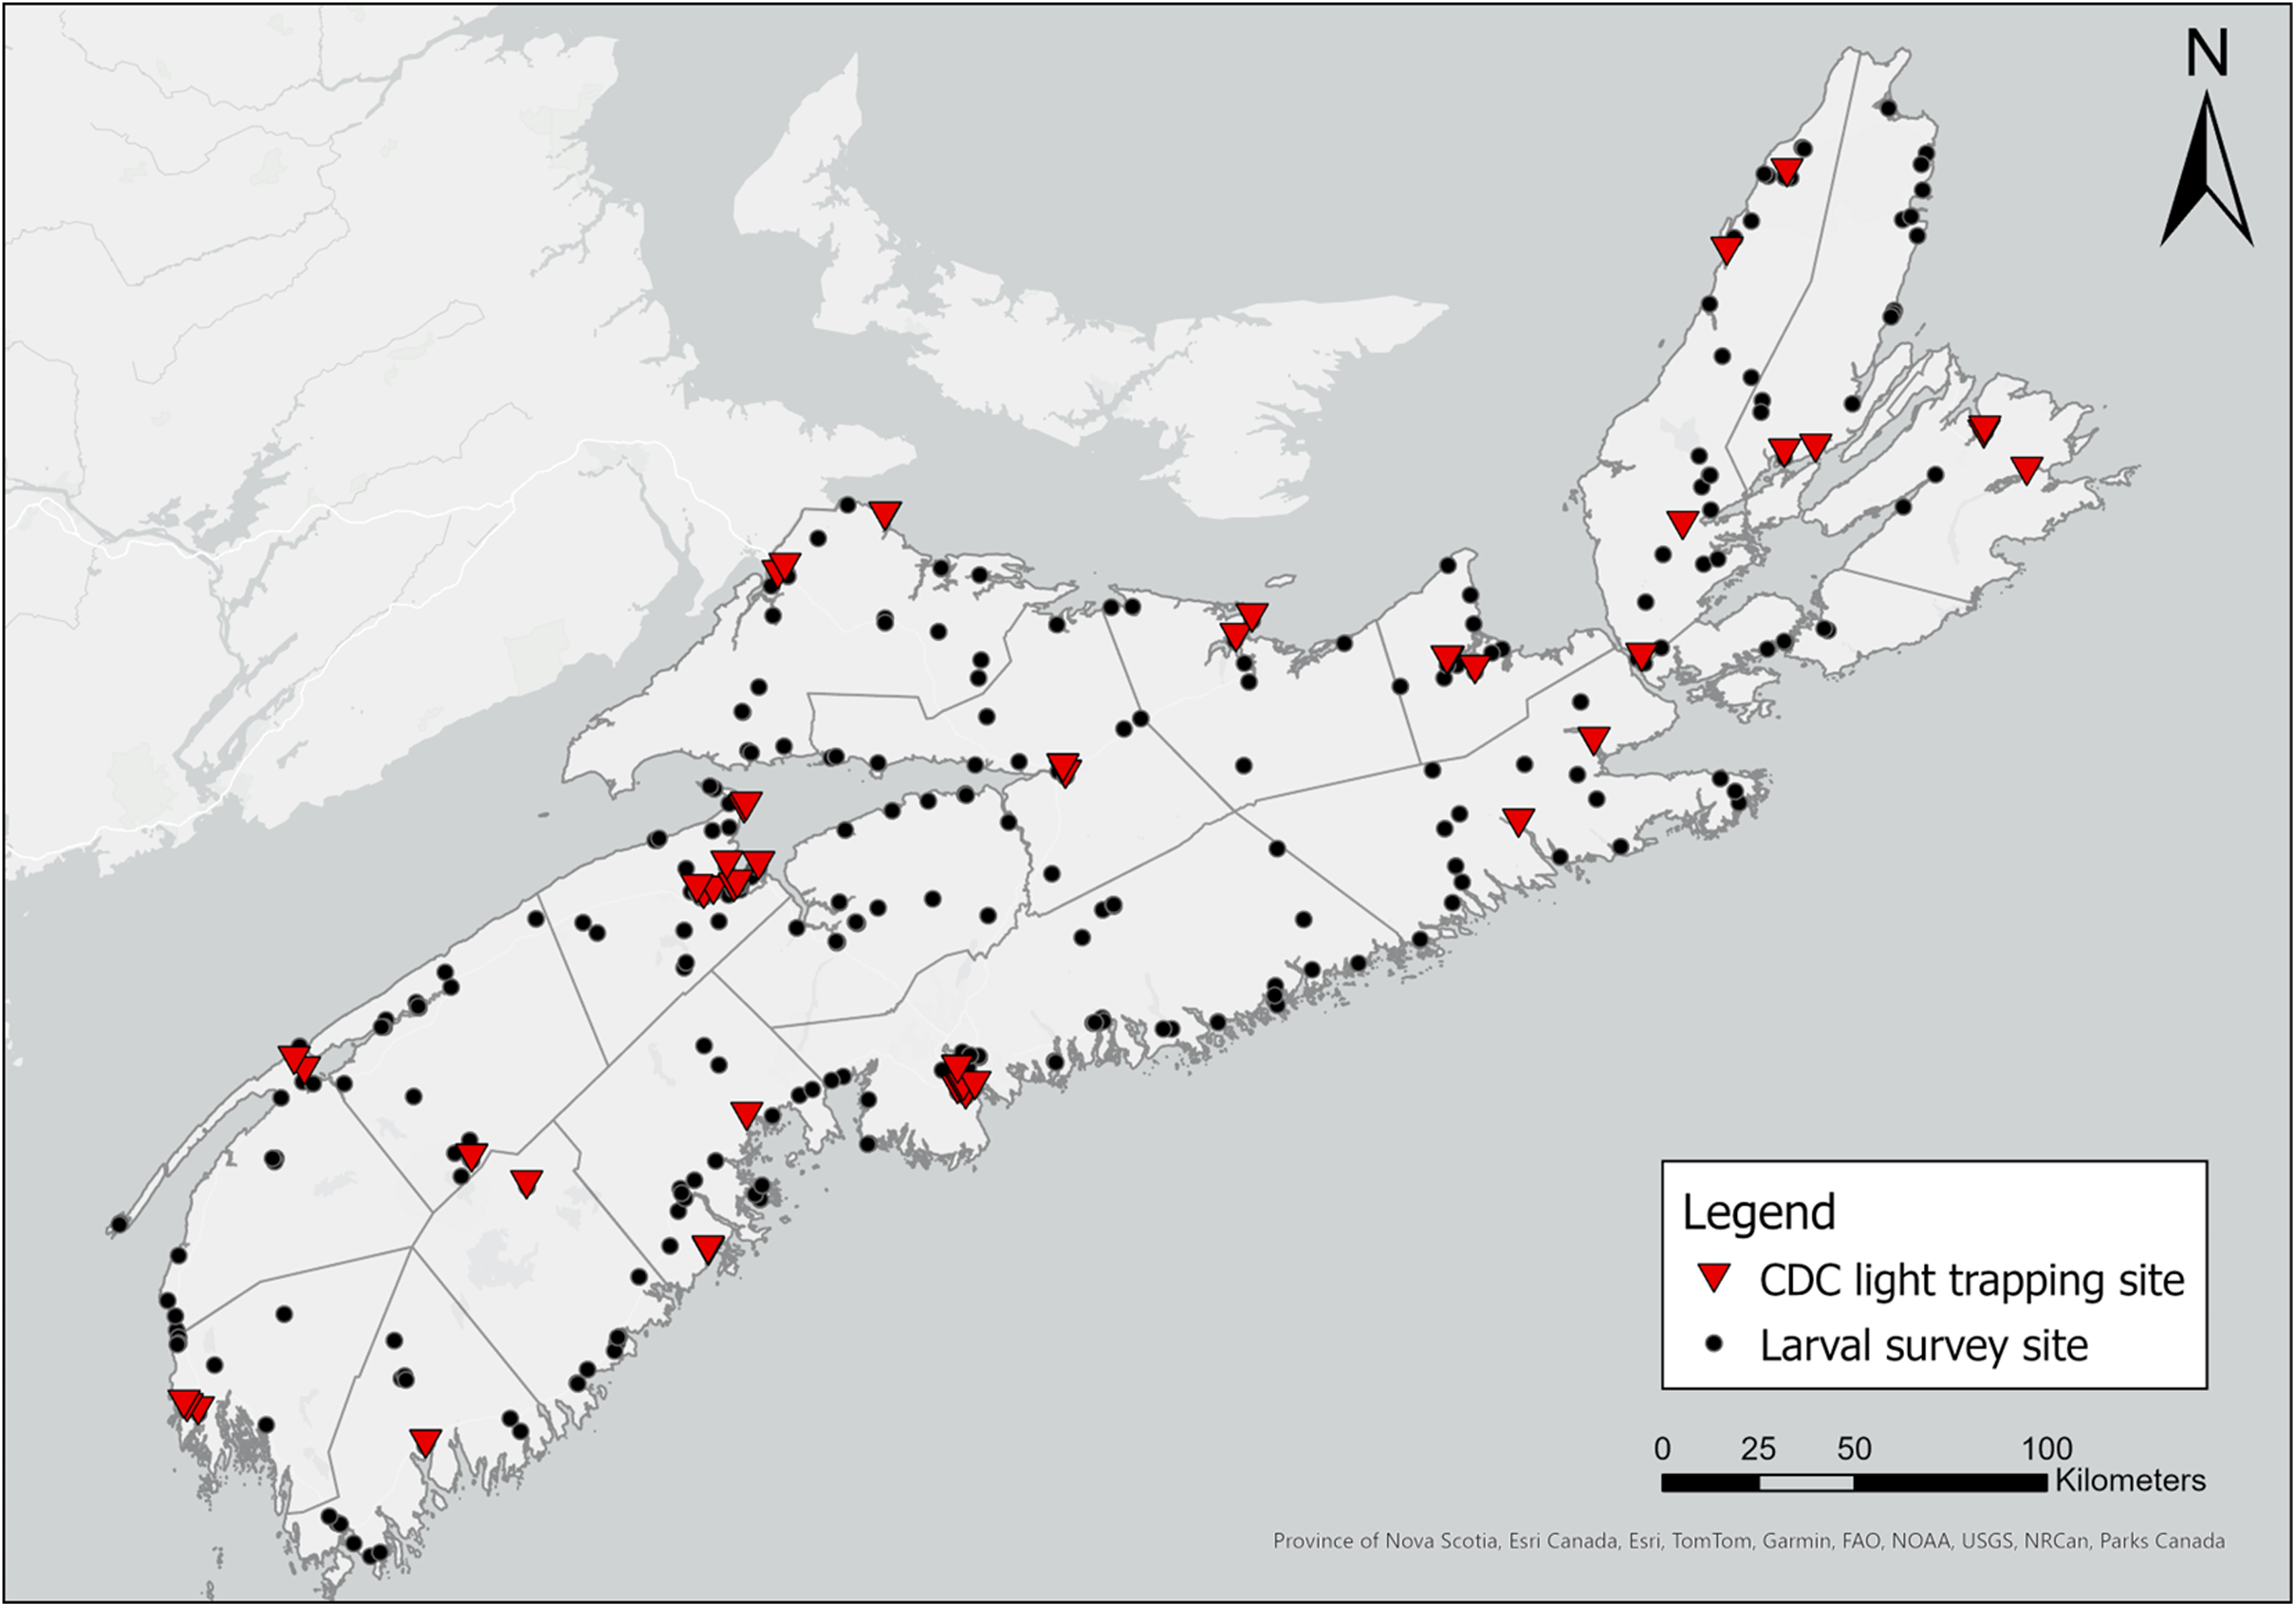
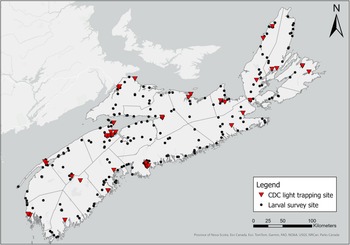
We sampled larvae at 232 water sources across Nova Scotia from 1 May to 25 October in both 2021 and 2022 in triweekly rotations of collection sites (Fig. 1). Because the COVID-19 lockdowns that began in May 2021 limited cross-county travel, we were able to collect larvae only within Kings County from 15 May 2021 to 31 May 2021.
Locations (GPS) of adult mosquito collection sites across Nova Scotia, Canada, in May–October 2021 and May–October 2022. Each dot or triangle represents one collection location: mosquito larvae were collected by larval dipping, and adult mosquitoes were collected by human landing catches at 349 sites (black dots); mosquitoes were trapped with CDC light traps at 60 sites (red triangles). The map was generated using ArcGIS®, version 10, September 2024 (Environmental Systems Research Institute 2011).
We defined each single sampling source as one continuous body of water. We used a 350-mL dipper (BioQuip Products, Inc., Rancho Dominguez, California, United States of America) to collect larvae from water, dipping once every metre for 10 m or until 10 minutes had passed (Centers for Disease Control and Prevention 2013). When collecting from artificial containers, we pooled larvae from all individual containers of the same material (e.g., tires) if they were within 10 m of one another. We transported larvae on ice in Whirl-Pak® bags (Sigma-Aldrich, Darmstadt, Germany) containing approximately 100 mL of water from the collection site to the laboratory for rearing and identification.
We reared larvae at room temperature (21–25 °C) under natural light conditions until they reached the third instar, when we could morphologically identify them to species or sort them by genus. In some cases, species were difficult to differentiate at the larval stage. Because of this, we raised all larvae to the adult stage, allowed them to mature for two days, froze the mosquitoes, and then preserved them on silica to be identified a second time (Mayagaya et al. Reference Mayagaya, Ntamatungiro, Moore, Wirtz, Dowell and Maia2015). In addition, we sampled for larvae in purple pitcher plants, Sarracenia purpurea Linnaeus (Sarraceniaceae), when possible because larvae of the native mosquito species Wyeoymia smithii Coquillett are found exclusively in the water within these carnivorous plants (Nastase et al. Reference Nastase, De La Rosa and Newell1995).
Collection of adult mosquitoes
We collected adult mosquitoes using two methods: Centers for Disease Control and Prevention (CDC) light trapping and opportunistic manual collection of mosquitoes that landed to bite (i.e., human landing catches) during surveillance (Giberson et al. Reference Giberson, Dau-Schmidt and Dobrin2007). We installed CDC light traps (BioQuip Products, Inc.) baited with CO2 at each of 60 sites across the province (Fig. 1), collecting trapped insects from each site once every three weeks from 1 June to 21 October 2021 and from 1 May to 21 October 2022, and we sampled different ecoregions and counties of the province weekly. During the 2021 field season, we were able to install CDC traps beginning only 1 June due to COVID-19 pandemic restrictions on travel and access to lab equipment. In 2022, we added an additional trap to the CDC-trap sampling sites to increase collection. To target crepuscular- and night-biting species, we installed traps 1.5 m above the ground with an attached cooler containing 1.2 kg of dry ice, a motorised fan, a 6-V battery (NP12-6; Enersys, Newark, New Jersey, United States of America), and a collection net and ran the traps nightly from 16:00 until 08:00, local time, the next morning (Sriwichai et al. Reference Sriwichai, Karl, Samung, Sumruayphol, Kiattibutr and Payakkapol2015). We also included an ultraviolet light to increase the number of mosquitoes captured in the CDC traps (Mwanga et al. Reference Mwanga, Ngowo, Mapua, Mmbando, Kaindao, Kifungo and Okumu2019). At the end of the field season, we ceased CDC light trapping when two consecutive weeks had passed without additional mosquitoes being captured.
We opportunistically collected day-biting adults (i.e., human landing catches) from around the province from 08:00 to 16:00, local time, while sampling larvae, placing these specimens in 7-mL sample vials (Grainger, Thornhill, Ontario, Canada; Giberson et al. Reference Giberson, Dau-Schmidt and Dobrin2007). We froze all adult mosquitoes on dry ice for initial preservation, transported them to the lab, and maintained the mosquitoes on dry ice for an additional 24 hours before preservation on silica at room temperature to preserve key morphological features (Mayagaya et al. Reference Mayagaya, Ntamatungiro, Moore, Wirtz, Dowell and Maia2015).
Morphological identification
We identified mosquito larvae using a stereo microscope (Amscope 7X-45X Stereo Binocular Microscope; Amscope, Irvine, California, United States of America) according to Wood et al.’s (Reference Wood, Dang and Ellis1979) and Andreadis et al.’s (Reference Andreadis, Thomas and Shepard2005) keys. To identify preserved adults and to determine our taxon concepts and taxonomic classifications, we used Wood et al.’s (Reference Wood, Dang and Ellis1979) and Thielman and Hunter’s (Reference Thielman and Hunter2007) keys. We pinned and pointed one specimen from each species to be corroborated by B. Sinclair through submission to the National Identification Service (Agriculture and Agri-Food Canada, Canadian National Collection of Insects, Arachnids and Nematodes, Ottawa, Ontario, Canada) using Wood et al.’s (Reference Wood, Dang and Ellis1979) and Thielman and Hunter’s (Reference Thielman and Hunter2007) keys. The Canadian National Collection of Insects, Arachnids, and Nematodes retained our voucher specimens.
Diversity and seasonal abundance analysis
To assess the variables that may impact the distribution and range of mosquito species in Nova Scotia, we calculated species richness and the Shannon–Weiner diversity index for habitat classifications, ecoregions (areas of different climate), and county. To assess sampling efficiency of the three collection techniques (i.e., CDC light trapping, human landing catches, and dipping), we used a Shannon–Weiner diversity index to calculate the diversity of mosquito species collected using each method to best represent and emphasise rare species collected using these methods without overrepresenting commonly collected (or dominant) species. We calculated the Shannon–Weiner diversity index of each habitat, ecoregion, and county using vegan library, version 2.6.4, in RStudio, version 4.1.2 (R Core Team Reference Core Team2021), to describe mosquito communities throughout these regions. We performed an individual-based rarefaction analysis of each trapping method using iNEXT library, version 4.1.2, in RStudio, to determine sampling depth for each method, particularly for rare species, across ecoregions and counties because the methods had nonequal sampling effort. We also used iNEXT to generate both rarefaction and extrapolation curves for species richness between each collection method and ecoregion, and we extracted asymptotic richness (i.e., estimated richness at the plateau) for each group. To visually represent the locational presence of each species in Nova Scotia, we used ArcGIS™ (Environmental Systems Research Institute 2011) and county boundary shapefiles from the Nova Scotia Open Data Portal (Province of Nova Scotia 2023a) to plot the coordinates of each species collection site for both larvae and adults.
Results
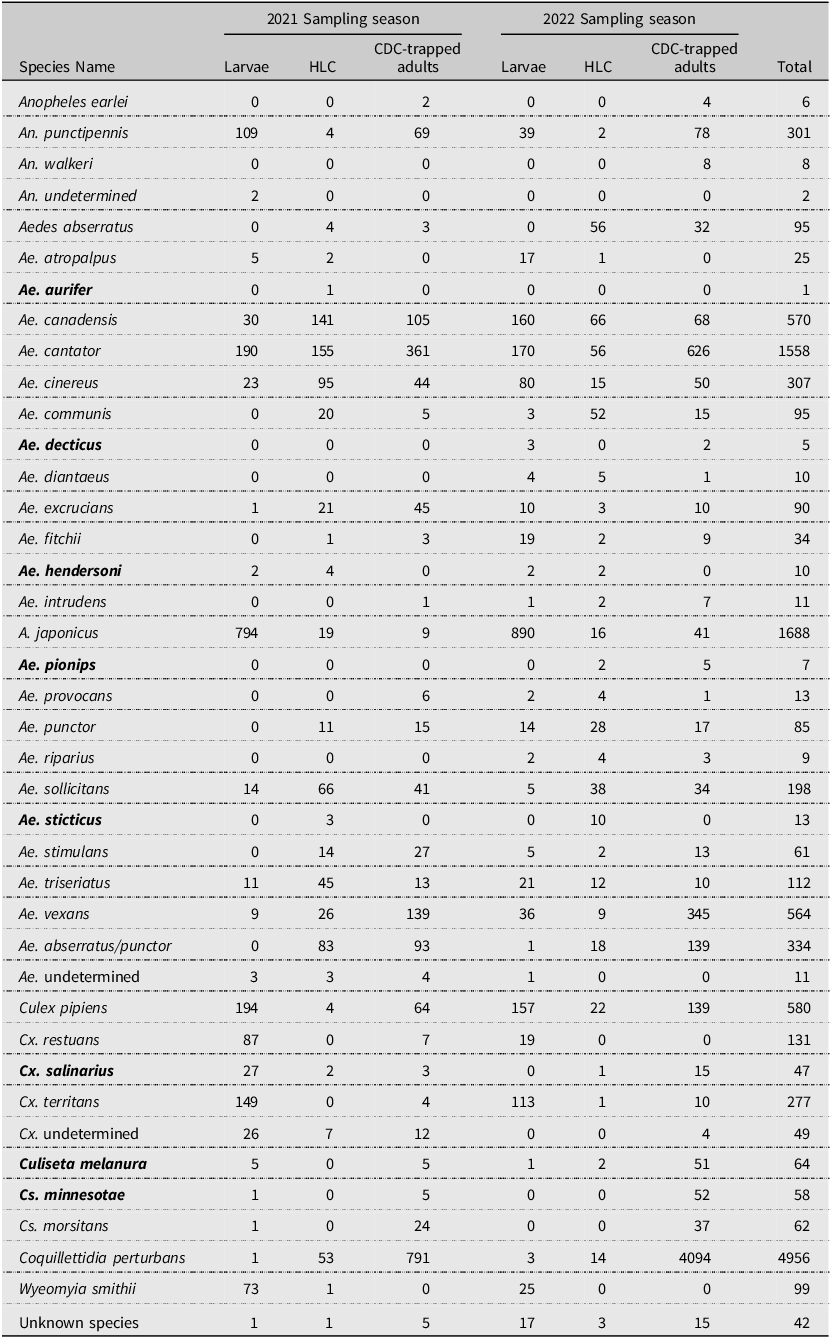
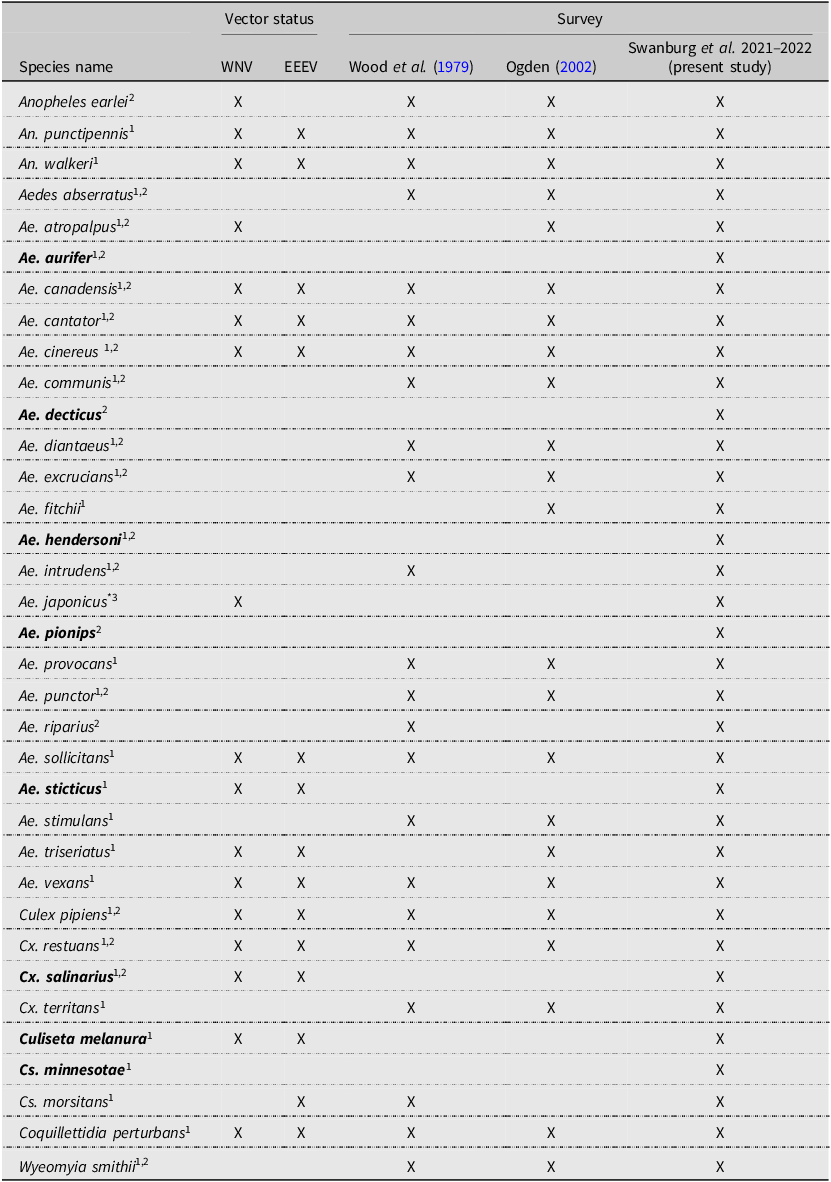
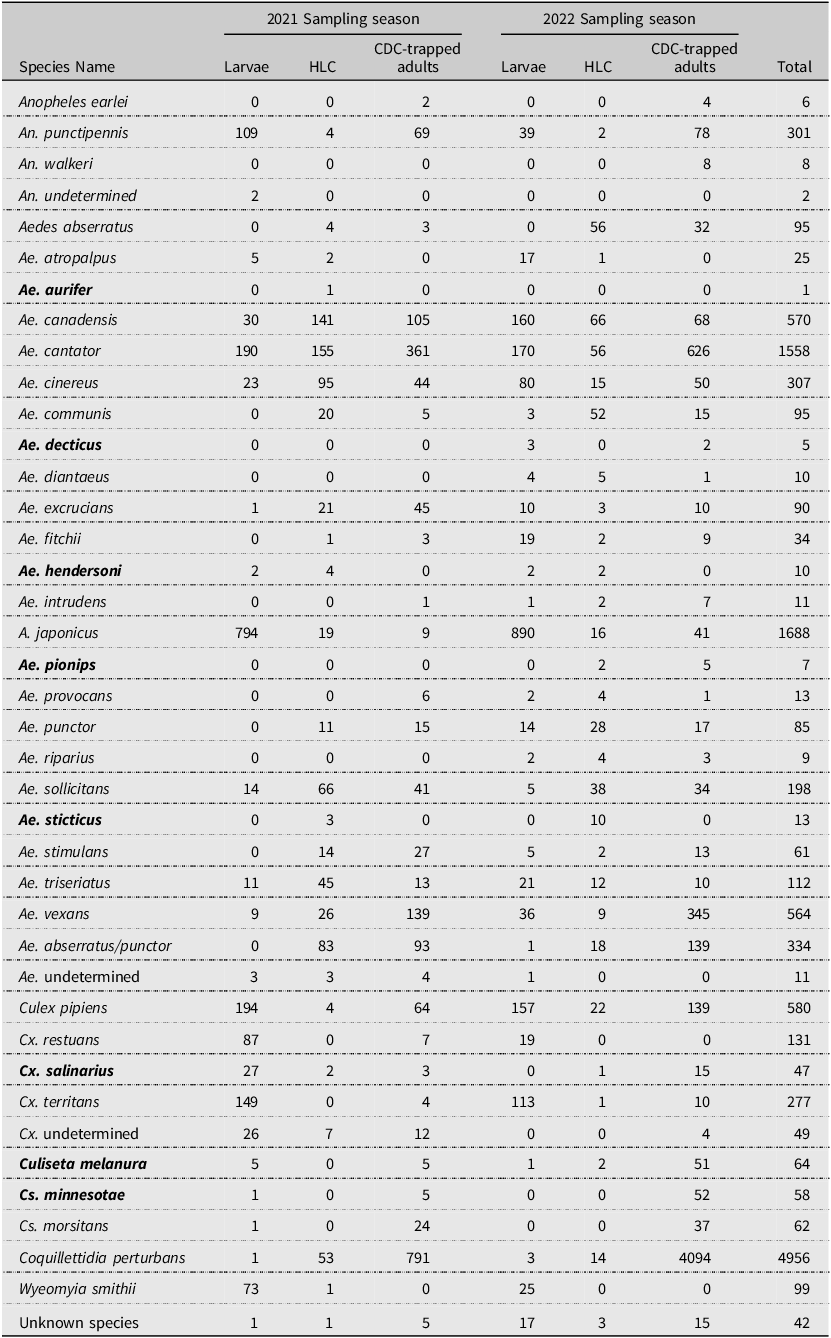
Over two years, we collected and identified 12 652 mosquitoes, including both larvae and adults, representing 35 species. We collected all 23 of the previously collected species for the province during the 2001–2002 survey and the native species Aedes intrudens Dyar that was detected in 1979 (Wood et al. Reference Wood, Dang and Ellis1979) but not in 2002 (Ogden Reference Ogden2002; Table 1). We note that this species is relatively rare in Nova Scotia, collecting only 11 individuals during our surveys. We recorded a total of eight new species detections for Nova Scotia. These are Aedes aurifer (Coquillett), Aedes decticus Howard et al., Aedes pionips Dyar, Aedes hendersoni Cockerell, Aedes sticticus (Meigen), Culiseta minnesotae Barr, Culiseta melanura (Coquillett), and Culex salinarius Coquillett (Tables 1 and 2). We also detected the expansion of Ae. japonicus into all counties of the province in both artificial containers and natural habitats. This invasive species was the most dominant species we found in collections of larvae, comprising 45% of all larvae and occupying more than 90% of the sampled container habitats. Overall, we detected increased species richness and abundance of vectors associated with the most common arboviruses in Canada.
Mosquito species identified during surveillance in Nova Scotia, Canada, according to Wood et al. Reference Wood, Dang and Ellis1979, Ogden Reference Ogden2002, and the present study (2021 and 2022). Species names in bold indicate species that were detected for the first time in Nova Scotia during the present study. Vector status refers to previously recorded instances of the virus detected in the species: WNV, West Nile virus; EEEV, eastern equine encephalitis virus.
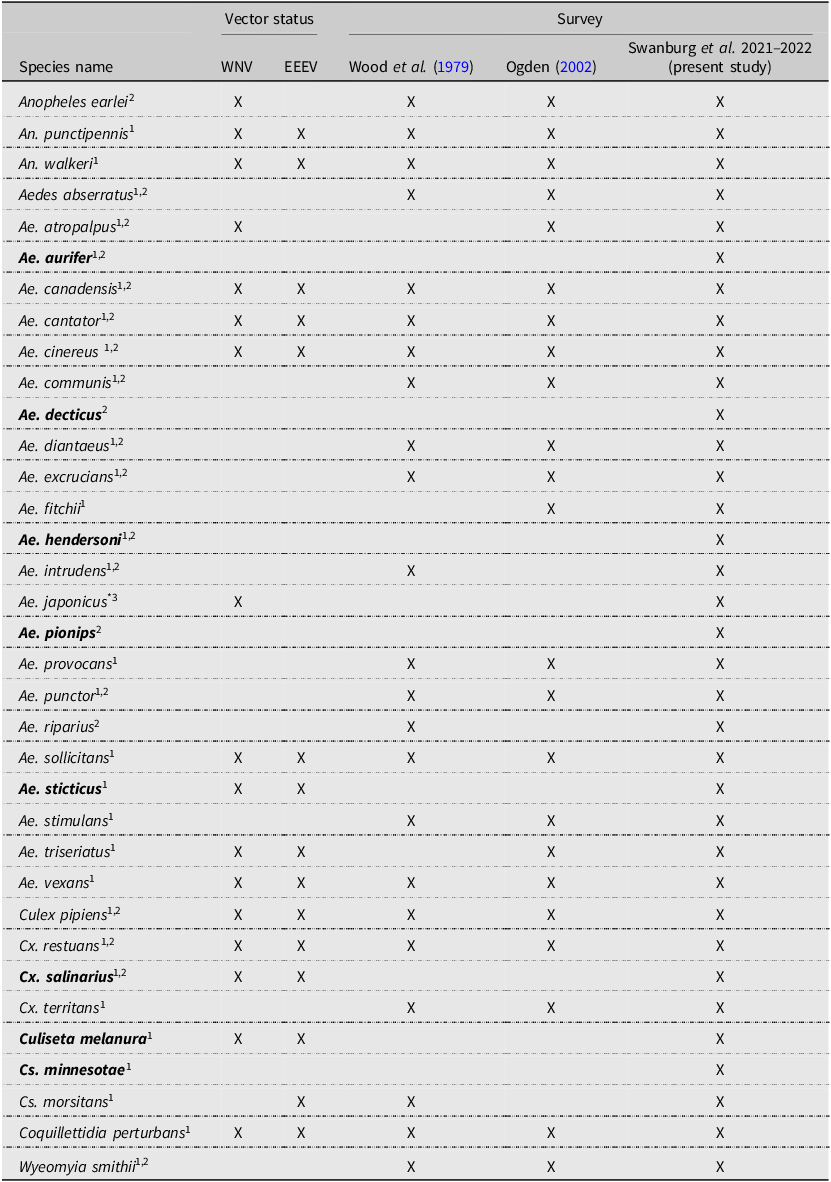
Notes: Vector status references:
1 Andreadis et al. (Reference Andreadis, Thomas and Shepard2005)
2 Webster et al. (Reference Webster, Giguère, Maltais, Roy, Gallie and Edsall2004)
3 Turell et al. (Reference Turell, O’Guinn, Dohm and Jones2001)
* Aedes japonicus was not detected in 2002 but was officially recorded in Nova Scotia before the present study (Peach and Matthews Reference Peach and Matthews2022).
Species of mosquitoes identified in 2021 and 2022 during surveillance in Nova Scotia, Canada. Species names in bold indicate species that were detected for the first time in Nova Scotia during the present study. HLC, human landing catches; CDC, Centers for Disease Control and Prevention light traps
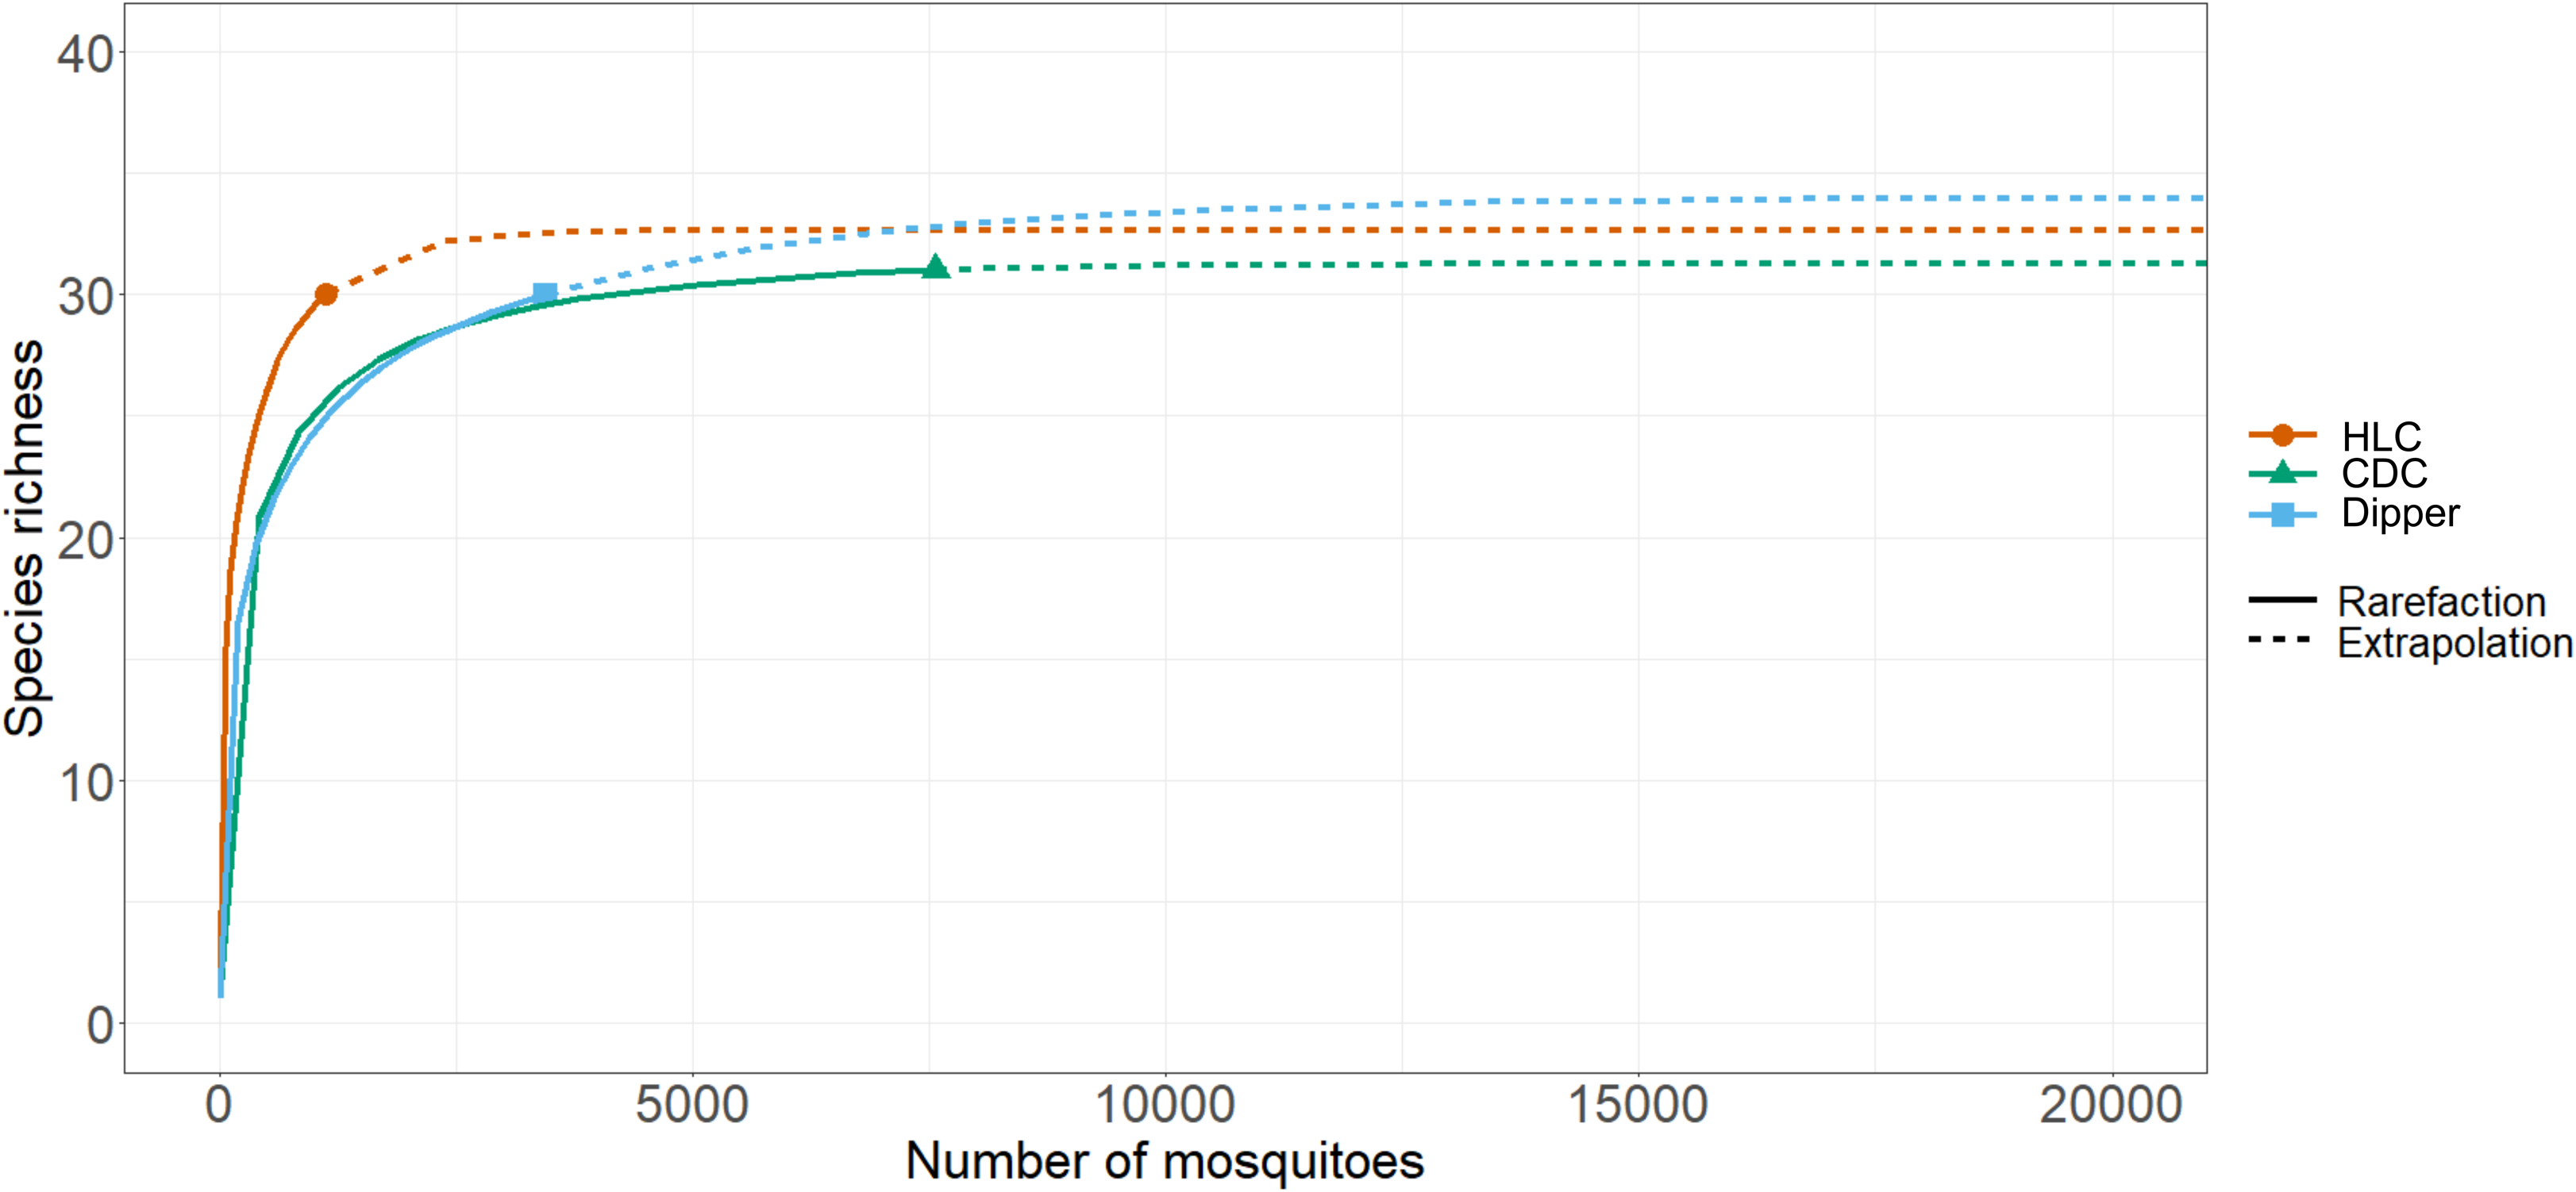
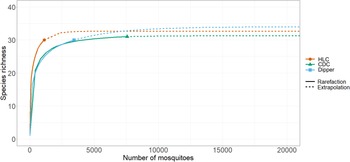
Species richness and diversity varied between our sampling methods. The CDC light traps collected the greatest species richness (31 of 35 species), but these catches were dominated by few species and had the lowest species diversity (Shannon–Weiner index 1.46). For example, three species, Coquillettidia perturbans (Walker), Aedes cantator (Coquillett), and Aedes vexans (Meigan), comprised more than 80% of all adults collected in CDC light traps over both surveillance seasons, with Cq. perturbans being the most dominant species. In comparison, human landing catches resulted in a high species richness (30 of 35 species) and provided the highest diversity (Shannon–Weiner index 2.57). Both CDC light trapping and human landing catches collected 15 of the 18 vector species known in Nova Scotia. We collected 16 known vector species by dipping for larvae (richness = 30; Shannon–Weiner index 1.97). All three methods were comparable for accurately representing species richness, given the number of individuals we collected with each method (Fig. 2). Notably, some species were collected only by one sampling method: we collected the vector species Ae. sticticus (13 individuals) and Ae. aurifer (one individual) only via human landing catches, whereas we collected Anopheles earlei Vargas (six individuals) and Anopheles walkeri Theobald (eight individuals) only with CDC light trapping.
Rarefaction curves of mosquito collection methods. The chart shows the rarified richness of mosquitoes collected according to collection method employed in Nova Scotia in May–October 2021 and May–October 2022. The plateaued extrapolations indicate the sampling effort needed by each method to accurately survey species richness and that the sampling effort was sufficient. Colours represent collection methods: orange – HLC, human landing catches; green – CDC, light trapping with CDC traps; and blue – dipper, larval dipping.
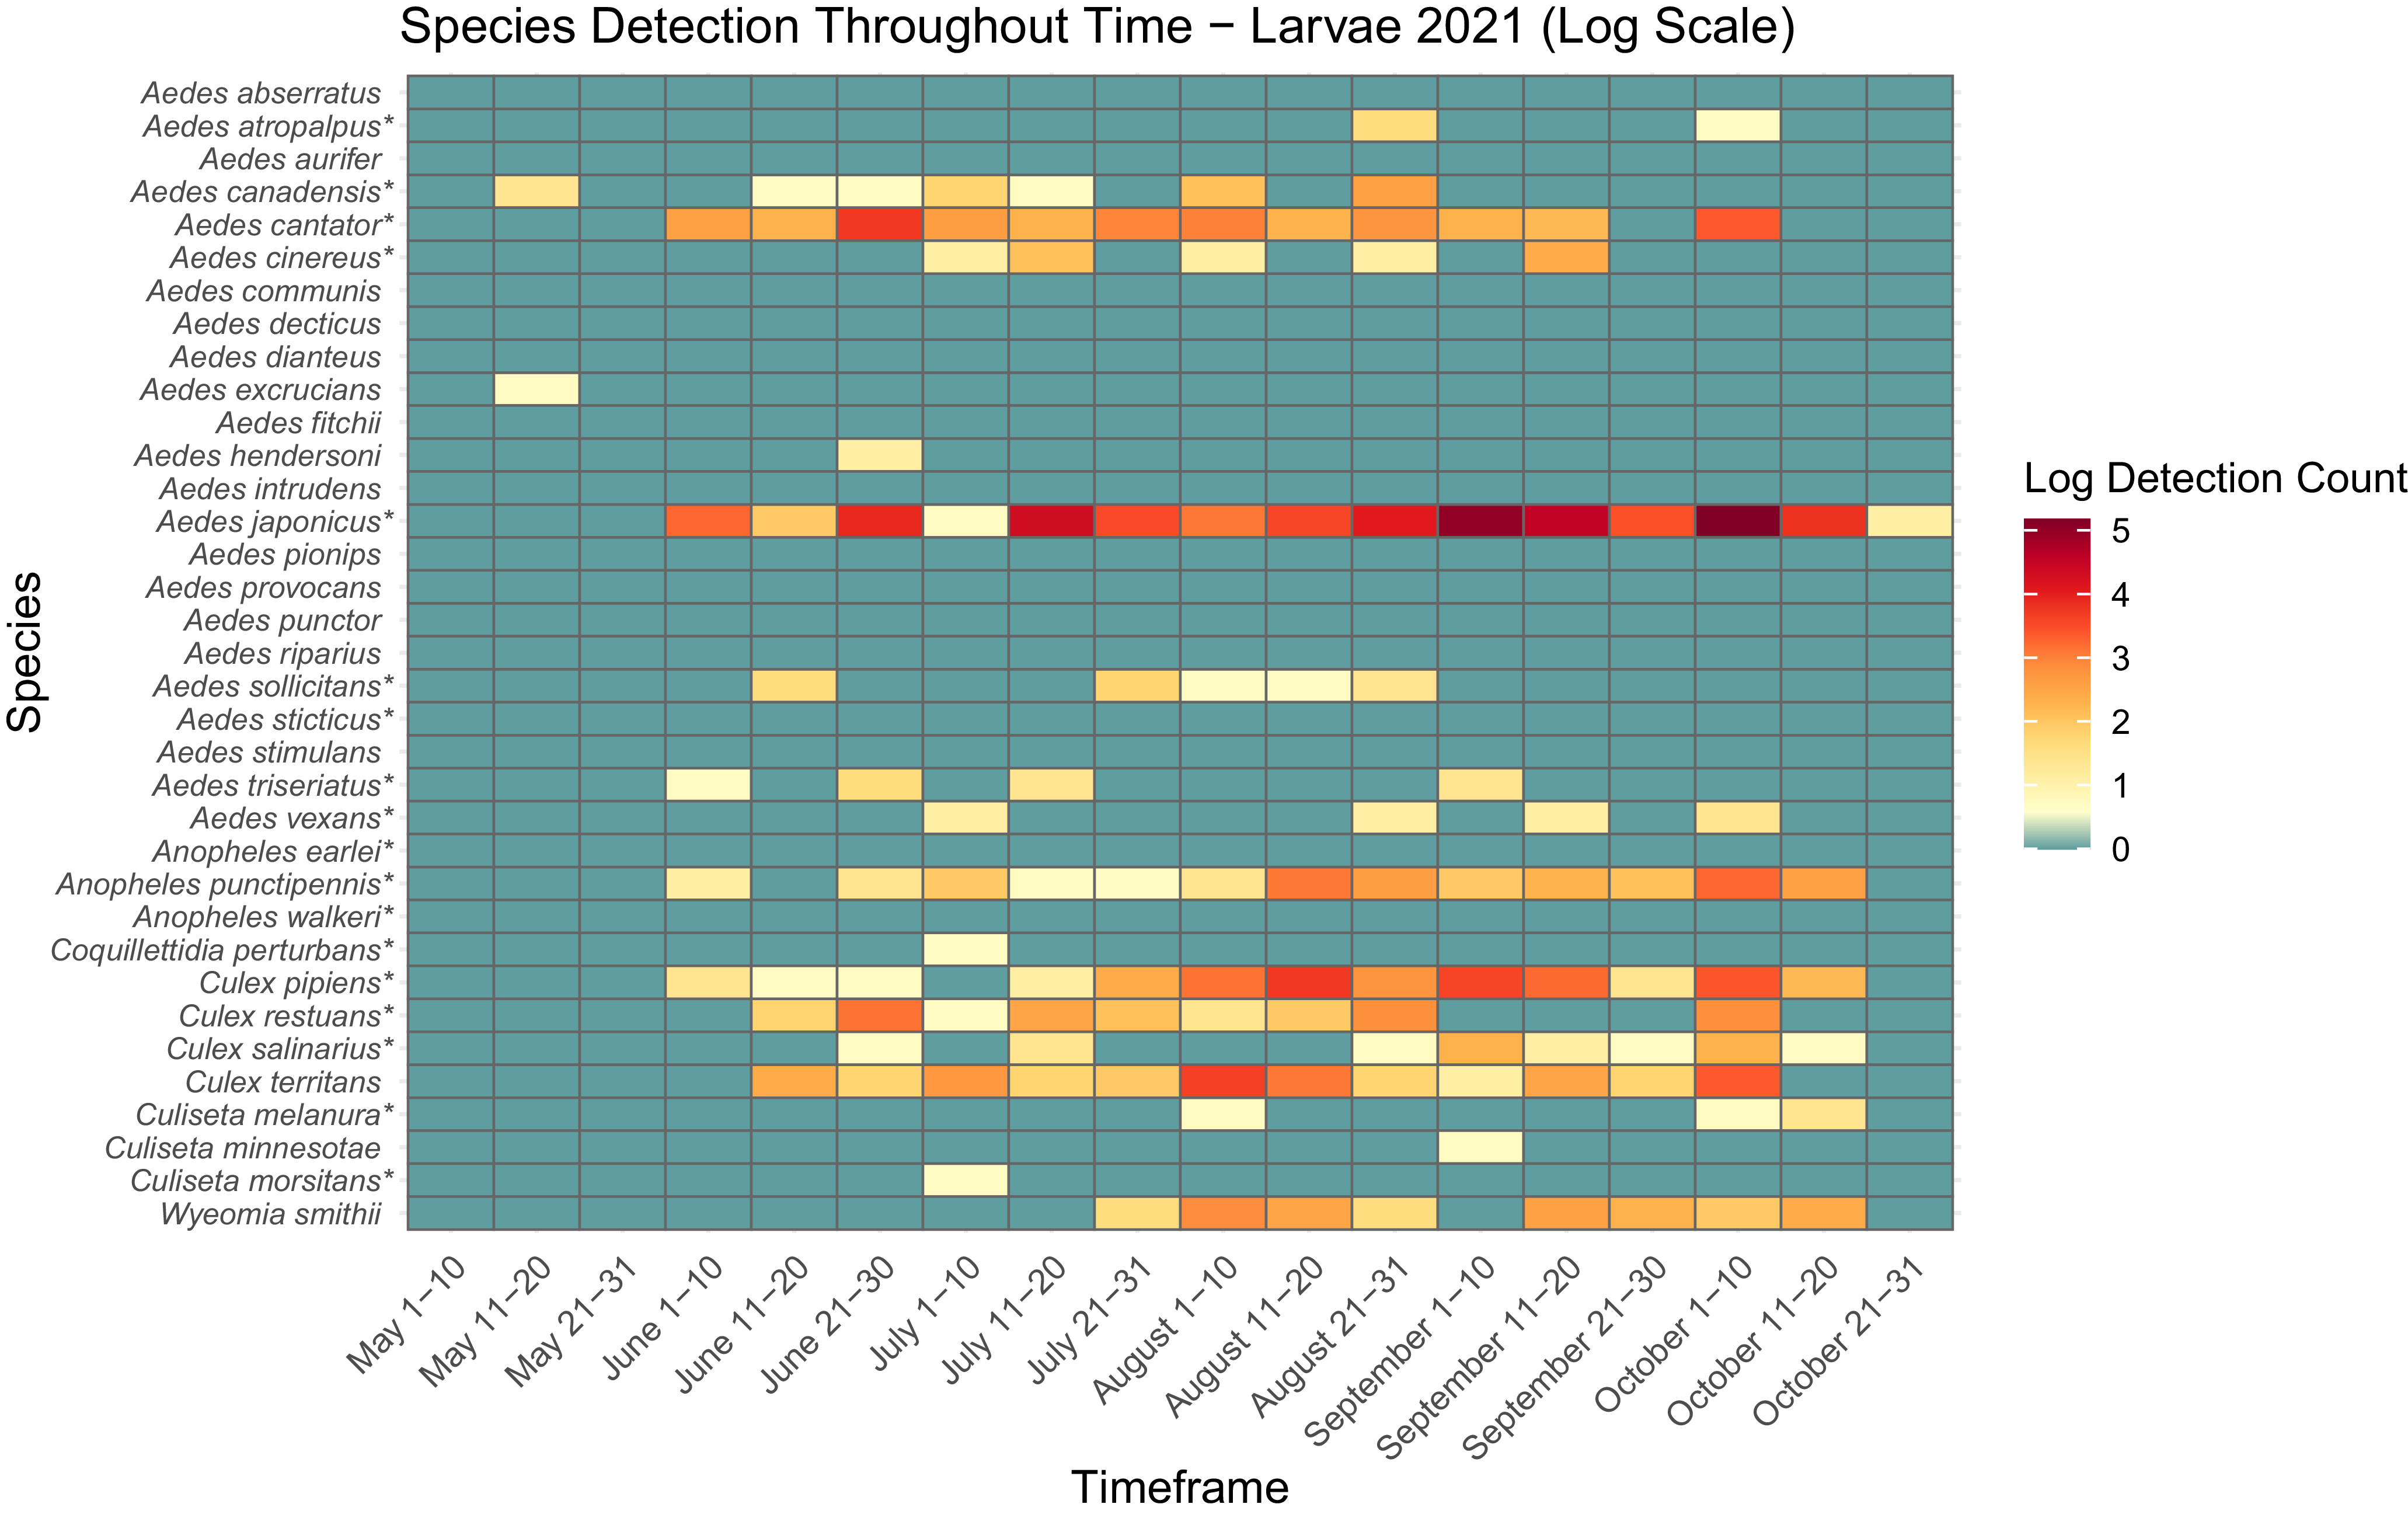
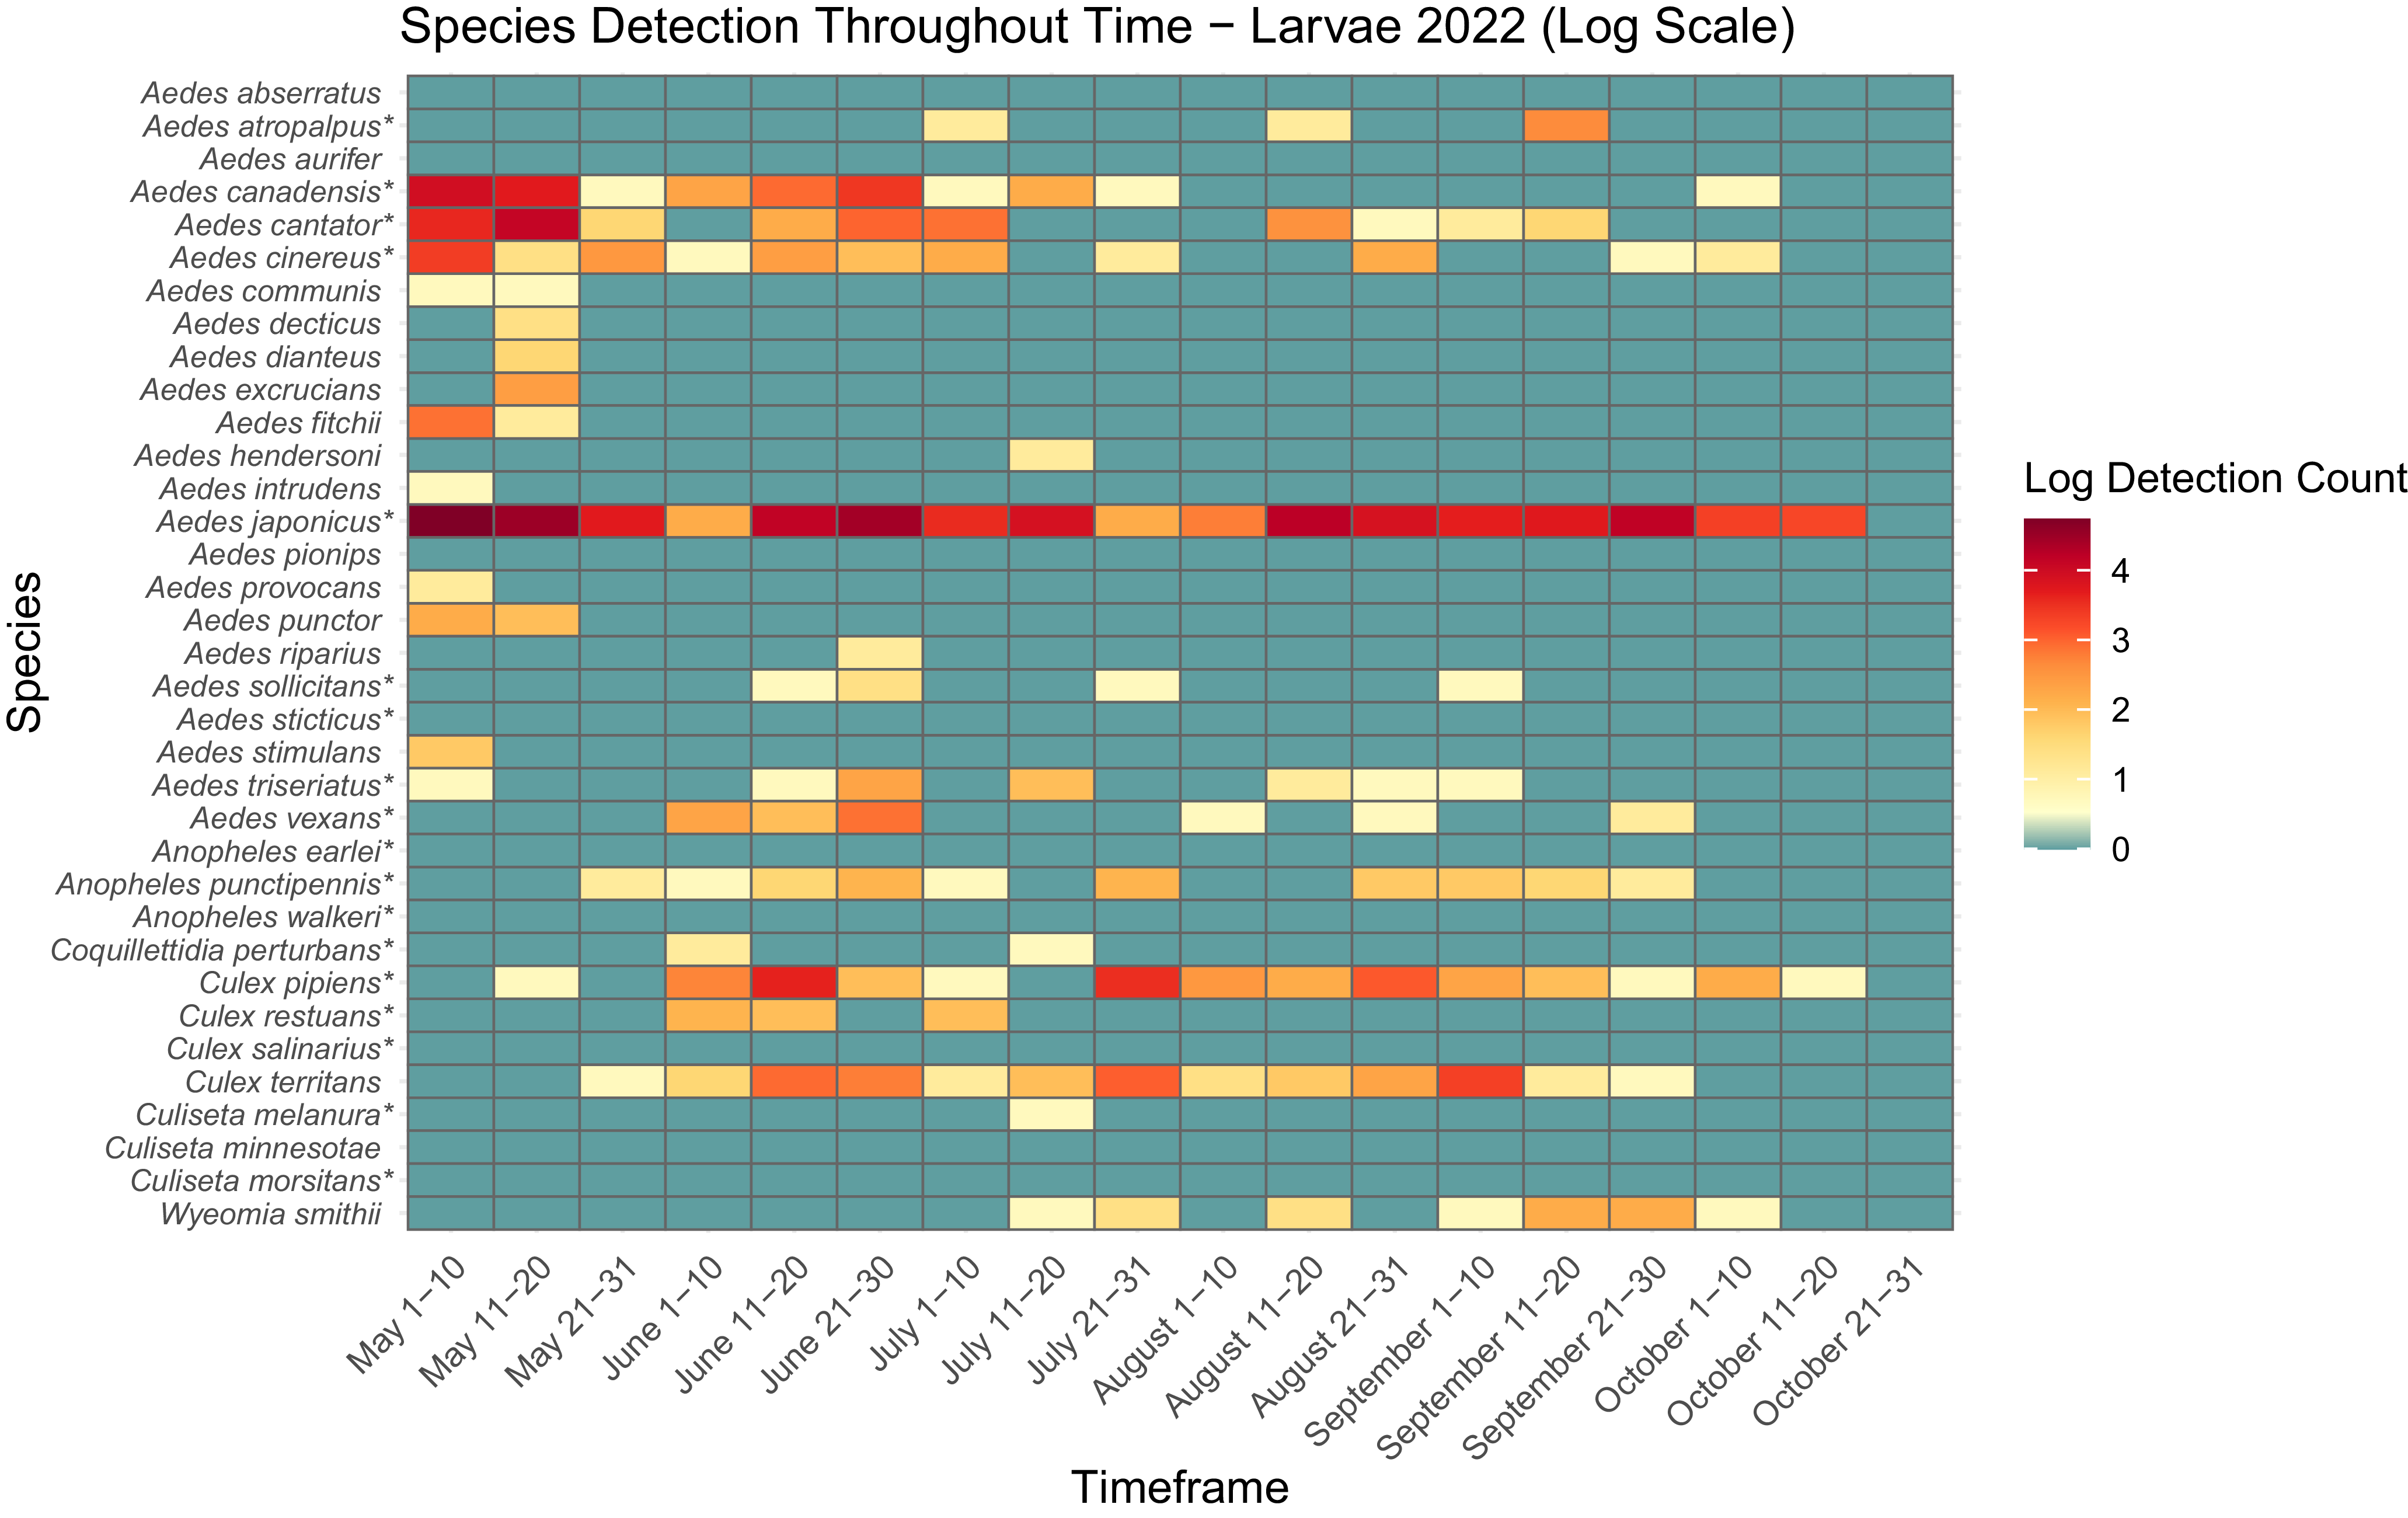
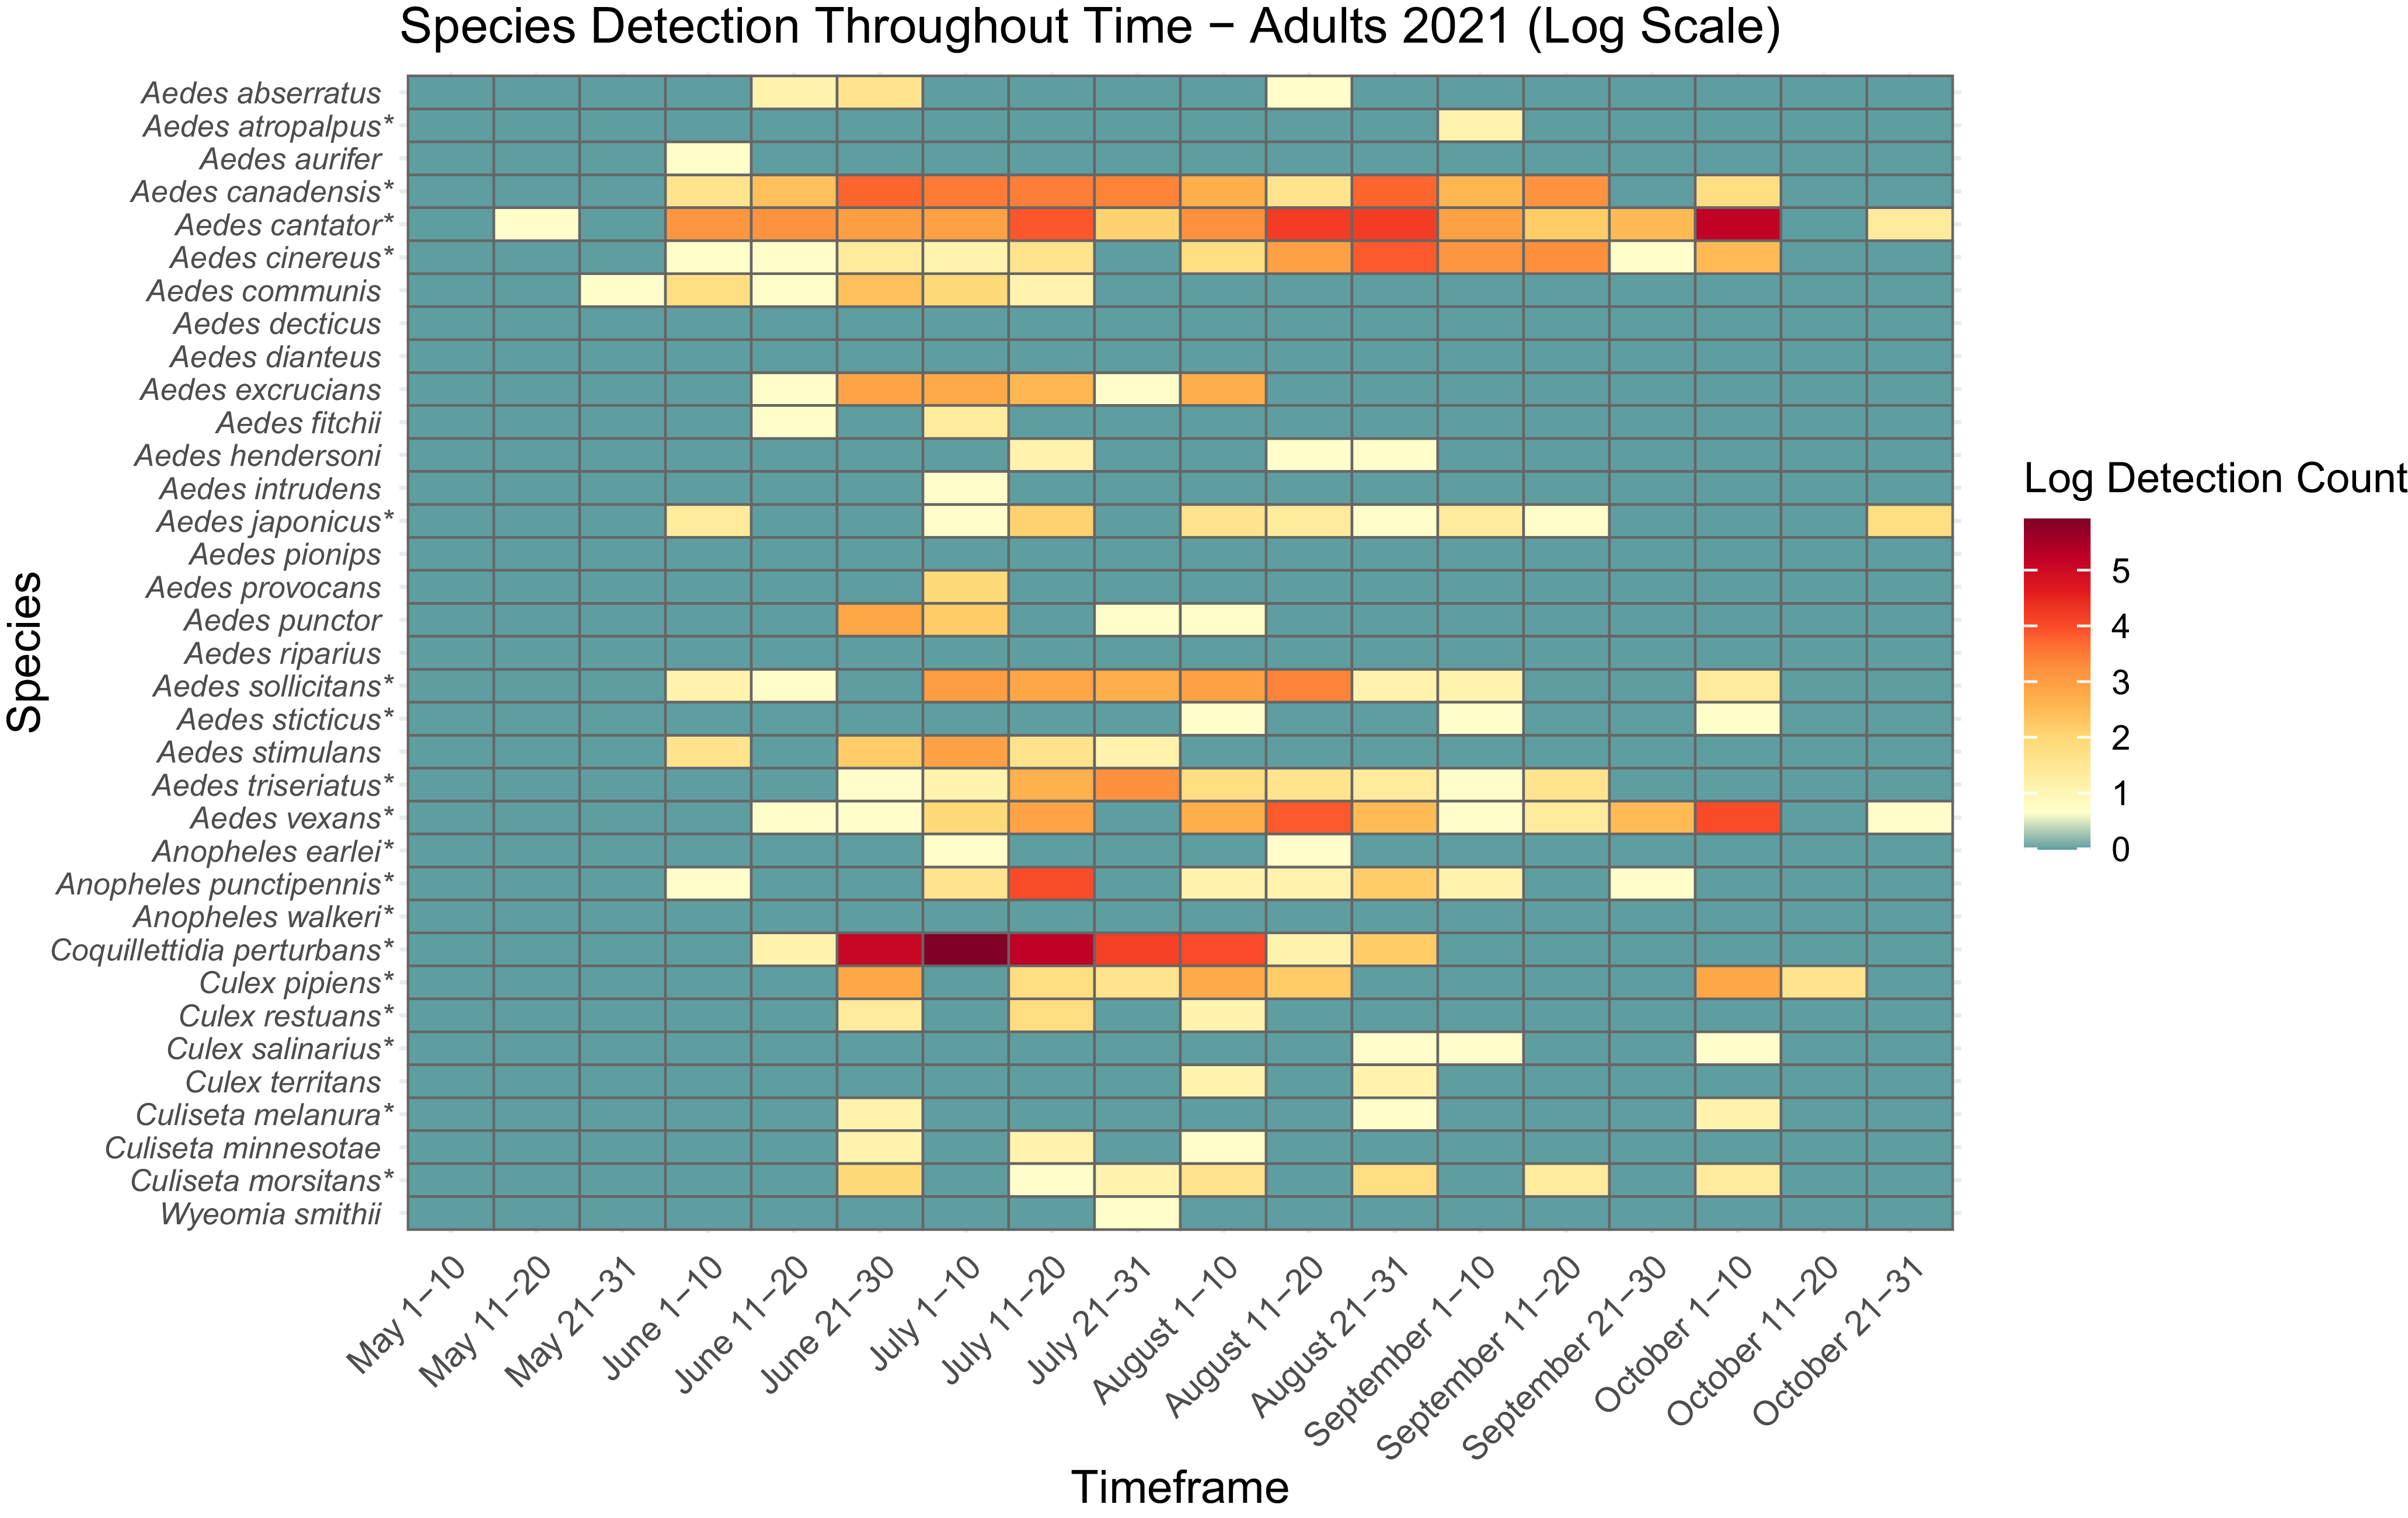
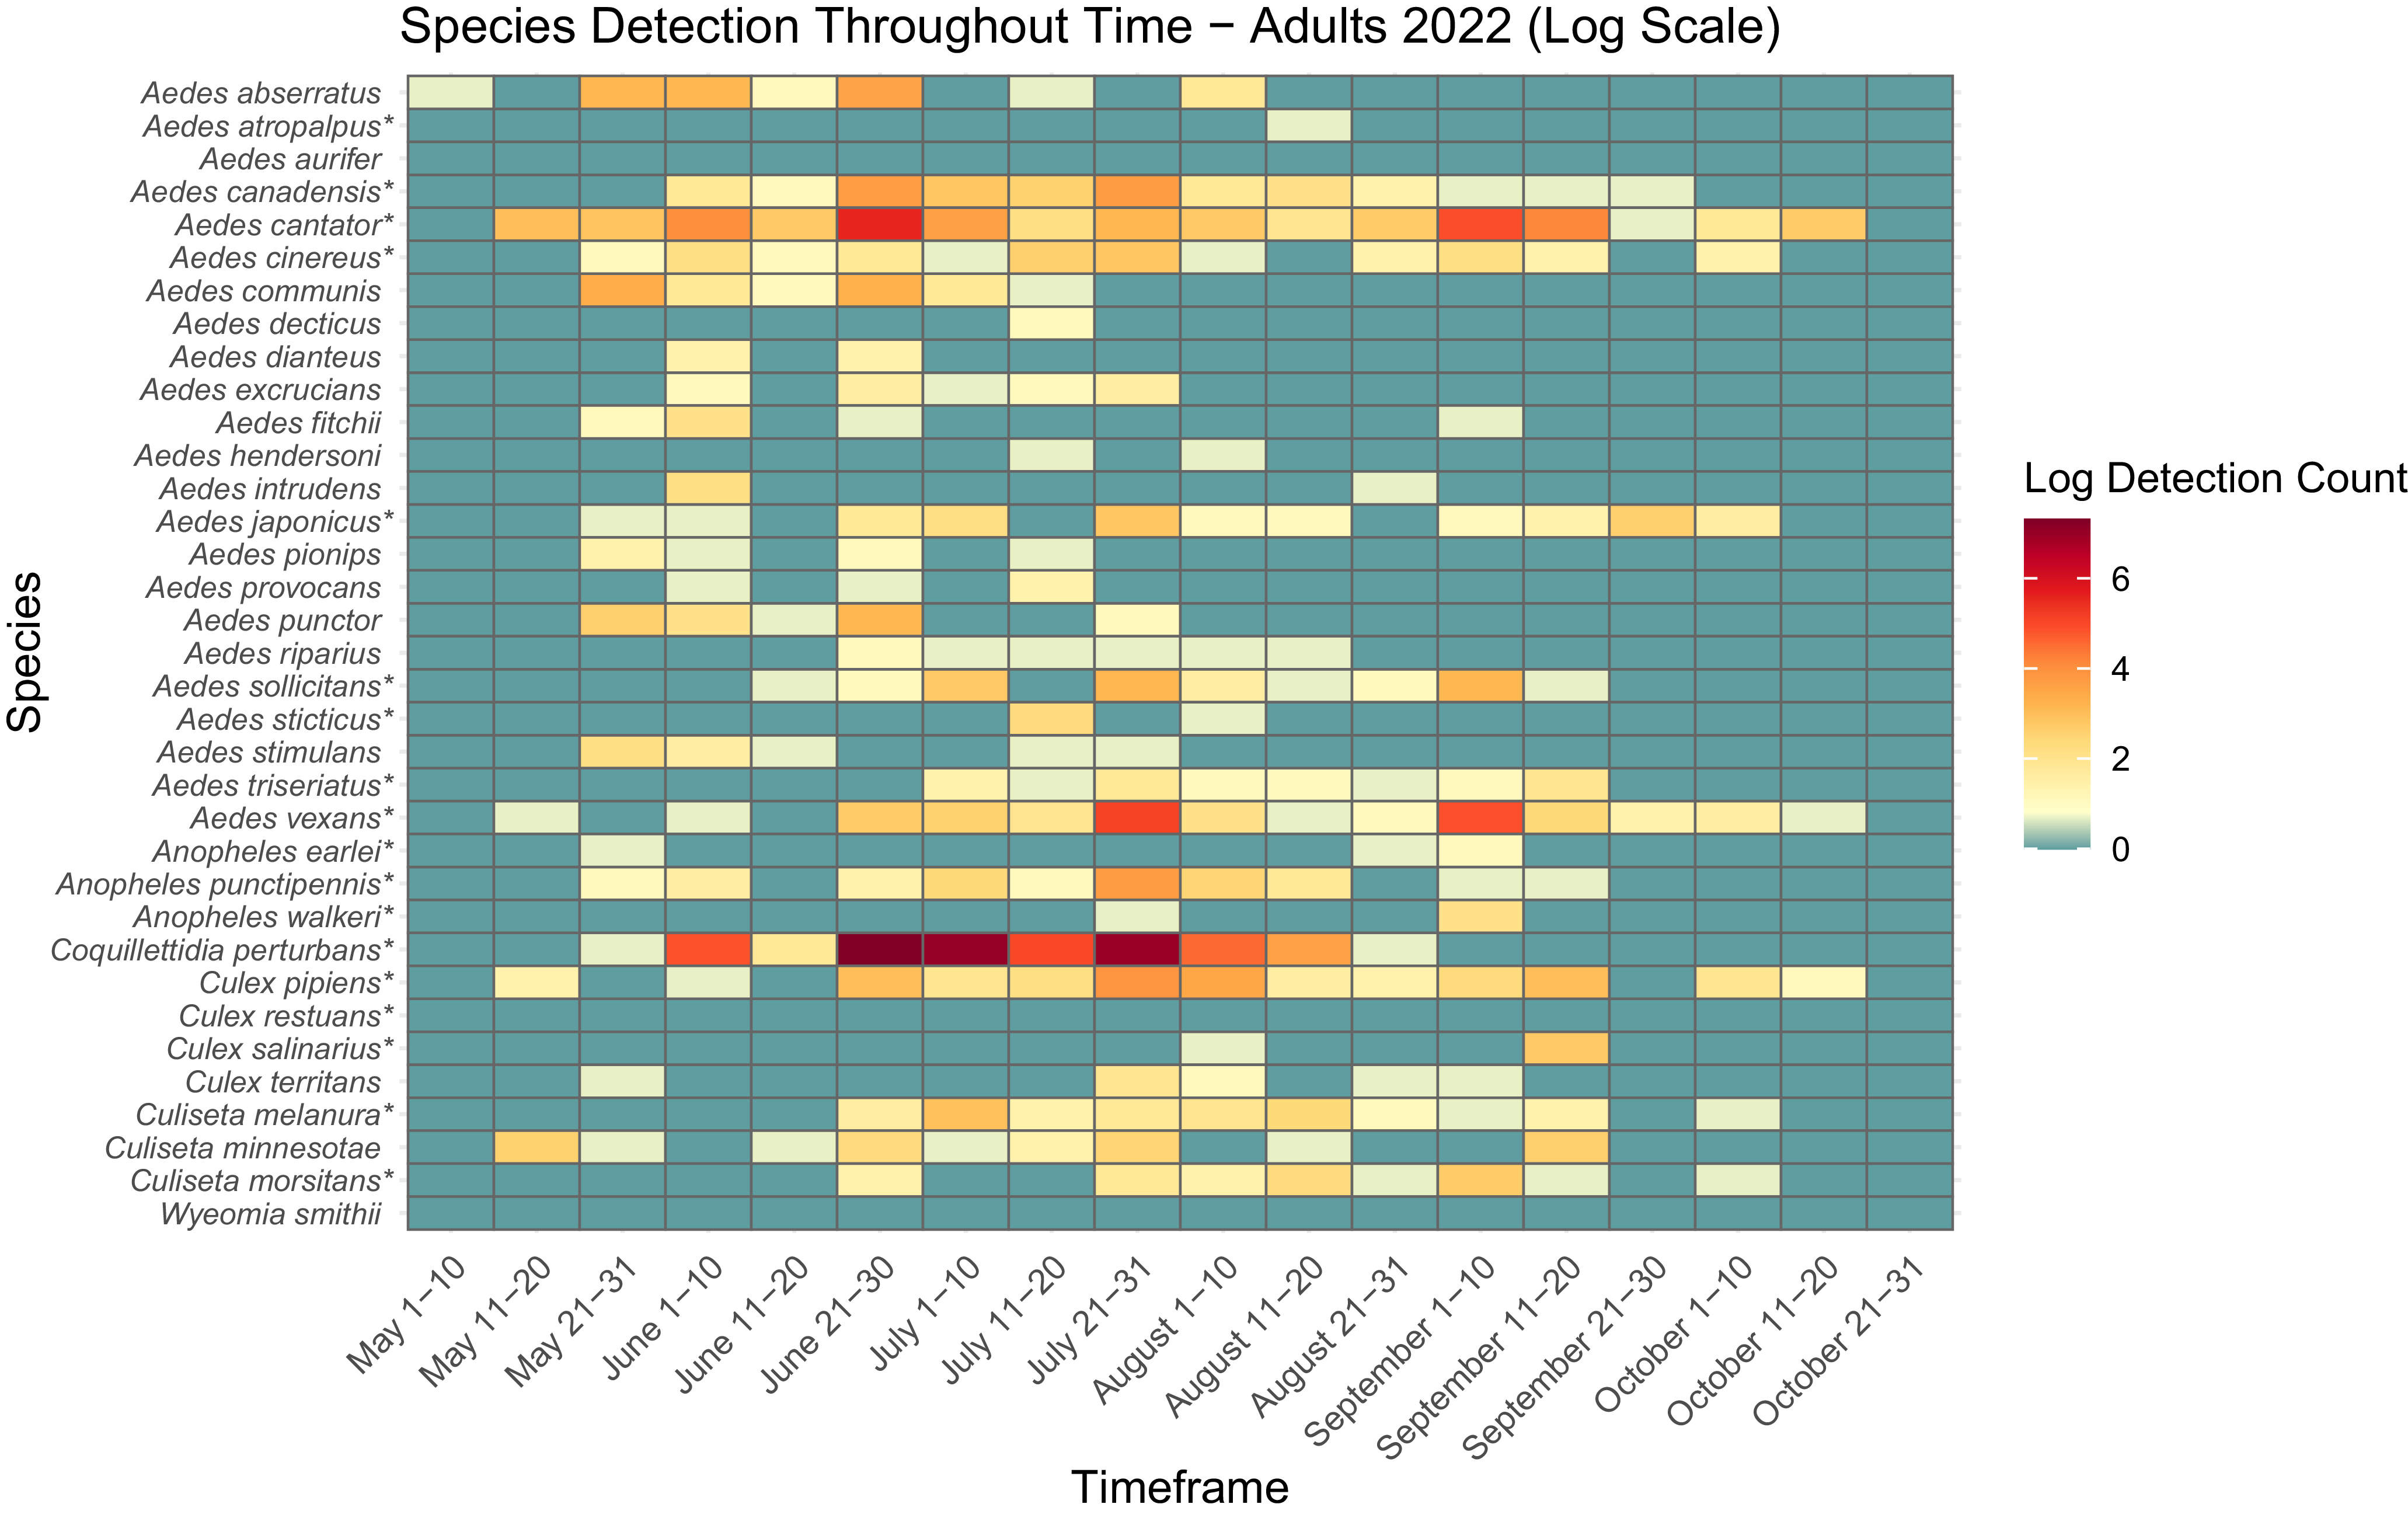
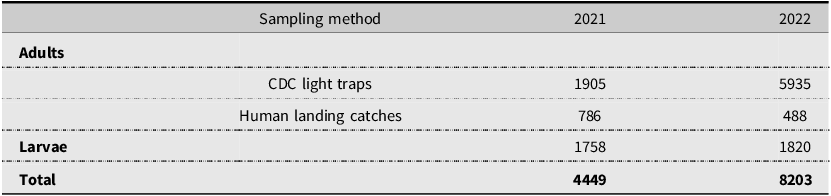
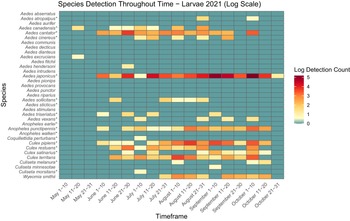
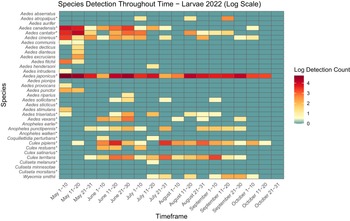
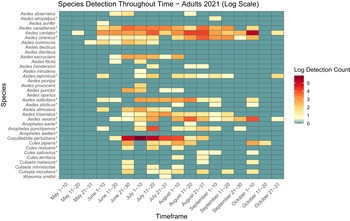
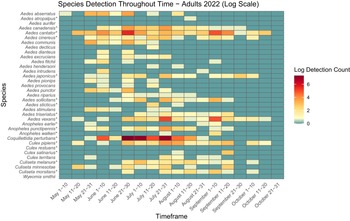
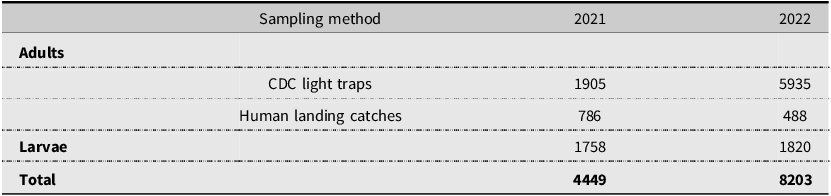
The presence and abundance of larvae and adults of each species varied across the collection season (Figs. 3, 4, 5, and 6). Furthermore, twice as many mosquitoes were collected in 2022 than in 2021, including almost three times as many adults (Table 3): 27.9 mosquitoes were collected per trapping event in 2021 and 71.5 mosquitoes were collected per trapping event in 2022. It should be noted that periods of no detections may represent a lack of sampling and should not be considered as confirmed temporal absence of a species.
Heatmap showing larval mosquito abundance and seasonal prevalence in Nova Scotia by 2021 sampling period. Larval abundances collected by larval dipping in May–October 2021 have been log-transformed. Asterisks indicate species that are capable vectors of West Nile virus or eastern equine encephalitis virus, per Turell et al. (Reference Turell, O’Guinn, Dohm and Jones2001), Webster et al. (Reference Webster, Giguère, Maltais, Roy, Gallie and Edsall2004), and Andreadis et al. (Reference Andreadis, Thomas and Shepard2005). Blue indicates detections of zero (0) larvae. Abundances per sampling period ranged from 0 to 176 larvae. We visited collection sites on a three-week-rotation basis; abundance therefore may vary, depending on the selectivity of some species to individual collection sites.
Heatmap showing larval mosquito abundance and seasonal prevalence in Nova Scotia by 2022 sampling period. Larval abundances collected by larval dipping in May–October 2022 have been log-transformed. Asterisks indicate species that are capable vectors of West Nile virus or eastern equine encephalitis virus, per Turell et al. (Reference Turell, O’Guinn, Dohm and Jones2001), Webster et al. (Reference Webster, Giguère, Maltais, Roy, Gallie and Edsall2004), and Andreadis et al. (Reference Andreadis, Thomas and Shepard2005). Blue indicates detections of zero (0) larvae. Abundances per sampling period ranged from 0 to 113 larvae. We visited collection sites on a three-week-rotation basis; abundance therefore may vary, depending on the selectivity of some species to individual collection sites.
Heatmap showing adult mosquito abundance and seasonal prevalence in Nova Scotia by 2021 sampling period. Adult abundances collected by both CDC light traps and human landing catches in May–October 2021 have been log-transformed. Asterisks indicate species that are capable vectors of West Nile virus or eastern equine encephalitis virus, per Turell et al. (Reference Turell, O’Guinn, Dohm and Jones2001), Webster et al. (Reference Webster, Giguère, Maltais, Roy, Gallie and Edsall2004), and Andreadis et al. (Reference Andreadis, Thomas and Shepard2005). Blue indicates detections of zero (0) adults. Abundances per sampling period ranged from 0 to 370 adults. We visited collection sites on a three-week-rotation basis; abundance therefore may vary, depending on the selectivity of some species to individual collection sites.
Heatmap showing adult mosquito abundance and seasonal prevalence in Nova Scotia by 2022 sampling period. Adult abundances collected by both CDC light traps and human landing catches in May–October 2022 have been log-transformed. Asterisks indicate species that are capable vectors of West Nile virus or eastern equine encephalitis virus, per Turell et al. (Reference Turell, O’Guinn, Dohm and Jones2001), Webster et al. (Reference Webster, Giguère, Maltais, Roy, Gallie and Edsall2004), and Andreadis et al. (Reference Andreadis, Thomas and Shepard2005). Blue indicates detections of zero (0) adults. Abundances per sampling period ranged from 0 to 1501 adults. We visited collection sites on a three-week rotation; abundance therefore may vary, depending on the selectivity of some species to individual collection sites.
Total number of mosquitoes collected per year using methods to trap adults and larvae
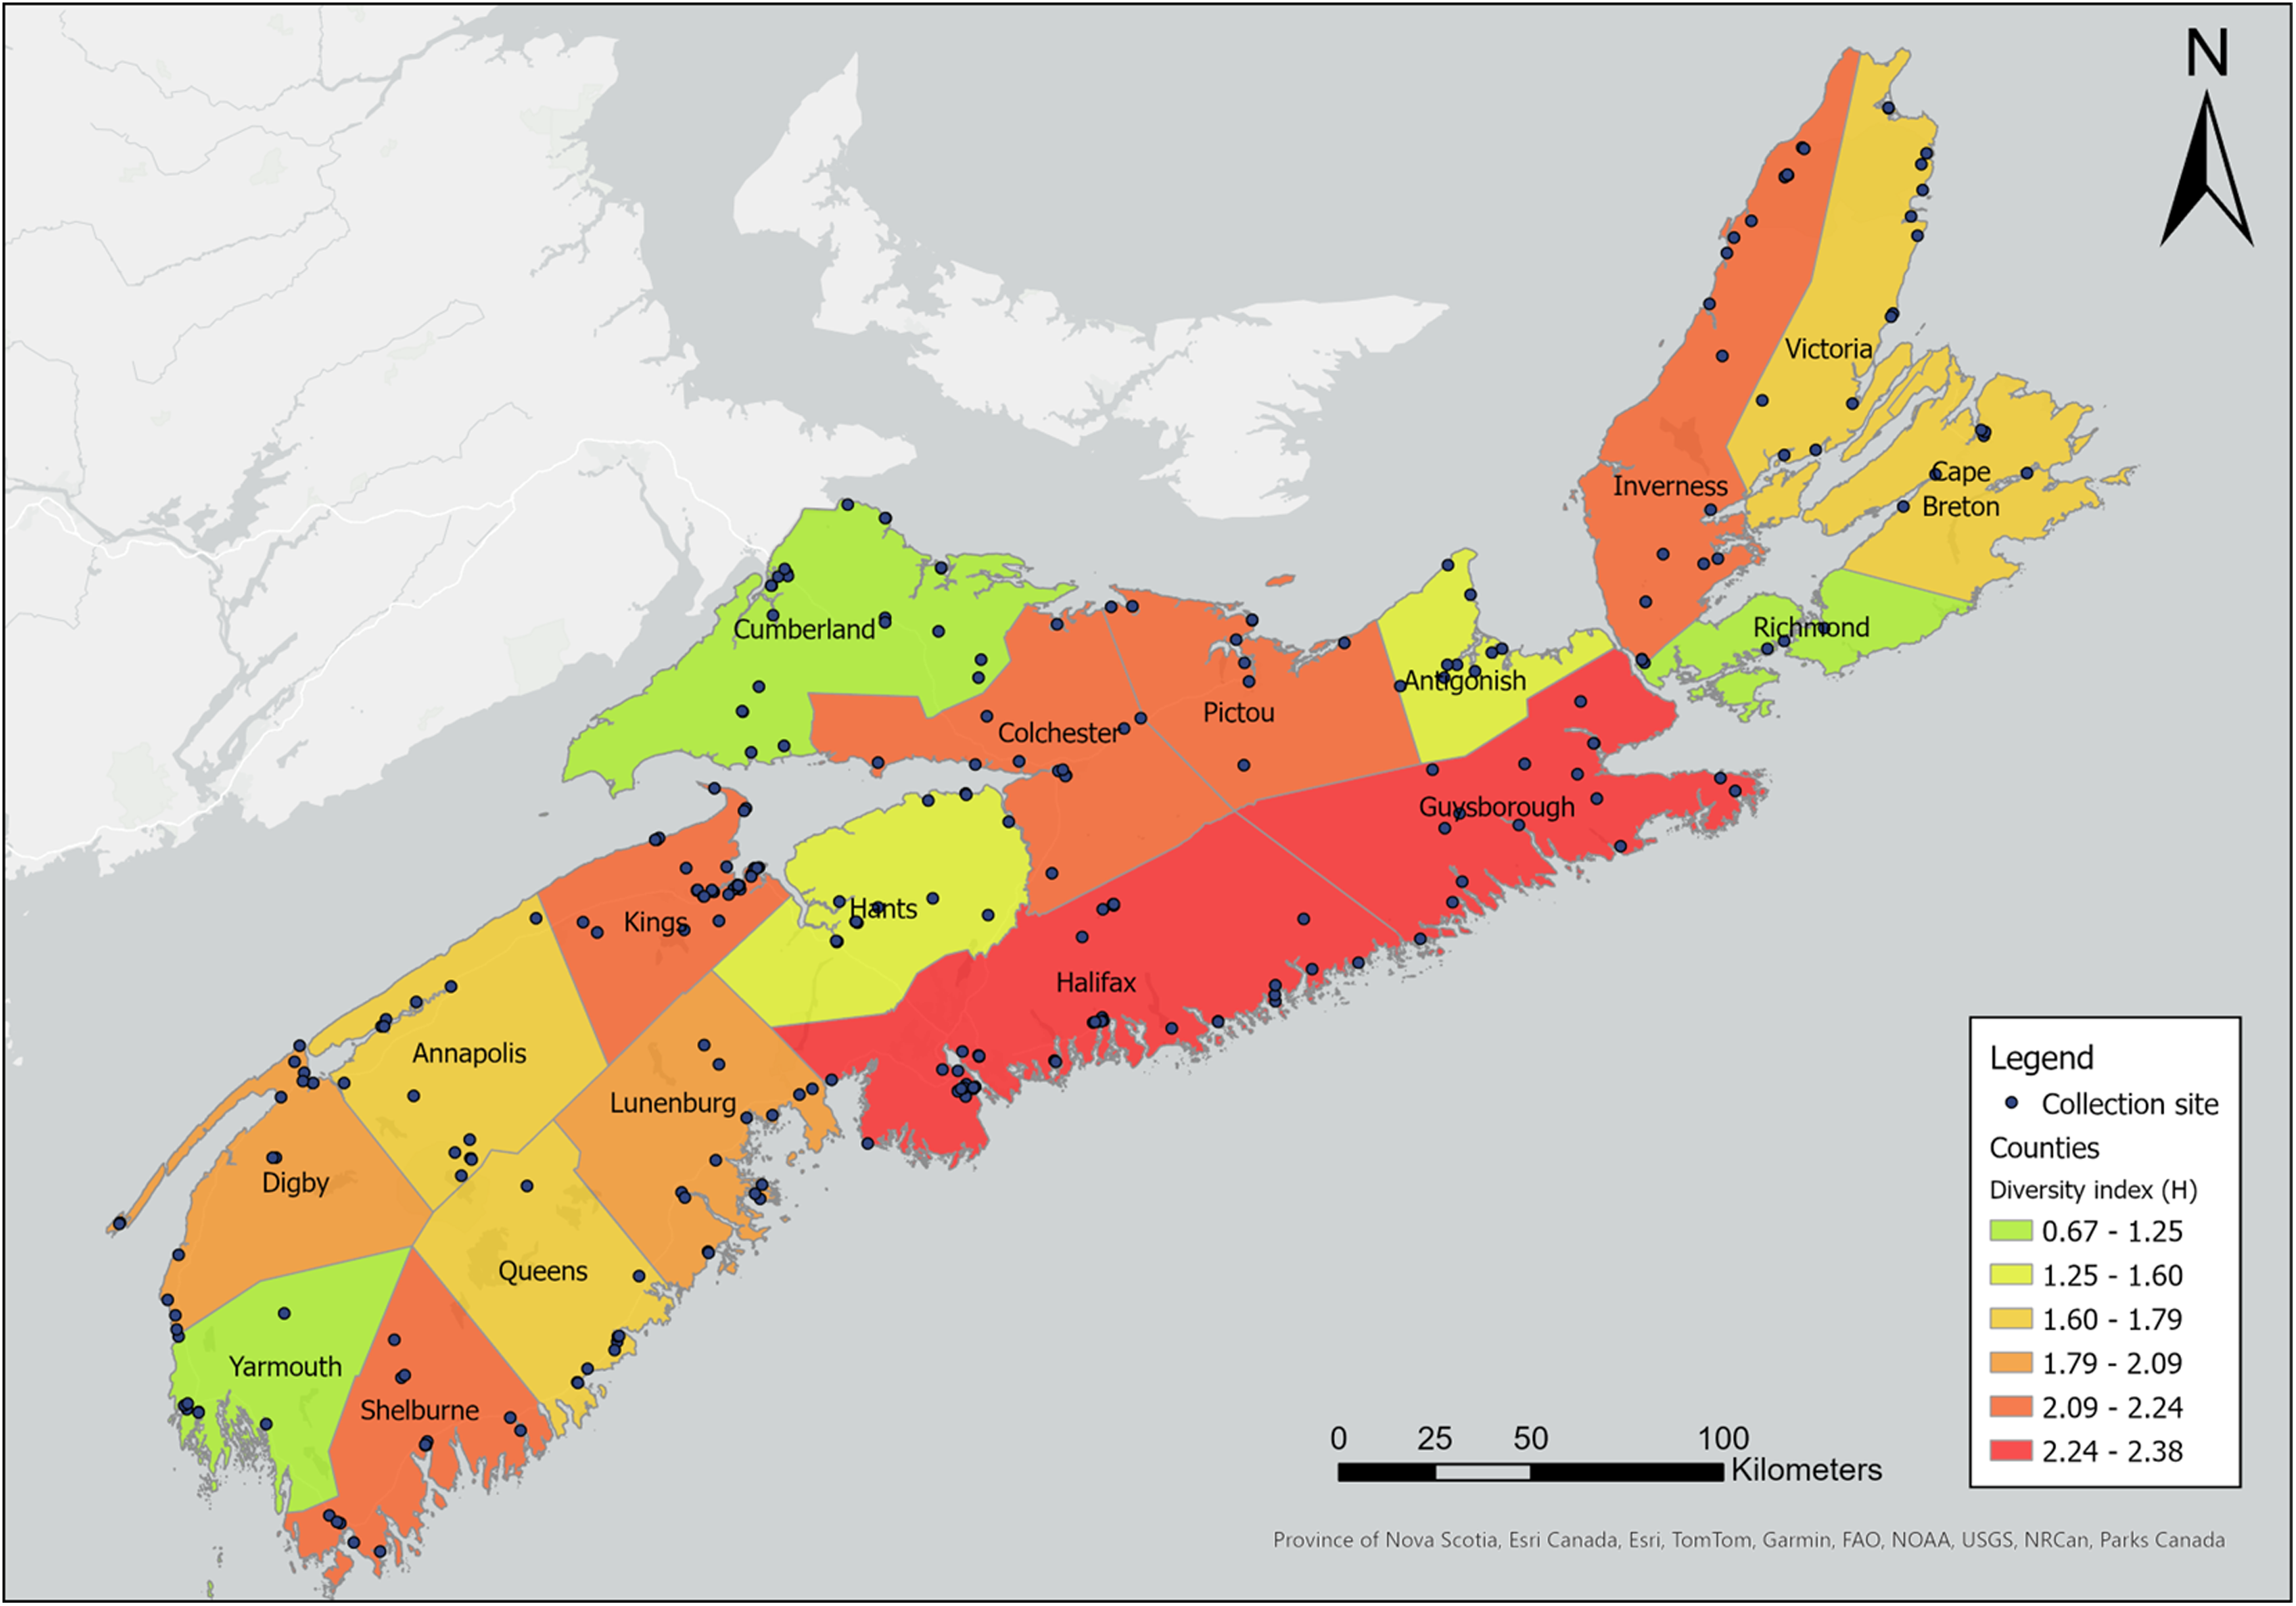
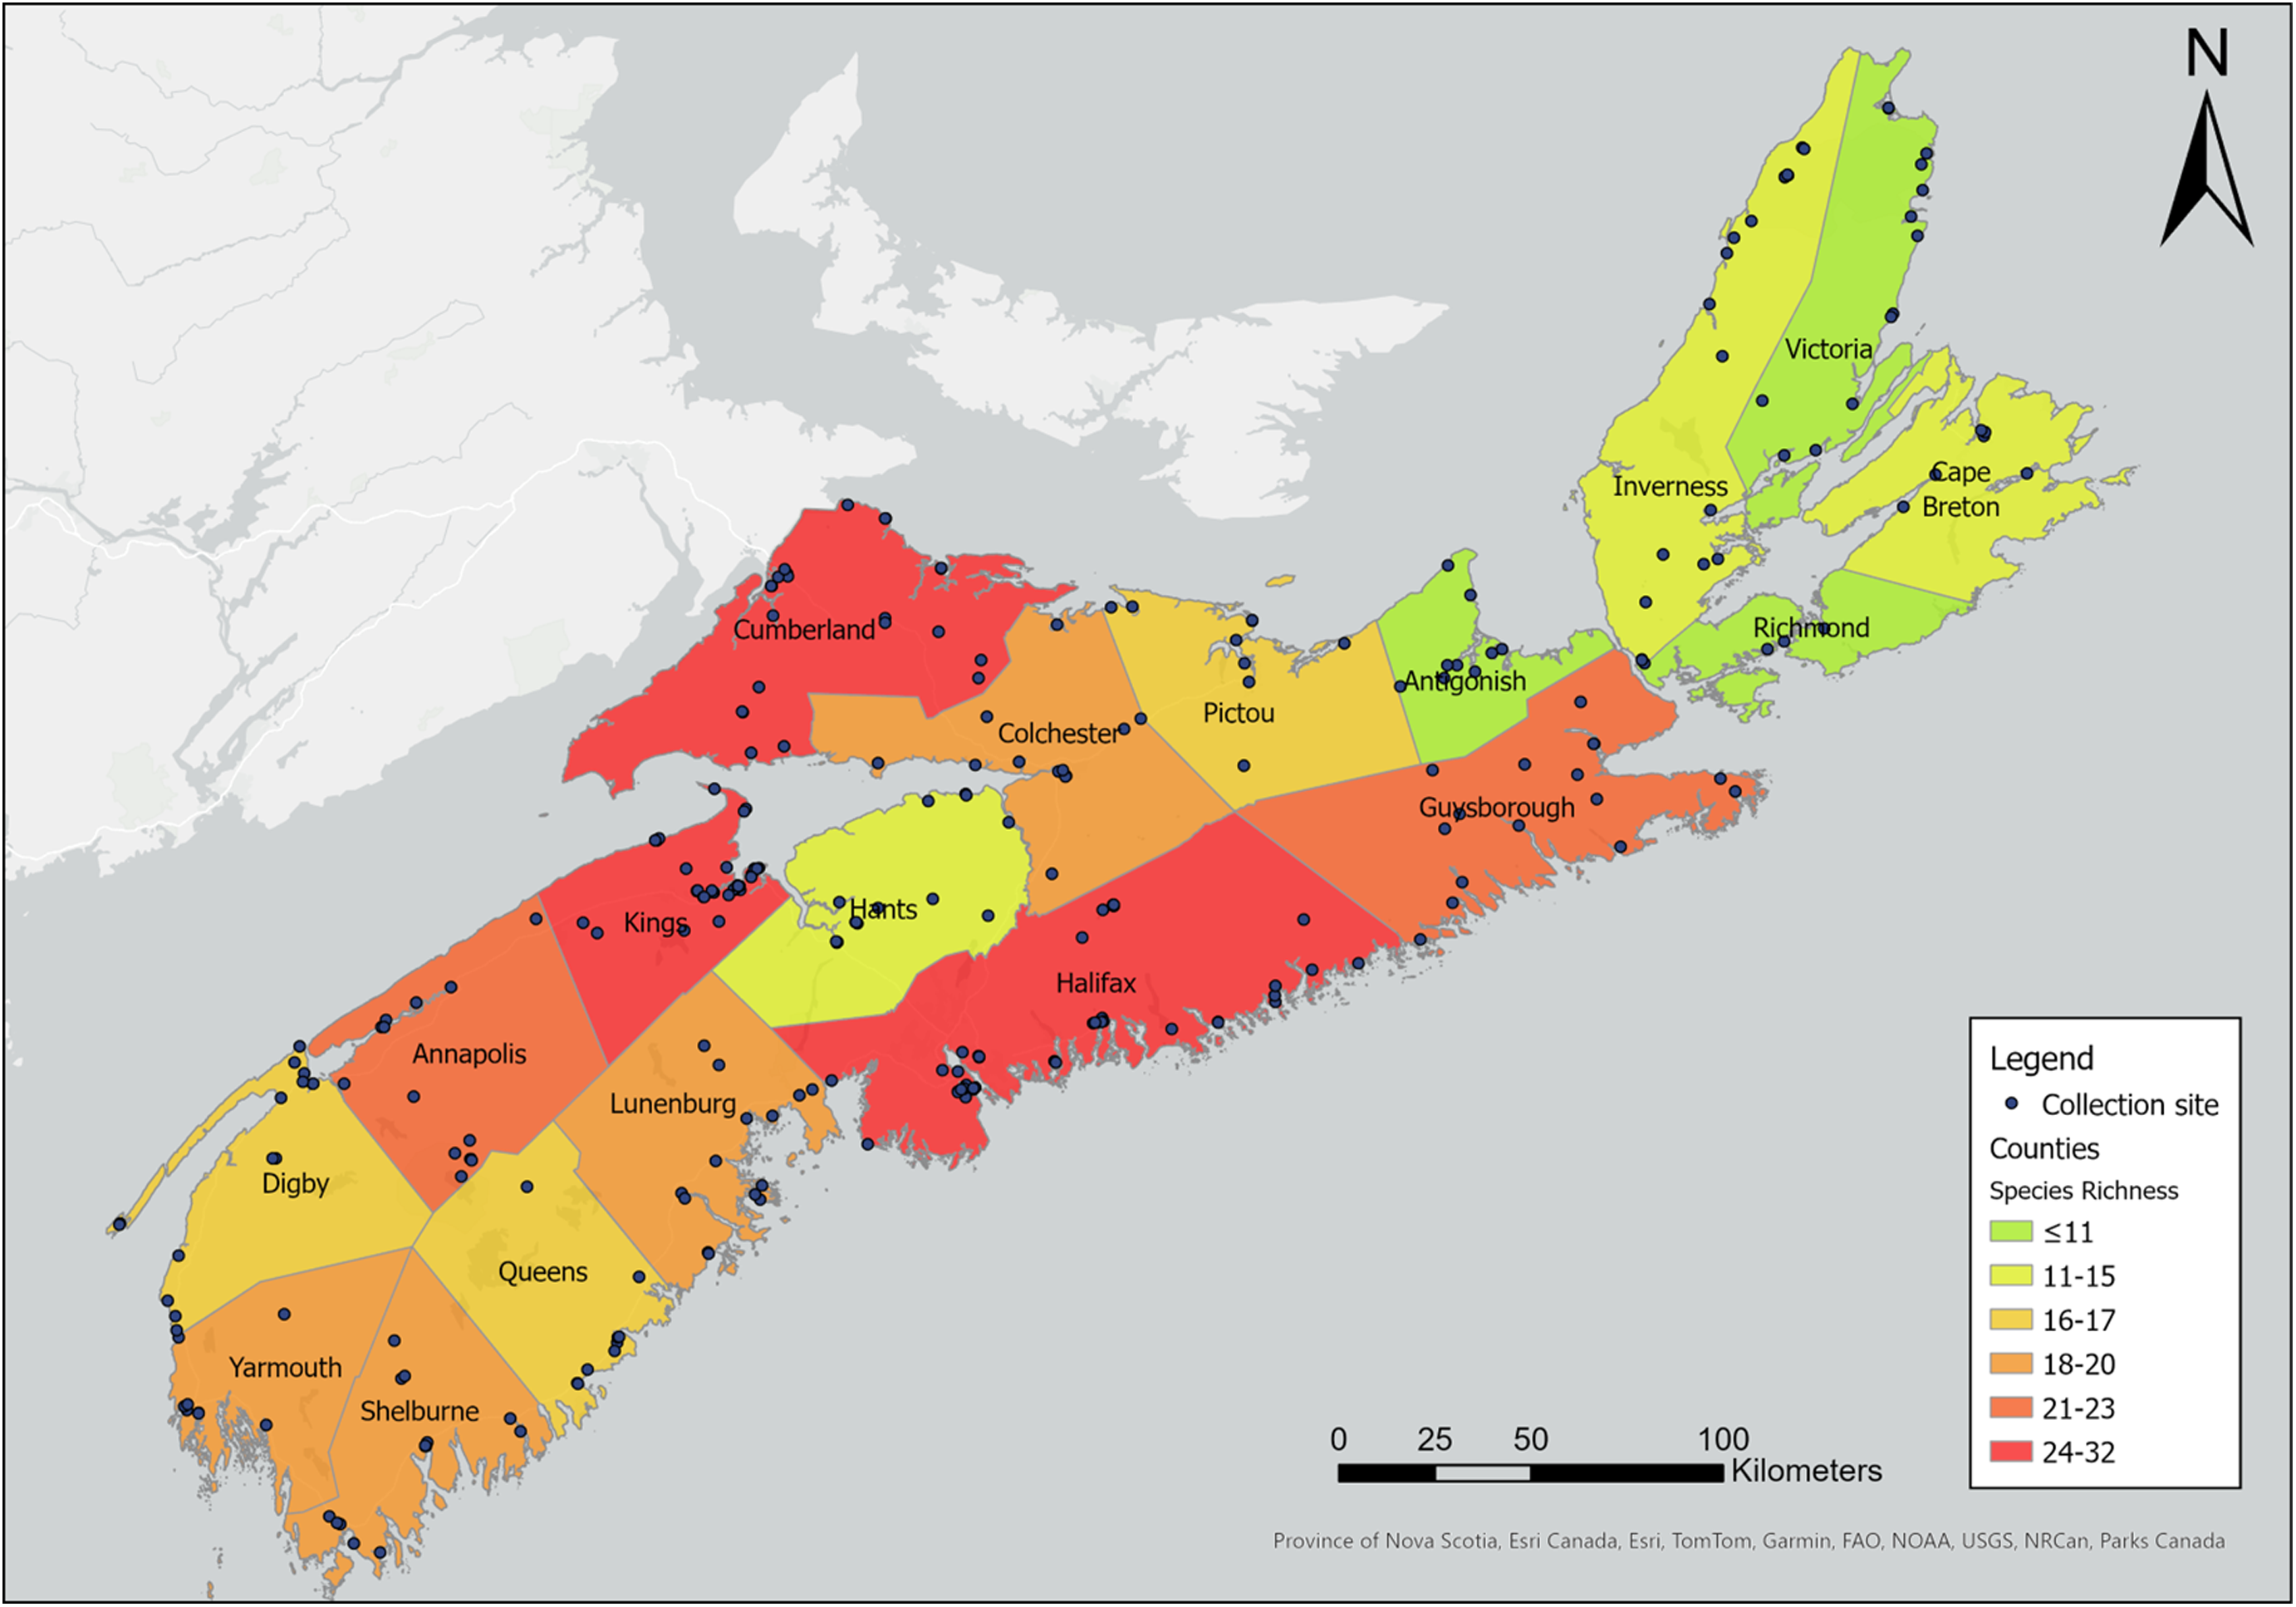
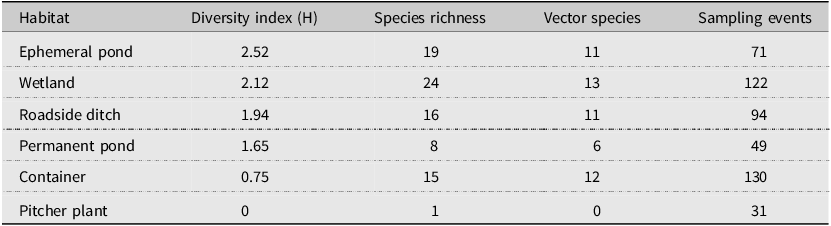
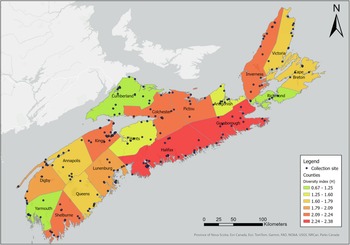
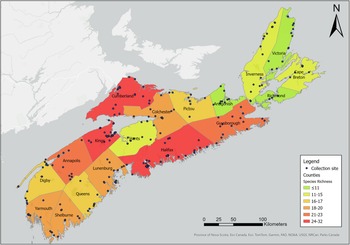
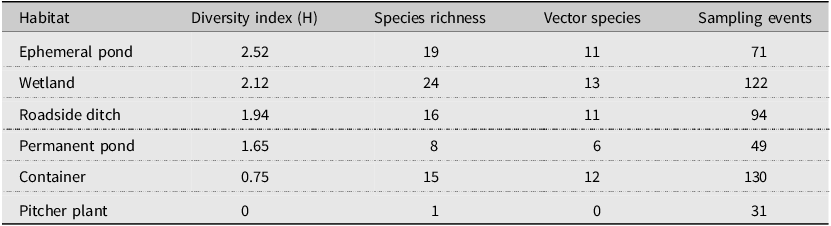
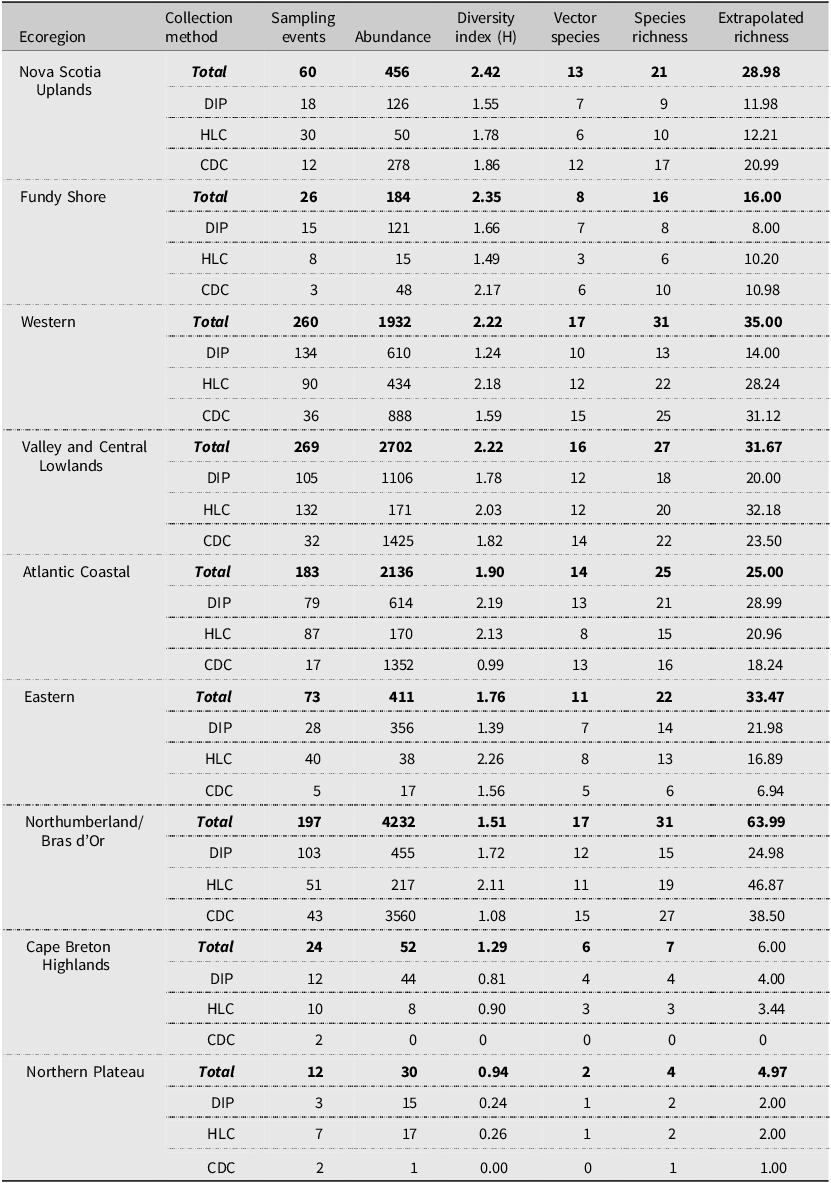
Our sampling efforts detected variable species richness and diversity among the different habitats, the areas of different climate (ecoregions), and the different counties in Nova Scotia (Figs. 7, 8; Supplemental material, Table S1, Figs. S1, S2, and S3). Wetlands and ephemeral ponds supported high species richness and diversity (Table 4), whereas permanent ponds and pitcher plants provided low species richness. Larvae of many species occupied containers (Table 4), although these collections were typically dominated by Aedes japonicus. The Northumberland/Bras d’Or and the Western ecoregions supported high species richness (Table 4; Fig. 8), including 17 of the 18 known vector species found in the present study. County analyses showed that Halifax and Kings counties supported the highest species richness and that the collections from Guysborough and Halifax counties had the highest species diversity (Figs. 7 and 8). In comparison, only four species were found to occupy the Northern Plateau (Fig. 8; Table 4). However, because sampling effort was not uniform across all counties and ecoregions during our survey, we use diversity (H) and extrapolated richness to describe diversity within these regions while avoiding drawing direct conclusions between regions.
Map depicting diversity index (H) of mosquito species by Nova Scotia county. Diversity (H) was calculated based on Shannon–Weiner diversity indexes calculated from mosquitoes captured in May–October 2021 and May–October 2022 using light trapping, larval dipping, and human landing catches. Colour gradient represents diversity indexes ranging from 0.67 to 2.38. Map generated using ArcGIS®, version 10, September 2024 (Environmental Systems Research Institute 2011).
Map depicting species richness of mosquito species by Nova Scotia county. Species richness was derived based on mosquitoes captured in May–October 2021 and May–October 2022 using light trapping, larval dipping, and human landing catches. Colour gradient represents species richness ranging from 7 to 32. Map generated using ArcGIS®, version 10, September 2024 (Environmental Systems Research Institute 2011).
Shannon–Weiner diversity index and species richness for larval habitats. This table shows the variation in diversity, species richness, and the number of potential vectors of concern (vector species) among the different collection habitats.
Discussion
Effective surveillance of mosquito species is essential for detecting invasive species and shifts in species abundance, diversity, and richness. We used three methods of mosquito collection to collect adults and larvae to determine the structure of mosquito communities within Nova Scotia across climatic regions (ecoregions), counties, and habitats, with the additional goal of identifying potential invasive species in an area where mosquito diversity, abundance, and richness have been poorly studied over the last two decades.
Overall, we detected eight species of mosquito new to Nova Scotia. Of the eight new detections, three have roles in the transmission of West Nile virus, eastern equine encephalitis virus, or both. Both Ae. sticticus and Cx. salinarius are competent vectors of West Nile virus and eastern equine encephalitis virus to humans (Armstrong and Andreadis Reference Armstrong and Andreadis2010). We also detected Culiseta melanura, which is a key species linked to the transmission of eastern equine encephalitis virus (Armstrong and Andreadis Reference Armstrong and Andreadis2010). Although relatively few bloodmeals for this species originate from mammals, it amplifies eastern equine encephalitis virus in wild birds, and the virus can then be transmitted to humans via bridge vectors such as Cq. perturbans. The potential for Cs. melanura to increase circulation of eastern equine encephalitis virus in birds, coupled with the abundance of Cq. perturbans, may lead to increased risk and frequency of infection in humans (Armstrong and Andreadis Reference Armstrong and Andreadis2010).
All newly detected species in Nova Scotia were previously present during surveillance in New Brunswick from 2002 to 2004 and likely were either already present but rare in Nova Scotia or may have expanded eastwards from New Brunswick. For example, Cx. salinarius is commonly detected in southern Canada (Gorris et al. Reference Gorris, Bartlow, Temple, Romero-Alvarez, Shutt and Fair2021), and adults and larvae of this species were also collected in New Brunswick in 2003 (Webster et al. Reference Webster, Giguère, Maltais, Roy, Gallie and Edsall2004). The presence of this species in neighbouring provinces, coupled with multiple detections in the present study, suggests that this species may have spread into Nova Scotia beginning in the early 2000s (Webster et al. Reference Webster, Giguère, Maltais, Roy, Gallie and Edsall2004). Similarly, one Cs. melanura adult was detected during mosquito surveillance in Prince Edward Island in 2000 (Giberson et al. Reference Giberson, Dau-Schmidt and Dobrin2007), and more than 220 adults were collected during surveillance in New Brunswick in 2003 (Webster et al. Reference Webster, Giguère, Maltais, Roy, Gallie and Edsall2004). These detection patterns suggest that New Brunswick may be an important entry point for mosquitoes expanding their range northeast into the Maritime Provinces. New Brunswick could therefore be an essential surveillance area, particularly for species that may expand their range over land, across the international land border, from the northeastern United States of America.
Aside from detection of new species, we also found potential changes in abundance and phenology of species from Ogden’s (Reference Ogden2002) 2000–2002 study of mosquitoes in Nova Scotia. For example, in the early 2000s, Cx. pipiens appeared in traps and dipnets only in mid- to late July. However, in the present study, we captured larvae and adults a full month earlier, in early to mid-June (Figs. 3, 4, 5, and 6). More broadly, adult mosquitoes of multiple species also appeared in CDC light traps in late June in 2000–2002, with only two species sampled in low numbers before the last week of June, whereas we detected adults of 8–18 species in late May to early June (i.e., approximately three to four weeks earlier), depending on the year. Adults of many species were active into late September, with as many as 10 species still actively seeking hosts in October (Figs. 5 and 6). Climate warming likely will advance mosquito development and extend the mosquito season in Nova Scotia in both spring and autumn: the present study may be detecting these shifts. However, we note that it is difficult to compare among studies: we did not visit the same sites on the same dates that Ogden (Reference Ogden2002) reported, and both sampling effort and location may skew the detection of certain species. For this reason, a regular pattern of surveillance is necessary to track these potential changes in abundance and phenology.
Two species of note have flourished in Nova Scotia since Ogden’s (Reference Ogden2002) survey. Aedes japonicus has expanded its range across the province, from previous records reported in only three locations to individuals found in all 18 counties and in eight of the nine ecoregions in the present study. Larvae of Ae. japonicus dominated in urban areas, likely because of their preference for breeding in artificial containers, and we collected adults late into October (Figs. 3 and 4). Their abundance and widespread presence during the growing season suggest that this invasive species may be a significant pest in Nova Scotia’s urban communities and that it requires further monitoring due to its potential as a West Nile virus vector. Furthermore, despite it being a new record in Nova Scotia, we also collected Cs. melanura in many areas across the province. Similarly to Ae. japonicus, albeit less prolific, this species also may have spread rapidly through the province over the last 20 years. We therefore recommend continued monitoring to determine the public health and ecological impacts of the spread of these invasive species in Nova Scotia.
The richness of wetland habitat across Nova Scotia supported numerous species and included habitats unique to coastal regions that selected for an abundance of salt-tolerant, nuisance mosquitoes. Many mosquito species are positively associated with wetland cover (Roiz et al. Reference Roiz, Ruiz, Soriguer and Figuerola2015; Rakotoarinia et al. Reference Rakotoarinia, Blanchet, Gravel, Lapen, Leighton, Ogden and Ludwig2022), and in the present study, wetlands supported the highest species richness relative to any other habitat, including 13 vectors of arboviruses. Coastal saltmarshes favoured species capable of inhabiting brackish water, such as Aedes sollicitans Walker and Ae. cantator, with few populations found more than 20 km inland. Both of these species feed readily on humans, are recognised as nuisance biters in high numbers, and are capable of transmitting West Nile virus and eastern equine encephalitis virus (Rochlin et al. Reference Rochlin, Iwanejko, Dempsey and Ninivaggi2009). With more than 70% of Nova Scotia’s population residing in coastal communities (Province of Nova Scotia 2024b), we expect that coastal wetlands will continue to be important places of contact between humans and mosquitoes, highlighting these areas of increased risk for disease transmission.
The abundance of mosquitoes associated with wetlands in Nova Scotia and the potential for the abundance of vector species increasing with climate warming may raise concerns about wetland conservation and interest in wetland management. Natural wetlands support rich communities of mosquitoes, although overall abundance of nuisance mosquito species can be lower in mosquito communities in natural wetlands than that found in mosquito communities in constructed wetlands (Dworrak et al. Reference Dworrak, Sauer and Kiel2022). Furthermore, healthy, natural wetlands are more likely to support populations of mosquito predators and therefore are less prone to uncontrolled larval numbers, supporting continued wetland conservation (Dworrak et al. Reference Dworrak, Sauer and Kiel2022). Nevertheless, anecdotal reports from some Nova Scotia residents describe “near-unliveable” conditions in the summer in some coastal areas due to a high abundance of mosquitoes, leading some communities to seek mosquito control options (Laura Ferguson, unpublished data 2023). Because wetland conservation is paramount for other species in Nova Scotia, including many birds (Brazner and Achenbach Reference Brazner and Achenbach2019), we recommend continued monitoring of wetland mosquito species and investigation of potential integrated marsh management techniques (Haas-Stapleton and Rochlin Reference Haas-Stapleton and Rochlin2022) to help to mitigate any potential or perceived conflicts between public health and conservation.
Although sampling effort in the present study was not standardised across all counties (Supplemental material, Table S1), we observed that counties with high human populations also supported rich and diverse communities of mosquitoes. For example, Halifax County had the highest number of mosquito species and also is home to over 47% of Nova Scotia’s population (Province of Nova Scotia 2023b). Often, diversity, richness, and abundance are lower in urban areas than in natural habitats (Ferraguti et al. Reference Ferraguti, Magallanes, Ibáñez-Justicia, Gutiérrez-López, Logan and Martínez-de la Puente2022; Rakotoarinia et al. Reference Rakotoarinia, Blanchet, Gravel, Lapen, Leighton, Ogden and Ludwig2022), but human activities can create heterogenous landscapes that may increase the availability of habitats for mosquito larvae, thereby supporting mosquito diversity (Lamichhane et al. Reference Lamichhane, Neville, Oosthuizen, Clark, Mainali, Fatouros and Beatty2017; Lee et al. Reference Lee, Wasserman, Gan, Wilson, Rahman and Yek2020). Species such as Cx. pipiens and Ae. japonicus appear to benefit from the increase in oviposition sites provided by artificial containers, such as discarded tires and birdbaths, found in human-occupied habitats (Ferraguti et al. Reference Ferraguti, Magallanes, Ibáñez-Justicia, Gutiérrez-López, Logan and Martínez-de la Puente2022), and we detected both of these mosquito species in containers in areas near cities and towns. This association of Ae. japonicus and Cx. pipiens with human-inhabited areas increases potential future risk of disease transmission to the public and requires the development of control strategies, including encouraging community members to remove sources of stagnant water.
We also found that species richness and diversity varied among ecoregions, and understanding this variation may help to explain the conditions that support mosquito communities in Nova Scotia and inform future monitoring efforts (Table 5). The Northern Plateau is the province’s smallest, least-forested ecoregion and has the harshest climate; it showed the lowest species richness and diversity of all ecoregions in the province. In contrast, the Western and the Northumberland/Bras d’Or ecoregions boast the warmest summers and an abundance of watershed and wetland cover (Province of Nova Scotia 2017) and had the highest mosquito species richness. These latter two ecoregions are large, comprising 30.5% and 15.2% of Nova Scotia’s land cover, respectively, and may simply contain a wider variety of habitats. Similarly, these two ecoregions also had the highest instances of sampling events (Table 5), suggesting sampling standardisation across ecoregions is needed to accurately compare diversity between regions.
Shannon–Weiner diversity index and species richness for ecoregions in Nova Scotia, Canada. This table shows the variation in diversity, species richness, extrapolated species richness, and the number of potential vectors of concern (vector species) among the different ecoregions using each collection methods, including larval dipping (DIP), human landing catches (HLC), and light trapping (CDC).
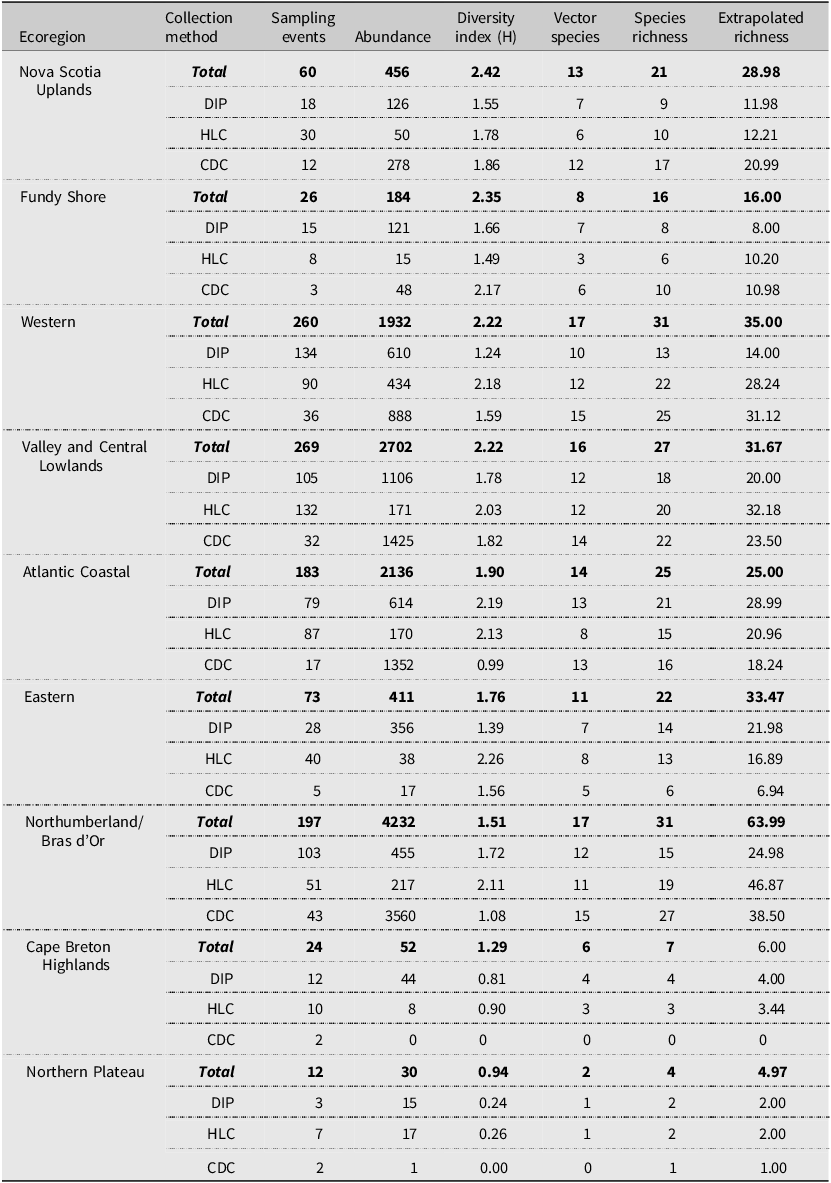
Similar sampling effort occurred in both the Northumberland/Bras d’Or and the Atlantic Coastal ecoregions, but mosquito species richness was highest in the Northumberland/Bras d’Or ecoregion (Table 5). This suggests that that the ecoregion encompasses conditions suitable for a wide variety of species and monitoring efforts. However, despite having the highest species richness, the Northumberland/Bras d’Or ecoregion (including Cumberland County, with extensive cattail marshes in the Chignecto National Wildlife Area) was dominated by collections of the cattail mosquito, Cq. perturbans, which comprised 61% of all species in the region and accounted for more than half of all collections of this species in Nova Scotia. If future mosquito surveillance must be operated at a reduced capacity (i.e., without coverage of all ecoregions and counties), sampling in regions with high richness and diversity (e.g., the Western ecoregion) may yield more information with limited sampling effort. Nevertheless, Cq. perturbans is still a vector species of interest (Armstrong and Andreadis Reference Armstrong and Andreadis2010) and should continue to be included in surveillance efforts.
Because Nova Scotia does not have a regular surveillance program in place, future surveillance efforts may be restricted in both geographic area and sampling effort and therefore may also benefit from selective use of the different sampling methods used in the present study. Similar to other surveillance studies (Tangena et al. Reference Tangena, Thammavong, Hiscox, Lindsay and Brey2015; Kenea et al. Reference Kenea, Balkew, Tekie, Gebre-Michael, Deressa and Loha2017), we captured a high diversity of species using human landing catches, despite this method yielding the lowest abundance, highlighting the applicability of this method to yield useful species data with low effort (Table 6). Human landing catches allow for sampling in a wide variety of locations at different times of the day compared to larval dipping and CDC light trapping. The relatively low number of human landing-caught mosquitoes needed to reach a similar species richness and diversity as captured by CDC light traps (Palmer et al. Reference Palmer, Oltra, Collantes, Delgado, Lucientes and Delacour2017) could be combined with community science for a broad and effective method of mosquito surveillance (Braz Sousa et al. Reference Braz Sousa, Fricker, Webb, Baldock and Williams2022). We therefore suggest that in years of reduced surveillance efforts, human landing catches in centres of high human activity (e.g., Halifax County) and in species-richness hotspots (e.g., Halifax, Kings, and Cumberland counties and the Western and the Valley and Central Lowlands ecoregions) could help to assess mosquito communities and their potential disease risks. However, we also caution that we only captured the full catalogue of species by sampling both larvae and adults and that similar methodology may be required.
Shannon–Weiner diversity index for each mosquito collection method in 2021 and 2022. This table shows the variation in diversity, species richness, and the number of potential vectors of concern among the specimens collected according to each collection method employed.

Overall, we have set a new baseline of mosquito species richness across Nova Scotia and provide insights into the need for, and possible structures of, future surveillance. We anticipate that climate change will continue to further the establishment of invasive species, to advance and lengthen the active season for mosquitoes, and to heighten the potential disease risks associated with mosquito activity. For these reasons, continued surveillance is needed in Nova Scotia to allow us to track how mosquito communities continue to change over time.
Supplementary material
To view supplementary material for this article, please visit https://doi.org/10.4039/tce.2025.10029.
Acknowledgements
The authors thank Emma Rand, Grace MacLean, Jacob Ouellette, Luca Voscort, Kayla Gaudet, Andrew Lawrence, and Alicja Muir, all of whom provided valuable help collecting mosquitoes in the field. They also thank Jeffrey Ogden for providing traps for collecting specimens when shipments were delayed by pandemic lockdowns, B. Sinclair for expert identification of samples, and Alexandre Caouette for providing help with creating maps. They also extend their gratitude to the Public Health Agency of Canada for funding the present research through the Infectious Disease and Climate Change Fund and Research Nova Scotia for a scholarship provided to T.L.S.
Author contributions
All the authors contributed to the conceptualisation and planning of the study; L.V.F., T.G.S., R.H.E., and N.K.H. helped acquire funding. T.L.S. carried out the fieldwork and identification of mosquitoes, handled data curation, visualisation, and formal analysis, wrote the original draft of the manuscript, and contributed to its review and editing. L.V.F. contributed to formal analysis and visualisation, supervision, and writing of the original draft and its review and editing. T.G.S., R.H.E., and N.K.H. contributed further to supervision and review and editing.
Competing interests
The authors declare that they have no competing interests.



 Open access

