


1. Introduction
In a variety of organisms lifespan is extended when they experience limitation in the amount of available food (Fontana et al., Reference Fontana, Partridge and Longo2010). Such effect of caloric or dietary restriction on lifespan is known in yeast (Lin et al., Reference Lin, Ford, Haigis, Liszt and Guarente2004), round worms (Houthoofd et al., Reference Houthoofd, Braeckman, Johnson and Vanfleteren2003), Drosophila (Mair et al., Reference Mair, Goymer, Pletcher and Partridge2003, Reference Mair, Piper and Partridge2005; Partridge et al., Reference Partridge, Piper and Mair2005; Pletcher et al., Reference Pletcher, Libert and Skorupa2005) and mammals (Weindruch & Walford, Reference Weindruch and Walford1988; Anderson et al., Reference Anderson, Shanmuganayagam and Weindruch2009), and is hypothesized in humans as well (Fontana et al., Reference Fontana, Partridge and Longo2010). In Drosophila in particular, it has been shown that the lifespan restriction effect is based largely on the amount of proteins, not on the amount of calories consumed (Mair et al., Reference Mair, Piper and Partridge2005; Lee et al., Reference Lee, Simpson, Clissold, Brooks, Ballard, Taylor, Soran and Raubenheimer2008; Grandison et al., Reference Grandison, Piper and Partridge2009; Simpson & Raubenheimer, Reference Simpson and Raubenheimer2009). Specific metabolic pathways implicated in lifespan response to caloric restriction may vary among organisms; what appears to be a common ground in yeast, Caenorhabditis elegans, Drosophila and mammals is the role of nutrient-sensing pathways, in particular those involving insulin/insulin-like growth factors (IGF) and the target of rapamycin (TOR) (Fontana et al., Reference Fontana, Partridge and Longo2010). In addition, in Drosophila the increased expression of dSir2 sirtuin extends lifespan, while decrease in dSir2 blocks the effect of dietary restriction on lifespan (Rogina & Helfand, Reference Rogina and Helfand2004) and spontaneous physical activity (Parashar & Rogina, Reference Parashar and Rogina2009). In addition, the expression of takeout, a gene that is involved in circadian rhythms, juvenile hormone binding and, notably, feeding behaviour, is increased in a variety of dietary and genetic conditions, in which extended lifespan is observed (Bauer et al., Reference Bauer, Morris, Chang, Flatt, Wood and Helfand2009, Reference Bauer, Antoch, Chang, Schorl, Kolli, Neretti and Helfand2010). Thus, we are currently approaching a detailed understanding of genetic determinants of dietary restriction. Yet, the majority of these results were obtained by studying either null-alleles or knockouts or genetically manipulated expression variants of the genes involved, while the extent of genetic variation for lifespan response to dietary in natural populations remains unknown.
The importance of diet protein richness for lifespan modulation is intriguing because it may indicate that flies regulate the intake of protein and carbohydrate and adjust their life history accordingly (Lee et al., Reference Lee, Simpson, Clissold, Brooks, Ballard, Taylor, Soran and Raubenheimer2008). Lifespan extension by dietary restriction, therefore, should not be thought of as a simple trade-off with fecundity (Grandison et al., Reference Grandison, Piper and Partridge2009), even though such extension is often accompanied by fecundity reduction and even though such manifestation of longevity vs. reproduction trade-off is to be expected from the evolutionary standpoint (Harrison & Archer, Reference Harrison and Archer1988; Phelan & Austad, Reference Phelan and Austad1989; Shanley & Kirkwood, Reference Shanley and Kirkwood2000). Yet, addition of relatively small amounts of the amino acid methionine to restricted diet can drastically increase fecundity without any detectable detrimental effect on lifespan (Grandison et al., Reference Grandison, Piper and Partridge2009), thus allowing the escape from the hypothesized trade-off. Whether or not genetic variation exists for the effect of methionine (and other essential amino acids) additions to the diet is unknown.
In this paper, we present estimates of the levels of genetic variation for the lifespan response to dietary restriction measured as the genotype-by-environment interaction in a set of inbred lines (representing standing genetic variation in a local population and extensively characterized in terms of full-genome sequences and transcriptome analysis; Ayroles et al., Reference Ayroles, Carbone, Stone, Jordan, Lyman, Magwire, Rollmann, Duncan, Lawrence, Anholt and Mackay2009) exposed to high-yeast (full) food and low-yeast (restricted) food with and without the addition of amino acids. We also further test the recent hypothesis (Ja et al., Reference Ja, Carvalho, Zid, Mak, Brummel and Benzer2009 but see Piper et al., Reference Piper, Wong, Grandison, Bass, Martinez and Partridge2010) about the role of nutrient-free water availability as a possible strong modifier of lifespan response to the yeast concentration in the medium.
2. Materials and methods
Drosophila Genetic Reference Panel (DGRP) inbred lines (Ayroles et al., Reference Ayroles, Carbone, Stone, Jordan, Lyman, Magwire, Rollmann, Duncan, Lawrence, Anholt and Mackay2009; http://service004.hpc.ncsu.edu/mackay/Good_Mackay_site/DBRP.html) were initiated by T. F. C. MacKay from a single population from Raleigh, NC, inbred for at least 20 generations and currently being fully characterized by whole-genome sequencing and transcriptome analysis. Thirty-four out of 40 core DGRP lines have been obtained from Bloomington stock collection (see Supplementary materials for the list of lines used). The remaining six lines were either unavailable from the stock collection (two lines) or were too weak to generate required number of individuals (four lines).
Flies were maintained in standard 5% cornmeal–yeast–sugar medium prior to the experiment. Thirty flies of each sex were collected <24 h after eclosion, counted and transferred into 150 ml plastic bottles fitted with a 35 mm Petri dish containing 10 ml of medium and a 25 mm diameter Styrofoam plug and kept in a Percival incubator at 26°C and 75% humidity. Males and females were kept together and sexed as the deaths were recorded. While keeping both sexes together and, therefore, allowing repeated matings, can exaggerate the effect of nutrition level on lifespan due to mating cost (Chapman & Partridge, Reference Chapman and Partridge1996), it, on the other hand, allows measuring the entire effect of nutrition on lifespan, both the direct metabolic component and the indirect component acting through mating frequency, probably reflecting the actual situation in a natural population, in which females encounter males throughout the lifetime. Given our purpose to document differences within a set of inbred lines sampled from a natural population, it was more appropriate to maintain sexes together.
Food was replaced and dead flies counted every other day. Full (F) medium contained 15% nutritional (brewer's) yeast (LabScientific) and 5% sugar in 1·5% agar (approx. 760 kcal/l); restricted (R) medium contained 5% yeast and 5% sugar in 1·5% agar (approx. 380 kcal/l). Non-nutrient water was added in the form of 1 ml of 0·7% agar in a cut-off microcentrifuge tube glued to the Petri dish centre. Methionine-enriched medium (R+M) was prepared by adding 1·5 mM (0·225 g) methionine to 1 litre of R medium; essential amino acids-enriched medium (R+E) was prepared by adding 0·225 g of each of 10 essential amino acids (R, H, I, L, K, M, F, T, W and V) to 1 litre of R medium. Thus, the addition of methionine increased the concentration of methionine in the medium by 37·5%, assuming 1·2% methionine content in Drosophila brewer's yeast (Bass et al., Reference Bass, Grandison, Wong, Martinez, Partridge and Piper2007); possibly more, given that dissolved methionine in more nutritionally available than methionine present in brewer's yeast. The concentration of essential amino acids in R+E food was 7–40% higher than in R food, depending on the concentration of each amino acid in brewer's yeast (see Bass et al., Reference Bass, Grandison, Wong, Martinez, Partridge and Piper2007, Supplementary Table 2). Assuming the energy content of amino acids from May & Hill (Reference May and Hill1990), caloric content of R+M and R+E food was higher than that in the R food due to the addition of amino acids by 0·28% and by 3·5%, respectively. The effect of a 3·5% difference in caloric content on fecundity and lifespan, even if present, is probably not detectible in experiments of conventional size (cf. for example, Partridge et al., Reference Partridge, Piper and Mair2005, Fig. 1) and certainly is small in comparison with the 2-fold difference in caloric content between R and F food.
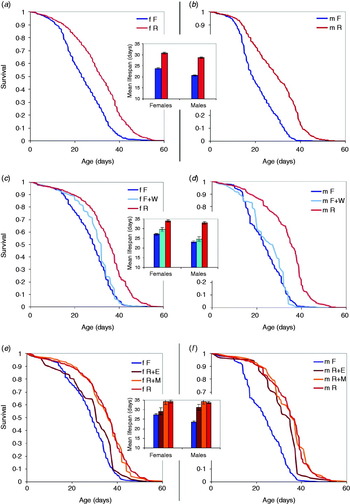
Survival curves and mean lifespan in DGRP inbred lines. (a, b) 34 lines on full food (15% yeast, blue lines and bars) and restricted food (5% yeast, red lines and bars); females and males, respectively. (c, d) Effect of the addition of nutrient-free water (F+W; light-blue lines and bars). (e, f) Effect of the addition of essential amino acids (R+E, brown lines and bars) and of methionine (R+M, orange lines and bars).
Only a subset of the 34 lines tested in the R vs. F experiment was used in the R+M/R+E and F+W treatments (six and nine lines, respectively). These lines were chosen blindly from the 25 of the 34 lines after the exclusion of nine least viable lines. Thus, the lines in R+M/R+E and F+W treatments are a biased sample of the total set of lines. However, in each comparison involving R+M/R+E and F+W treatments, the data from R and F treatments represented the same subset of lines.
Lifespan measurements were conducted in two blocks with the majority of lines represented by 1–3 replicate bottles in each block×food combination, resulting in 3–5 replicate bottles per food per line and each sex/line/food combination represented by 100–150 individuals. As Kaplan–Meier survival analysis (see below) is sensitive to unbalanced cohort sizes, efforts have been made to maintain the design as balanced as possible: although lines differed in the total number of replicated bottles and in cohort size, both the number of replicate bottles and cohort size were kept equal among food treatments within each line. Exclusion of four lines with the lowest cohort sizes (which, not surprisingly, tended to also have low life expectancy) from the analysis of lifespan data did not change the results significantly (data not reported). The experiment was continued until all flies were dead.
In parallel with block 2 of the lifespan measurement, two or three females were removed from the experimental bottles on days 5, 10 and 20 (±1 day) and placed individually into 5 ml shell vials containing 1·5 ml of food for 24 h. Fecundity of inbred lines is low enough (10–40 eggs/day) to allow low larval mortality, which in wild-caught outbred flies was estimated to be less than 5% in vials with initial egg density up to 50 eggs/vial (L. Yampolsky, unpublished results). Yet in many lines many eggs failed to develop, indicating possible widespread fertilization failure. Eggs were counted, females returned to their lifespan bottles and vials were stored under the same conditions for 6–10 days at which time pupae were counted as well to assess the portion of fertilized eggs.
Lifespan data were analysed by means of the Kaplan–Meier product limit method in JMP (SAS Institute, 2002). Parametric fitting of mortality models was done with WinModest (Pletcher, Reference Pletcher1999), estimating age-independent mortality component (i.e. mortality of the youngest flies) and the slope of age-specific mortality (a proxy of ageing rate) by ML fitting of the Logistic–Makeham model to mortality data in each sex in each replicate bottle. The Logistic–Makeham model was the best fit in most of the replicates; in those where it was not, the parameters absent in the best-fit model were assumed to be 0. For example, if the best-fitting model was the Logistic model, the age-independent mortality was assumed to be 0; if the best-fitting model was the Gompertz model, then both age-independent mortality and curvilinearity parameters were assumed to be 0. Mean lifespan, age-independent mortality and the slope of age-specific mortality were analysed by mixed-model ANOVA with food as fixed effect and lines and lines-by-food interaction as random effects and with the combination of blocks and replicates within blocks as the error term. Fecundity and proportion of eggs completing development were analysed by the same ANOVA model with error term representing individual fecundity vials. Median lifespan and mortality parameters were transformed by Box–Cox power transformation; fecundity (for which Box–Cox procedure is not applicable due to 0 values) was square root-transformed and proportion of eggs developing was arcsine (square root) transformed. Transformed data compliance with the distributional assumptions of ANOVA F-tests was evaluated in the following manner. Within-cell heteroscedasticity was tested by O'Brien test for inequality of variances; this test was insignificant for all tests except for the median lifespan in males and for fecundity. Residuals’ deviation from normality was tested by Shapiro–Wilk test, the distributions of residuals were visually inspected for symmetry and heavy-tailness and skewness and kurtosis were calculated. Although Shapiro–Wilk test demonstrated a significant departure of residuals from the normal curve in several comparisons, in no case was kurtosis above 1·5, except for, again, median lifespan in males, and in no case was the absolute value of skewness above 0·5, except for the proportion of eggs completing development. All among-line tests were confirmed by Wilcoxon test within each food level.
3. Results
Survival curves for males and females in the 34 inbred lines are shown in Figs 1(a) and (b). Insets show mean lifespan. The effect of the addition of 1 ml of nutrient-free water on the lifespan of females and males of a subset of nine lines is shown in Figs 1(c) and (d), respectively. The effect of essential amino acids and methionine on lifespan of females and males in a subset of six lines is shown in Figs 1(e) and (f), respectively. Kaplan–Meier product–moment comparison among groups was significant (P<0·0001) for each comparison, except for F vs. F+W in males, F vs. R+E in females and R vs. R+M in both sexes. Therefore, our data show a significant effect of dietary restriction in both female and male flies: lifespan on 15% yeast medium was reduced by 23% and 28%, respectively. Lifespan reduction is less dramatic, but still highly statistically significant when full food was supplemented by nutrient-free water (13% and 25%, respectively). Methionine additive did not change lifespan of either sex relative to restricted food without methionine (red vs. orange lines and bars on Figs 1(e) and (f)), while the addition of 10 essential amino acids significantly reduced the lifespan, in females to the level indistinguishable from that on full food (brown lines and bars on Figs 1(e) and (f)).
Reduction of lifespan on full food was accompanied with an increase of fecundity at day 5 and day 10, but not at day 20 (Fig. 2(a)). A large portion of eggs failed to develop, particularly on full food. This proportion increased from 54 to 71 to 87% as flies aged from day 5 to day 10 to day 20. This proportion remained unchanged at 35–42% on restricted food. Visual observation of vials for larval activity and remaining intact eggs indicate that the majority of these eggs never hatched, probably indicating absence of fertilization.
Fecundity of flies age 5, 10 and 20 days on full, restricted and modified media. Colours as on Fig. 1. (a) Fecundity in 34 inbred lines on full (F) and restricted (R) food. Entire bars – eggs/day; darkened portion of the bars – pupae developed. (b) Fecundity at day 10 in the subset of nine lines on full food (F), full food with water added (F+W) and restricted food (R), eggs/day. (c) Fecundity at day 10 in the subset of six lines on full food (F), restricted food with 10 essential amino acids added (R+E), restricted food with methionine added and unmodified restricted food (R), eggs/day.

Water addition did not significantly decrease fecundity as compared to full food without nutrient-free water (Fig. 2(b)). On the other hand, adding essential amino acids to the restricted food increased fecundity to the level observed on full food, while addition of methionine resulted in an intermediate fecundity significantly different (Tukey test, P<0·01) from that on both full and restricted food.
Despite apparent trade-off across food treatments, lifespan and fecundity showed little to no evidence of negative correlation across lines (Fig. 3). Only fecundity on day 10 on restricted food showed a (non-significant) negative slope on line's mean lifespan; all significant correlations were positive.
Correlation of line fecundity means (eggs/day) at age 5, 10 and 20 days (a, b and c, respectively) with mean lifespan. Blue lines, small dots – full food; red lines, large dots – restricted food. Thick lines: regression significant at P<0·01; dotted lines P>0·05.

Lines differed significantly from each other in median lifespan and in both sexes (Table 1). However, for age-specific and age-independent components of mortality, line was not a significant factor for females and was only marginally significant for males (Table 1). These results are corroborated by the Wilcoxon non-parametric test with each food level separately (results not reported). Median lifespan showed a moderately significant (P<0·04) line×food interaction (i.e. among-line difference in the degree of dietary restriction) in both sexes, explaining 6·3 and 9·3% of random variance in females and males, respectively. This interaction was stronger (P<0·005) for age-dependent mortality in females, explaining 17·7% of random variance, but non-existent in males or for age-independent mortality in both sexes (Table 1).
Mixed-model ANOVA of the effects of food (fixed effect) and lines (random effect) on median lifespan and on age-dependent and age-independent components of mortality. All variables Box–Cox transformed

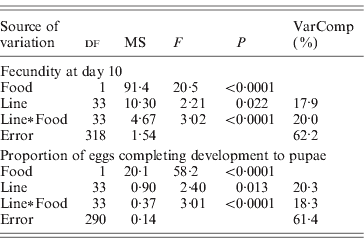
Lines differed significantly in the proportion of eggs completing development to pupae, and in overall fecundity (Table 2). The line×food interaction term was highly significant for both of these responses.
Mixed-model ANOVA of the effects of food (fixed effect) and lines (random effect) on fecundity at day 10 and percentage of eggs laid at day 10 developing into pupae. Fecundity is square root transformed; proportion of eggs developing is arcsine (square root) transformed
None of the line×food interaction terms were significant in any of the F vs. F+W, R vs. R+E or R vs. R+M comparison (data not reported).
4. Discussion
We demonstrate the presence of among-line variation and line×food interactions among inbred Drosophila lines (Table 1). It is, therefore, likely that the population, from which these lines had been sampled, harboured a significant genetic variation for lifespan and for the response of lifespan parameters to diet, i.e. in the degree of dietary restriction. Specifically, we see evidence of such interaction for median lifespan in both sexes and for rate of mortality increase with age for females. While the genotype-by-environment interactions for lifespan have been previously demonstrated in mice (e.g. Liao et al., Reference Liao, Rikke, Johnson, Diaz and Nelson2010), similar data in Drosophila have been so far limited to a few genetically distinct lines and to stressful environmental conditions (Leips & Mackay, Reference Leips and Mackay2000; Vieira et al., Reference Vieira, Pasyukova, Zeng, Hackett, Lyman and Mackay2000). Both lifespan and fecundity show evidence of line×food interactions (Tables 1 and 2). Thus, to the best of our knowledge, we have obtained the first data indicating the presence of genetic variation for the strength of dietary restriction effect on lifespan of both males and females in a set of lines representing standing variability in a natural population. Alternatively, the observed differences among lines may be due to the fixation of novel mutations acquired after establishing the lines. In this case, the genetic variation observed does not represent standing genetic variation in a natural population, but is nevertheless important for the understanding of the nature of dietary restriction. As the whole-genome genotype and whole-genome expression profiles of the core lines of the DGRP collection used in this study are known (Ayroles et al., Reference Ayroles, Carbone, Stone, Jordan, Lyman, Magwire, Rollmann, Duncan, Lawrence, Anholt and Mackay2009), these data will be used to identify structural and expression determinants of such variation (Yampolsky et al., in preparation).
It is important to remind the reader that these results are contingent upon the data conforming to the distributional assumptions of ANOVA F-tests. All kurtosis values were positive (distributions leptokurtic) and small; the highest value was observed for the median lifespan in males (1·66). While this inflates the power of the tests relative to what may be estimated on the assumption of normality, it is unlikely to greatly bias P-values (Zar, Reference Zar1999). As our design is somewhat unbalanced (the number of replicates per line×food combination varied from 2 to 5; 3–4 in the majority of cells), P-values are approximate in the case of unequal within-cell variances. This puts doubt on the tests for median lifespan in males and for fecundity, as there is evidence of significant heteroscedasticity in these tests (O'Brien test P<0·01, see Materials and methods section). Significant among-line variances for all tests, including these dubious two, are confirmed by Wilcoxon test, but the P-values for the food×line interaction should be taken with caution, at least for the median lifespan tests for males.
The trade-off between lifespan and fecundity apparent on the across-environment comparison is not observed across genotypes: all fecundity vs. lifespan covariances are non-negative. Because DGRP lines are inbred (and many have markedly reduced lifespan and fecundity), this may be explained by the different number of deleterious mutations fixed in each line, i.e. this result might not be observed in an outbred population. Alternatively, the lack of negative covariances between survival and reproduction may reflect among-line differences in resource acquisition rates or in other expenditures, such as locomotory activity or resource storage. However, no negative correlations have been observed between either lifespan or fecundity studied here and starvation resistance, locomotory activity and competitive fitness reported for the same lines (Ayroles et al., Reference Ayroles, Carbone, Stone, Jordan, Lyman, Magwire, Rollmann, Duncan, Lawrence, Anholt and Mackay2009; data not reported). Either way, it is worth noting that lifespan–fecundity correlations among lines are non-negative in flies maintained on both full and restricted food, and so there is no evidence of a conditional trade-off observed only under nutrient-poor conditions (Leroi et al., Reference Leroi, Chippindale and Rose1994; Marden et al., Reference Marden, Rogina, Montooth and Helfand2003).
We corroborate the recent suggestion that the lack of water in high-yeast media may cause an overestimation of dietary restriction effect (Ja et al., Reference Ja, Carvalho, Zid, Mak, Brummel and Benzer2009). In our data, both males and females lived somewhat longer on full food with nutrient-free water available (F+W) than on full food without water source (Figs 1(c) and (d)). In females, this difference was statistically significant and the examination of the survival curve (Fig 1(c)) reveals that early mortality was noticeably reduced by the addition of water source. On the other hand, in both males and females, mean and median lifespan in F+W treatment were closer to those on F medium, than to those on R medium, and the F+W vs. R comparison still shows a significant reduction of lifespan on yeast-rich medium, corroborating similar findings by Piper et al. (Reference Piper, Wong, Grandison, Bass, Martinez and Partridge2010).
Our results fully corroborate the recently described effect of addition of methionine and other essential amino acids to the media. Addition of all 10 essential amino acids to restricted medium (R+E treatment) had the effect nearly equivalent to the increase of yeast content from 5 to 15% in both fecundity and lifespan (Figs 1(e) and (f); Fig. 2(c)), despite much smaller increase in either caloric content or amino acid concentrations (see Materials and methods section). On the other hand, flies living on restricted medium with 1·5 mM methionine added (R+M) had a higher fecundity than flies on restricted medium, yet fully retained the life-expanding effect of restricted food (Figs 1(e) and (f); Fig. 2(c)). This result indicates that the dietary restriction may not be a manifestation of a mechanistic trade-off between survival and fecundity, but rather is a metabolic investment decision, which can be modulated by relatively small changes in amino acid composition of the diet. This is consistent with the lack of across-line negative correlations between lifespan and fecundity (Fig. 3), although this observation may have different explanations as well (see above). The lack of line×food interaction in amino acid and water experiments should not be interpreted as the evidence of lower genetic variation for these effects than for the general dietary restriction, observed in the R vs. F comparisons, because of smaller (and biased) set of lines used in these experiments.
The life-shortening effect of adding the essential amino acids to the media was stronger in females than in males (Figs 1(e) and (f)). In fact, the mean lifespan of males on R+E food was marginally different (P<0·05) from that of males on R food, while in females it was indistinguishable (P>0·1) from that of females on F food. This indicates that either the amino acid consumption underlies female, but not male dietary restriction, perhaps through regulation of investments into egg production, or that the addition of amino acids does not mediate dietary restriction directly, but through an interaction to which only females are sensitive. Given that both sexes were maintained together in our experimental setting, such an interaction may be related to cost of mating paid by females but not males.
What might be a mechanistic explanation of the changes to dietary restriction caused by the addition of nutrient-free water and methionine to the diet? Ja et al. (Reference Ja, Carvalho, Zid, Mak, Brummel and Benzer2009) proposed that water limitation apparent on media with high yeast content may contribute to dietary restriction of lifespan by causing flies to continue feeding beyond caloric saturation to avoid desiccation. A similar hypothesis may be formulated with respect to methionine. The dietary restriction effect of methionine addition to R food, observed in Grandison et al. (Reference Grandison, Piper and Partridge2009) and here, can be explained by the assumption that the amount of this essential amino acid consumed by flies is both the limiting factor for fecundity and the indication of saturation used by flies to stop feeding. Indeed, while feeding on restricted medium (i.e. 5% sugar+5% yeast, R food in this study) flies may continue feeding indefinitely, aiming to accumulate methionine (or other essential amino acids), thus overindulging on calories (hence short lifespan), but never actually reaching saturation on the amino acids (hence low fecundity). On an amino acid-rich and calorie-rich medium (i.e. 5% sugar +15% yeast, F food in this study) flies quickly saturate on amino acids (hence high fecundity), at the same time consuming enough calories to reduce lifespan. Finally, on calorically poor, but methionine-rich medium (i.e. R+M in this study) flies quickly saturate on methionine (hence increased fecundity) and reduce feeding rate before consuming too many calories (hence extended lifespan).
Protein limitation of reproduction in Drosophila has been well demonstrated (Lee et al., Reference Lee, Simpson, Clissold, Brooks, Ballard, Taylor, Soran and Raubenheimer2008; Grandison et al., Reference Grandison, Piper and Partridge2009 and references therein). In other dipterans (for example, in flesh fly Sarcophaga and in blood-sucking culicids) protein limitation of fecundity has also been extensively documented (K. Joplin, personal communication; Briegel, Reference Briegel1990; Klowden, Reference Klowden1990). On the other hand, for this hypothesis to hold, flies must have demonstrably higher feeding rate on restricted than on full food and this rate must be demonstrably modulated by the addition of methionine to the restricted food. Indeed, Drosophila can substantially modulate the amount of food consumed to adjust protein intake maximizing egg production (Lee et al., Reference Lee, Simpson, Clissold, Brooks, Ballard, Taylor, Soran and Raubenheimer2008; but see Min & Tatar, Reference Min and Tatar2006 and Partridge et al., Reference Partridge, Piper and Mair2005, Fig. 2). Yet, the reality is probably more complex than the above mechanistic hypothesis based on feeding stoppage signalling by methionine. For example, effects of dietary restriction can be partially eliminated by odours indicative of nutritional richness of the medium, without actual changes in the amount of amino acids, or any other nutrients, consumed by flies (Libert et al., Reference Libert, Zwiener, Chu, Vanvoorhies, Roman and Pletcher2007). A better understanding of the effects of dietary signals on feeding behaviour and life-history allocation decisions is necessary.
5. Author contribution
K. D. and L. Y. conducted lifespan experiments; C. R. and L. Y. conducted fecundity measurements; L. Y. designed the study, analysed the data and wrote the manuscript.
We are grateful to Trudy Mackay and Julien Ayroles for helpful discussions and to Emily Brown, Fred Hooker and Jordan VanHoy for laboratory assistance. The work was supported by NSF-0525447 and ETSU Honors College.
6. Supplementary material
The online data are available at http://journals.cambridge.org/GRH



