


Bacterial contamination of bovine colostrum (BC) is globally prevalent (Phipps et al., Reference Phipps, Beggs, Murray, Mansell, Stevenson and Pyman2016; Denholm et al., Reference Denholm, Hunnam, Cuttance and McDougall2017; Hyde et al., Reference Hyde, Green, Hudson and Down2020) and relevant to calf health since bacterial species (particularly coliforms) may inhibit absorption of IgG molecules through neonatal enterocytes (Godden et al., Reference Godden, Lombard and Woolums2019). It is hypothesised that the mechanisms for this include blocking channels for active pinocytosis and binding to IgG molecules in the gut lumen (Godden et al., Reference Godden, Lombard and Woolums2019). In addition, bacterial contamination of BC may include pathogenic species such as Salmonella sp. or Mycobacterium paratuberculosis.
Current industry standards for bacterial contamination in BC (<100,000 CFU/mL total bacteria counts [TBCs] and <10,000 CFU/mL total coliform counts [TCCs]) are globally accepted, but are based on US dairy calves (housed system and climate specific). These standards have also not been conclusively associated with calf morbidity, mortality or productivity outcomes (McGuirk and Collins, Reference McGuirk and Collins2004; Godden et al., Reference Godden, Lombard and Woolums2019), although some recent work has attempted to link bacterial contamination of BC with health outcomes (Mellado et al., Reference Mellado, Torres, Veliz, de Santiago, Macias-Cruz and Garcia2017).
Reference tests for measuring bacterial contamination in BC in colony-forming units per mL (CFU/mL) are 5% sheep blood agar plates for mesophilic, TBCs and MacConkey agar plates for TCCs. Sheep blood agar plates used in this capacity require incubation at 30°C for 72 hours, and MacConkey agar plates require incubation at 37°C for 48 hours (Harrigan and McCance, Reference Harrigan and McCance2014). Often, BC is highly contaminated (Haggerty et al., Reference Haggerty, Silva, Anderson, Bell, Mason and Denholm2025), requiring serial dilutions to obtain accurate bacterial counts; otherwise, samples are recorded as ‘too numerous to count’ (TNTC). Serial dilutions are time-consuming and require multiple handling of BC samples, since it is difficult to predetermine how contaminated BC samples are likely to be on visual inspection alone (Renaud et al., Reference Renaud, Kelton, LeBlanc, Haley, Jalbert and Duffield2017). Consequently, these laboratory-based testing strategies are costly and have relatively long turnaround times (Gomes et al., Reference Gomes, Barros, Castro-Tardón, Martin, Santos, Knöbl, Santarosa, Padilha and Hurley2023). Petrifilm systems have been validated for measurement of BC bacterial contamination (Morin et al., Reference Morin, Dubuc, Freycon and Buczinski2021; Anderson et al., Reference Anderson, Haggerty, Silva, Mason, Bell and Denholm2024). Petrifilms (separate TBC and TCC films) require incubation for shorter periods of 48 hours at 32 ± −2°C for aerobic bacteria counts and at 35 ± 2°C for 24 hours for coliform bacterial counts. Unlike agar plates, they also provide a ‘grid’ system, negating the requirement for multiple dilutions of BC. This expedites the process, and Petrifilms could conceivably be used in a rudimentary ‘in-house’ veterinary clinical laboratory, rather than sending samples away for commercial laboratory testing (Anderson et al., Reference Anderson, Haggerty, Silva, Mason, Bell and Denholm2024).
Despite the availability of the aforementioned laboratory measures, it is currently difficult to recommend a reliable ‘pen-side’ test for bacterial contamination of BC, although recently some authors have attempted to use ATPase luminometry. ATP is a cellular energy source, and its presence indicates surface organic material, including bacterial contamination (Finger and Sischo, Reference Finger and Sischo2001; Amodio and Dino, Reference Amodio and Dino2014). Swabbed ATP, from a surface of interest, reacts with luciferase (a light-generating enzyme) in a swab solution, and the resulting bioluminescence is proportional to the quantity of ATP present (quantified as relative light units) (Buczinski et al., Reference Buczinski, Morin, Roy, Rousseau, Villettaz-robichaud and Dubuc2022). Unfortunately, luminometer devices are also costly and have not been shown to be useful for liquid BC (Hoflack et al., Reference Hoflack, Penterman, Vertenten and Sustronck2024) but are more useful for ‘swabbing’ buckets and feeding equipment (Renaud et al., Reference Renaud, Kelton, LeBlanc, Haley, Jalbert and Duffield2017; Buczinski et al., Reference Buczinski, Morin, Roy, Rousseau, Villettaz-robichaud and Dubuc2022).
Bacteria in BC metabolise lactose to produce lactic acid, which conceivably affects the pH of BC (Saalfeld et al., Reference Saalfeld, Pereira, Borchardt, Sturbelle, Rosa, Guedes, Gularte and Leite2014, Reference Saalfeld, Pereira, Valente, Borchardt, Weissheimer, Gularte and Leite2016). It has been demonstrated that fresh individual cow colostrum has a pH of 5.6–6.6 (Stewart et al., Reference Stewart, Godden, Bey, Rapnicki, Fetrow, Farnsworth, Scanlon, Arnold, Clow, Mueller and Ferrouillet2005; Cummins et al., Reference Cummins, Berry, Murphy, Lorenz and Kennedy2017), and more recent work by Cuttance et al. (Reference Cuttance, Mason, Cranefield and Laven2025) suggested that pooled, seasonal colostrum samples measured pH 6.48–6.54. Bacterial overgrowth in colostrum may be associated with a decline in pH (Cummins et al., Reference Cummins, Berry, Murphy, Lorenz and Kennedy2017), and pH is a marker for fermentation (Saalfeld et al., Reference Saalfeld, Pereira, Valente, Borchardt, Weissheimer, Gularte and Leite2016). In fact, some research has advocated the making of ‘colostrum silage’ through anaerobic fermentation to preserve colostrum and inhibit bacterial proliferation (Saalfeld et al., Reference Saalfeld, Pereira, Valente, Borchardt, Weissheimer, Gularte and Leite2016). Previous research has reported that bacterial growth ceases at pH < 5.5 (Stewart et al., Reference Stewart, Godden, Bey, Rapnicki, Fetrow, Farnsworth, Scanlon, Arnold, Clow, Mueller and Ferrouillet2005), and it has been suggested that colostrum with a pH < 4 may have reduced palatability and digestibility for calves (Drevjany et al., Reference Drevjany, Irvine and Hooper1980). Several authors have reported that BC pH is high initially and decreases with time post-partum (Tsioulpas et al., Reference Tsioulpas, Grandison and Lewis2007; Jeong et al., Reference Jeong, Ham, Kim, Ahn, Chae, You, Jang, Kwon and Lee2009). The precise reason for the high pH of colostrum is unknown, although it is thought that during the pre-partum period, there is increased permeability of the mammary gland membranes and thus more blood constituents gain access to the milk (McGrath et al., Reference McGrath, Fox, McSweeney and Kelly2016).
The primary objective of the current work was to determine whether pH could be used as a proxy measure for bacterial contamination (using reference standard sheep blood agar plates to measure TBC and MacConkey agar plates to measure TCC) of BC. The hypothesis for this work was that bacteria produce acid by-products from their metabolism, thereby more highly contaminated BC is likely to be more acidic, based on lower pH measurement (Saalfeld et al., Reference Saalfeld, Pereira, Silveira, Schramm, Valente, Borchardt, Gularte and Leite2013). A secondary objective was to identify optimal thresholds for pH to identify colostrum highly contaminated with total bacteria or coliform species, with industry thresholds for highly contaminated colostrum being TBCs > 100,000 CFU/mL and TCCs > 10,000 CFU/mL (McGuirk and Collins, Reference McGuirk and Collins2004; Godden et al., Reference Godden, Lombard and Woolums2019).
Materials and methods
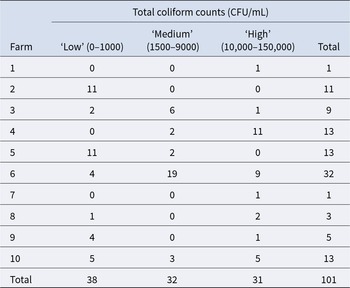
One hundred and one samples were purposively selected from previously frozen (at −20°C for 12 months) first milking BC samples, collected under University of Glasgow ethics licence (number ref EA21/25). Thirty-eight ‘low’ (initial TCC 0–1000 CFU/mL); 32 ‘medium’ (initial TCC 1500–9000 CFU/mL) and 31 ‘high’ (initial TCC 10,000–150,000 CFU/mL) BC samples were purposively selected from a total of 10 Scottish dairy farms, based on data from previous colostrum studies (Denholm et al., Reference Denholm, Baxter-Smith, Haggerty, Denholm, Williams and Vertenten2025; Haggerty et al., Reference Haggerty, Silva, Anderson, Bell, Mason and Denholm2025).
This study was completed using leftover samples from a previous study. Colostrum samples had been frozen for 2–4 weeks at the time of initial testing and then were refrozen for a further 12 months before testing for the current work. A necessary sample size of 77 colostrum samples was estimated based on receiver operator characteristic (ROC) area under the curve estimates of 0.85, type 1 error of 0.05 and power 0.9 with a 10% positive sample prevalence (MedCalc Software Ltd, version 22.018, Ostend, Belgium).
BC samples were thawed at room temperature (RT) for approximately 6 hours until fully defrosted, then vortexed to mix thoroughly. Samples were allowed to equilibrate to RT prior to testing, but the pH meter did not record the exact sample temperature. Sample pH was measured on undiluted colostrum samples using a pH meter (Fisherbrand Hydrus 300 serial number 006238, Caerphilly, CF83 3HU, UK), which was calibrated prior to use and recalibrated after testing every 30 samples. Samples were tested in duplicate to two decimal places, with mean values calculated and used in subsequent statistical analysis.
BC was then diluted using phosphate-buffered saline at a dilution rate of 1:100 or 1:1000 based on initial TBC contamination rates. For the purposes of bacteria counts, the reference tests of 5% sheep blood agar and MacConkey agar plates were used to measure TBC and TCC, respectively. A standard streak-plate technique was conducted on all samples using a sterile 10 μL disposable loop and standard milk culture quadrant streak techniques (Katz, Reference Katz2008). Plates were incubated at 30 ± 2°C for 72 hours for TBC and 37 ± 2°C for 48 hours for TCC, and colonies were counted using a colony counter (Stuart Scientific SC5 Colony Counter, Merck, Germany).
Statistical analysis
Data were analysed using Stata (Stata Corp., College Station, TX, USA, version 18). Descriptive statistics were calculated for the parameters of interest: TBC, TCC and pH. Pearson correlation coefficients were calculated for log-transformed TBC and pH; log-transformed TCC and pH; and log-transformed TBC and log-transformed TCC measures, in turn.
To test assumptions of normality, histograms were plotted for TBC, TCC and pH, and each measure was tested using the Shapiro–Wilk test for normality. Bacterial measures (TBC and TCC) were log-transformed due to non-normal distributions.
Scatter graphs were plotted to examine the relationship between TBC and pH, and TCC and pH. An intraclass correlation coefficient was calculated for the farm. Univariable mixed models were constructed using the ‘xtmixed’ function in Stata, using farm as a random effect, pH as the outcome of interest and log TBC and TCC as the predictors of interest.
A ROC curve was created to determine the optimal threshold (using TBC and TCC as reference standards) to accurately predict bacterial contamination (≥100,000 CFU/mL TBC and ≥10,000 CFU/mL TCC) of BC using pH measures. The Youden statistic (Youden, Reference Youden1950) was calculated based on the sum of the sensitivity and specificity, with equal weight given to both false positive and false negative results. The sensitivity (Se), specificity (Sp), positive predictive value, negative predictive value and accuracy were calculated at the given Youden index empirical cutpoint.
Results
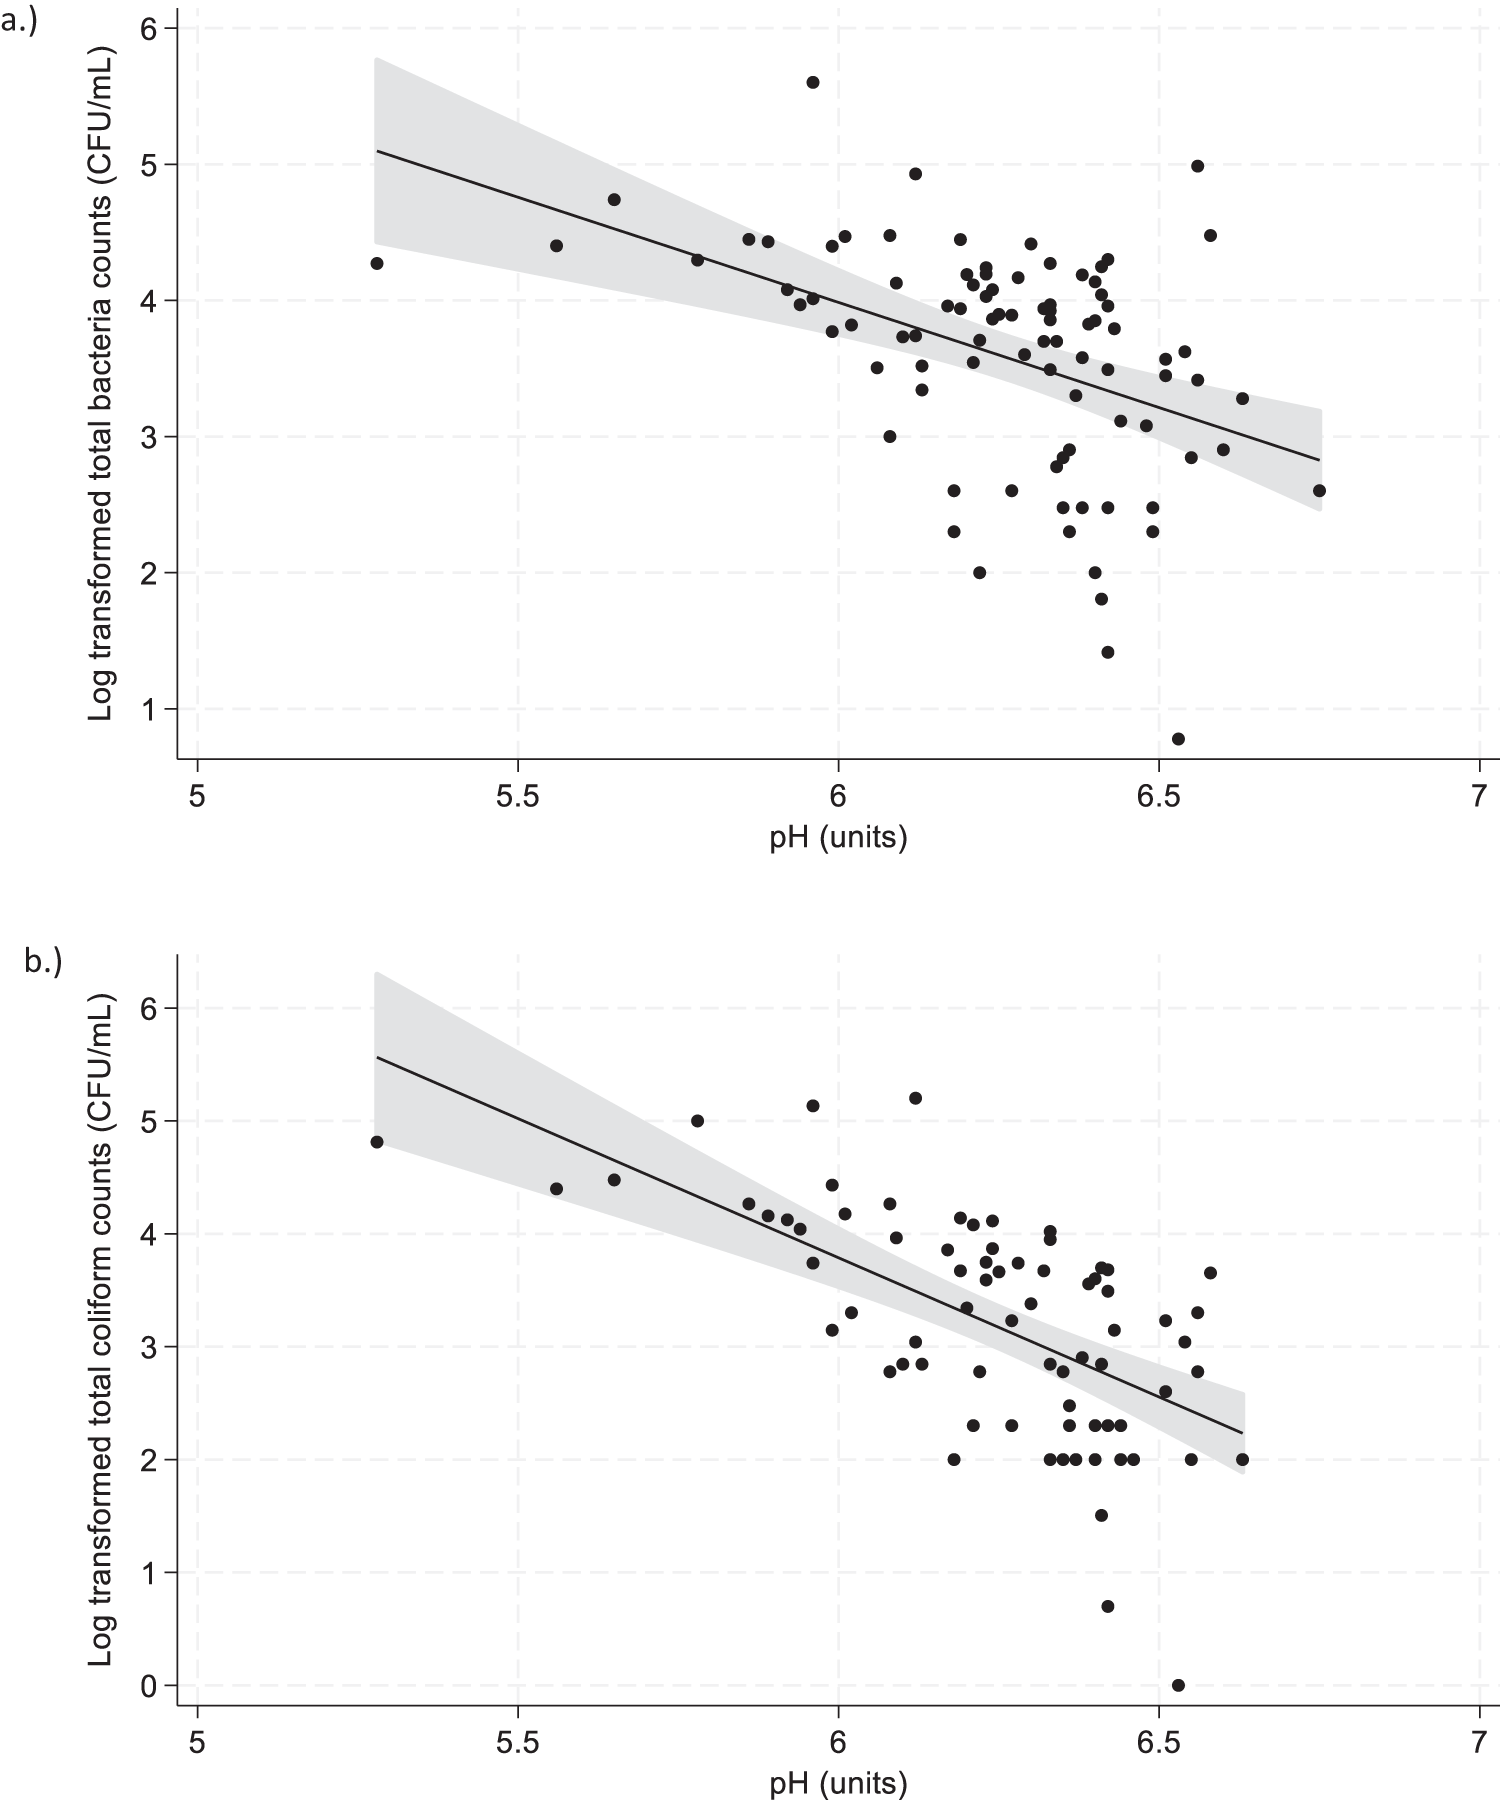
Table 1 shows the distribution of ‘low’, ‘medium’ and ‘high’ contaminated samples by farm for the 10 farms in the study cohort. Table 2 shows the descriptive statistics for each of the response variables of interest. For bacteriological measures (none of which were normally distributed), median, standard errors and interquartile ranges are reported together with means and standard deviations. Using international guidelines of 100,000 CFU/mL for TBC and 10,000 CFU/mL for TCC, n = 2/101 samples (1.98%) exceeded TBC thresholds, and n = 17/101 samples (16.83%) exceeded TCC thresholds. Pearson correlation between log-transformed TBC and TCC was high at r = 0.88. Pearson correlation between log-transformed TBC and pH was moderate at −0.44, and between log-transformed TCC and pH was moderate at −0.61.
Distribution of bovine colostrum samples purposively selected from 101 frozen stored (−20°C for 12 months) samples from 10 Scottish dairy farms to use in a comparison of testing trial to compare total bacteria counts and total coliform counts (CFU/mL) to pH measurements
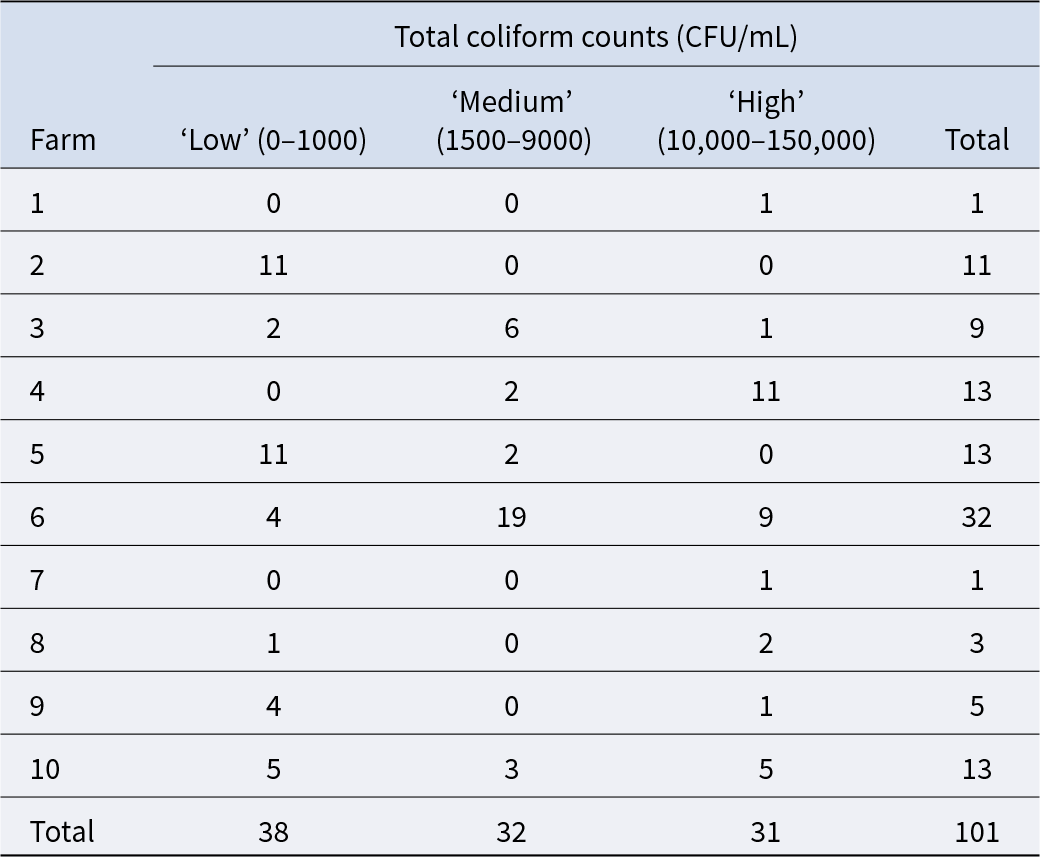
Table 1 Long description
The table reports how 101 bovine colostrum samples from 10 dairy farms are distributed across three total coliform count categories: low, medium, and high. Overall totals are 38 low, 32 medium, and 31 high, indicating a fairly even split with a slight tilt toward low counts. Farm 6 provided the largest number of samples (32), spread across all categories, including 19 medium and 9 high. Farms 4 and 10 show notable high counts, with 11 high out of 13 for Farm 4 and 5 high out of 13 for Farm 10. Farms 2 and 5 are dominated by low counts, each with 11 low and no high samples. Farms 1 and 7 each contributed only one sample, and both were in the high category. Because farms contributed different numbers of samples, comparisons between farms should consider the unequal sample sizes.
CFU/mL, colony-forming units per millilitre.
Descriptive statistics for total bacteria counts (CFU/mL), total coliform counts (CFU/mL) and pH for 101 frozen bovine colostrum samples from 10 Scottish dairy farms

Table 2 Long description
The table summarizes descriptive statistics for 101 frozen bovine colostrum samples, reporting total bacteria counts, total coliform counts, and pH. Total bacteria counts average 13,494.02 CFU per mL with a median of 5,000, ranging from 0 to 400,000, indicating a strongly skewed distribution with occasional very high values. Total coliform counts average 7,928.10 CFU per mL with a median of 600, ranging from 0 to 159,000, also showing substantial variability and a long upper tail. Variability is large for both microbial measures, with standard deviations of 41,674.35 for total bacteria and 23,772.74 for total coliforms, and interquartile ranges of 12,400 and 4,800 respectively. In contrast, pH is relatively stable, with a mean of 6.27, median of 6.33, and a narrow range from 5.28 to 6.75; its standard deviation and interquartile range are both 0.23. Standard errors are 4,146.75 for total bacteria, 2,365.48 for total coliforms, and 0.02 for pH. Because means are much higher than medians for the microbial counts, the averages are likely influenced by a small number of high-count samples.
CFU/mL, colony-forming units per millilitre.
Figure 1a and b shows the graphical relationship (including 95% confidence intervals around the fitted values) between the log-transformed TBC and pH and the log-transformed TCC and pH, respectively.
Scatter plot showing the relationship between pH and log-transformed (a) total bacteria counts (CFU/mL) and pH (b) total coliform counts (CFU/mL) in frozen bovine colostrum from 101 cows from 10 Scottish dairy farms. Grey shaded areas and dotted lines indicate the 95% confidence intervals around the fitted values.
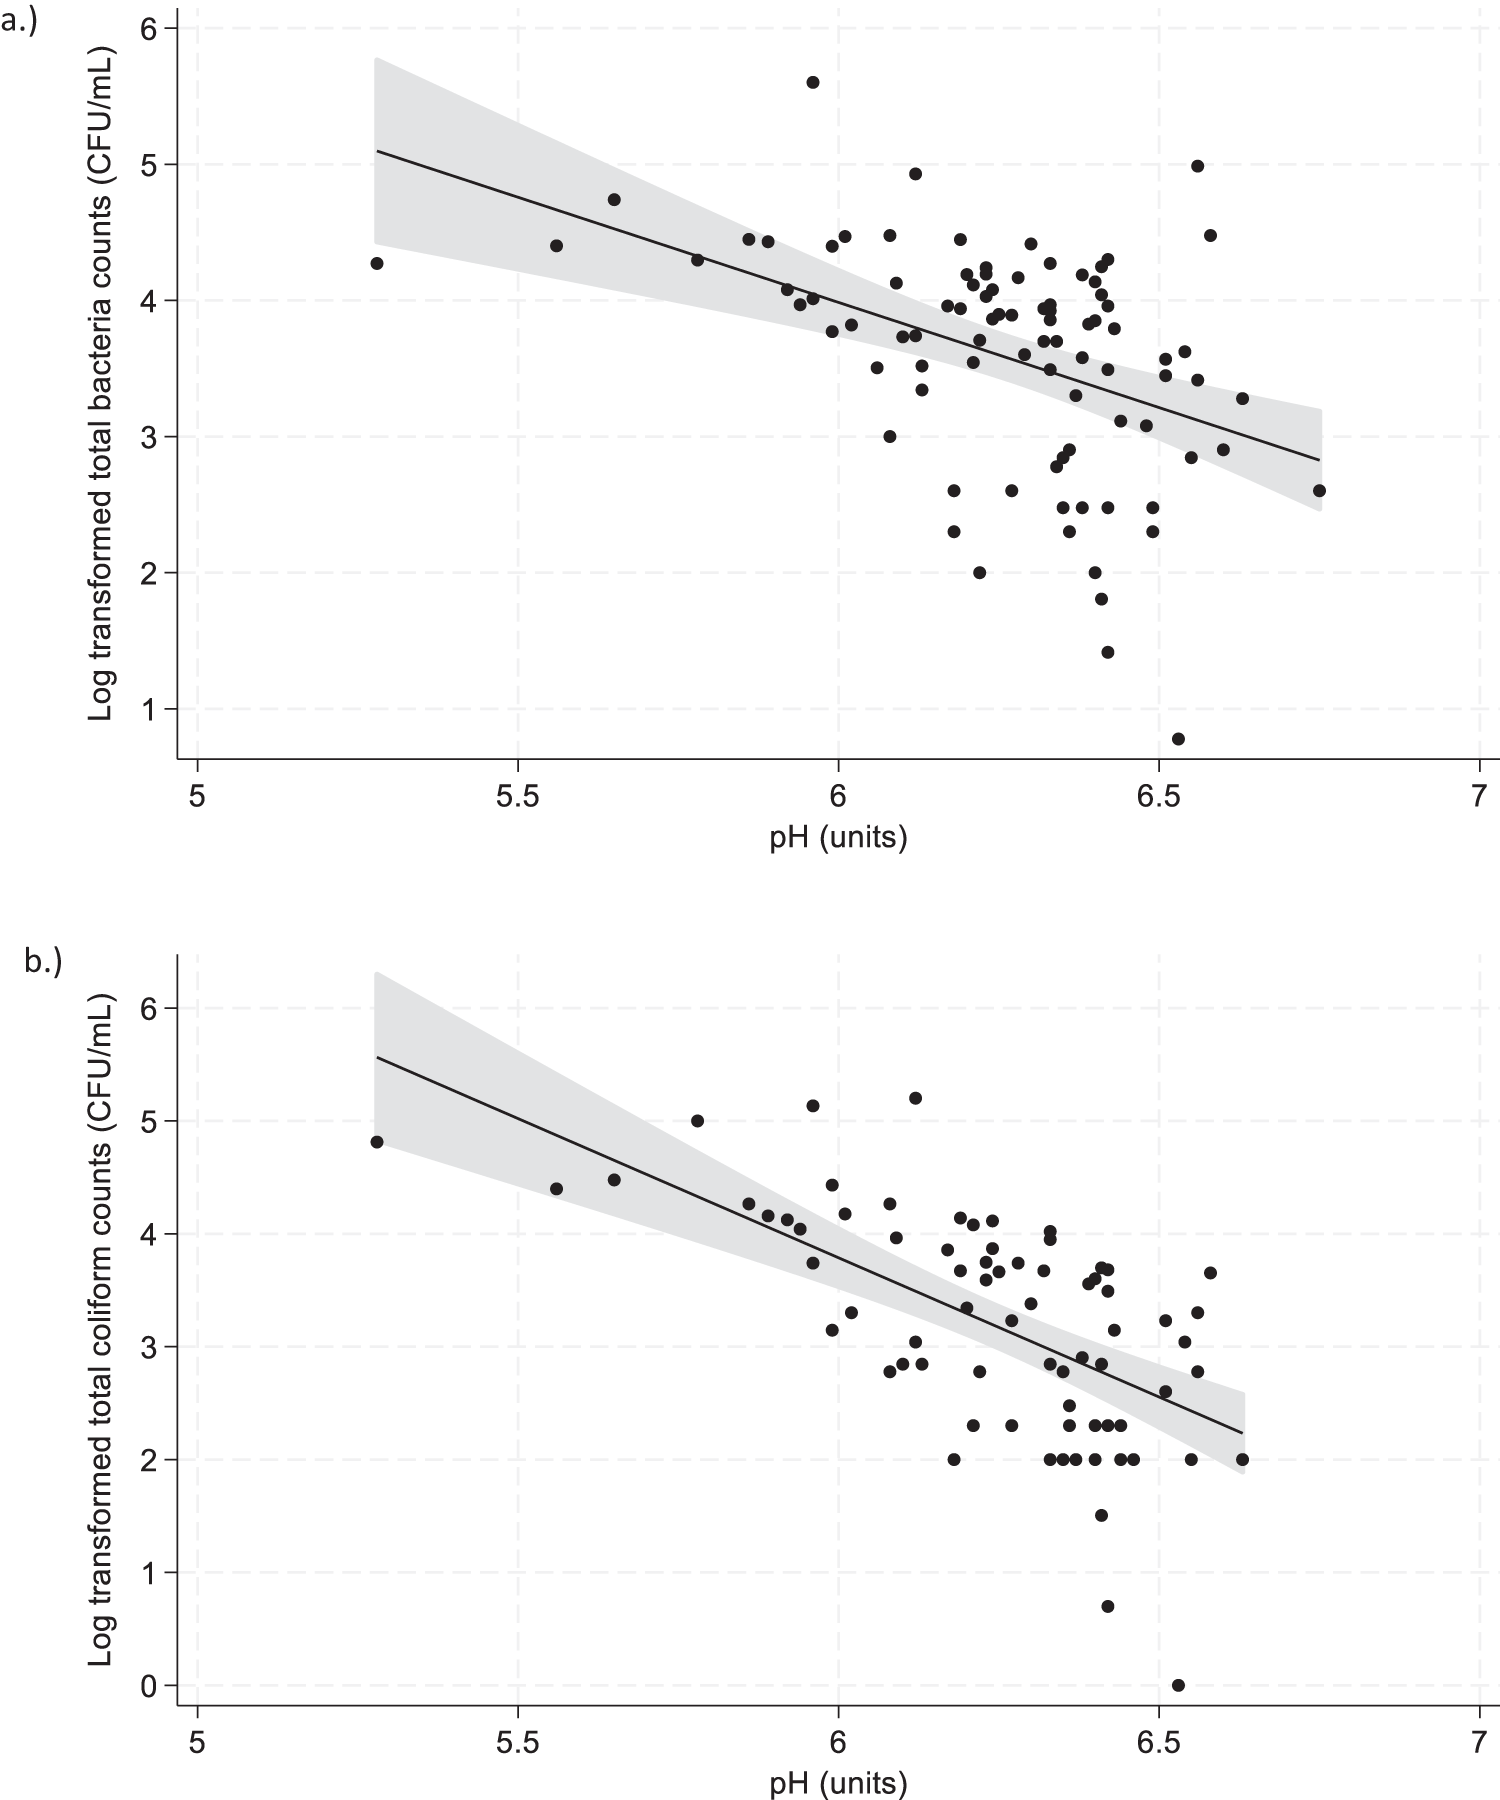
Figure 1 Long description
The first scatter plot labeled a) shows the relationship between pH and log transformed total bacteria counts (CFU/mL). The horizontal axis represents pH in units ranging from 5 to 7, while the vertical axis represents log transformed total bacteria counts ranging from 1 to 6. The plot indicates a downward trend, suggesting a negative correlation between pH and bacteria counts. Data points are scattered, with some clustering around pH values of 6 to 6.5. The fitted line is accompanied by a grey shaded area representing the 95 percent confidence interval. The second scatter plot labeled b) illustrates the relationship between pH and log transformed total coliform counts (CFU/mL). The horizontal axis represents pH in units ranging from 5 to 7 and the vertical axis represents log transformed total coliform counts ranging from 1 to 6. Similar to the first plot, there is a negative correlation between pH and coliform counts. Data points are more densely clustered around pH values of 6 to 6.5. The fitted line and grey shaded area indicate the 95 percent confidence interval around the fitted values.
The intraclass correlation coefficient for farm was 0.20 (SE = 0.12, 95% CI = 0.06–0.51). The null model showed that farm level variance was 0.01 (SD = 0.007, 95% CI = 0.003–0.04). Mixed models (including farm as a random effect) showed small changes in pH measurements of −0.12 (SE = 0.03; 95%CI = −0.18 to −0.06, p < 0.001) for every unit increase in logTBC and −0.15 (SE = 0.02; 95% CI = −0.19 to −0.10, p < 0.001) for every unit increase in logTCC.
As previously described, 38 samples, 32 samples and 31 samples were preselected (from frozen previous study samples) based on ‘low’, ‘medium’ and ‘high’ coliform counts, respectively. It is important to note that this sampling strategy was more suited to an exploratory association study and not optimal for identifying cutpoints. As such, ROC-derived thresholds are highly conditional on this particular frozen, purposively selected dataset.
Median pH for the preselected ‘low’ coliform count samples was 6.37 (range = 6.17–6.75), median pH for the preselected ‘medium’ coliform count samples was 6.26 (range = 5.65–6.60) and median pH for the preselected ‘high’ coliform count samples was 6.23 (range = 5.28–6.42). When samples were retested after freezing for around 12 months in the current work, 57 samples, 27 samples and 17 samples were in the ‘low’, ‘medium’ and ‘high’ coliform count categories, respectively. Median pH for the retested ‘low’ coliform count samples was 6.36 (range = 6.06–6.75), median pH for the retested ‘medium’ coliform count samples was 6.29 (range = 5.96–6.58) and median pH for the retested ‘high’ coliform count samples was 5.98 (range = 5.28–6.33).
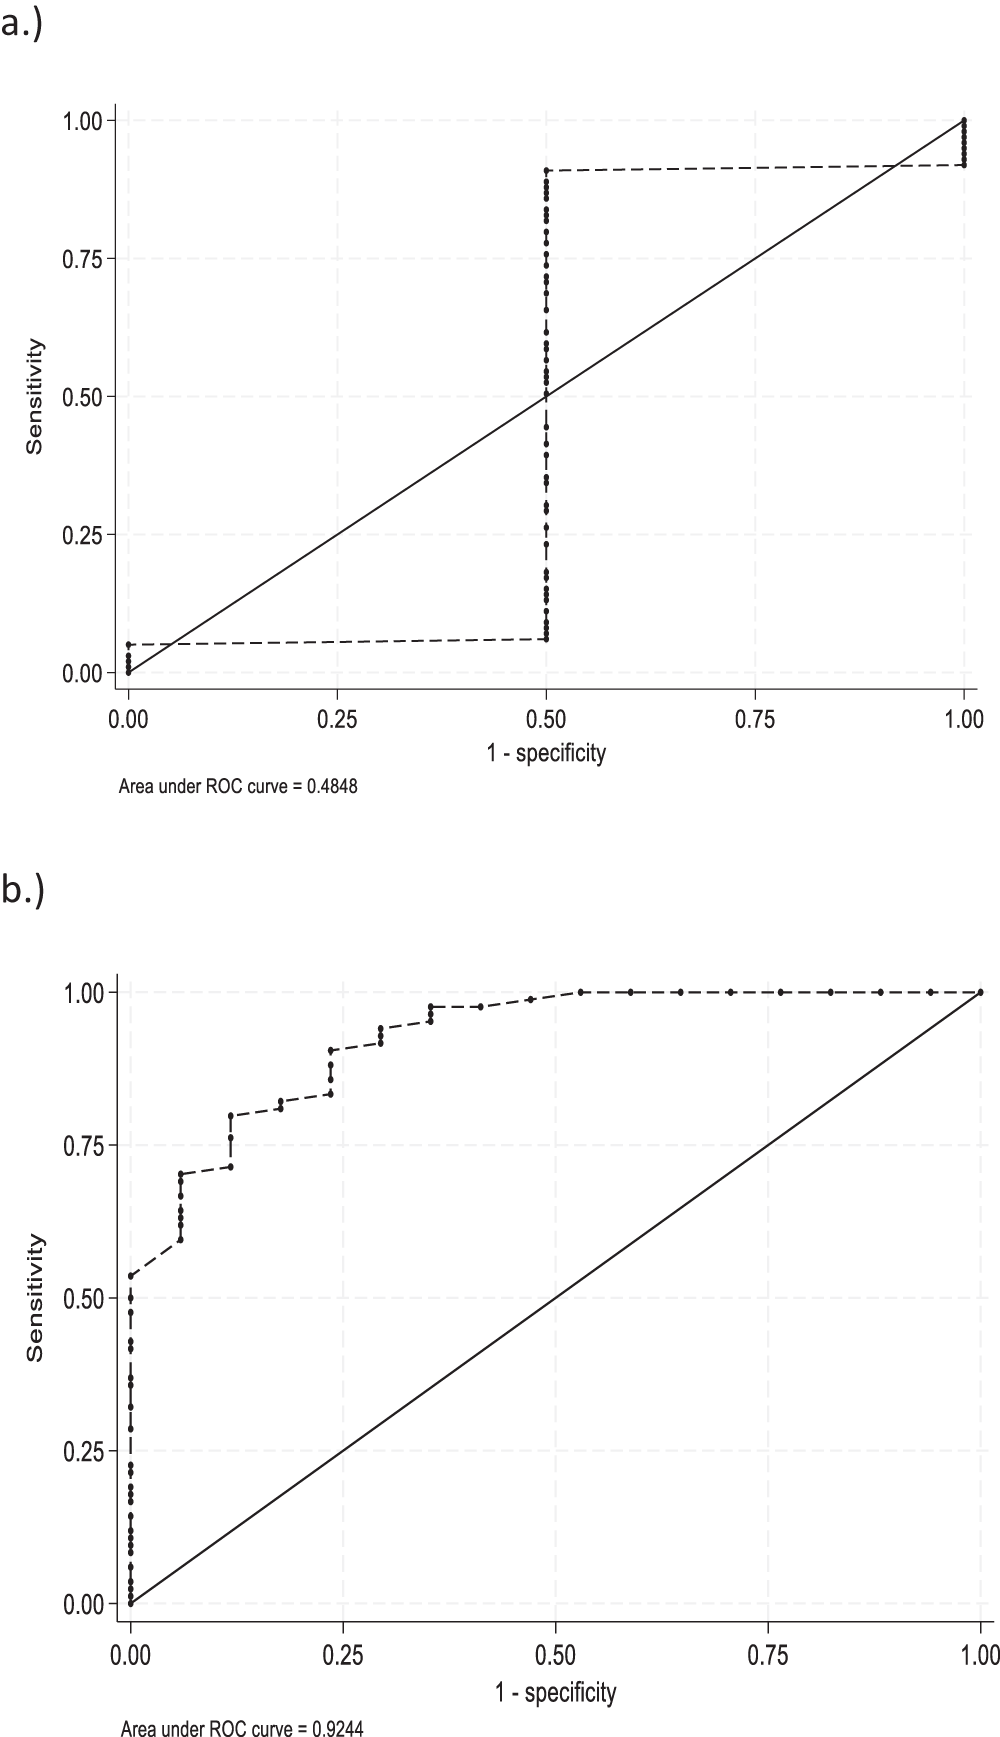
Figure 2a and b shows the ROC graphs for TBC and pH and TCC and pH, including empirical cutpoints identified by the Youden index: pH 5.96 for TBC ≥ 100,000 CFU/mL and pH 6.21 for TCC ≥ 10,000 CFU/mL. Table 3 summarises the pH test performance characteristics at the aforementioned, defined cutpoints. TBC cutpoints should be interpreted with caution since only two samples exceeded the TBC threshold, limiting extrapolation of meaningful diagnostic value.
Receiver operating characteristic (ROC) curve used to determine optimal cutpoints for diagnosing bacterial contamination (defined as (a) TBC ≥ 100,000 CFU/mL and (b) TCC ≥ 10,000 CFU/mL) using a pH meter in frozen bovine colostrum samples collected from 101 cows from 10 Scottish dairy farms.
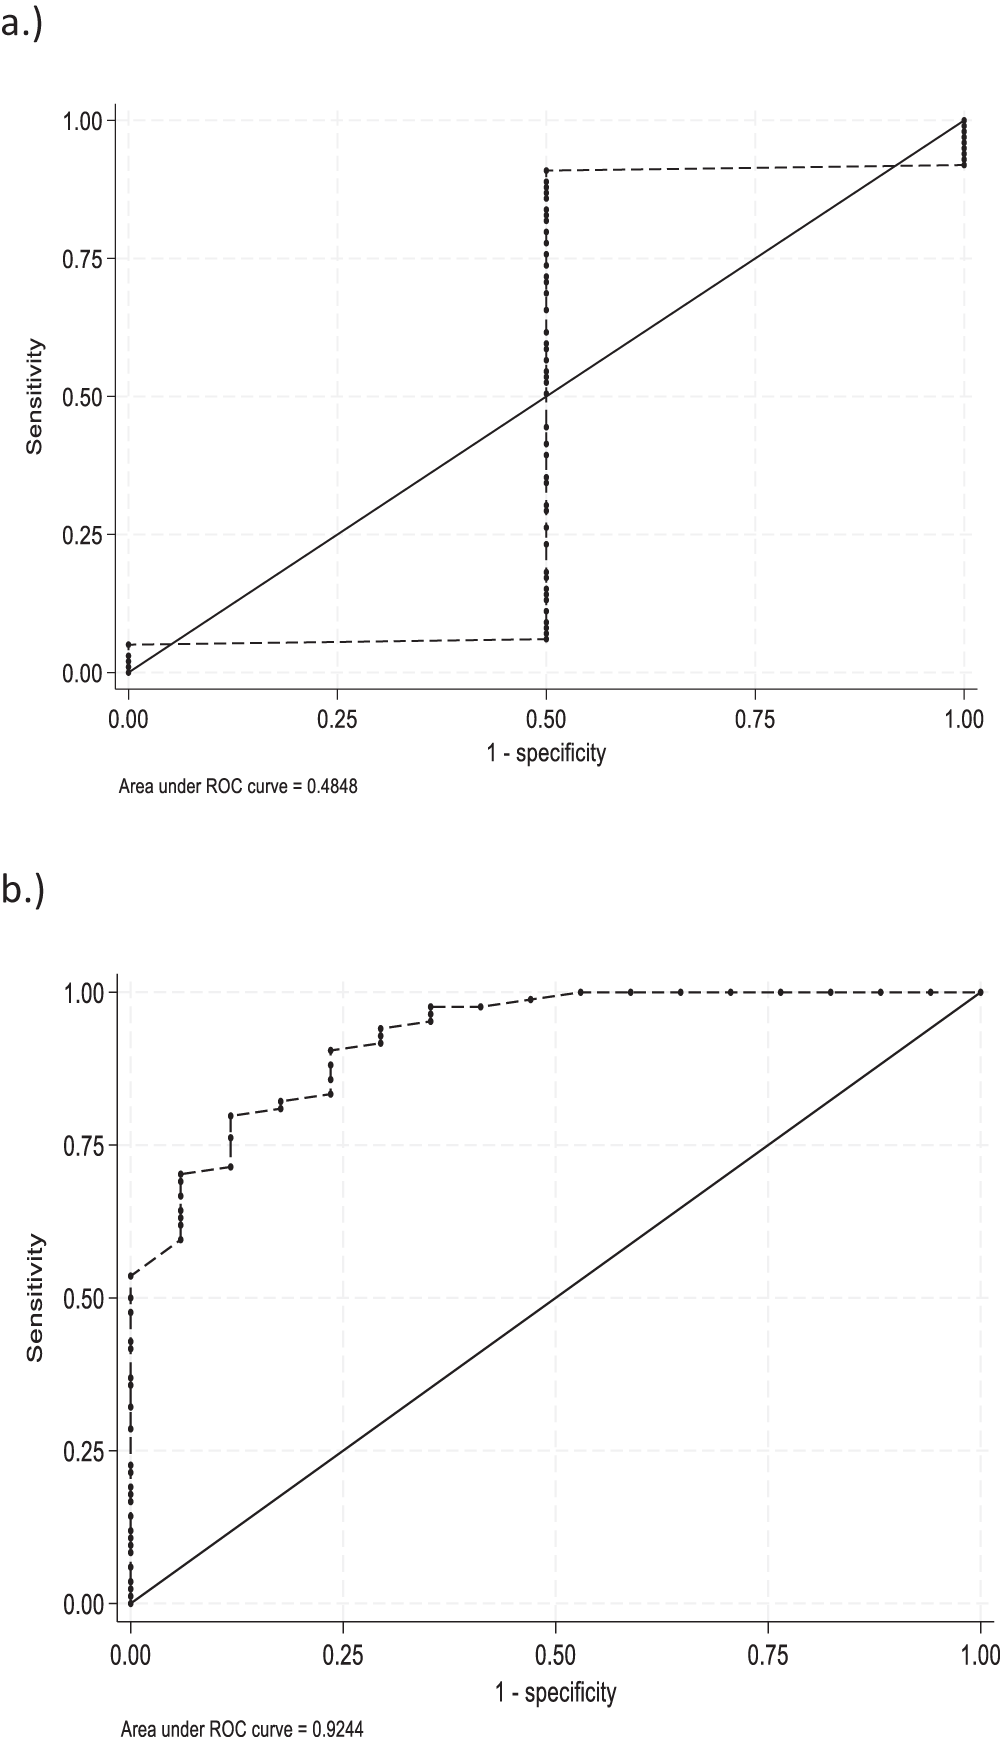
Figure 2 Long description
The image A showing a receiver operating characteristic plot labeled a.). The horizontal axis label is 1 minus specificity, with values from 0.00 to 1.00. The vertical axis label is Sensitivity, with values from 0.00 to 1.00. A solid diagonal line runs from left parenthesis 0.00, 0.00 right parenthesis to left parenthesis 1.00, 1.00 right parenthesis. A dashed step curve includes a horizontal segment near Sensitivity 0.05 from 1 minus specificity 0.00 to 0.50, a vertical segment at 1 minus specificity 0.50 from Sensitivity about 0.05 to about 0.90, a horizontal segment near Sensitivity 0.90 from 1 minus specificity 0.50 to 1.00 and a vertical segment at 1 minus specificity 1.00 from Sensitivity about 0.90 to 1.00. Text below the plot reads: Area under ROC curve equals 0.4848. The image B showing a receiver operating characteristic plot labeled b.). The horizontal axis label is 1 minus specificity, with values from 0.00 to 1.00. The vertical axis label is Sensitivity, with values from 0.00 to 1.00. A solid diagonal line runs from left parenthesis 0.00, 0.00 right parenthesis to left parenthesis 1.00, 1.00 right parenthesis. A dashed step curve starts at left parenthesis 0.00, 0.00 right parenthesis, rises vertically at 1 minus specificity 0.00 to about Sensitivity 0.55, then continues as step increases with points and short segments around: left parenthesis 0.05, 0.60 right parenthesis, left parenthesis 0.05, 0.70 right parenthesis, left parenthesis 0.10, 0.72 right parenthesis, left parenthesis 0.10, 0.80 right parenthesis, left parenthesis 0.15, 0.81 right parenthesis, left parenthesis 0.20, 0.83 right parenthesis, left parenthesis 0.22, 0.90 right parenthesis, left parenthesis 0.30, 0.93 right parenthesis, left parenthesis 0.35, 0.97 right parenthesis, left parenthesis 0.45, 0.98 right parenthesis, left parenthesis 0.50, 0.99 right parenthesis, then reaches Sensitivity 1.00 at about 1 minus specificity 0.55 and stays at Sensitivity 1.00 through to 1 minus specificity 1.00. Text below the plot reads: Area under ROC curve equals 0.9244.
Test results for pH measurements used to predict excessive bacterial contamination (≥100,000 CFU/mL TBC and ≥10,000 CFU/mL TCC) in bovine colostrum

Table 3 Long description
The table reports how well bovine colostrum pH cutpoints classify samples as having excessive bacterial contamination, evaluated separately for total bacteria counts and total coliform counts. For total bacteria, a pH cutpoint of 5.96 had sensitivity 0.50 (1 of 2 positives detected) with a wide confidence interval, and specificity 0.91 (90 of 99 negatives correctly identified). At this cutpoint, positive predictive value was 0.10 (1 of 10), negative predictive value was 0.99 (90 of 91), likelihood ratio positive was 5.56, likelihood ratio negative was 0.55, and accuracy was 0.90 (91 of 101). For total coliforms, a pH cutpoint of 6.21 performed better for finding positives, with sensitivity 0.88 (15 of 17) and specificity 0.80 (67 of 84). At this cutpoint, positive predictive value was 0.47 (15 of 32), negative predictive value was 0.97 (67 of 69), likelihood ratio positive was 4.36, likelihood ratio negative was 0.15, and accuracy was 0.81 (82 of 101). Overall, the coliform cutpoint shows higher sensitivity but lower specificity than the total bacteria cutpoint, and predictive values may not generalize because they depend on prevalence and the sampling approach.
TBCs, total bacteria counts; TCCs, total coliform counts; PPV, positive predictive value; NPV, negative predictive value; LR+, positive likelihood ratio for detecting excessive bacterial contamination; LR−, negative likelihood ratio for detecting excessive bacterial contamination.
Note: PH thresholds were based on optimised values from receiver operating characteristic curve analysis. $\text{Accuracy}\,\,=\,\,\frac{{true\,positives + true\,negatives}}{{total\,number\,of\,samples}}$;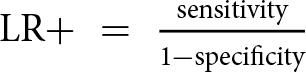 $\text{LR}+\,\,=\,\,\frac{{{\text{sensitivity}}}}{{1 - {\text{specificity}}}}$;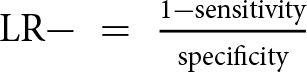 $\text{LR}-\,\,=\,\,\frac{{1 - {\text{sensitivity}}}}{{{\text{specificity}}}}$.
Note that the purposive sampling strategy was more suited to an exploratory association study and not optimal for identifying cutpoints. PPV and NPV are prevalence dependent, so may not be extrapolated to field populations.
Discussion
The objective of the current work was to determine whether pH could be used as a proxy measure for bacterial contamination of BC. Every unit increase in logTBC and logTCC resulted in decreases of pH of 0.12–0.14 units in the current work. Cummins et al. (Reference Cummins, Berry, Murphy, Lorenz and Kennedy2017) also showed a decrease in pH of 0.07–0.23 pH units for every unit increase in logTBC, and decreasing pH was associated with increasing bacterial and coliform counts (p < 0.001) from pooled seasonal samples (Denholm et al., Reference Denholm, Hunnam, Cuttance and McDougall2017).
In the current work, samples were purposively selected based on previous TCC (CFU/mL) of low, medium and high levels of contamination, as described. Measures of pH were more closely associated with TCC measures than TBC measures, and ROC analysis revealed poor sensitivity for pH for TBC measures (although only two measures exceeded thresholds). The sample size AUC estimation of 0.85 may have been overly ambitious, meaning the study was underpowered to identify cutpoints, particularly with respect to TBC measures.
The premise of this work was that bacteria produce acid by-products from their metabolism, thereby more highly contaminated first milking BC was likely to be more acidic, based on lower pH measurement (Saalfeld et al., Reference Saalfeld, Pereira, Silveira, Schramm, Valente, Borchardt, Gularte and Leite2013). All samples used in this analysis were first milking BC samples. Coliform species metabolise lactose to lactic acid, but since colostrum is significantly lower in lactose (2.9% versus 4.6%) than mature milk (Puppel et al., Reference Puppel, Golebiewski, Grodkowski, Slosarz, Kunowska-slosarz, Solarczyk, Lukasiewicz, Balcerak and Przysucha2019), it is hypothesised that the effect of this metabolism may be more pronounced in mature milk, and the relationship between bacterial contamination and pH may differ in transition milk (milkings 2–6 post-calving), or whole milk compared to colostrum. In some work, transition milk pH was measured at day 5 post-partum at 6.49 ± 0.1 compared with the pH of 6.63 measured in whole milk over a complete lactation (Tsioulpas et al., Reference Tsioulpas, Grandison and Lewis2007). Further work should explore the relationship between pH and bacterial contamination in transition milk.
Denholm et al. (Reference Denholm, Hunnam, Cuttance and McDougall2017) tested 298 pooled BC samples (in contrast to the individual cow colostrum samples tested in the current study) and showed a mean pH of 5.8 (SD 0.7) and a range between 4.2 and 9.4. Mean pH of these pooled, seasonal samples decreased from 5.97 to 5.58 for early and late-season samples, respectively (p < 0.001), which is a much lower pH measurement than for individual cow colostrum samples, possibly indicative of accumulation of bacterial contamination as the seasonal system progresses (Denholm et al., Reference Denholm, Hunnam, Cuttance and McDougall2017). Seasonal, pooled samples (n = 10) were also collected by Cuttance et al. (Reference Cuttance, Mason, Cranefield and Laven2025) with a mean pH of 6.48 and a rapid decline in mean pH at day 7 to 4.4.
Individual colostrum samples (n = 15) were collected and tested in other recent work, showing a mean pH of 6.09 at day 0 and a drop to a mean pH of 4.55 at day 5 in RT samples (Godden et al., Reference Godden, Royster, Timmerman, Crooker and Brown2025). The individual cow samples (n = 101) in the current work had a slightly higher initial mean pH of 6.27 (range 5.28–6.75).
Much of the bacterial contamination in colostrum is ‘iatrogenic’, stemming from harvest, storage and feeding equipment (Hyde et al., Reference Hyde, Green, Hudson and Down2020; Haggerty et al., Reference Haggerty, Silva, Anderson, Bell, Mason and Denholm2025). There is also a group of mesophilic bacteria loosely termed ‘lactic acid bacteria’ known for the production of lactic acid in their metabolism (Saalfeld et al., Reference Saalfeld, Pereira, Silveira, Schramm, Valente, Borchardt, Gularte and Leite2013), and these species would have been measured in a wider population on the sheep blood agar plates in the current work. Saalfeld et al. (Reference Saalfeld, Pereira, Valente, Borchardt, Weissheimer, Gularte and Leite2016) reported that lactic acid bacteria counts stabilised at around 107 CFU/mL at 14 days in samples stored at ambient temperatures; however, it is unlikely that these populations reached maximum thresholds in the colostrum used in the current work since this colostrum was stored frozen shortly after harvest. It has been suggested that some bacterial species, such as Lactobacillus and Bifidobacterium, may be beneficial to the calf gut microbiome (Frizzo et al., Reference Frizzo, Soto, Zbrun, Bertozzi, Sequeira, Armesto and Rosmini2010) and have probiotic potential (Holzapfel et al., Reference Holzapfel, Haberer, Geisen, Björkroth and Schillinger2001; Giraffa, Reference Giraffa2003), such that not all bacterial species measured in the TBC counts in the current work are detrimental to calf health and immune function.
It is important to note that calves refuse more milk replacer preserved at pH 4.2 than at 5.2, since low pH colostrum and milk is unpalatable (Hill et al., Reference Hill, Bateman, Aldrich, Quigley and Schlotterbeck2013). Collings et al. (Reference Collings, Proudfoot and Veira2011) demonstrated rejection of milk replacer acidified to pH 4.3–4.4. While it is known that pH is likely to influence the palatability and consumption of colostrum (Jenny et al., Reference Jenny, Costello and Van Dijk1980), colostrum pH in this work did not fall below 5.28, and these samples were highly contaminated with coliform bacteria (65,000–80,000 CFU/mL), so the contamination level and palatability of colostrum may not be linked.
Study limitations
Tests were carried out on frozen samples, and bacterial contamination may have been different from that in fresh colostrum, although samples were stored in temperature-monitored freezing facilities at −20°C to ensure consistency of storage conditions. Colostrum dilution rates for bacteriology were determined prior to thawing for the current work, based on previous bacteriology measures, which may have influenced results since the distribution of low, medium and highly contaminated samples changed after frozen storage, but this was deemed necessary to limit the numbers of TNTC measures. Some work has suggested that coliform bacterial counts may be underestimated in frozen substrates (Fusar Poli et al., Reference Fusar Poli, Monistero, Pollera, Freu, Bronzo, Piccinini, Nocetti, Sala, Veiga Dos Santos, Moroni and Addis2024), and in the current work, more samples were categorised in the ‘low’ category (0–1000 CFU/mL) after freezing for up to 12 months, affecting the interpretation of both the association and ROC analysis. Additionally, studies have also reported that the pH of milk can decrease slightly with freezing (Van Den Berg, Reference Van Den Berg1961); however, this did not substantially influence the relationship between bacterial and pH measures since both were measured concurrently on the same frozen samples. Lactic acid-producing species were not measured independently from total mesophilic bacteria counts on sheep blood agar plates. By international guidelines, only two samples exceeded the TBC threshold, despite purposive selection of samples to be of ‘low’, ‘medium’ and ‘high’ contamination; thus, TBC ROC analysis was not robust for this dataset.
As mentioned, the purposive sampling strategy used in the current work was better suited to an exploratory association study rather than to explicitly identify optimal pH cutpoints, which would have been better achieved using a representative field population. ROC-derived thresholds are highly conditional on this particular frozen, purposively selected dataset. TBC ROC data have been retained in this work for completeness, but results are largely exploratory and associative rather than providing meaningful diagnostic value.
The pH meter used in this work was a laboratory-based piece of equipment, and handheld devices, such as those that may be suitable for on-farm use, may not be as accurate and will certainly require frequent calibration (which is much easier to do in a laboratory rather than a farm setting). Although pH measures were measured in duplicate, bacteria counts were measured on one of each sheep blood agar plate and MacConkey agar plate, due to budgetary and time constraints, which introduced an element of measurement uncertainty. The temperature of individual colostrum samples was not measured, although all samples were allowed to equilibrate at ambient temperatures in the laboratory prior to testing.
Conclusion
Small decreases in pH may be associated with increases in bacterial contamination of BC, particularly coliform species, which are those most implicated in the disruption of IgG absorption from colostrum. There was a statistically significant relationship between pH measurements and log-transformed bacterial measurements. It would be useful to repeat this work using a pH meter in fresh (unfrozen) colostrum samples. The data support an association between lower pH and higher bacterial counts in frozen stored samples, especially for TCC. More data is needed to justify the use of a pH meter as a practical screening test for excessive contamination, particularly for TBC.
Acknowledgements
Thank you to all the farmers who collected samples for this work and to Alexandra Haggerty for her help. Thank you also to Becky Orr and Fiona Mackintosh at the internal laboratories at the University of Glasgow for their help and support with this project. Thank you to Rheinallt Jones for his help with this work.
Data availability statement
The data that support the findings of this study will be made available upon reasonable request from the corresponding author.



 Open access

