


1. Introduction
Radar sounders are active sensors with nadir-looking geometries used for both Earth observation (Peters and others, Reference Peters, Blankenship, Carter, Kempf, Young and Holt2007) and planetary science (Bruzzone, Reference Bruzzone2015). Operating at low frequencies (between HF and UHF), sounders can probe the interior of ice sheets, glaciers and icy moons. Airborne radar sounding has been used to characterize a range of ice-sheet properties including subglacial water (Chu and others, Reference Chu, Schroeder, Seroussi, Creyts, Palmer and Bell2016), ice-sheet surface roughness (Grima and others, Reference Grima, Blankenship, Young and Schroeder2014), basal geometry (Jordan and others, Reference Jordan, Cooper, Schroeder, Williams, Paden, Siegert and Bamber2017) and basal thermal state (Peters and others, Reference Peters, Blankenship, Carter, Kempf, Young and Holt2007; Schroeder and others, Reference Schroeder, Seroussi, Chu and Young2016) in Antarctica and Greenland. Additionally, radar signals reflect off of englacial dielectric discontinuities, imaging isochronous layers encoding information about ice deformation, flow history and surface accumulation (Fettweis, Reference Fettweis2007; MacGregor and others, Reference MacGregor, Fahnestock, Catania, Paden, Gogineni, Young, Rybarski, Mabrey, Wagman and Morlighem2015; Cavitte and others, Reference Cavitte, Blankenship, Young, Schroeder, Parrenin, Lemeur, Macgregor and Siegert2016).
Each range nadir line is collected at the Pulse Repetition Frequency (PRF) and processed in the along-track direction to generate 2D images of the subsurface. Azimuth processing reduces along-track clutter, increases the Signal-to-Noise ratio (SNR) and improves the azimuth resolution (Legarsky and Gogineni, Reference Legarsky and Gogineni1998; Leuschen and others, Reference Leuschen, Gogineni and Tammana2000; Legarsky and others, Reference Legarsky, Gogineni and Akins2001; Peters and others, Reference Peters, Blankenship, Carter, Kempf, Young and Holt2007; Kusk and Dall, Reference Kusk and Dall2010). However, an unfortunate side-effect is that signal from steeply sloping layers may be lost (Holschuh and others, Reference Holschuh, Christianson and Anandakrishnan2014). This can occur because of (i) aliasing due to an insufficient PRF, (ii) an insufficient receive window length, (iii) exceeding the critical angle of refraction at the air–ice interface or (iv) destructive interference during along-track processing (Holschuh and others, Reference Holschuh, Christianson and Anandakrishnan2014) (see Fig. 1). This study focuses on addressing the fourth scenario.
Comparison of unfocused processing effects on flat (above) and sloping (below) subsurface layers. The difference in instantaneous phases within the coherent summation window can destroy steep layers (see also Holschuh and others, Reference Holschuh, Christianson and Anandakrishnan2014).
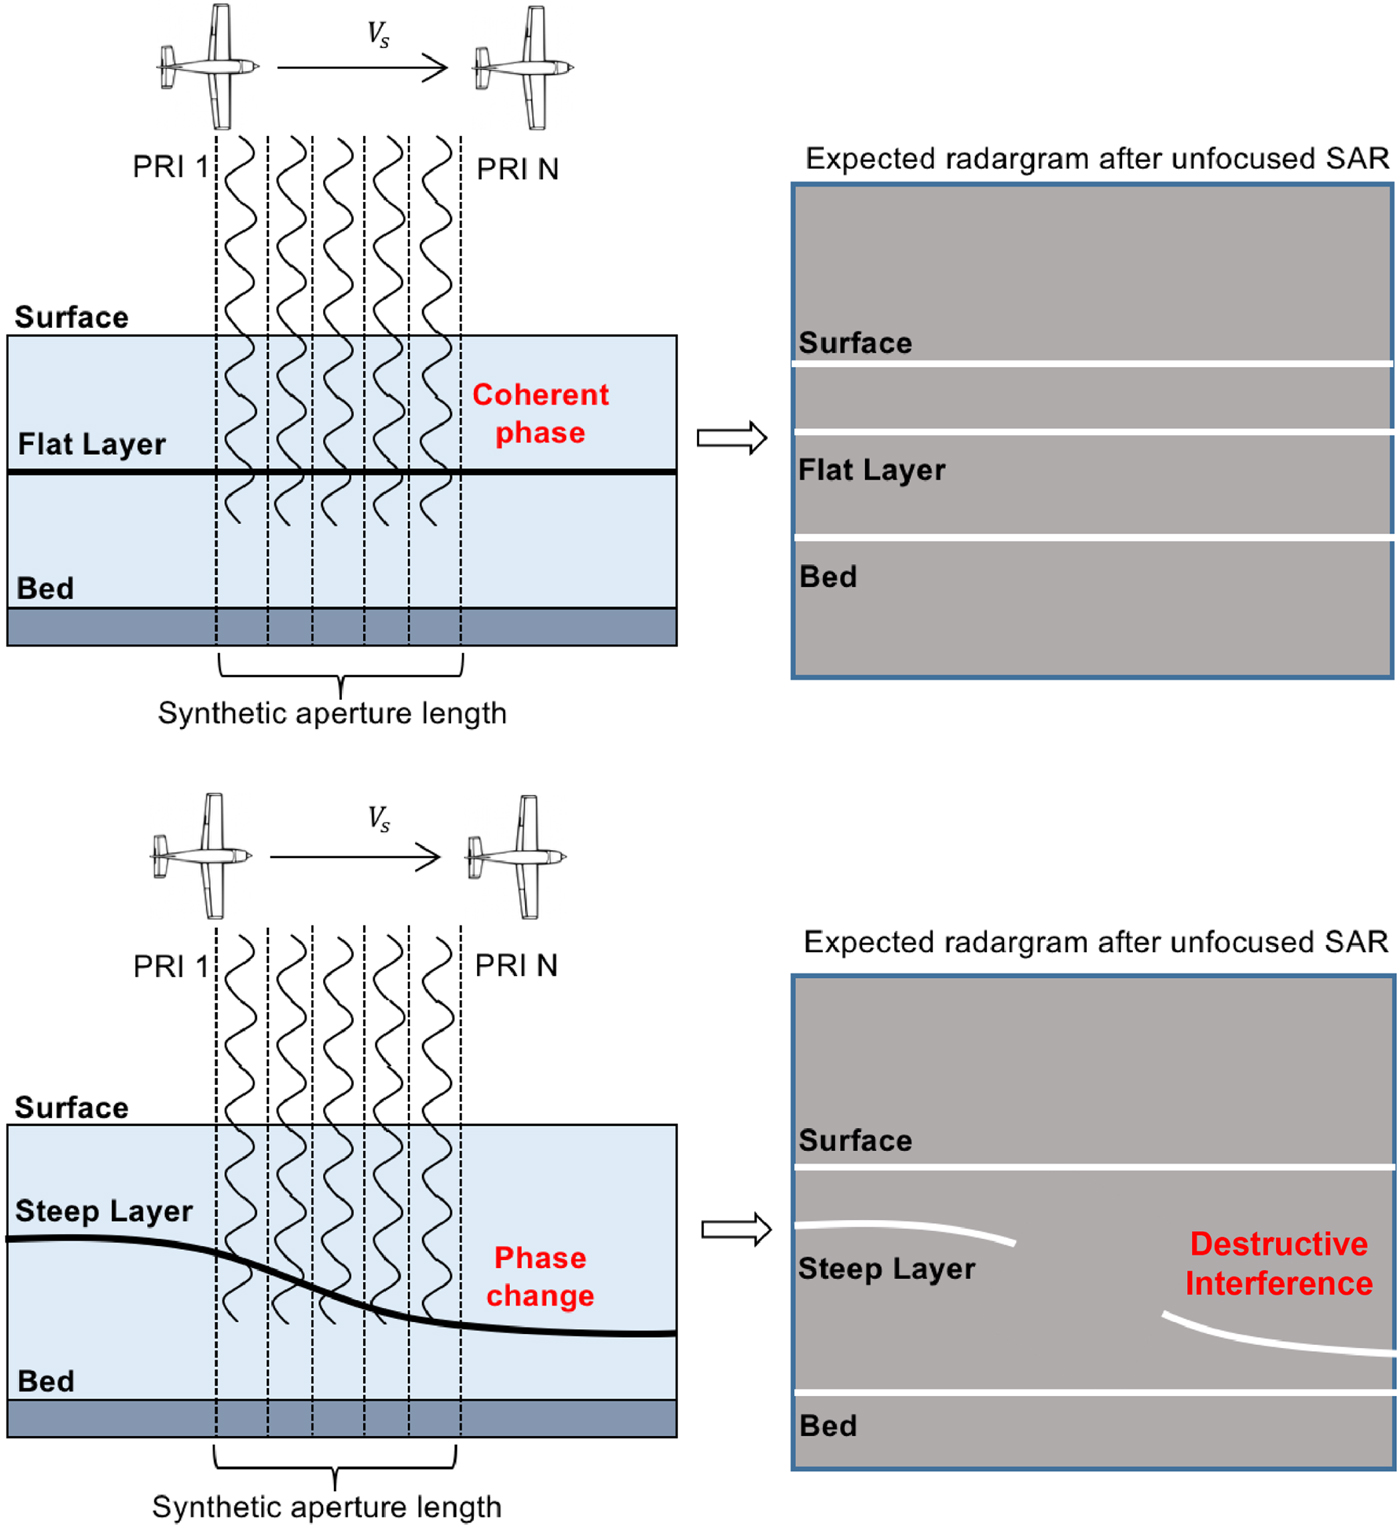
In Holschuh and others (Reference Holschuh, Christianson and Anandakrishnan2014), the authors discussed this processing issue focusing on the quantification of power loss due to steeply dipping internal layers. In particular, they show that coherent stacking of adjacent range lines reduces the SNR of non-horizontal layers. Coherent summation over the synthetic aperture includes reflection arrivals that are not in phase, generating destructive interference in the processed signal. This reflection loss can destroy layer signals and obfuscate automatic or manual tracing and interpretation (e.g., Ferro and Bruzzone, Reference Ferro and Bruzzone2013; MacGregor and others, Reference MacGregor, Fahnestock, Catania, Paden, Gogineni, Young, Rybarski, Mabrey, Wagman and Morlighem2015; Cavitte and others, Reference Cavitte, Blankenship, Young, Schroeder, Parrenin, Lemeur, Macgregor and Siegert2016; Carrer and Bruzzone, Reference Carrer and Bruzzone2017). To address this, we develop a novel layer-specific radar sounder processing technique that enhances echoes from sloping, specular (Schroeder and others, Reference Schroeder, Blankenship, Raney and Grima2015) englacial layers in radar sounder data. Our approach exploits the relation between acquisition geometry and the phase shift that best recovers destroyed layers to automatically compute their slope. We avoid destructive summation among the reflected echoes by identifying and applying slope-specific phase corrections to adjacent signals within an aperture. This has three important properties: (i) it allows the use of larger apertures and therefore higher SNRs and more precise slope estimates than point-scatterer-based techniques, (ii) it recovers steep slopes (including those beyond PRF sampling limits) and (iii) it automatically extracts the slope of layers (including layers with along-track range variability smaller than a single range bin).
The processing algorithm we propose overcomes long-standing issues related to manual layer tracing, specifically accuracy issues in the computation of derivatives of layer position, as well as the ambiguity arising from destructive interference of steeply dipping layers (Holschuh and others, Reference Holschuh, Parizek, Alley and Anandakrishnan2017). The ability of our processor to provide automatic, high precision slope estimates for both steep and shallow layers is appealing for ice-sheet modeling purposes, as the local slope of layers relates directly to the local velocity field (e.g., Parrenin and others, Reference Parrenin, Hindmarsh and Rémy2006). For similar reasons, layer slope estimation was recently addressed in Holschuh and others (Reference Holschuh, Parizek, Alley and Anandakrishnan2017), in which the authors present an algorithm based on the Radon transform. This method was originally developed to coherently interpret layers in seismic data and, when applied on radar sounder data, is more robust to reflection strength variability than other methods proposed in the past (e.g. Panton, Reference Panton2014). However, the method by Holschuh and others (Reference Holschuh, Parizek, Alley and Anandakrishnan2017) still requires layers to be visible in images, which is not the case for steeply dipping layers that are affected by destructive interference. Recent advances in radar sounder data analysis (Heister and Scheiber, Reference Heister and Scheiber2018) have enabled the direct extraction slope information before azimuth processing, but still assumes point target-based processing.
In the following sections we first present layer-optimized synthetic aperture radar (LO-SAR) processing for radar sounder imaging (Section 2) and layer slope estimation (Section 3). In Section 4, we discuss an application to airborne radar sounder data acquired by the British Antarctic Survey PASIN radar system.
2. SAR processing for layer enhancement
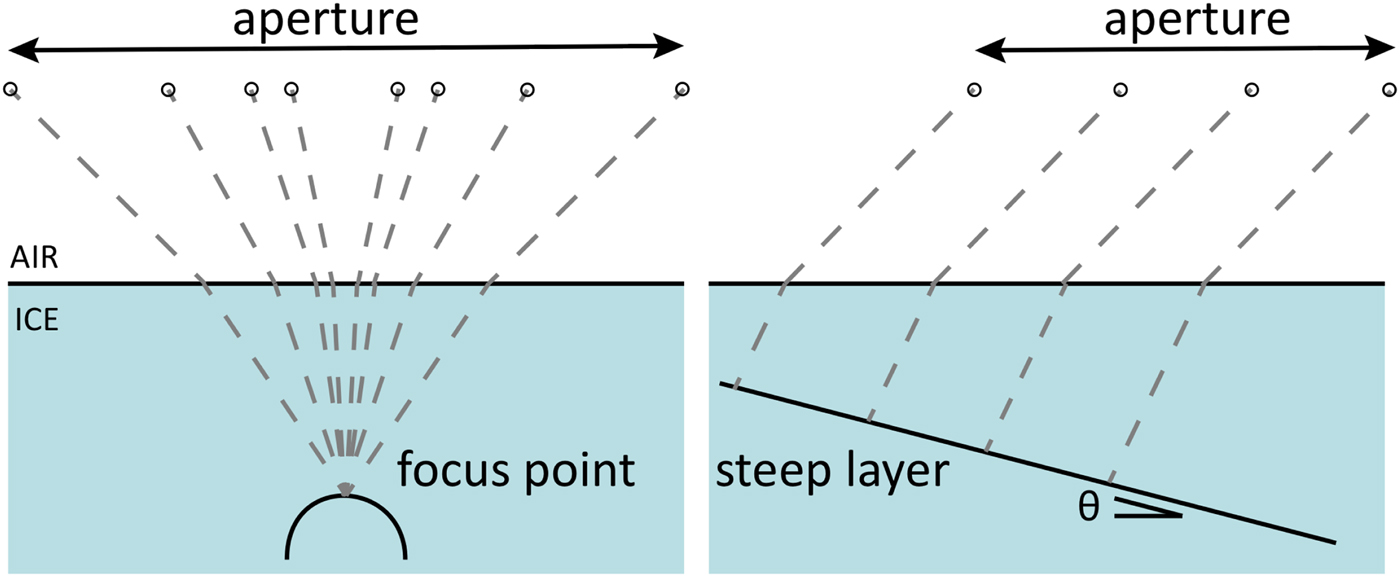
The proposed approach differs from methods based on the focusing of point scatters (see Fig. 2), in which azimuth processing is applied to reconstruct single points (also discussed as migration). SAR focusing techniques represent the optimal solution to improve the resolution of single points and rough surfaces. Instead,the proposed method matches azimuth history of a sloping specular reflector, which is the change in phase and range that a sloping specular reflector would produce in sequential traces within the processing aperture. For each range bin, this is obtained by modifying the along-track focusing to introduce a single phase shift Δφ j to each trace within an aperture, which corresponds to a given specular slope. As shown in the block scheme of Figure 3, this is an iterative approach that guarantees the phase shift Δφ j matches the layer-slope phase history (which is distinct from the phase history of a point scatterer).
Illustration of the geometry for the proposed SAR (a), typical geometry of a point scatter focusing algorithm (b).
Block scheme of the proposed method for LO-SAR processing and estimation of layers slope.

Our azimuth processing scheme consists of the following steps: (i) sidelobes weighting, (ii) range compression, (iii) phase-shifted along-track coherent summation, (iv) best phase-shift selection and (v) multilooking. For step (i), we use a Blackmann–Harris window, broadening the main lobe of the impulse response function (~ 80%) and reducing the peak-to-sidelobe ratio (− 50 dB). In step (ii), the received signal s r is convolved with the complex conjugate of the time-reversed version of the transmitted signal s t. It can be computed for each j-th trace as the following cross-correlation expression
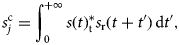
where the superscript $^*$ denotes the complex conjugate.
After pulse compression, standard unfocused SAR processing coherently sums each trace recorded over the synthetic aperture length. The process is applied to each range bin in the same way as
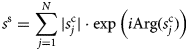
where $s_j^{\rm c}$ is the complex pulse compressed signal and N is the number of range lines included in the synthetic aperture, and where | · | denotes the modulus and Arg( · ) denotes the phase of a complex number.
For unfocused SAR processing, coherent summation increases the SNR of flat specular layers. The same approach applied to adjacent echoes received from sloping layers, which are common subsurface features, can reduce the SNR or cause layers to disappear (Holschuh and others, Reference Holschuh, Christianson and Anandakrishnan2014). To address this issue we modified the formulation in Eq. (2) to include a phase shift Δφ j that compensates the path length difference by shifting each received signal phase before integration. Accounting for the phase shift, integration over the synthetic aperture now yields
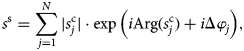
where Δφ j is the optimal phase shift associated to the j-th range line's aperture. Finally, multilooking is applied to the along-track processed data in order to reduce the speckle noise through incoherent averaging. We choose a rectangular windowing for multilooking (3 by 2 pixels, in along- and across-track) following Castelletti and others (Reference Castelletti, Schroeder, Hensley and Bruzzone2017).
3. Automatic layer slope estimation
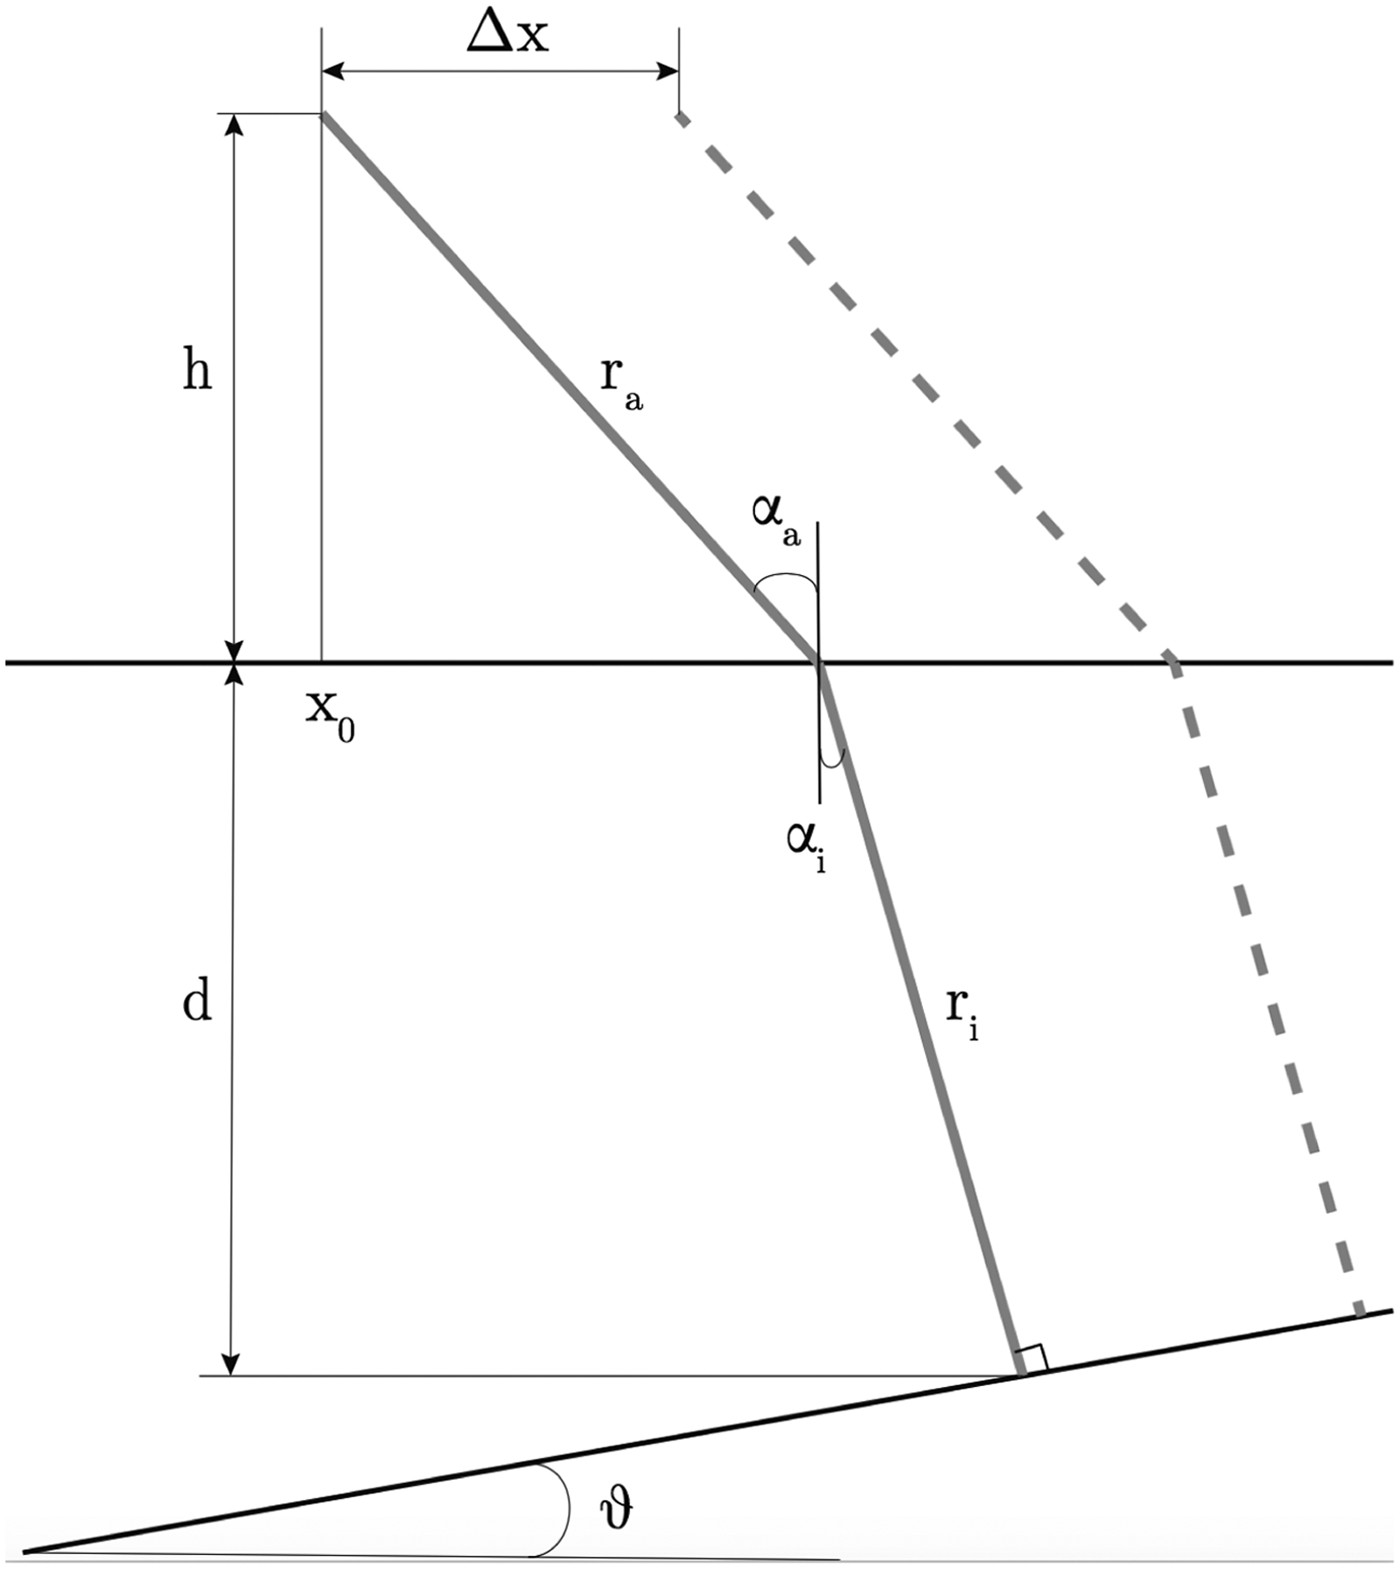
In this section, we demonstrate how the local slope of englacial layers can be automatically estimated as a byproduct of the improved processing algorithm discussed above. To this end, consider a platform flying in the x direction at a constant height h above the ground, and a single internal layer at depth d(x) below the ground and locally inclined at an angle θ with respect to the horizontal (Fig. 4). Accounting for the difference in refraction index between ice and air, the two-way travel time of the radar signal emitted when the aircraft is at x = x 0 reads
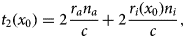
where c is the speed of light, n is the refraction index, and subscripts a,i indicate air and ice respectively. We note that the beam paths r a, r i depend only on the material properties and the geometry of the problem, and are related to the geometric quantities h, d and θ through

where the latter relationship is Snell's law. It thus follows that the two-way travel time is also a known function of the problem geometry. The notion of phase shift arises when comparing the two-way travel time at different along-track coordinates x. Following Figure 4, we now look at the dashed beam path. For a given posting Δx, and assuming Δx small compared to the scale over which the layer exhibits spatial structure so as to be able to consider the layer as locally linear, the depth of the layer at the new location x + Δx will be

where θ correspond to the layer slope. The beam path inside the ice then becomes

leading to a difference in two-way travel time between the two adjacent locations

which we note is purely a function of the local slope of the layer (for given material properties). Finally, the phase shift Δφ between two adjacent radar tracks can be expressed as a function of Δt 2 as
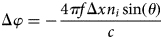
where f is the center frequency of the radar. Equation (9) is the relationship between phase shift Δφ and layer slope θ; with Δφ for each pixel of the radargram provided from the processing, Eq. (9) can be used to estimate the layer slope as
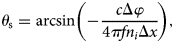
where θs is an estimated layer slope at the pixel level. This approach results in a single unambiguous slope value estimated for the pixel resulting from (and centered within) a processing aperture. As a result, the optimal Δφ is applied between each successive trace within the aperture so that larger – and opposite signed – total phase shifts are applied at the edges of the aperture.
The uncertainly in this slope estimate is determined by the Doppler resolution Δf D of our azimuth processing, which is given by
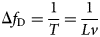
where T is the dwell time, L is the processing aperture and v is the aircraft speed (Raney, Reference Raney1998). This allows us to resolve a sloping specular layer, with a Doppler frequency f D of
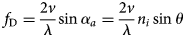
(Peters and others, Reference Peters, Blankenship, Carter, Kempf, Young and Holt2007), with a slope resolution ΔΘ of
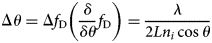
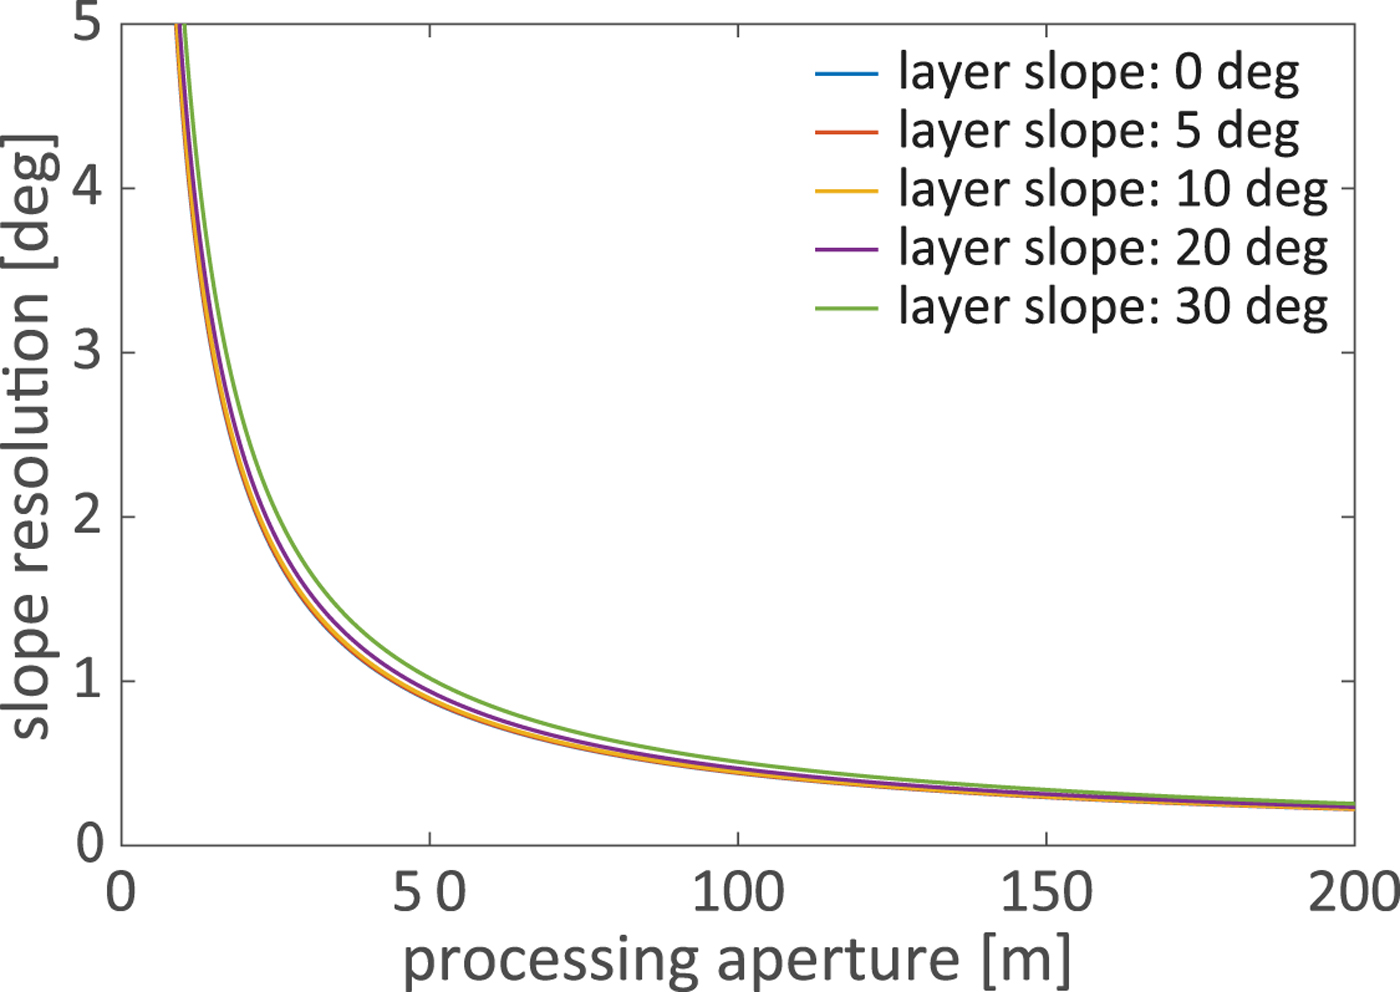
as shown in Figure 5.
Schematic of the idealized setup used to derive the analytical relationship between layer slope and phase shift.
Estimated slope resolution of our LO-SAR processor as a function of layer slope and processing aperture.
4. Results
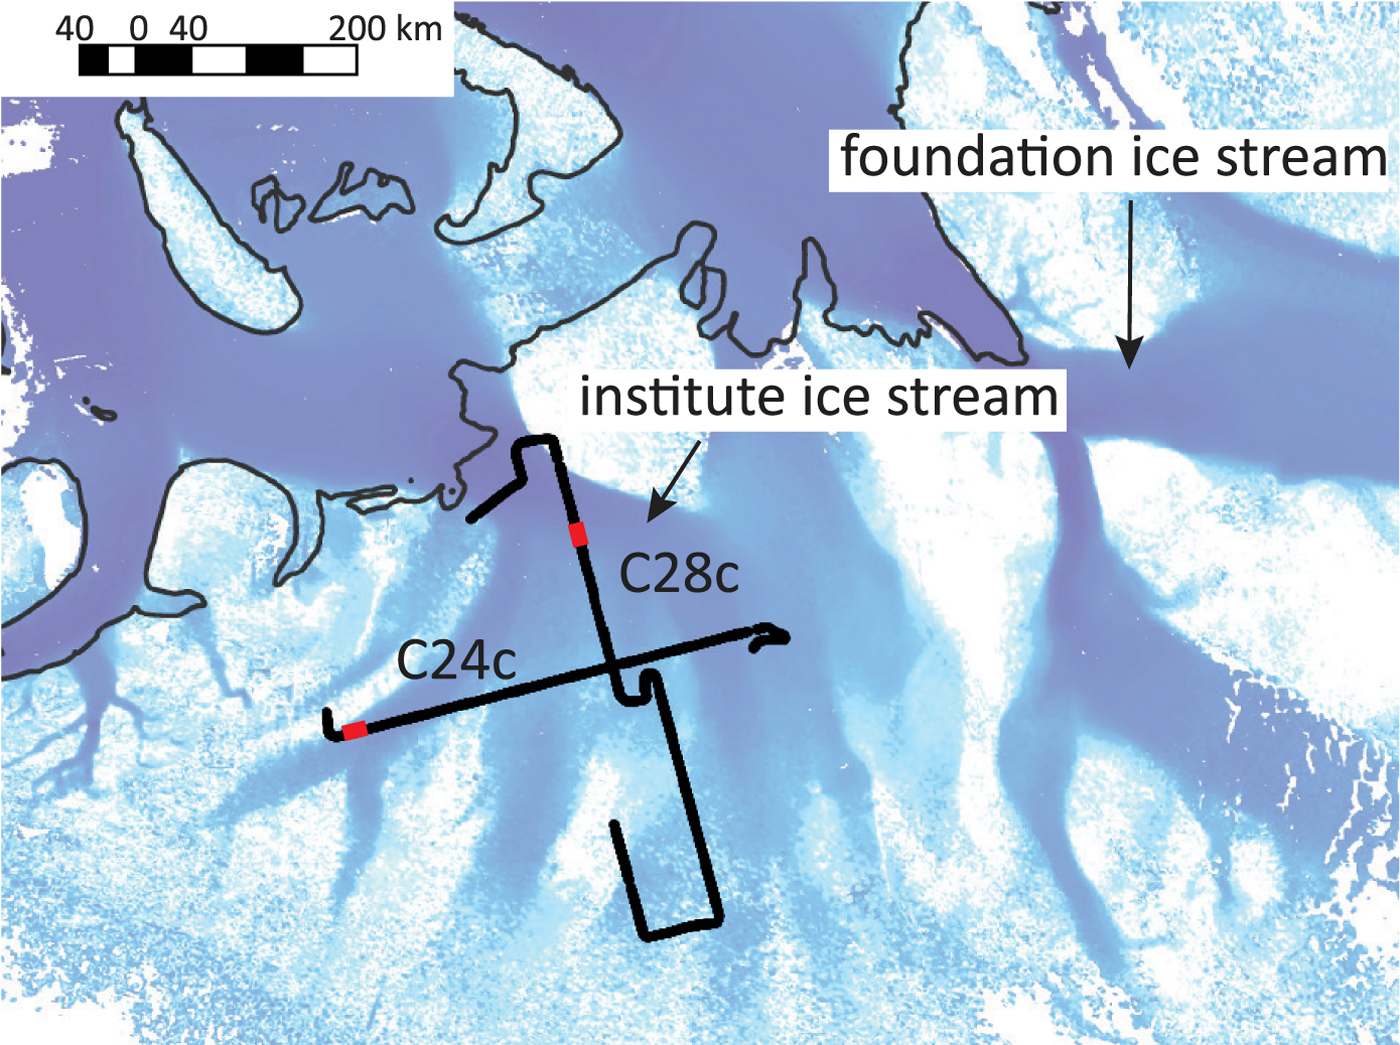
To assess the effectiveness of the proposed technique, we apply it to data acquired by the BAS PASIN instrument in the Institute and Möller Ice Stream region of West Antarctica during the 2010–2011 season. The main system parameters of the BAS radar are presented in Table 1. In this study, we utilized the high-gain channel. Here we demonstrate our approach on two radargrams, C24c and C28c, whose location within the BAS survey is shown in Figure 6; while the full flight lines are marked in black, red portions denote the two specific segments analyzed in the remainder of this section. Despite the geographic proximity of the two lines, we will see (Fig. 7) that they have distinct layer geometries. C24c has rugged bed topography, which results in a complex layer configuration with several switches between downward (positive slope) and upward (negative slope) sloping layers along the line, while layer slopes vary smoothly along C28c. The processing used a synthetic antenna aperture of 70 m, which corresponds to the theoretical Fresnel zone limit, defined as $D_b \approx \sqrt {2\lambda (h + {d}/{n_1} )}$ , where d is the ice depth. The slope estimation algorithm applies 50 phase shifts Δφ j for the arbitrary-chosen range of angles [ − π/3, π/3]. After estimating the optimal phase shift Δφ j, we derived layer slope analytically from Eq. (9).
Radar lines from the BAS-IMAFI survey at Institute Ice Stream. Red segments denote the portions of data analyzed in Figure 7.
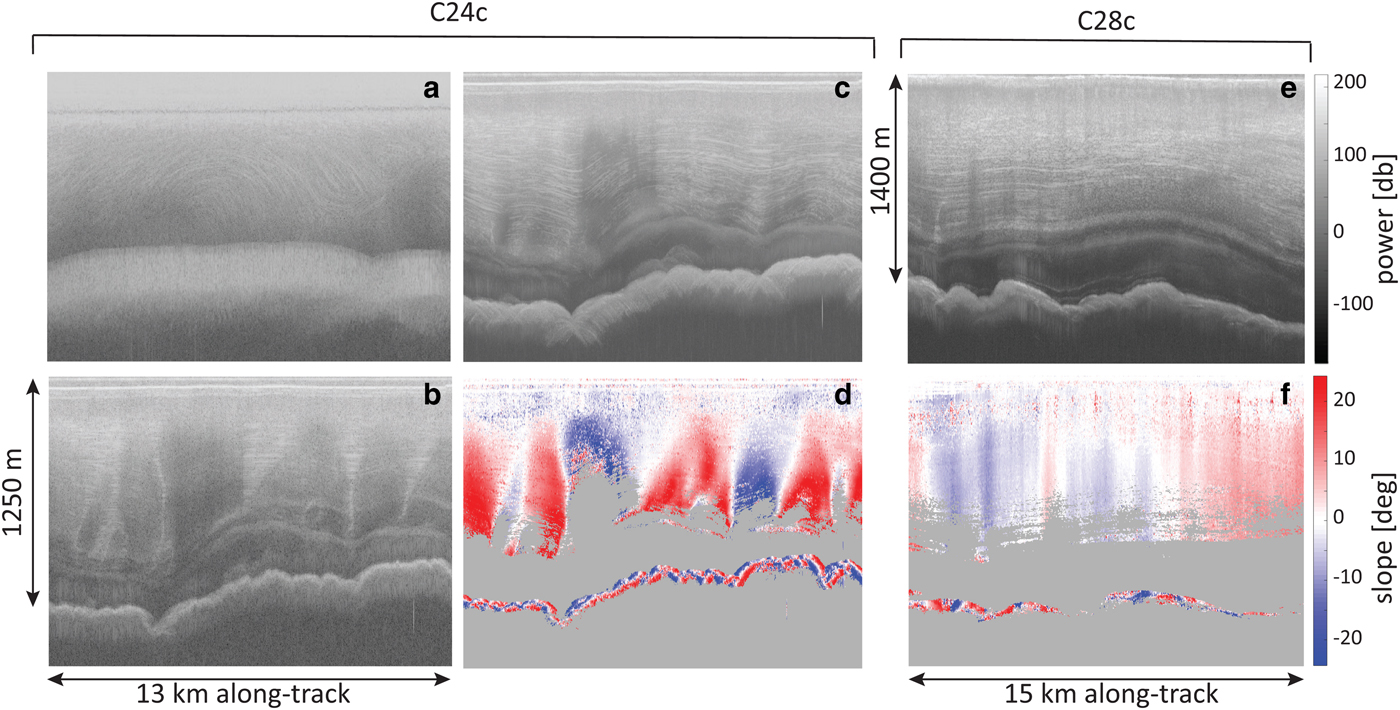
Processing of the segments of line C24c (panels a–d) and C28c (panels e, f) highlighted in red in Figure 6. (a) Raw data; (b) standard unfocused SAR processing without phase shift; (c) proposed LO-SAR processing; (d) slope map; (e, f) same as (c, d) for the segment of C28c. Noise-only regions are masked in gray.
BAS radar sounder system data sheet
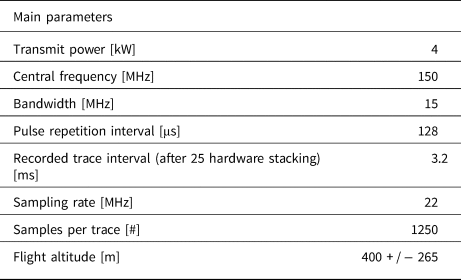
Figure 7 shows the results from our processing, with panels (a)–(d) referring to the red portion of C24c and panels (e, f) to C28c. To illustrate our results, we will first focus on C24c. The raw data are shown in panel (a), where ice-sheet surface and bed are barely visible, and englacial layers cannot be detected. SAR-processed data are depicted in panels (b, c): panel (b) shows results from a standard unfocused SAR processing, while panel (c) shows the the radargram generated using the proposed processing approach optimized for steep layer imaging. As expected, steeply dipping layers are largely destroyed with the standard unfocused SAR processing (panel b), whereas our optimized processing allows us to recover a significant portion of them. However, not all dark areas in panel (b) display layers in panel (c), after the optimized processing, since it does not include range-migration (which also can produce radargram artifacts for steeply sloping layers by mapping energy to nadir rather than the normal-incident specular reflection point, Fig. 2) and is still limited by the critical angle of the ice–air interface. Our processing approach cannot recover slope information for these areas, which are therefore discarded for further processing (gray regions in panels (d, f)). Lastly, layer slope is computed for all areas where information is available via Eq. (9). The result is displayed in panel (d), where blue (red) denotes upward (downward) sloping layers. The same analysis is repeated for C28c, with the optimized radargram shown in panel (e), and the corresponding layer slopes in panel (f).
It is already apparent from the results above that layers destroyed by a standard SAR processing can be restored with our layer-optimized approach. We now demonstrate that the proposed, layer-optimized processing improves the SNR and slope resolution of these steep reflectors. The improvement in SNR ratio can be analytically expressed as

and

where S focSAR and N focSAR are the received power and the noise after point scatter focusing, while S LOSAR and N LOSAR are the received power and the noise after the processing for specular layers. For both equations we used S bin and N bin to define power and noise for each resolution cell. Coherently integrating the received signals along the aperture L using the phase history of a sloped specular reflector, rather than focusing a point target, reduces the amount of off-specular noise added to the resolution bin, causing SNR focSAR to be smaller than SNR LOSAR by a factor of $\sqrt {L}$ . This implies also that the theoretical SNR for an infinitely long specular reflector can increase arbitrarily with L.
Figure 5 presents the analytic relationship between aperture length and slope resolution. The slope estimation precision is a function of the dimension of the synthetic aperture length and layer slope, with longer apertures resulting in more precise estimates. The proposed processing method has an advantage over traditional point-target-based focusing approaches since it allows the exploitation of larger apertures in slope estimation for specular layers.
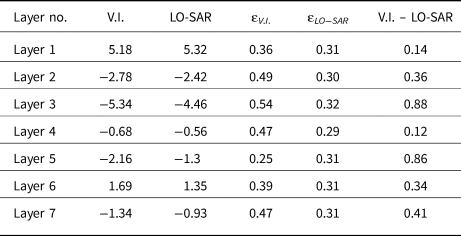
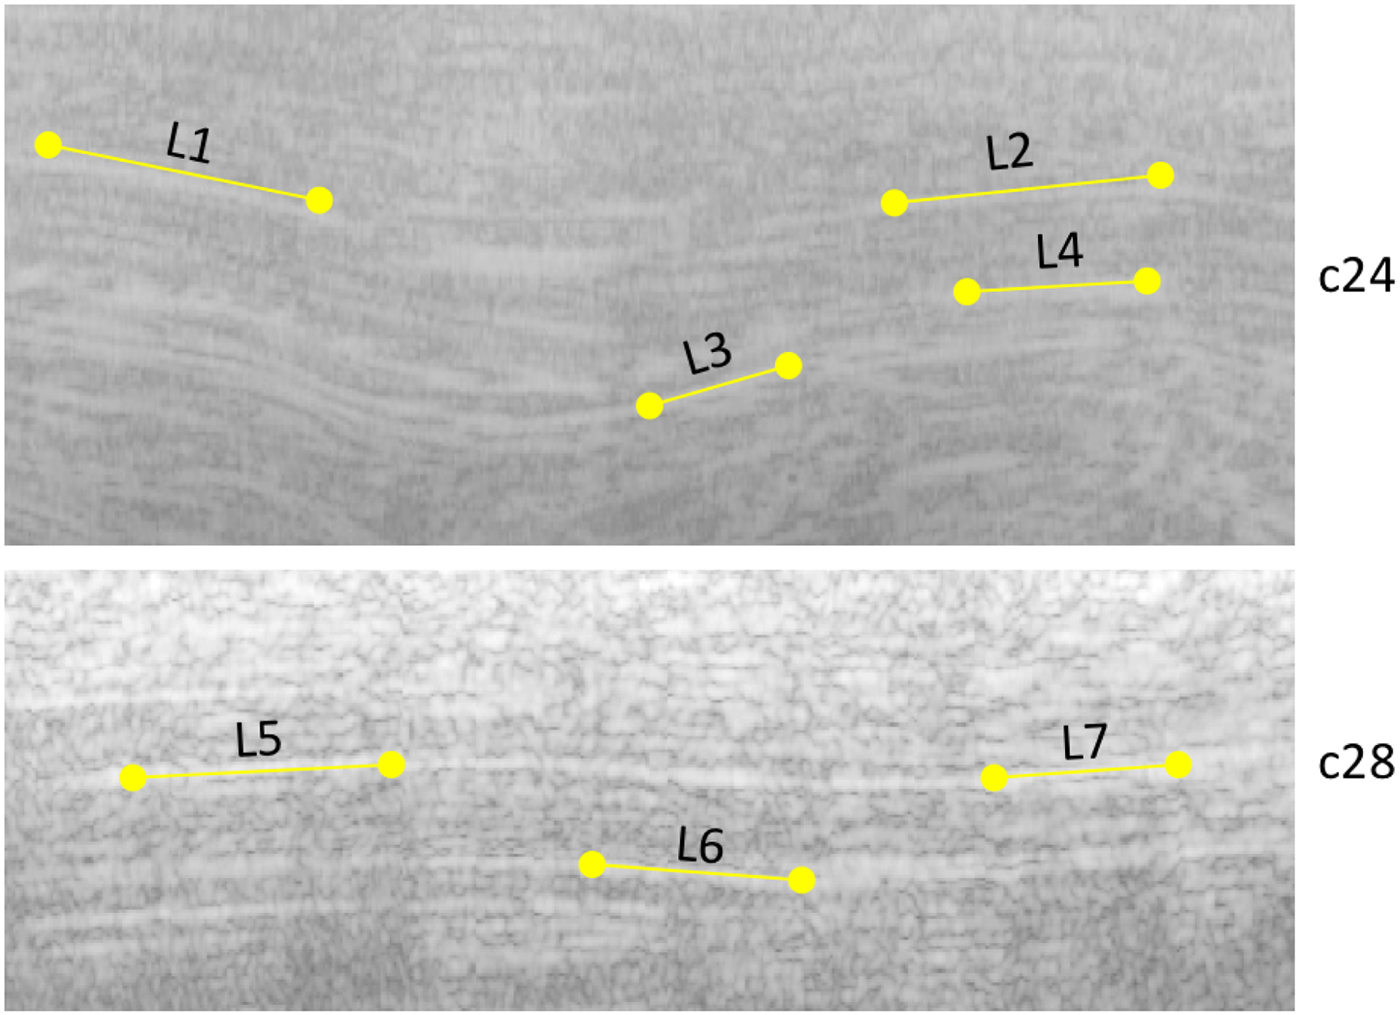
Lastly, Table 2 shows a comparison between observed slope value via Visual Interpretation (V.I.) which involved manual inspection by a user, the estimated V.I. uncertainty (͛V.I.) (which is the slope error introduced by a range-resolution error in the vertical position at each end of the line added in quadrature), the slope estimated with the proposed technique (LO-SAR) and the estimated uncertainty from out technique (͛LO−SAR) for the layers in Figure 8, which agree well.
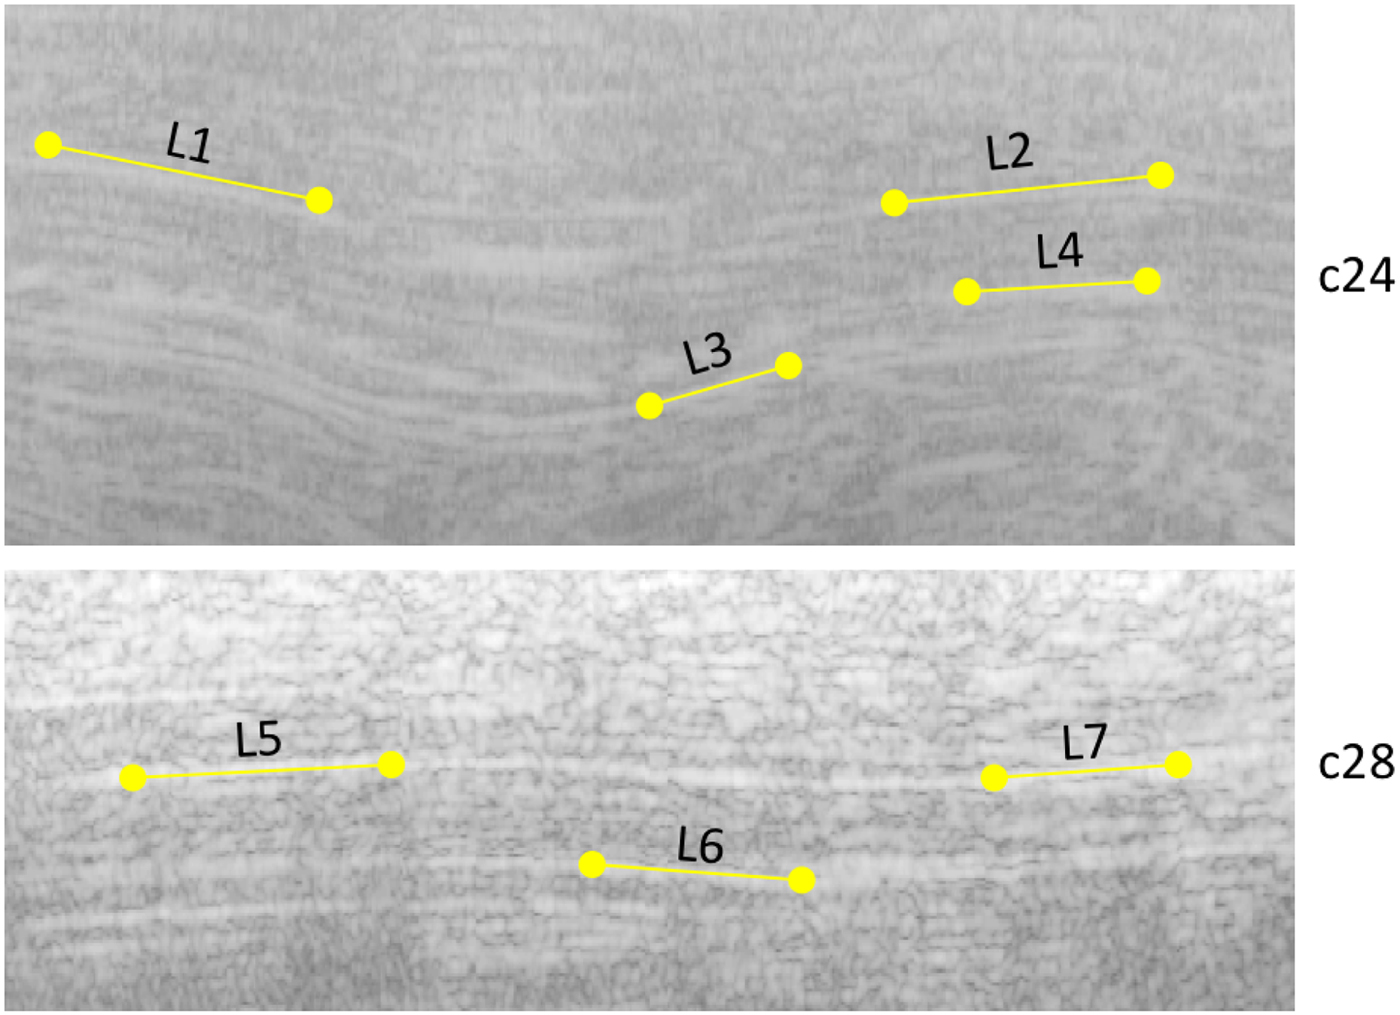
Validation of slopes from Eq. (9) after Layer-Optimized SAR processing (LO-SAR below) against slopes obtained by visual interpretation (V.I.) of the optimized radargrams including the estimated uncertainty for each approach (͛V.I. and ͛LO − SAR respectively). Layer numbers refer to Figure 8. All slopes are in deg
5. Conclusion
In this study we presented a new method for the analysis of radar sounder data made up of two innovative components. First, we proposed a novel SAR processing approach optimized for the imaging of steeply dipping internal reflectors. Second, we provided an algorithm for the automatic estimation of englacial layer slopes, with layer slope obtained as a byproduct of the processing in a pixel-by-pixel fashion. We demonstrated our approach using radar sounder data acquired by the BAS PASIN radar system in the Institute Ice Stream region of West Antarctica. Notably, this approach does not require layers to be long or continuous to produce usable slope fields, overcoming limitations of previous approaches.
Acknowledgments
BAS, M. Siegert and N. Ross are gratefully acknowledged for providing the data on which this technique was demonstrated. N. Holschuh and E. King are acknowledged for their thoughtful and thorough reviews. This work was partially supported by a grant from NASA Cryospheric Sciences and an NSF CAREER award.




 Open access

