

Indigenous Peoples in Canada, as in many countries, have long been denied the most basic rights of citizenship. Their long exclusion from Canadian political life implies that First Nations, Métis, and Inuit—commonly defined as “Indigenous Peoples”Footnote 1 —have an ambiguous relationship with the State and its institutions. This “dual-citizenship” (Cowie Reference Cowie and Mann2023) or “differentiated citizenship” (Blackburn Reference Blackburn2009) sets them apart from other groups. The struggles of Indigenous Peoples with citizenship are indeed unique, as asserting their enduring sovereignty and right to self-determination in practice (Alfred and Corntassel Reference Alfred and Corntassel2005; Lightfood and Macdonald Reference Lightfoot and Macdonald2017) also means they seek to “define if and how to be citizens of the states they live in” (Blackburn Reference Blackburn2009, 75). As political communities, Indigenous collective right to self-determination could therefore challenge or enhance mutual (Indigenous and Canadian) citizenship (Blackburn Reference Blackburn2009; Borrows Reference Borrows2001; Cowie Reference Cowie and Mann2023), as Indigenous politics “grapple with the question of participation in colonial representative institutions while also recognizing the sovereignty of Indigenous Nations” (Carrière and Koop Reference Carrière and Koop2023, 273).Footnote 2
This context raises questions regarding the way Indigenous individuals engage with settler politics. In Canada, while they tend to vote less than the general population at the federal level (Bargiel Reference Bargiel2012; Howe and Bedford Reference Howe and Bedford2009), authors have noted a gradual increase in participation in some regions (Dalton Reference Dalton2007), as well as variations inside and between Indigenous groups.Footnote 3 Nevertheless, general trends appear unsurprising, as Indigenous Peoples in Canada were historically excluded from settler politics, still view these institutions with suspicion (Truth and Reconciliation Commission 2015), and have maintained an uneasy relationship with them (Carrière and Koop Reference Carrière and Koop2023; Midzain-Gobin et al. Reference Midzain-Gobin, Snagovsky and Cowie2024). Research shows that Indigenous political attitudes in Canada tend to be shaped by specific considerations, including their colonial experience, which points to the importance of identities and history as key predictors of how Indigenous individuals perceive (Bouchard and Bourgeois Reference Bouchard and Bourgeois2024) and interact with (Greaves et al. Reference Greaves, Sengupta, Townrow, Osborne, Houkamau and Sibley2018; Saglie et al. Reference Saglie, Mörkenstam and Bergh2020) settler politics.
After decades of relative political invisibility, there appears to be a certain increase in Indigenous turnout in Canadian legislative assemblies. For instance, compared to the 2011 election, turnout in First Nations communities increased by 14 percentage points in 2015 (from 47.4% to 61.5%) (Elections Canada 2018). Although their turnout decreased by 4.4 percentage points between the 2019 and 2021 elections (from 67.0% to 62.6%), the “gap […] [with] the general population is the lowest observed by Elections Canada” (Elections Canada 2023, 1). Indigenous leaders have also taken a larger role in encouraging voting in federal and provincial elections (Poelzer et al. Reference Poelzer, Beatty and Berdahl2014). For example, the Assembly of First Nations identified 36 districts where First Nations could influence the election outcome if “they participate in an active and coordinated manner” (AFN 2025, 1).
This article focuses on the electoral behavior and political attitudes of Indigenous voters in Canada. We rely on data from the 2019 and 2021 Canadian Election Study (CES) (Stephenson et al. Reference Stephenson, Harell, Rubenson and Loewen2020, Reference Stephenson, Harell, Rubenson and Loewen2022), which include an unprecedented number of Inuit, Métis, and First Nations respondents. We seek to determine if the party affiliation of Indigenous individuals, their attitudes toward public spending, and their willingness to vote—critical dimensions of political behavior (Blais et al. Reference Blais, Turgeon, Gidengil, Nevitte and Nadeau2004; Gidengil Reference Gidengil2022)—differ from those of non-Indigenous Canadians. Given the disaffection of Indigenous Peoples toward certain settler political institutions and the state of democracy in Canada (Bouchard and Bourgeois Reference Bouchard and Bourgeois2024), we expect them to be less likely to consider voting and affiliating with a political party at the federal level. As the literature also suggests that Indigenous Canadians are more favorable toward left-leaning or center-left parties (Harell and Panagos Reference Harell and Panagos2013), we also expect them to adopt center-left or left-leaning attitudes toward public spending. Instead, we find that while Indigenous respondents are more likely than their non-Indigenous counterparts to intend to abstain, they nonetheless are significantly more likely to affiliate with third parties while also adopting opinions toward public spending across the ideological spectrum. Last, we discuss the implications of our results and different research avenues that could be undertaken in Canada and in other countries where Indigenous Nations are present.
The Political Behaviors of Indigenous Peoples in Canada
One of the enduring myths of Canadian politics was that Indigenous individuals were apolitical citizens. This “dangerous misperception among Canadians” stemmed from the biased assumption that Indigenous Peoples were “disengaged and uninterested in politics” because of their low voter turnout rates in federal elections (Poelzer et al. Reference Poelzer, Beatty and Berdahl2014, 64). A more comprehensive assessment of Indigenous political engagement suggests a different picture by adopting a broader definition of civic participation—notably as citizens of their own Nations—that includes the promotion of traditional practices, volunteering for community events, and serving as a member of a board or committee (Berdahl et al. Reference Berdahl, Adams and Poelzer2011; Henderson Reference Henderson2008; Poelzer et al. Reference Poelzer, Beatty and Berdahl2014). Indigenous mobilization often takes place outside institutionalized channels of political representation (Wilkes Reference Wilkes2004), which indicate that mainstream western models of political participation do not always align with their diverse worldviews and political cultures (Henderson Reference Henderson2004).
Borrows (Reference Borrows2001, 17) refers to Indigenous Peoples as “uncertain citizens” because “they were loosely associated with the Canadian political community but denied the institutions, rights and/or resources necessary to meaningfully participate in the country’s life, either collectively or as individuals.” In fact, the Indian Affairs Branch used to be in the Department of Citizenship and Immigration (1950–1966), as they were targeted by “Canadianization” programs to be “assimilated” into the “mainstream” (Bohaker and Lacovetta Reference Bohaker and Iacovetta2009).
Consequently, Indigenous Peoples have a long tradition of political resistance, and their relationships with the Canadian State have been marked by policies of submission and exclusion.Footnote 4 Indigenous political actions are traditionally associated with contentious politics (Morden Reference Morden2015), given that these alternative pathways of political expression can be mobilized by individuals who do not have access to representative institutions, advocate for ideas that are absent from traditional politics, or challenge authority (Tarrow Reference Tarrow2011; Tilly and Tarrow Reference Tilly and Tarrow2015). In many ways, Indigenous Peoples were “conditioned to use very blunt instruments to make their points, such as highly charged political demonstrations, blockades, and litigation” (Borrows Reference Borrows and Borrows2002 in Hunter Reference Hunter2003). In the 1960s and 1970s, the militant wave of Indigenous activism, as a form of “outsider politics,” was important in bringing national awareness to the injustices they experienced (Bell Reference Bell2015; Evans Reference Evans2014, 277). Treaty making and the recognition of Indigenous rights by the Supreme Court granted certain rights to Indigenous Peoples, besides those common to all citizens (Grammond Reference Grammond2013). Nevertheless, Indigenous contentious politics still plays a part in Canadian politics. It notably involves conflicts over natural resources, lands, and laws within national boundaries and across the global stage (Lightfoot Reference Lightfoot2016; Morden Reference Morden2015; Passy Reference Passy, Porta, Kriesi and Rucht1999; Willow Reference Willow2020).
Scholars also underline the “key but often overlooked roles” of Indigenous women in political activism (Suzack et al. Reference Suzack, Huhndorf, Perreault and Barman2010, 5), which gained momentum in the 1960s and 1970s (Adese Reference Adese, Adese and Andersen2021), with strategies ranging from the use of courts or the media to the increasing presence of women in leadership positions (including in often male-dominated Indigenous organizations). Indigenous women are also active and visible in the bureaucracy and, at the community level, on various boards and committees (Minor Reference Minor2002). According to Maertens and Basile (Reference Maertens and Basile2022, 82), Indigenous women “participate politically in their own way by exerting an influence on the candidacies” or by setting up bodies that “allow them to discuss their own issues.”
Building on earlier work (Bouchard and Bourgeois Reference Bouchard and Bourgeois2024), this paper explores how Indigenous Peoples engage with settler politics by considering both their voting behaviors and attitudes. As voting behavior comprises two choices—to show up at the polls (participation) and to choose a candidate (vote choice)—both rationales are notably clarified (Beatty et al. Reference Beatty, Doraty, Kocdag, Waldbillig, Carriere, Berdahl and Poelzer2013).
Indigenous Political Participation
To understand Indigenous political participation, one must first acknowledge that each Indigenous group has a unique historical trajectory and set of experiences when it comes to exercising their voting rights and taking part in elections (Elections Canada 2021). To begin, First Nations represent the largest Indigenous group, accounting for 630 communities and over 50 Nations. After the confederation in 1867, the decision was made that the Federal Parliament would have exclusive power over the “Indians” (i.e., First Nations). The Indian Act replaced traditional First Nations governance systems with band councils and made it illegal for them to hire legal counsel, which prevented them from acquiring both political and legal representation (Grammond Reference Grammond2013). Consequently, until the 1960s (with notable exceptions in the late 1800sFootnote 5 and early 1900sFootnote 6 ), the Electoral Act excluded the majority of Indigenous individuals from settler electoral institutions and deprived them of political recognition. To vote, most First Nations individuals had to forfeit their “Indian” status. Furthermore, the Indian Act strengthened western traditional gender roles, which had important repercussions on the lives of First Nations women. First Nation women were not allowed to participate openly in band politics until 1951 (McCallum and Klessen Reference McCallum, Klassen, Ladner and Tait2017), and upon marriage, the status of these women would also be determined by the status of their husbands until 1985, which meant that they could notably gain or lose voting rights depending on the person they married.Footnote 7
Next, the Métis emerged along the trade routes in the 18th century, primarily in Western Canada, in communities that differed from both First Nations and European settlers. As they were the last group to be officially recognized as Indigenous Peoples with collective rights by the Canadian state, their voting rights followed those of the general Canadian population as more restrictions were liftedFootnote 8 (Adams Reference Adams2020). Consequently, while Métis women could vote in federal elections for the first time in 1918, the majority of their Inuit and First Nations counterparts could not do so.
The last group, the Inuit, is composed of 53 communities located in Inuit Nunangat (i.e., “the place where Inuit live”). While the expansion of Canadian jurisdiction over Inuit Nordic homelands theoretically granted them federal voting rights, their actual engagement with the federal government remained minimal until the 1930s (Elections Canada and Inuit Tapiriit Kanatami 2024). Paradoxically, as interactions increased, the voting rights of the Inuit were revoked from 1934 to 1950. Even after their reinstatement, the location of many Inuit communities posed significant logistical challenges, and it was not until 1962 that all Inuit communities were provided with the resources to effectively participate in elections (Ladner and McCrossan Reference Ladner and McCrossan2007).
Overall, the literature underlines the historically low participation of Indigenous Peoples in federal elections, as they remain more likely to vote in band or territorial elections (Bargiel Reference Bargiel2012; Beatty et al. Reference Beatty, Doraty, Kocdag, Waldbillig, Carriere, Berdahl and Poelzer2013; Henderson Reference Henderson2008; Ladner and McCrossan Reference Ladner and McCrossan2007). Authors have raised many factors that could explain these low participation rates, including the impacts of colonial history, socioeconomic barriers, and sociodemographic variables such as age, location, and social mobility (Dabin et al. Reference Dabin, Daoust and Papillon2019; Harell et al. Reference Harell, Panagos and Matthews2010). Issues surrounding the symbolic meanings of voting (Jacobs Reference Jacobs2013) and the presence of Indigenous self-governments (Henderson Reference Henderson2004) have also been identified. Considering Indigenous struggles for self-determination, scholars notably suggest that a number of Indigenous individuals feel a sense of political alienation (Alfred et al. Reference Alfred, Pitawanakwat and Price2007) and perceive voting as accepting the colonial system (Ross Reference Ross2014). Research also states that the lack of interest in Indigenous priorities and poor representation could make voting less attractive for Indigenous individuals (Ladner and McCrossan Reference Ladner and McCrossan2007; Elections Canada 2025).
While some authors argue that too much emphasis may be put on the “alleged conflict between the practice of self-government and participation as voters” (Cairns Reference Cairns2003), the literature nonetheless suggests that the political behaviors of Indigenous Peoples should differ from those of their non-Indigenous counterparts. For instance, Indigenous individuals participate in different governance structures (Carrière and Koop Reference Carrière and Koop2023; Dabin Reference Dabin2021; McMahon and Alcantara Reference McMahon and Alcantara2021), and they “seek a variety of forms of interaction with the Canadian state, ranging from a complete rejection of the colonial system to full participation in state politics” (Carrière and Koop Reference Carrière and Koop2023, 273). Dabin (Reference Dabin2021) argues that these divergences stem from a differentiated understanding of what self-determination is and how it should be implemented.
Nevertheless, understanding the decision to vote or not in general elections is a fundamental aspect of the study of political behavior. We know that it notably hinges upon political interest and sense of civic duty (Blais and Daoust Reference Blais and Daoust2020). While Fournier and Loewen (Reference Fournier and Loewen2011) note that the core determinants of Indigenous turnout do not noticeably differ from those of their counterparts, others add that this question remains both complicated (Armstrong et al. Reference Armstrong, Alcantara and Kennedy2023) and multidimensional (Dabin Reference Dabin2021), given the historical exclusion of Indigenous Peoples from Canadian settler politics and the tensions between taking part in Canadian political practices and seeking pathways to self-determination (Newhouse and Belanger Reference Newhouse, Belanger, Courtney and Smith2010). Our study provides a recent and robust look at the persistence of the participation gap by leveraging a large-N analysis (Midzain-Gobin et al. Reference Midzain-Gobin, Snagovsky and Cowie2024), further cementing our understanding of Indigenous turnout in Canada at the federal level. We expect that:
H1: Compared to non-Indigenous Canadians, Indigenous individuals are more likely to consider abstention.
Vote Choice at the Federal Level among Indigenous Peoples
We begin with a brief overview of the Canadian party system at the federal level. Even though Canada uses a first-past-the-post electoral system and two major parties have alternatively formed the government since the confederation, third parties have progressively gained visibility as displayed in Figure 1.
Number of effective parties at the federal level in Canada (1878–2021).
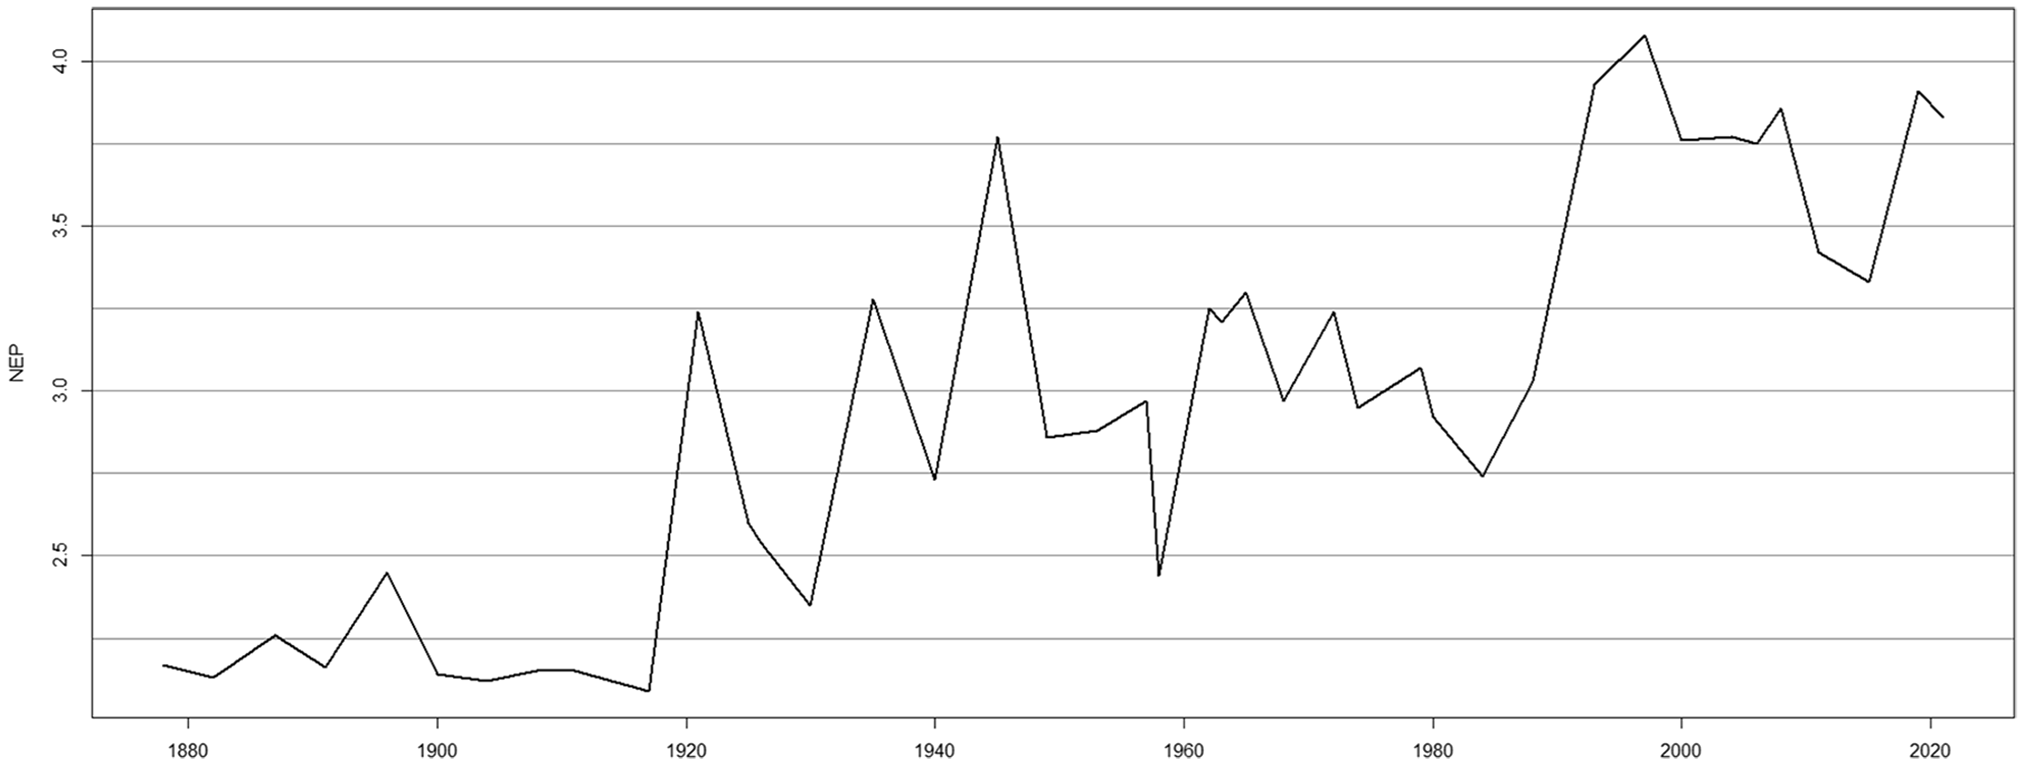
Figure 1 Long description
The line graph illustrates the number of effective parties at the federal level in Canada over the period from 1878 to 2021. The x-axis represents the years, ranging from 1860 to 2020, while the y-axis represents the number of effective parties, ranging from 2.5 to 4.0. The graph shows fluctuations in the number of effective parties over time, with notable peaks around the 1920s, 1940s, and 2000s. The line indicates a general trend of increasing party effectiveness over the years, with some periods of decline. All values are approximated.
The Liberal Party of Canada (LPC) traces its origins to 1867 and typically occupies a position at the center or center-left of the political spectrum (Johnston Reference Johnston2023). It was the incumbent in both 2019 and 2021 under the leadership of then-Prime Minister Justin Trudeau. The Conservative Party of Canada (CPC) is the second major political party at the federal level in Canada, occupying the center-right of the political spectrum (Johnston 2023). It was founded in 2003 through the merger of the Progressive Conservative Party and the Canadian Alliance but traces its origins to the country’s founding. Turning to third parties, first, the New Democratic Party (NDP) has existed since 1961 and is on the left side of the political spectrum (Jansen and Young Reference Jansen and Young2009). The Canadian Green Party was founded in 1981 and is closely associated with the environmentalist movement (Routley and Armstrong II Reference Routley and Armstrong II2024), whereas the Bloc Québécois (BQ) is devoted, since 1991, to defending the interests of the province of Québec and promoting its independence (Duval and Villeneuve-Siconnelly Reference Duval and Villeneuve-Siconnelly2024). Last, the People’s Party of Canada (PPC) has been frequently associated with right-wing populism, or the far-right (Monami and Deschamps Reference Momani and Deschamps2021), since its creation in 2018 by a former Conservative member of Parliament (Budd Reference Budd2021).
In her review of the state of the political behavior discipline in Canada, Gidengil (2022, 922) states that still “very little is known about Indigenous voting preferences.” Indeed, we mostly find evidence in this regard at the provincial level. The study of Harell et al. (Reference Harell, Panagos and Matthews2010) in the provinces of Alberta, Manitoba, and Saskatchewan suggests that Indigenous voters are generally more supportive of centrist or left-wing parties. These results are even in line with observations made in the Americas, as authors report that different Indigenous Nations throughout these continents tend to favor left-wing and sometimes centrist parties that support their agendas (Herrick and Mendez Reference Herrick and Mendez2020; Hirseland and Strijbis Reference Hirseland and Strijbis2019; Madrid Reference Madrid2016).
By taking a closer look at different groups, authors have also uncovered certain particularities among Indigenous voters at the provincial level. In their study on Northern Saskatchewan, Beatty et al. (Reference Beatty, Doraty, Kocdag, Waldbillig, Carriere, Berdahl and Poelzer2013) show that household income also plays a role in federal vote choice among Indigenous Peoples, as those making less than $20,000 are more likely to vote for the NDP, while those making between $40,000 and $59,999 are more likely to support the LPC. Meanwhile, Harell and Panagos (Reference Harell and Panagos2013) claim that the gender gap is more pronounced among Indigenous voters than their counterparts.
While the existing literature on Indigenous vote choice in Canada is limited, its conclusions appear fairly consistent. Previous studies on provincial elections in Manitoba, Alberta, and Saskatchewan all suggested wider support for the NDP among First Nations and Métis voters (Adams 2000; Clark Reference Clark, Bratt, Sutherland and Tara2019), while the LPC and the NDP “disproportionately captured” the Indigenous vote at the federal level in 2006 and 2015 (Dabin Reference Dabin2021, 74). We therefore expect our results to align with these previous findings and formulate the following hypothesis:
H2: Compared to non-Indigenous Canadians, Indigenous Peoples are more likely to vote for center-left or left-leaning federal parties.
Just like vote choice, Indigenous partisanship in Canada has not gathered much scholarly attention up to now. As Gidengil (2022) underlines, the aspect authors have mainly studied is affinity—that is, when members of a social group support candidates who share their sociodemographic characteristics—and its implications for Indigenous individuals. Affinity voting could notably play a role when a party presents more Indigenous candidates (William et al. Reference William Ie, Everitt, Bird, Wagner and Lalancette2023). For example, in Manitoba, Berdahl et al. (Reference Berdahl, Adams and Poelzer2011) found that having First Nations candidates could strengthen support for a party. Similarly, recent studies suggest that Indigenous representation fosters greater political participation (Cayul and Corvalan Reference Cayul and Corvalan2024; Dabin Reference Dabin2021), although this does not necessarily translate to greater support for settler political institutions (Midzain-Gobin et al. Reference Midzain-Gobin, Snagovsky and Cowie2024). Moreover, even though the NDP has notably set targets regarding “equity seeking groups” (Lapointe et al. Reference Lapointe, Ferland and Turgeon2024), the share of Indigenous candidates has historically remained low (William Ie et al. Reference William Ie, Everitt, Bird, Wagner and Lalancette2023). Lapointe and collaborators (Reference Lapointe, Ferland and Turgeon2024) add that these candidates are actually disadvantaged, on average, by disproportionately running in districts where their party has previously suffered a “landslide defeat.” Together, these facts raise doubts regarding the probability that affinity has a substantial positive influence on how Indigenous Peoples view federal political parties and how likely they are to affiliate with them. In the end, while the literature provides limited motives for partisan attachment among Indigenous Peoples, other findings point to their weariness toward “several political institutions, politicians, and democracy in Canada” (Bouchard and Bourgeois Reference Bouchard and Bourgeois2024), which leads us to believe that:
H3: Compared to non-Indigenous Canadians, Indigenous individuals are less likely to affiliate strongly with a federal political party.
Attitudes toward Public Spending
As Midzain-Gobin and colleagues (Reference Midzain-Gobin, Snagovsky and Cowie2024) note, “focusing on voting behavior misses the spectrum of political attitudes held by Indigenous Peoples in Canada.” The fact that this topic has received little attention up to now in the literature is problematic, as attitudes are expected to not only play a key role in shaping vote choice (Gidengil 2022) but also inform public policy (Wlezien and Soroka Reference Wlezien and Soroka2016). However, when authors consider the topic of Indigenous political attitudes, the scope of inquiry is most often limited to the opinion of Indigenous individuals on programs or benefits specifically targeted at them. For example, White and collaborators (Reference White, Atkinson, Berdahl and McGrane2015) show that, in Saskatchewan, Indigenous individuals tend to be more favorable to Indigenous policies than their non-Indigenous counterparts. We argue that to deepen our understanding of the outlook of Indigenous Peoples on settler politics, it is essential to consider a broader set of issues. This is particularly true given the unique ways in which Indigenous Peoples around the world can be affected by the level of public spending related to a variety of topics.Footnote 9 Notable examples include the environment—as Indigenous communities are among the most impacted by climate change (Brubacher et al. Reference Brubacher, Peach, Chen, Longboat, Dodd, Elliott and Neufeld2024)—and law and justice, given the disproportionate number of Indigenous individuals who face the criminal justice system in Canada (David and Mitchell Reference David and Mitchell2021) and their lower level of trust in the police (Alberton et al. Reference Alberton, Gorey, Angell and McCue2019).
As the available literature on Indigenous political attitudes is scarce, while we expect Indigeneity to play a part in influencing their views on public spending, we can only base our predictions on previous findings regarding vote choice (Harell et al. Reference Harell, Panagos and Matthews2010; Herrick and Mendez Reference Herrick and Mendez2020; Hirseland and Strijbis Reference Hirseland and Strijbis2019; Madrid Reference Madrid2016) and hypothesize that:
H4: Indigeneity has a positive impact on the likelihood of adopting views toward public spending on the left or center-left of the ideological spectrum.
Method and Data
To investigate Indigenous turnout, vote choice, partisanship, and political attitudes, we turn to the 2019 and 2021 CES (Stephenson et al. Reference Stephenson, Harell, Rubenson and Loewen2020, Reference Stephenson, Harell, Rubenson and Loewen2022) and combine them to increase the number of Indigenous respondents in our sample. Both surveys were administered online and follow a similar format. The 2019 CES (n = 37,822) was fielded from September 13 to November 11, 2019, and the 2021 CES (n = 20,968) from August 17 to October 4, 2021. Both studies comprise a campaign period survey (CPS) and a post-election survey (PES).
We determine who identifies as Indigenous by using the following questions. First, to the 2019 question, “In addition to being Canadian, to what ethnic or cultural group(s) do you belong?” we code individuals who chose “Aboriginal/First Nations,” “Inuk/Inuit,” or “Métis” as Indigenous. We also include individuals who chose “Other” and wrote that they identify as Indigenous. In 2021, the question used was: “Do you identify as any of the following?” Individuals who answered “Indigenous (e.g., First Nations, Métis, Inuit, etc.)” are coded as Indigenous (we also considered justifications provided by those who chose “Other” and coded Indigenous respondents accordingly). It is important to note that while the 2019 survey allows respondents to identify as First Nations, Inuit, or Métis, those who participated in 2021 could only choose “Indigenous.” Consequently, we are unable to distinguish between First Nations, Inuit, and Métis respondents in our analysis as our sample includes both surveys, even though we acknowledge that these groups should have been considered separately. This is an important limit of our study. Overall, out of 58,790 total respondents, 2,850 identify as Indigenous. As we focus on a specific group within the electorate, we try to keep as many observations as possible. We thus turn to the CPS instead of the PES, as the latter would substantially reduce the number of Indigenous respondents (877). The main drawback is that the CPS provides data on vote intentions instead of actual votes.Footnote 10 We use the following question in the 2019 and 2021 CPS: “On election day, are you…? (Certain to vote (1), likely to vote, unlikely to vote, certain not to vote (0)).” Respondents who are not eligible to vote are coded as missing. Respondents who indicated that they had already voted (by mail or advance poll) were coded 1.Footnote 11
To determine vote choice, we rely on the following question and its iterations,Footnote 12 in 2019 and 2021: “Which party do you think you will vote for?” Both surveys provide the following choices: Liberal Party, Conservative Party, NDP, BQ, and Green Party. Contrary to 2019, in 2021, the PPC is not included among the answer options. We manually coded explanations provided by those who selected “Another party” to identify PPC supporters.Footnote 13 In both surveys, we include the choice of people who had already voted in advance polls and those who claimed they were unlikely to vote.
For party affiliation, we use the following question: “In federal politics, do you usually think of yourself as a:..? (Liberal, Conservative, NDP, Bloc Québécois,Footnote 14 Green).” Once more, as respondents to the 2021 CES could not indicate if they support the PPC, the answers of individuals who selected “Another party (please specify)” were manually coded. To determine the strength of party affiliation, we consider the following question: “How strongly (party) do you feel? (Very strongly (1), fairly strongly, not very strongly (0)).”
Regarding respondents’ attitude toward government spending on education, the environment, law and justice, defense, and immigrants and minorities, each question we use follows the same pattern: “How much should the federal government spend on [topic]” (spend less (0), spend about the same as now, spend more (1)). To verify our results regarding attitudes toward spending on immigrants and minorities, we use the following question: “How do you feel about the following groups? Set the slider to any number from 0 to 100, where 0 means you really dislike the group and 100 means you really like the group.” We look at the “racial minorities” and “immigrants” categories. Results are brought back on a scale from 0 to 1.
We control for gender, age, education, income, regions, political interest, and self-placement on the left–right spectrum. Wet code those who identify as women 1 and others as 0. Regarding education,Footnote 15 we use the CES categories: No schooling (0); Some elementary school; Completed elementary school; Some secondary/high school; Completed secondary/high school; Some technical, community college, CEGEP, College Classique; Completed technical, community college, CEGEP, College Classique; Some university; Bachelor degree; Master’s Degree; Professional degree or doctorate (1). For income, we combine two questions: “What was your total household income, before taxes, for the year? Be sure to include income from all sources, to the nearest thousand dollars.” and “We don’t need the exact amount; does your household income fall into one of these broad categories? (No income (0); $1–$30,000; $30,001–$60,000; $60,001–$90,000; $90,001–$110,000; $110,001–$150,000; 150,001–$200,000; More than $200,000 (1)).” We use the categories from the second question.
Regarding the region of residence, we consider Quebec, British Columbia, the Prairies (comprising Alberta, Saskatchewan, and Manitoba), and the Atlantic (New Brunswick, Nova Scotia, Prince Edward Island, and Newfoundland and Labrador), using Ontario as a baseline. The number of respondents in the three territories (Yukon, Nunavut, and Northwest Territories) was insufficient.Footnote 16 We code political interest using the following question: “How interested are you in politics generally?” Answers range from 0 to 10, “where 0 means no interest at all and 10 means a great deal of interest.” We also recode the answer between 0 and 1. For ideology, respondents were asked to place themselves on a 0–10 scale, “where 0 means the left and 10 means the right.” We recode the answer between 0 and 1. Lastly, respondents could answer “Don’t know/Pefer not to answer” to all questions. In that case, we recode it as missing.
Results
Table 1 provides a first descriptive overview of our sample.Footnote 17
Description of the sample
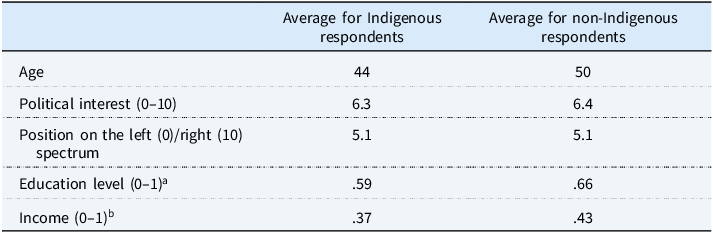
Table 1 Long description
The table compares average values for Indigenous and non-Indigenous respondents across various categories. It has two columns: one for Indigenous respondents and one for non-Indigenous respondents. The table includes five rows with the following categories: Age, Political interest, Position on the left/right spectrum, Education level, and Income. Row 1: Age, Indigenous respondents 44, non-Indigenous respondents 50. Row 2: Political interest (0-10), Indigenous respondents 6.3, non-Indigenous respondents 6.4. Row 3: Position on the left (0)/right (10) spectrum, Indigenous respondents 5.1, non-Indigenous respondents 5.1. Row 4: Education level (0-1), Indigenous respondents 0.59, non-Indigenous respondents 0.66. Row 5: Income (0-1), Indigenous respondents 0.37, non-Indigenous respondents 0.43.
a In both cases, the median value is .6.
b The exact income is not available for all respondents. In the case of both Indigenous and non-Indigenous respondents, the modal category is 30,001–60,000 CAD/year. Answers are coded on a scale from 0 to 1, where 0 represents no income and 1 represents income over 200,000 CAD/year. The median income of Indigenous respondents is .28, whereas it reaches .48 for non-Indigenous respondents.
Vote Likelihood
We begin by exploring how Indigenous respondents may differ from others in terms of their intention to vote in a federal election. As it is drawn from the CES, this model is not grounded in Indigenous Peoples’ views of self-determination, which is an important limit of our dataset. Figure 2 shows how Indigeneity, as well as some of the control variables, influences vote likelihood.Footnote 18
Influence of Indigeneity on the intent to vote in federal elections (2019–2021).
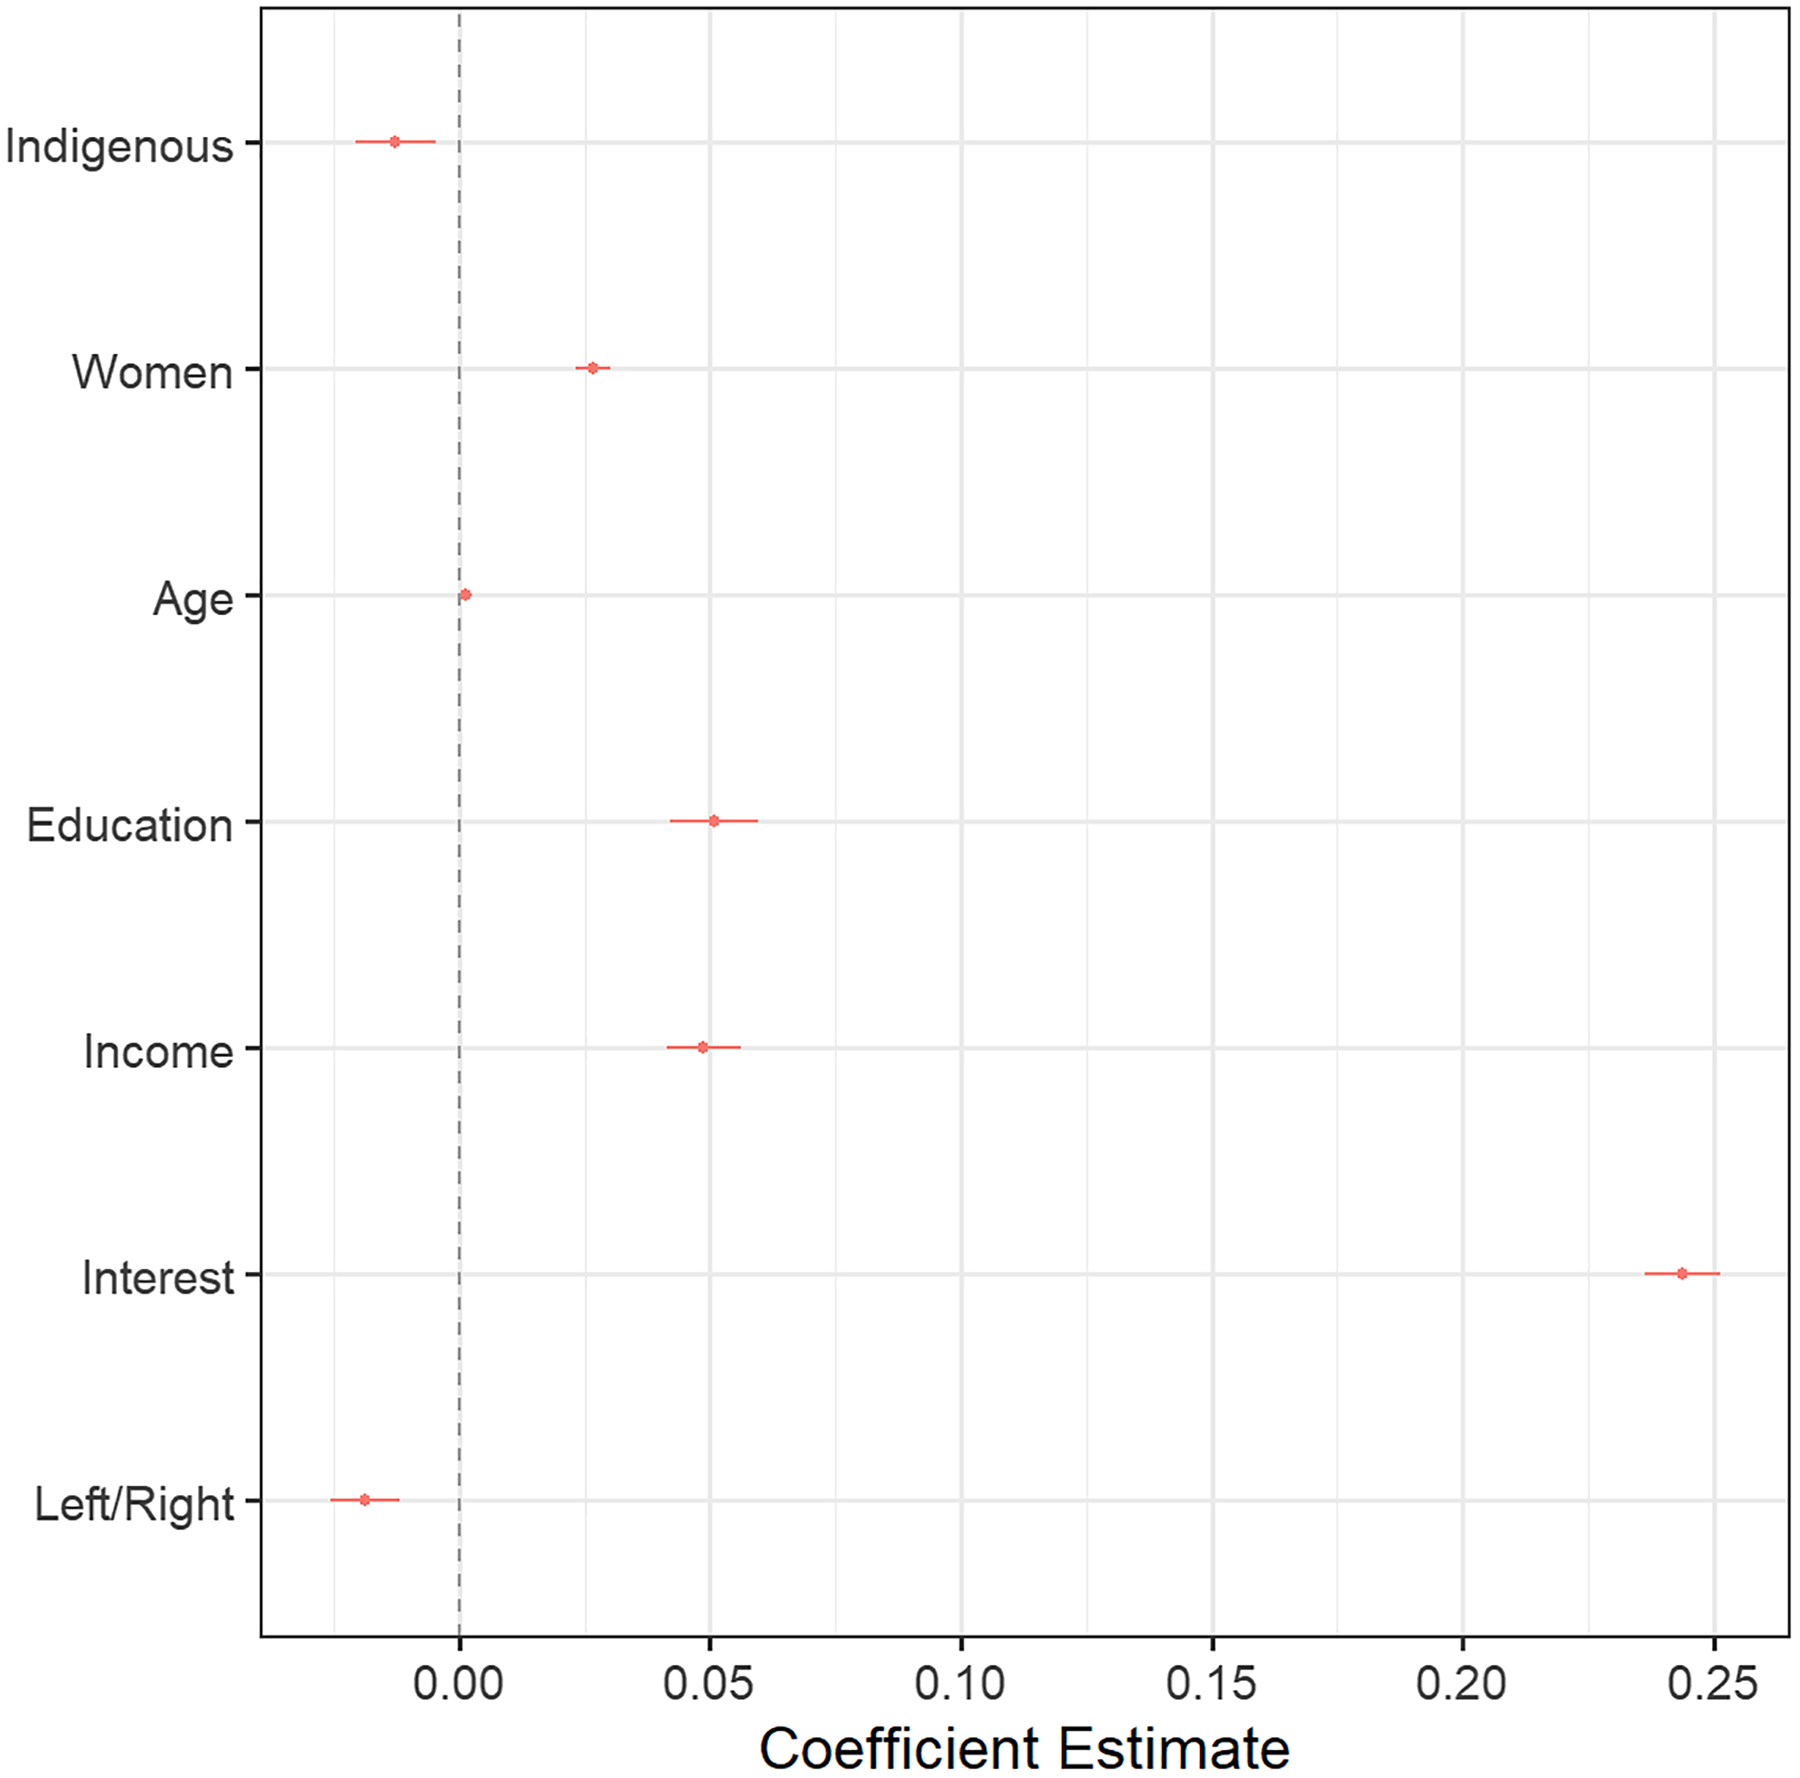
Figure 2 Long description
A line graph displays the coefficient estimates for various factors influencing the intent to vote in federal elections among Indigenous Peoples in Canada from 2019 to 2021. The x-axis represents the coefficient estimate values ranging from 0.00 to 0.25. The y-axis lists the factors: Indigenous, Women, Age, Education, Income, Interest, and Left/Right. Each factor is represented by a red dot with error bars indicating the range of estimates. The Indigenous factor shows a coefficient estimate close to 0.00. The Women factor has a slightly higher estimate around 0.02. Age shows a coefficient estimate near 0.03. Education and Income both have estimates around 0.04. Interest has the highest estimate, close to 0.25. Left/Right shows a coefficient estimate near 0.00. All values are approximated.
We see that political interest has a strong, significant influence on one’s willingness to vote (.244). This appears unsurprising, given that, as Blais and Daoust (Reference Blais and Daoust2020, 31) state, “(…) the decision to vote or not to vote in an election reflects first and foremost how much or how little someone likes politics.” Identifying as a woman (.051) and having a higher income (.049) both increase vote likelihood. Also consistent with the literature is the statistically significant positive influence of other control variables, such as age (.001) and education (.051) (Blais and Daoust Reference Blais and Daoust2020), whereas being right-leaning has a negative influence (−.019).
Regarding our variable of interest, identifying as Indigenous has a significant negative impact on the intent to vote in federal elections (−.013). This result reflects the current state of the literature on Indigenous turnout in Canada and supports our first hypothesis: “Compared to non-Indigenous Canadians, Indigenous individuals are more likely to consider abstention.”
Vote Choice among Indigenous Respondents
Next, we investigate the influence of Indigeneity on vote intentions at the federal level, using the incumbent (LPC) as a reference category. A multinomial logistic regression allows us to determine how likely (or unlikely) respondents are to favor a given political party over the Liberals depending on Indigeneity, gender, age, level of education, income, level of political interest, self-placement on the left/right spectrum, and region (using Ontario as the reference category).Footnote 19
Figure 3 shows that Indigenous respondents are significantly less likely to support the CPC than the LPC (−.211). Next, we see they are more likely to choose the left-wing NDP (.293), Greens (.246), or the right-wing PPC (.387) over the LPC than other Canadians. Last, the influence of Indigeneity on support for the BQ is not statistically significant.
Influence of Indigeneity on vote choice in federal elections (2019–2021).
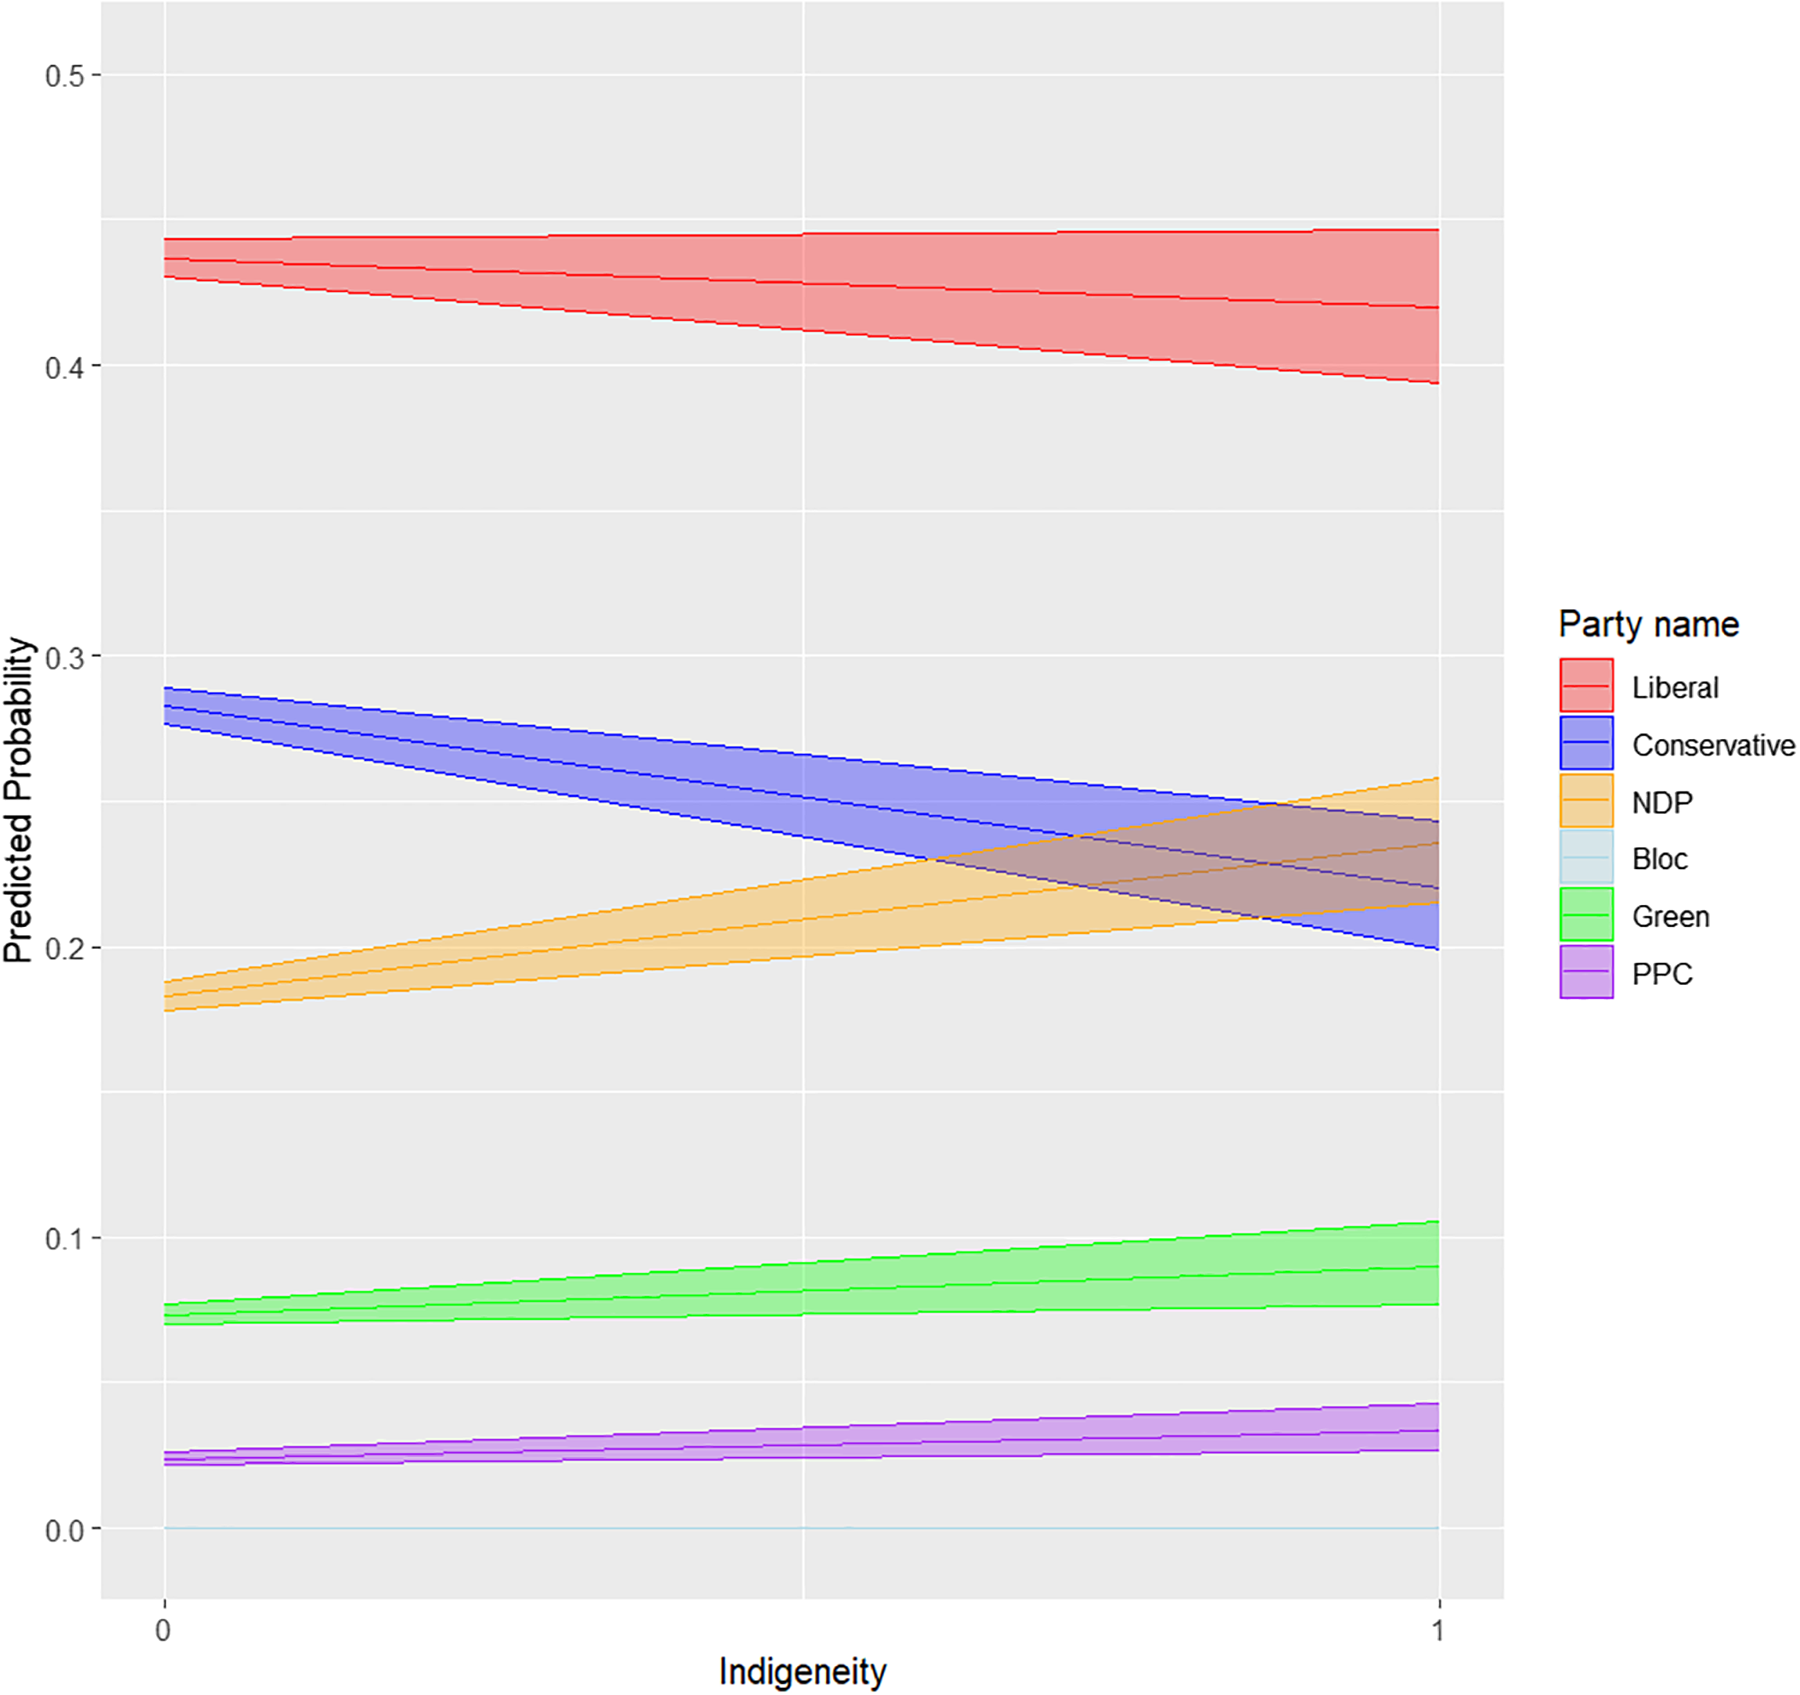
Figure 3 Long description
The line graph illustrates the influence of Indigeneity on vote choice in federal elections between 2019 and 2021. The x-axis represents Indigeneity, ranging from 0 to 1, while the y-axis represents the predicted probability, ranging from 0 to 0.5. The graph includes six data lines, each representing a different political party: Liberal, Conservative, NDP, Bloc, Green, and PPC. The Liberal party line, in red, starts at a predicted probability of around 0.45 and slightly decreases as Indigeneity increases. The Conservative party line, in blue, starts at a predicted probability of around 0.3 and decreases as Indigeneity increases. The NDP party line, in yellow, starts at a predicted probability of around 0.2 and increases as Indigeneity increases. The Bloc party line, in light blue, starts at a predicted probability of around 0.1 and slightly increases as Indigeneity increases. The Green party line, in green, starts at a predicted probability of around 0.05 and slightly increases as Indigeneity increases. The PPC party line, in purple, starts at a predicted probability of around 0.02 and slightly increases as Indigeneity increases. All values are approximated.
Regarding our control variables (see Table A2), results are consistent with the literature on political behavior at the federal level in Canada (Gidengil et al. Reference Gidengil, Blais, Nadeau and Nevitte2003; Kiss et al. Reference Kiss, Polacko and Graefe2023). Women are less likely to vote for most of the other parties than the Liberals, except for the NDP. Age has a negative impact on the likelihood of voting for the NDP (−.024) and the Greens (−.018) over the Liberals and a positive impact on the CPC (.007) and the Bloc (.020). Education has a negative impact on the likelihood of voting for any other party than the Liberals. Higher income levels are associated with a greater likelihood of favoring the CPC (.641) and a lower chance to vote for the NDP (−.839), Green Party (−.828), or PPC (−.509). Political interest has a negative impact on the likelihood of voting for the CPC (−.446), NDP (−.507), and Green Party (−.842). In terms of ideology, right-leaning respondents are more likely to favor the CPC (4.498) or the PPC (4.502) and less likely to vote for the NDP (−1.573) or the Greens (−.746).
Given the size of our Indigenous sample, we can evaluate the role the intersection of gender and Indigeneity may play on vote choice. Figures 4 and 5 present, respectively, our multinomial regression, focusing this time only on Indigenous respondentsFootnote 20 and then only on women.Footnote 21 Looking at Figure 4, we note that, consistent with what is observed in the general population (Gidengil et al. Reference Gidengil, Blais, Nadeau and Nevitte2003), Indigenous women remain less likely than their male counterparts to favor right-leaning political parties (the CPC (−.403) and the PPC (−.638)). They are also less likely than non-Indigenous women to vote for the Conservatives (−.322) and more likely to choose the NDP (.246) or the Green Party (.259) over the LPC.
Influence of gender on vote choice among Indigenous respondents in federal elections (2019–2021).
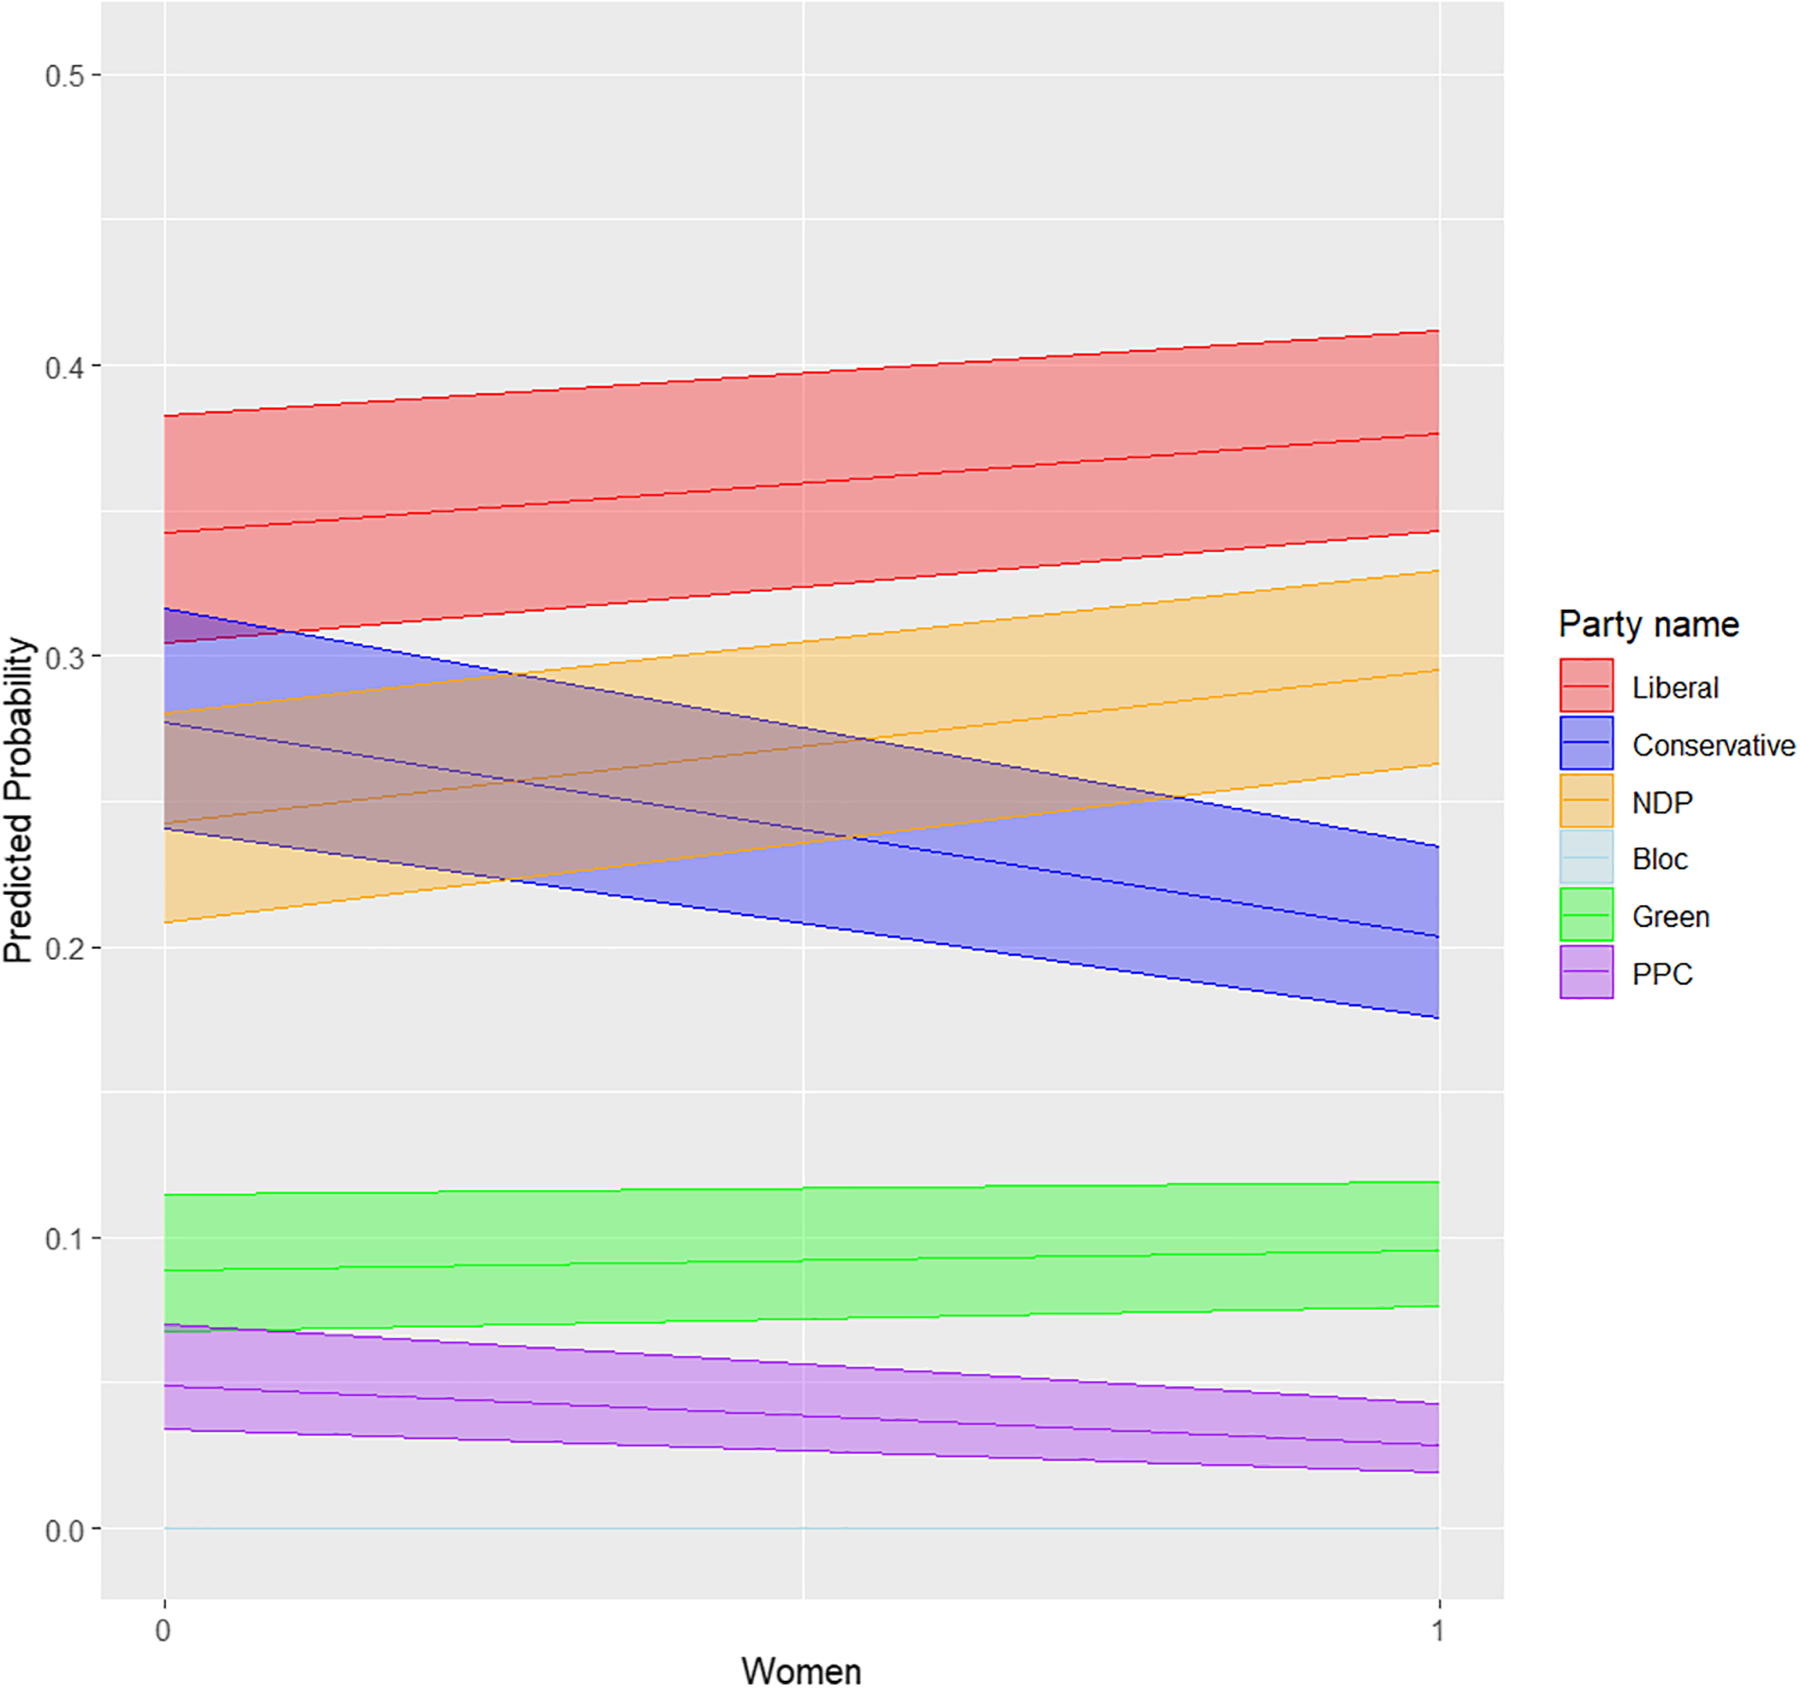
Figure 4 Long description
The line graph illustrates the predicted probability of voting for various political parties among Indigenous women in Canada. The x-axis represents the proportion of women, ranging from 0 to 1, while the y-axis represents the predicted probability, ranging from 0 to 0.5. The graph includes six data lines, each representing a different political party: Liberal, Conservative, NDP, Bloc, Green, and PPC. The Liberal party, shown in red, starts with a predicted probability of around 0.3 and increases slightly as the proportion of women increases. The Conservative party, shown in blue, starts with a predicted probability of around 0.3 and decreases as the proportion of women increases. The NDP, shown in yellow, starts with a predicted probability of around 0.2 and increases as the proportion of women increases. The Bloc, shown in light blue, starts with a predicted probability of around 0.1 and remains relatively constant. The Green party, shown in green, starts with a predicted probability of around 0.1 and remains relatively constant. The PPC, shown in purple, starts with a predicted probability of around 0.05 and remains relatively constant. All values are approximated.
Influence of Indigeneity on vote choice among women in federal elections (2019–2021).
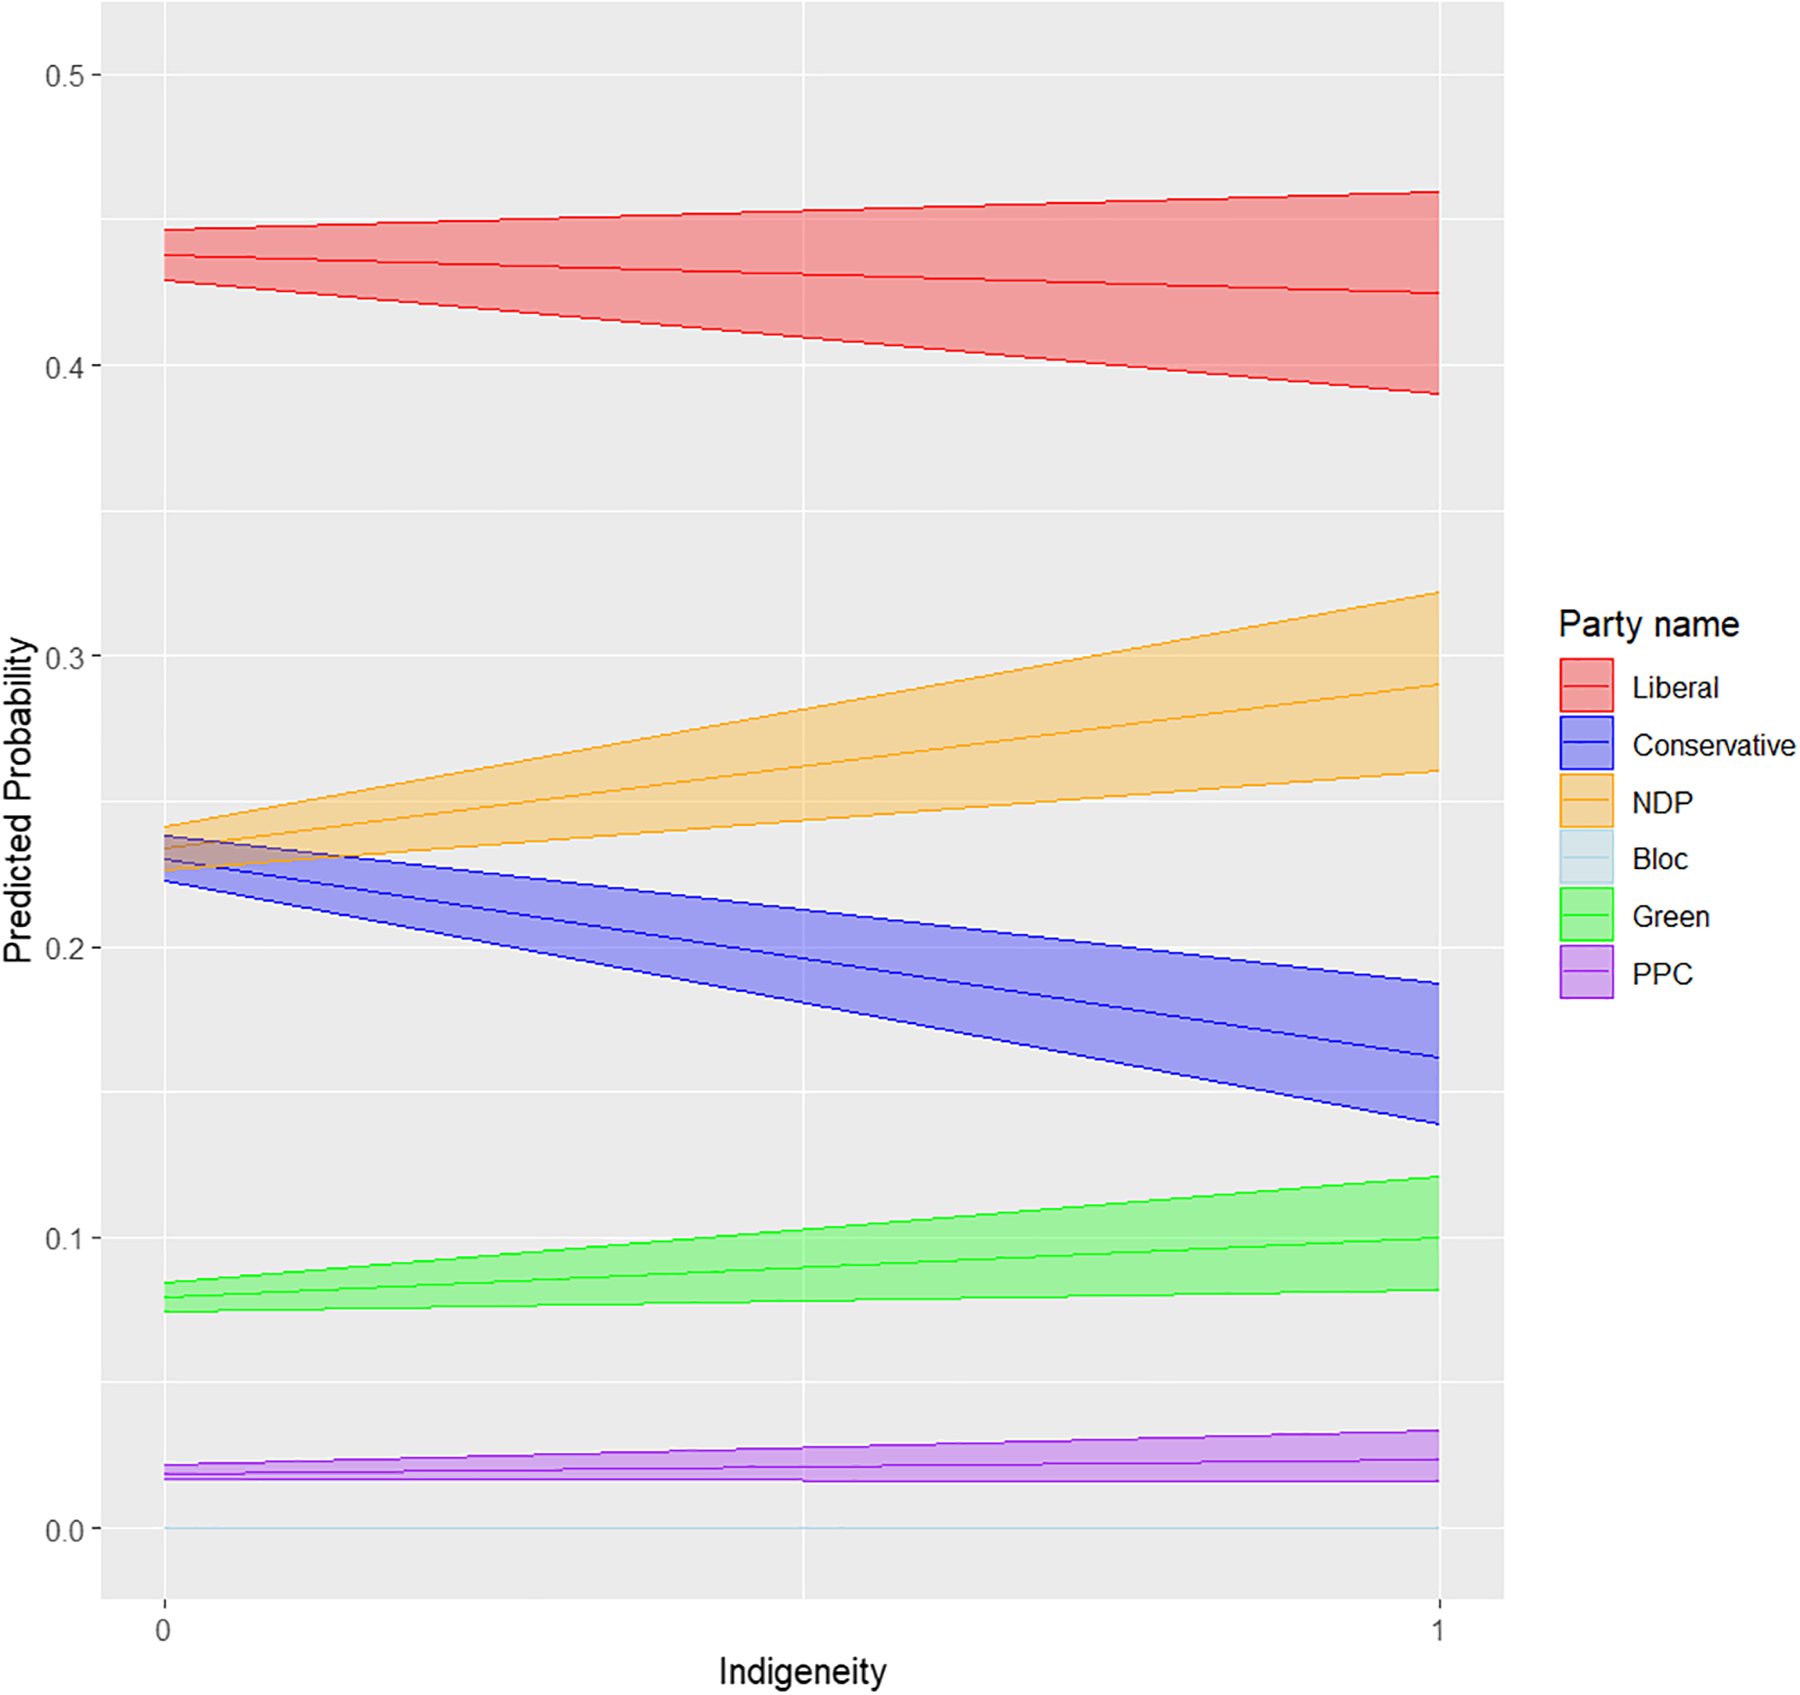
Figure 5 Long description
The line graph illustrates the influence of Indigeneity on vote choice among women in federal elections between 2019 and 2021. The x-axis represents Indigeneity, ranging from 0 to 1, while the y-axis represents the predicted probability, ranging from 0 to 0.5. The graph includes five data lines, each representing a different political party: Liberal, Conservative, N D P, Bloc, and Green. The Liberal party line, in red, starts at a predicted probability of approximately 0.45 and slightly decreases as Indigeneity increases. The Conservative party line, in blue, starts at a predicted probability of around 0.25 and gradually decreases as Indigeneity increases. The N D P party line, in yellow, starts at a predicted probability of about 0.1 and significantly increases as Indigeneity increases. The Bloc party line, in light blue, starts at a predicted probability of around 0.05 and remains relatively flat. The Green party line, in green, starts at a predicted probability of approximately 0.1 and slightly increases as Indigeneity increases. All values are approximated.
Figure 6 presents the predicted vote likelihood of Indigenous and non-Indigenous respondents for different federal political parties in 2019 and 2021. We focus on four groups (Indigenous women, Indigenous men, non-Indigenous women, and non-Indigenous men), holding all variables but Indigeneity and gender at the sample’s average value.
Predicted vote likelihood of Indigenous and non-Indigenous respondents depending on gender (2019–2021).
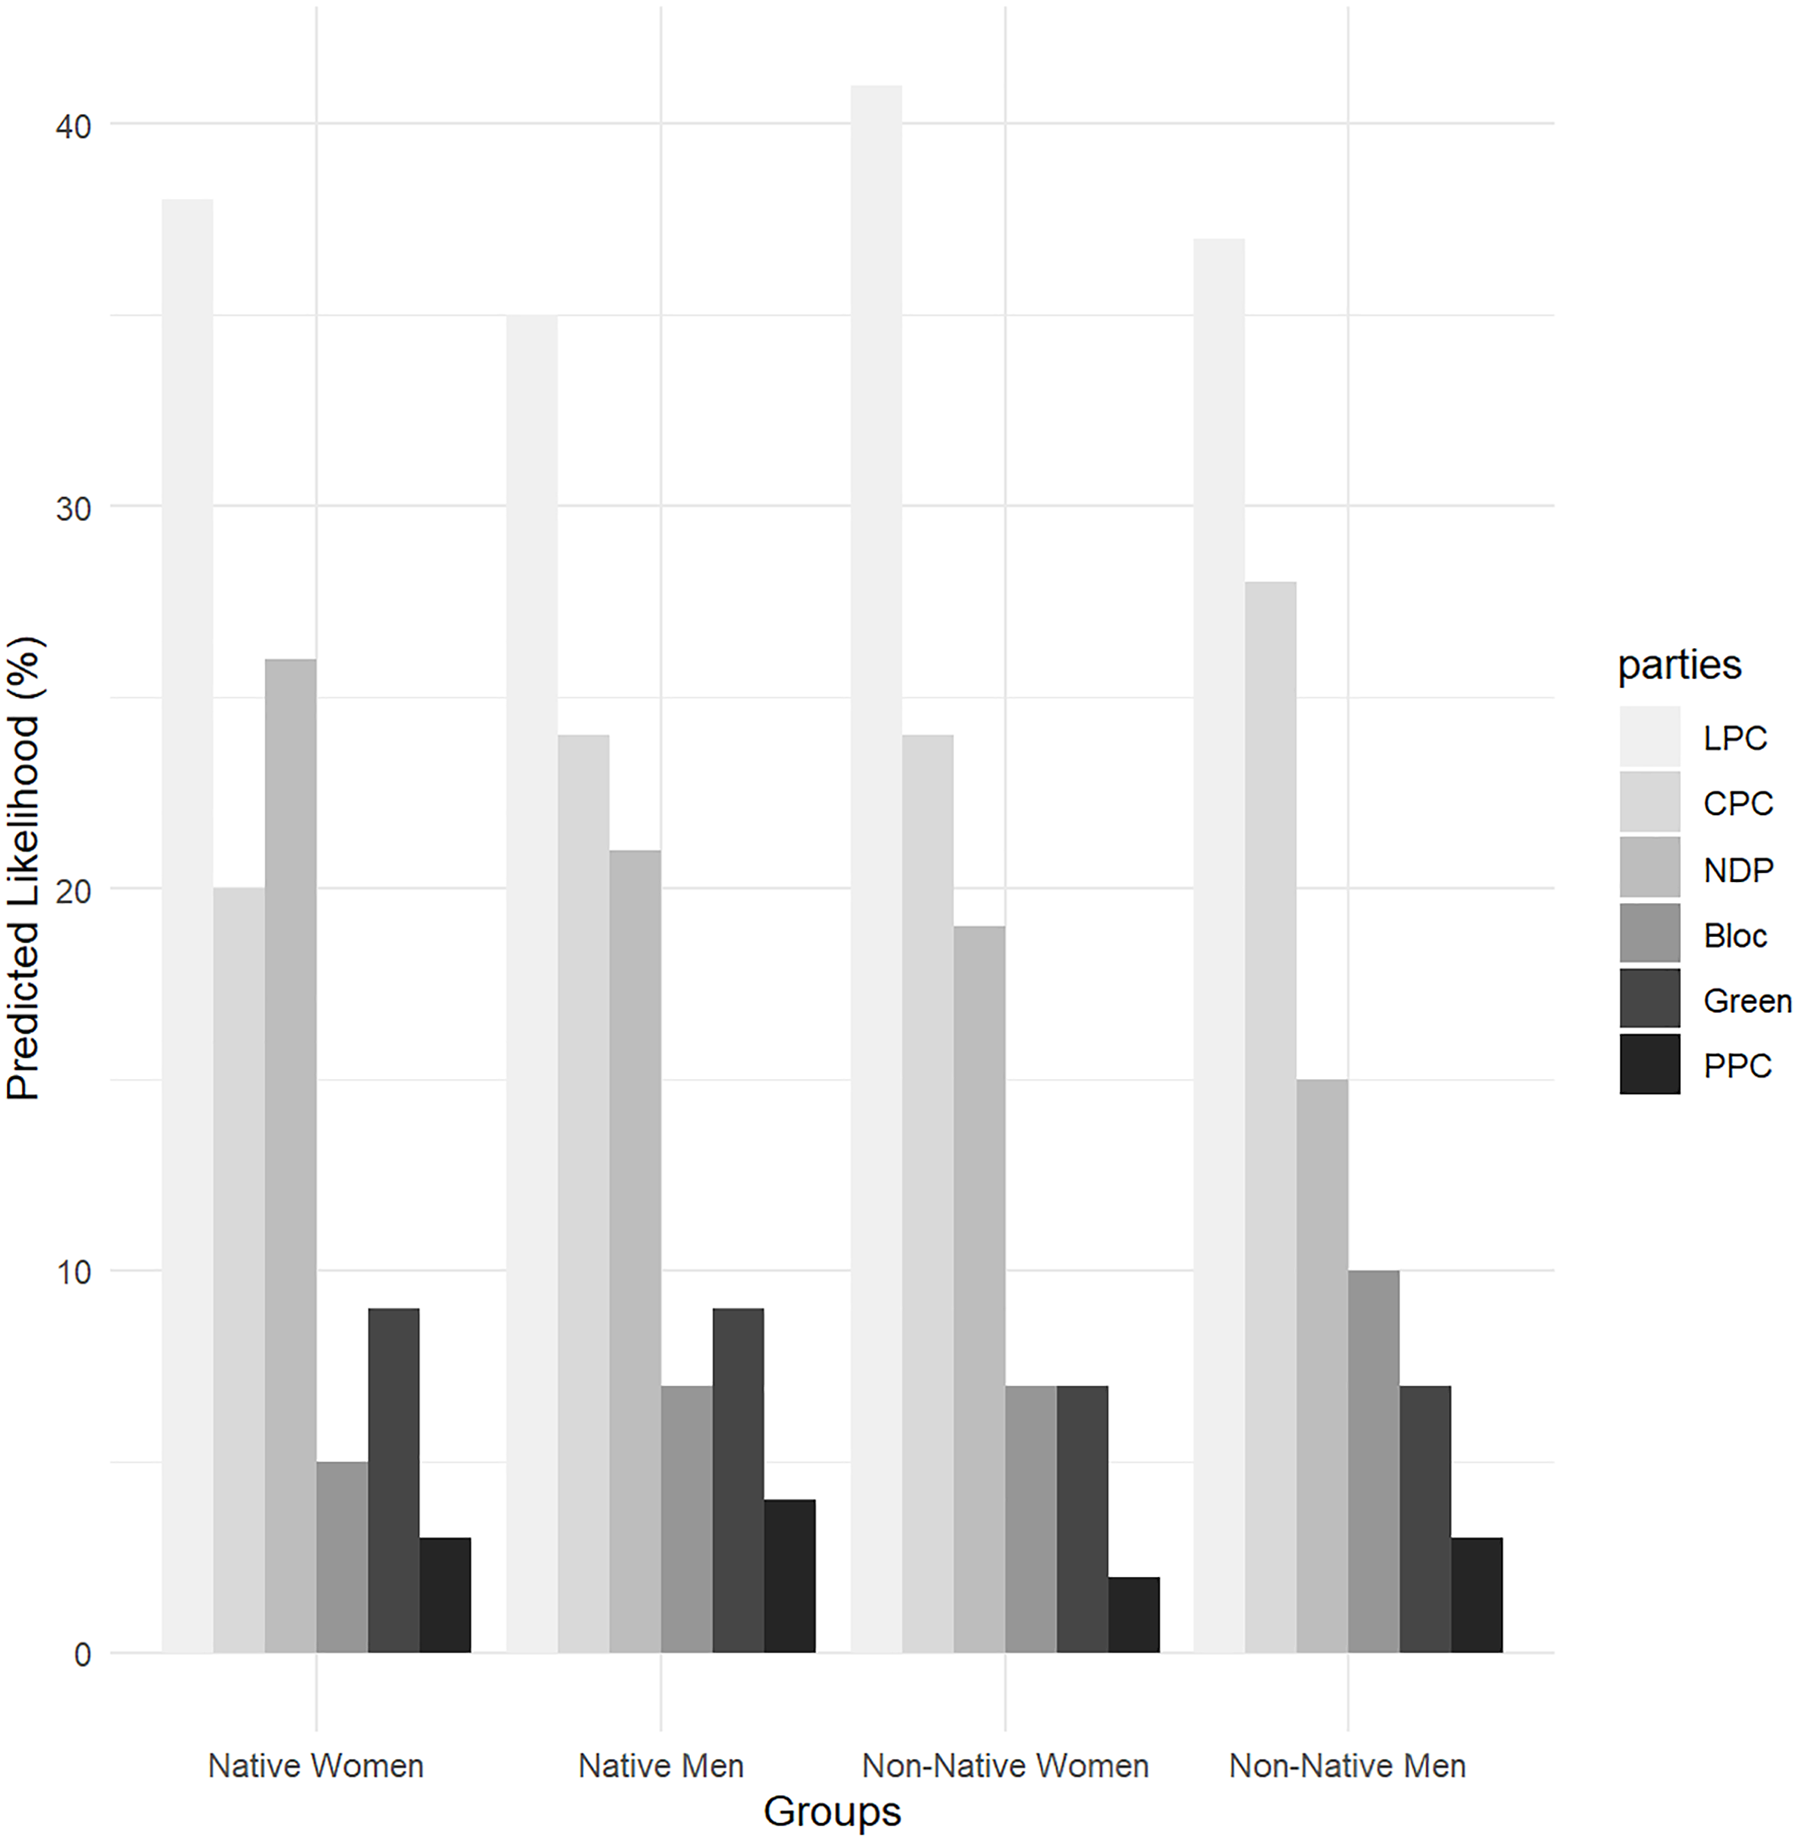
Figure 6 Long description
The bar graph compares the predicted likelihood of voting for different political parties among native and non-native women and men in Canada from 2019 to 2021. The x-axis categorizes the groups into native women, native men, non-native women, and non-native men. The y-axis measures the predicted likelihood in percentage, ranging from 0 to 40 percent. The graph includes five bars for each group, representing the Liberal Party of Canada (LPC), Conservative Party of Canada (CPC), New Democratic Party (NDP), Bloc Quebecois (Bloc), Green Party of Canada (Green), and People’s Party of Canada (PPC). Each bar is color-coded: LPC in light gray, CPC in medium gray, NDP in dark gray, Bloc in darker gray, Green in black, and PPC in the darkest gray. Native women show the highest predicted likelihood for the LPC, followed by CPC, NDP, Bloc, Green, and PPC. Native men follow a similar pattern but with slightly lower percentages for each party. Non-native women and men show higher predicted likelihoods for the LPC compared to native groups, with non-native men having the highest overall predicted likelihood for the LPC. The NDP and Bloc parties have relatively lower predicted likelihoods across all groups. The Green and PPC parties have the lowest predicted likelihoods. All values are approximated.
While all categories were more likely to support the Liberal Party than any other party, we note that this is particularly the case for non-Indigenous women (41%). Meanwhile, of all groups, non-Indigenous men were the ones with the highest likelihood of supporting the Conservative Party (37%). While also considering Figure 3, we conclude that, overall, Indigenous respondents were more likely than their non-Indigenous counterparts to show interest in third parties. In particular, among all groups, Indigenous women were the most likely to intend to vote for the NDP (26%), as displayed in Figure 6. Both Indigenous women and men were more likely than their non-Indigenous counterparts to support the Green Party, while Indigenous men are the most likely to intend to vote for the PPC (4%). With these two parties, however, the difference remains small.
While some of our results are consistent with what was previously put forward in the literature, notably pertaining to Indigenous support for the NDP and the Green Party, we highlight interesting findings. In particular, we point to the propensity of Indigenous respondents, and particularly Indigenous men, to support right-wing PPC. Consequently, we cannot confirm our second hypothesis: “Compared to non-Indigenous Canadians, Indigenous Peoples are more likely to vote for centrist or left-wing parties.”
Partisanship among Indigenous Respondents
Next, we look at partisanship among Indigenous respondents. Our goal is to first assess if Indigenous individuals are more or less likely to identify as partisans. We then look at their parties of choice.
Figure 7 illustrates the impacts of Indigeneity on the strength of partisanship, regardless of the party of choice.Footnote 22 Given the negative impact of Indigeneity on the intention to vote, we seek to determine if they will also be less likely to engage with federal political parties as partisans.
Influence of Indigeneity on strength of partisanship (2019–2021).
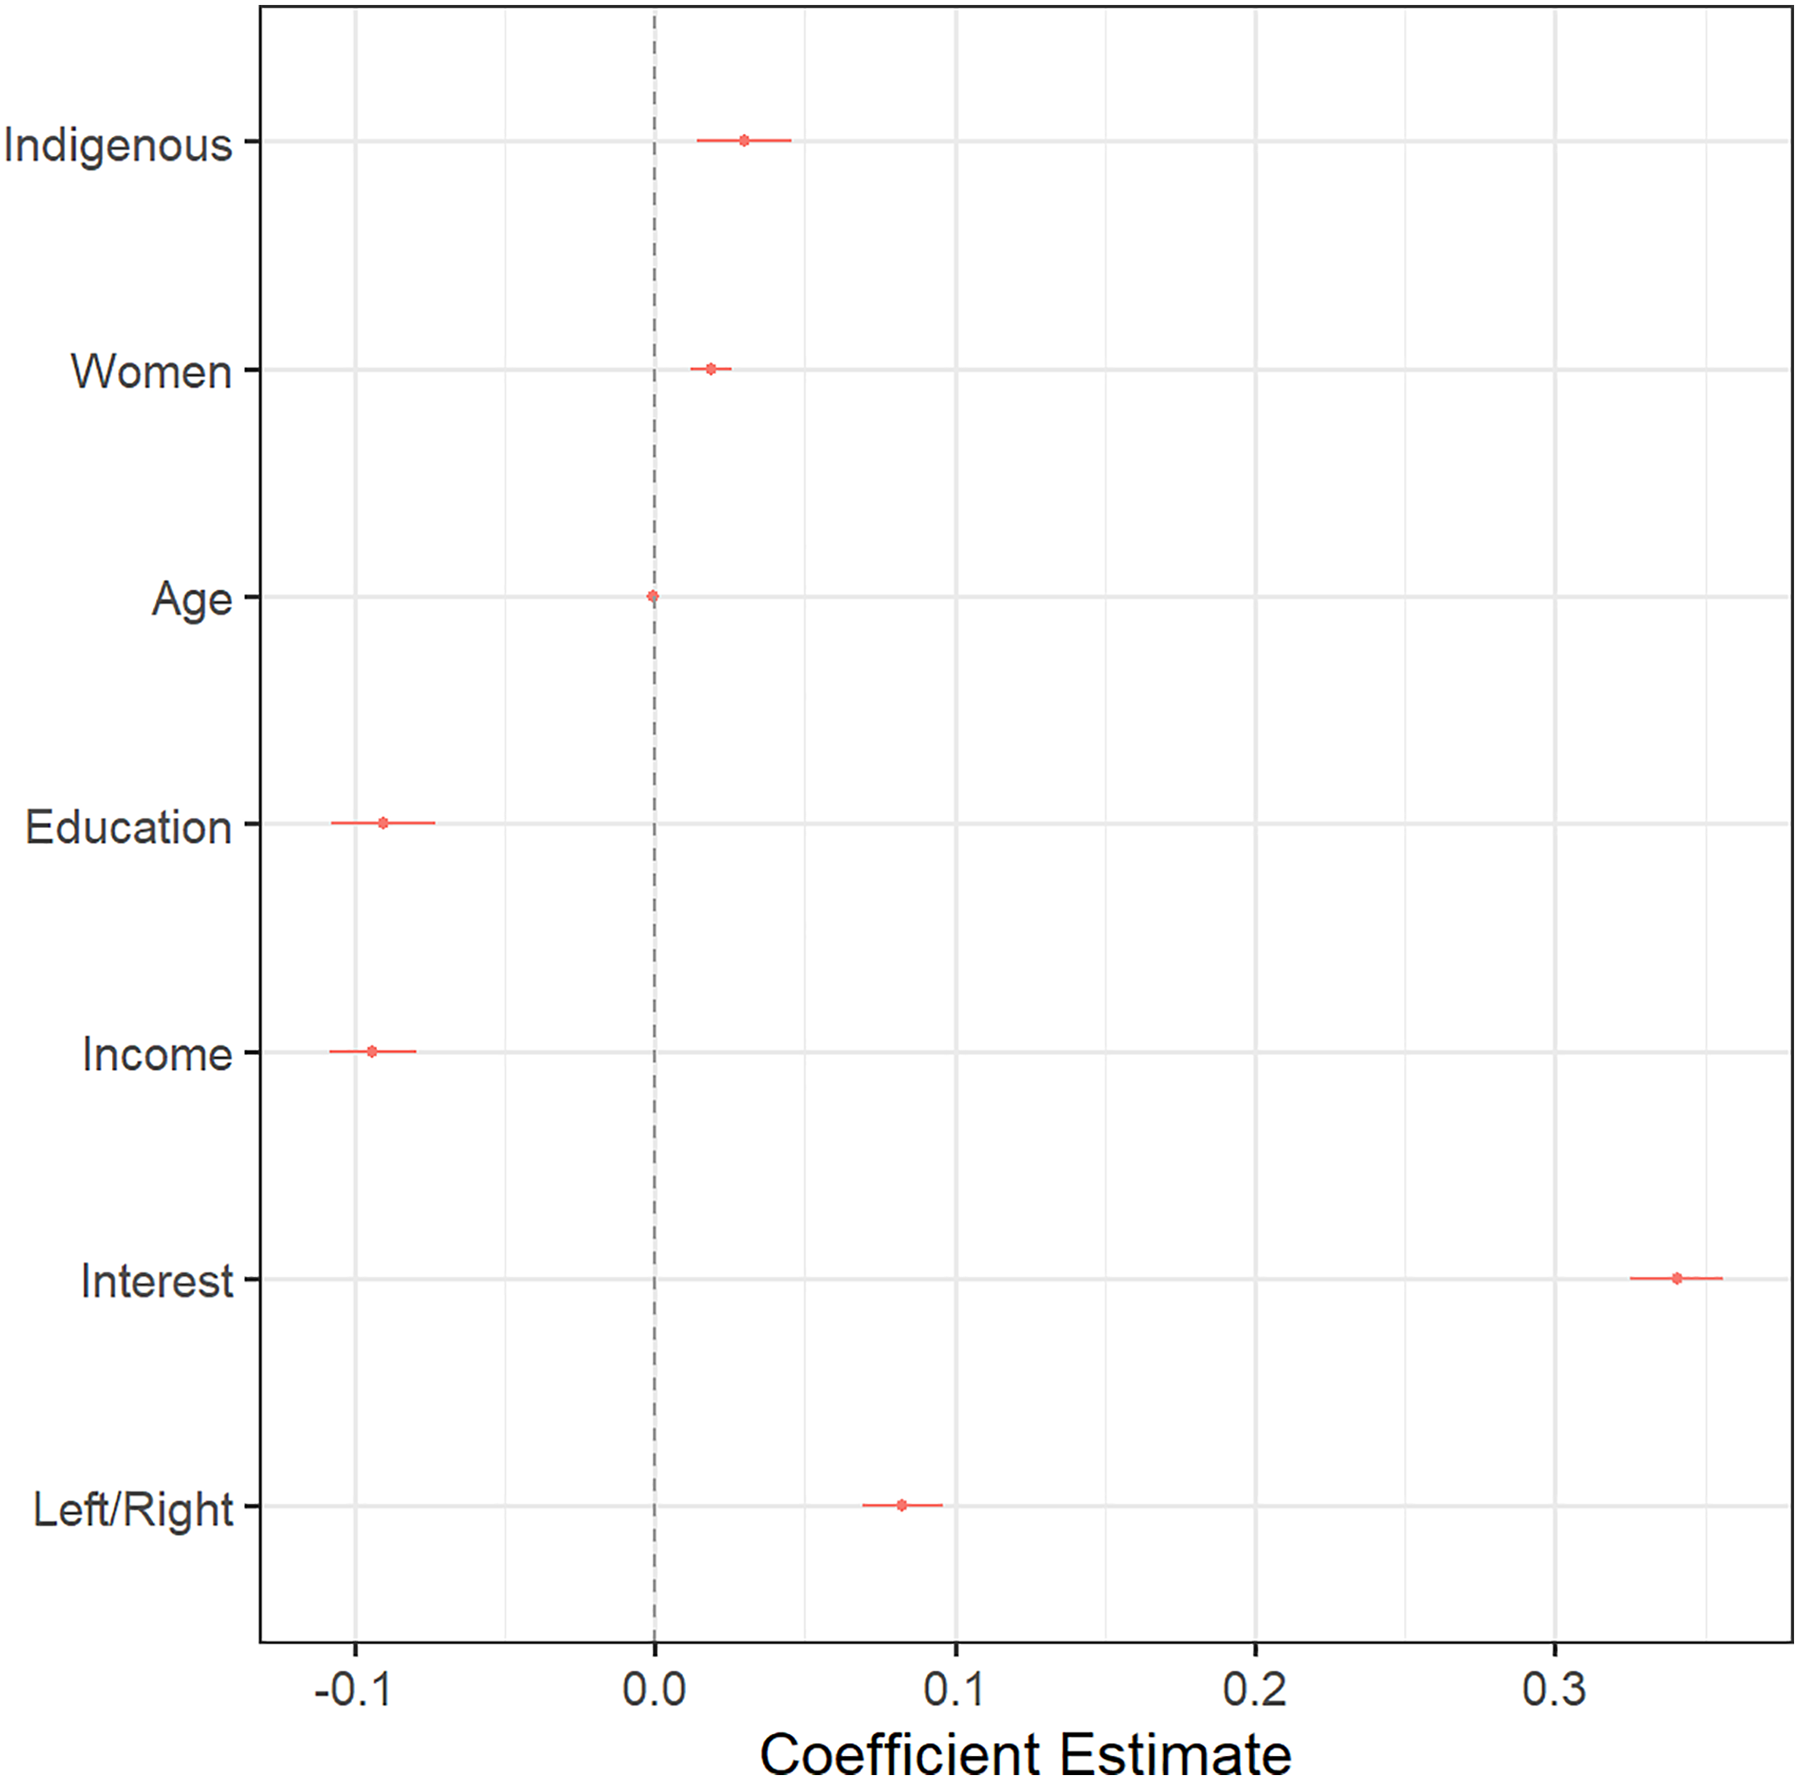
Figure 7 Long description
A line graph titled ‘Influence of Indigeneity on strength of partisanship (2019–2021).’ The x-axis represents different factors: Indigenous, Women, Age, Education, Income, Interest, and Left/Right. The y-axis represents the coefficient estimate ranging from -0.1 to 0.3. The graph shows data points for each factor with their respective coefficient estimates. Indigenous and Women have positive estimates close to zero, Age is at zero, Education and Income have negative estimates, Interest has a positive estimate around 0.3, and Left/Right has a small positive estimate. All values are approximated.
Looking at the full model (see Table A6), we note that women are more likely to strongly affiliate with a federal political party (.019). Political interest (.340) and right-leaning political ideology (.083) also have a positive influence on the strength of partisanship. Age (−.001), level of education (−.09), and level of income (−.094) have the opposite effect.
Contrary to our expectations, we find that identifying as Indigenous has a positive impact on the likelihood of strongly associating with a political party at the federal level (.03). A multinomial regressionFootnote 23 is used to understand which parties Indigenous respondents engage with as partisans (see Figure 8). We base our comparison on the incumbent LPC.
Influence of Indigeneity on party identification (2019–2021).
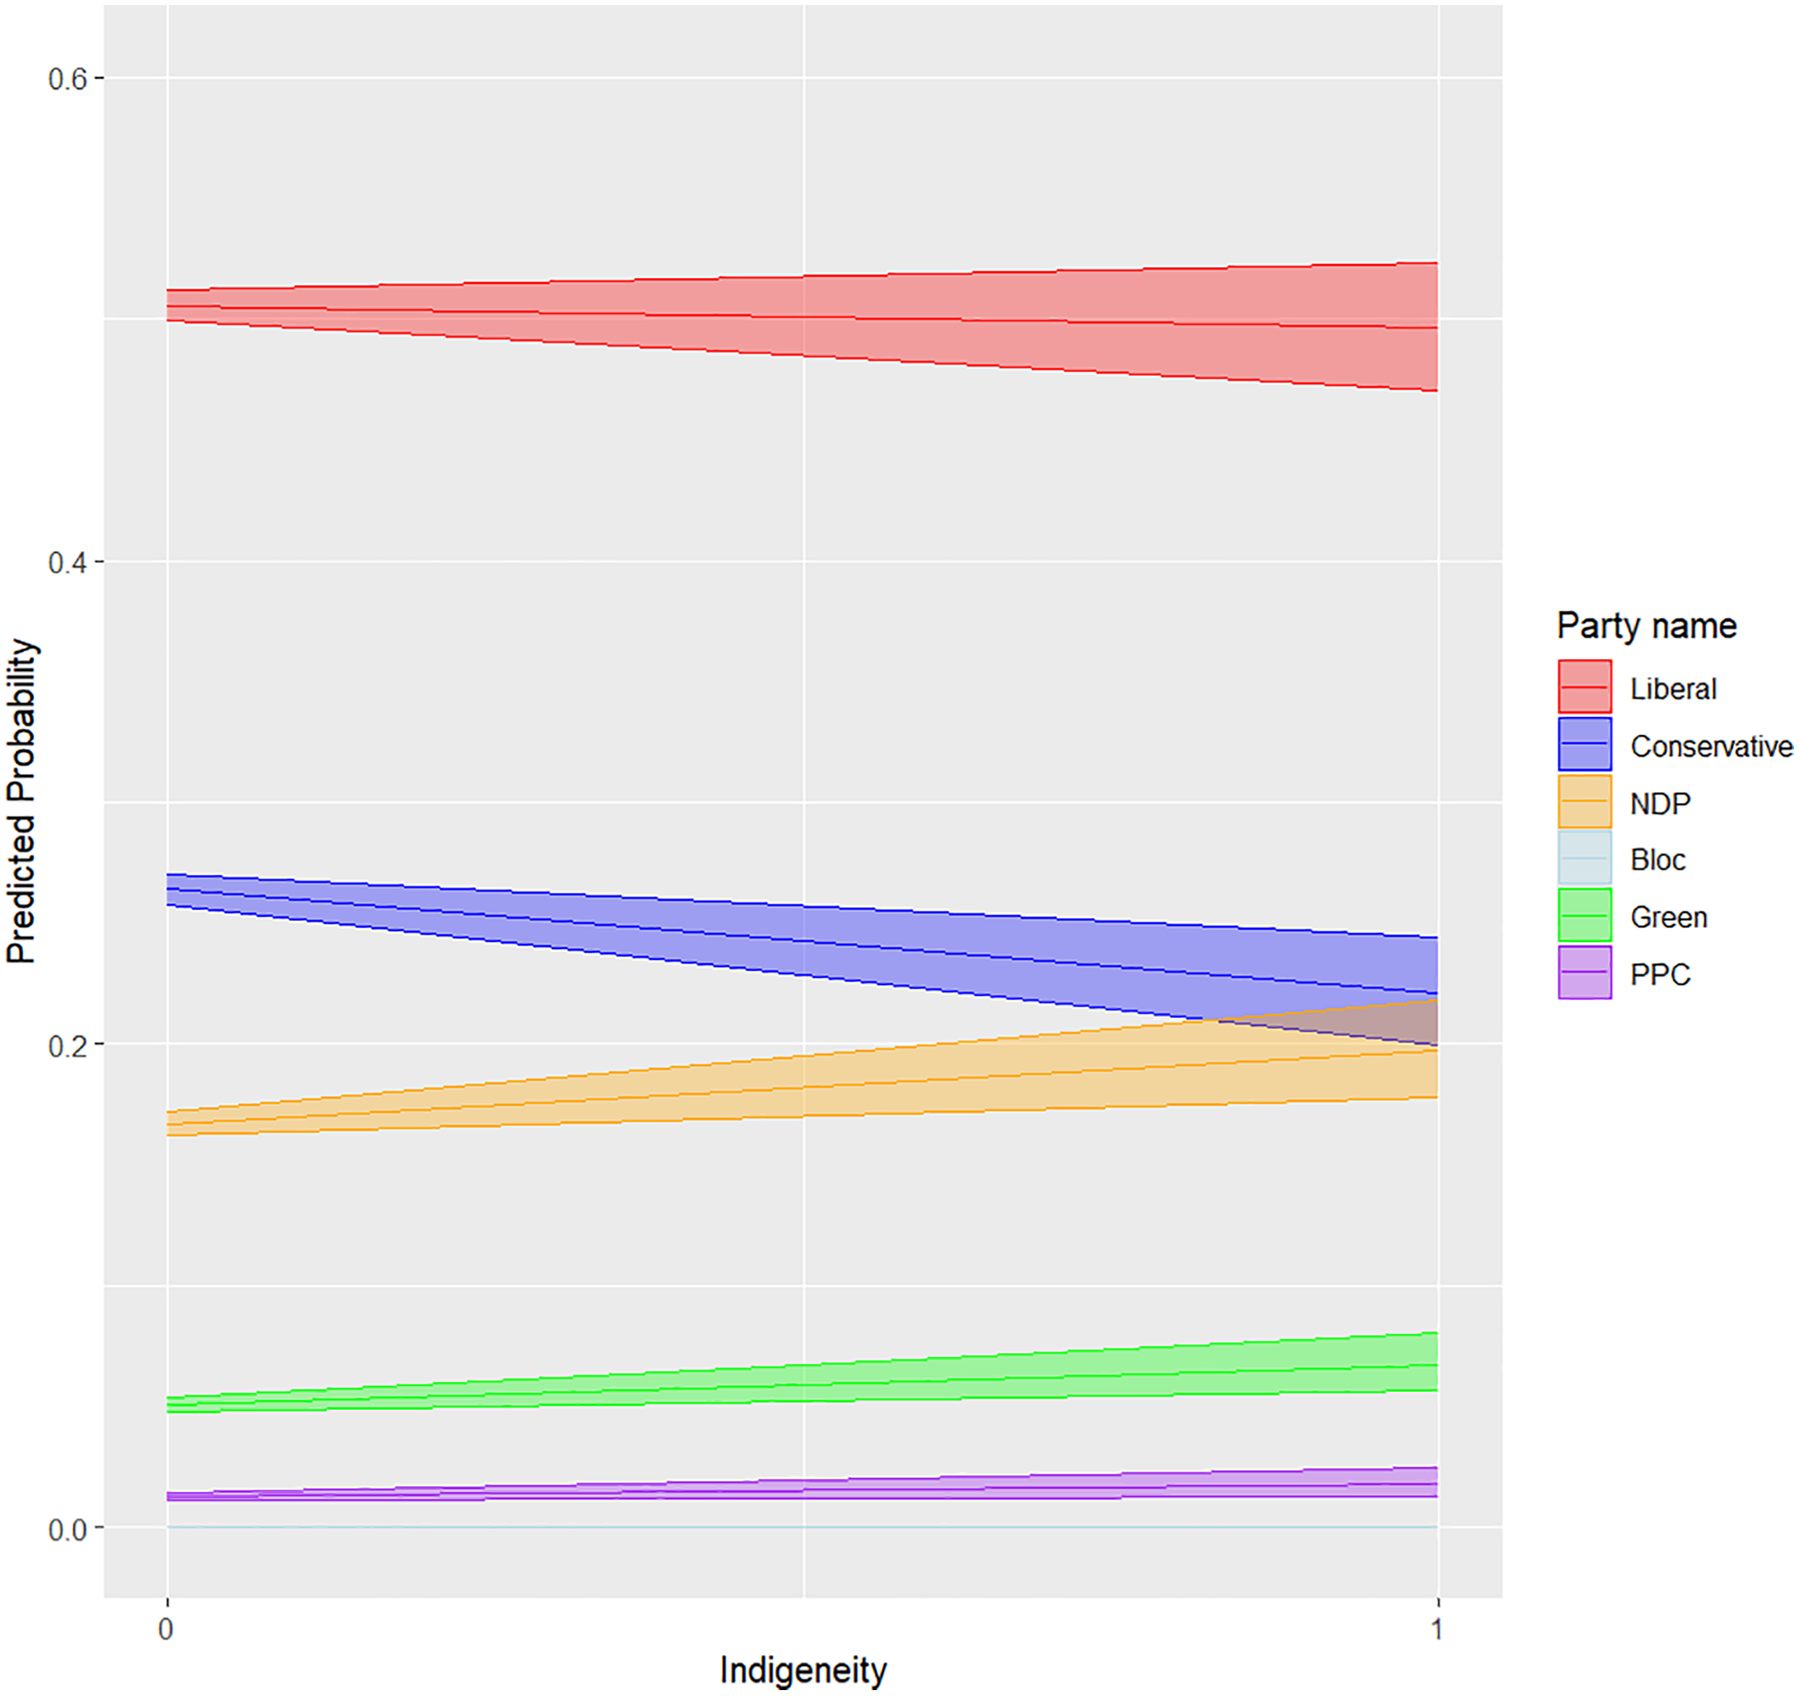
Figure 8 Long description
The line graph illustrates the predicted probability of party identification based on Indigeneity from 2019 to 2021. The x-axis represents Indigeneity, ranging from 0 to 1, while the y-axis represents the predicted probability, ranging from 0 to 0.6. The graph includes multiple colored lines representing different political parties: Liberal, Conservative, NDP, Bloc, Green, and PPC. The Liberal party line is red, the Conservative party line is blue, the NDP line is orange, the Bloc line is light blue, the Green party line is green, and the PPC line is purple. The Liberal party maintains the highest predicted probability across the range of Indigeneity, followed by the Conservative party. The NDP and Green parties show moderate predicted probabilities, while the Bloc and PPC parties have the lowest predicted probabilities. All values are approximated.
First, regarding our control variables, we find that age (.006), income (.625), and right-leaning ideology (4.817) have a positive impact on the likelihood of being a partisan of the CPC instead of the LPC, whereas identifying as a woman (−0.359), level of education (−.913), and political interest (−.378) have the opposite effect. For the NDP, only identifying as a woman has a positive effect (.104). Most other control variables have a significant negative effect, except for political interest, which fails to reach statistical significance. As for the Bloc, identifying as a woman (−.132), education (−.904), and leaning toward the right side of the political spectrum have a significant negative effect on the likelihood of being a partisan. Age (.022) has the opposite effect. Regarding the Green Party, we note the negative impact of age (−.024), education (−.745), income (−1.274), political interest (−.72), and right-leaning ideology (−1.120). Finally, for the PPC, we find that identifying as a woman (−.334), age (−.022), education (−1.409), and income (−.770) have a negative effect, whereas the right-wing ideology’s effect is positive (4.433).
Regarding the impact of Indigeneity on party identification, we see, first, that these respondents are less likely to favor the CPC over the LPC (−.159) than their non-Indigenous counterparts. The effect of Indigeneity on identifying as an NDP partisan, though, is positive (.184). While the relationship is not statistically significant with the BQ, we find that Indigenous respondents are more likely to identify with both the Green Party (.304) and the PPC (.353). Once more, we note a trend toward a stronger affinity of Indigenous respondents toward third parties, which includes the right-wing PPC. Given our findings, we reject our third hypothesis: “Compared to non-Indigenous Canadians, Indigenous individuals are less likely to affiliate strongly with a federal political party.”
The Attitudes of Indigenous Respondents toward Public Spending
Lastly, we consider the political attitudes of Indigenous Peoples, focusing specifically on their opinions toward public spending. Figure 9 portrays the effect of Indigeneity on one’s opinion on government spending on education, the environment, law and justice, defense, and immigrants and minorities.Footnote 24
Influence of Indigeneity on opinion toward government spending (2019–2021).
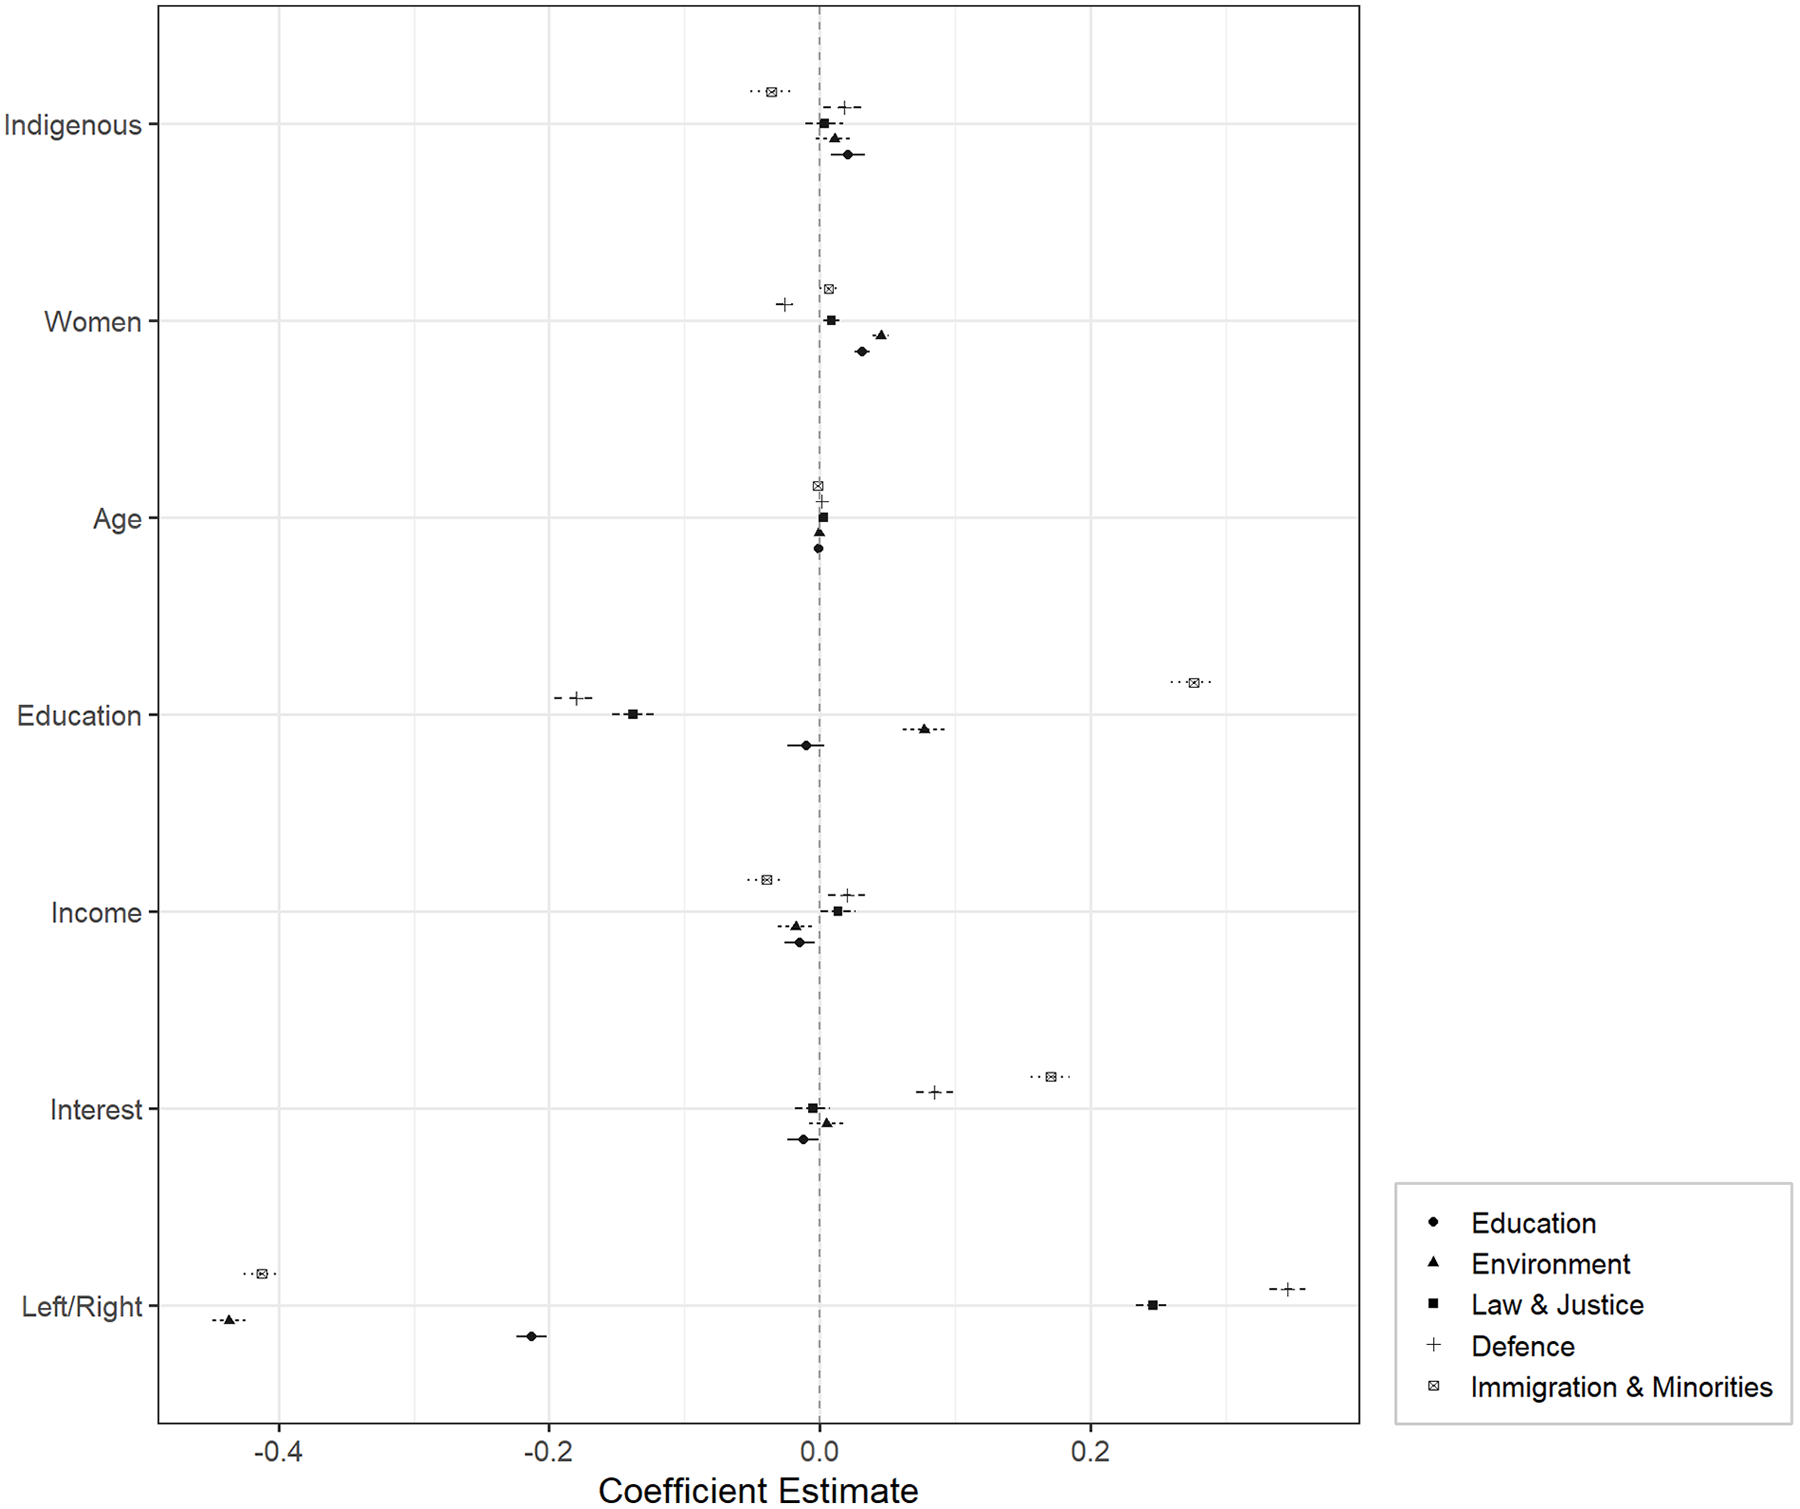
Figure 9 Long description
A scatter plot showing the influence of Indigeneity on opinion toward government spending from 2019 to 2021. The plot features several data points representing different categories such as Education, Environment, Law and Justice, Defence, and Immigration and Minorities. The x-axis represents the coefficient estimate, ranging from approximately -0.4 to 0.2. The y-axis lists various demographic factors including Indigenous, Women, Age, Education, Income, Interest, and Left/Right. Each data point is marked with different shapes and colors to represent the categories. The plot shows clusters of data points around the zero mark on the x-axis, with some points deviating significantly in both positive and negative directions. The data points for Indigenous, Women, and Age are concentrated around the zero estimate, while Education, Income, Interest, and Left/Right show more spread. The plot indicates varying levels of influence across different demographic factors and spending categories. All values are approximated.
Unsurprisingly, Figure 9 shows that individuals who place themselves on the right side of the political spectrum tend to favor spending on law and justice (.246) and defense (.345), whereas spending related to education (−.213), the environment (−.437), and immigrants and minorities (−.412) is commonly associated with the left.
Women are more likely to favor spending on education (.031), the environment (.045), immigrants and minorities (.006), and law and justice (.009). They are less likely to support spending on defense (−.026). Increasing age has a positive effect on one’s opinion toward law and justice (.003), defense (.002), and a negative impact on education (−.001), the environment (−.001), and immigrants and minorities (−.002). Education has a positive effect on the environment (.077) and immigrants and minorities (.276) and a negative effect on justice (−.138) and the military (−.180). Income has a negative effect on education (−.015), the environment (−.018), and immigration (−.039). It has a positive effect on the opinion toward justice (.013) and defense (.020). Finally, political interest has a positive effect on the military (.085) and immigration (.170), as well as a negative impact on education (−.012).
Regarding Indigenous respondents, we find they are significantly more likely to support increased spending related to education (.021) and defense (.018). For environmental spending, the coefficient, although positive, does not reach statistical significance, meaning that Indigenous respondents did not differ from non-Indigenous respondents in this regard. Additionally, we find that Indigenous respondents are significantly less likely to support the government spending funds on immigrants and minorities (−.036). To further verify this, we also look at respondents’ evaluation of racial minorities and immigrants as social groups in Figure 10.Footnote 25
Influence of Indigeneity on the evaluation of racial minorities and immigrants (2019–2021).
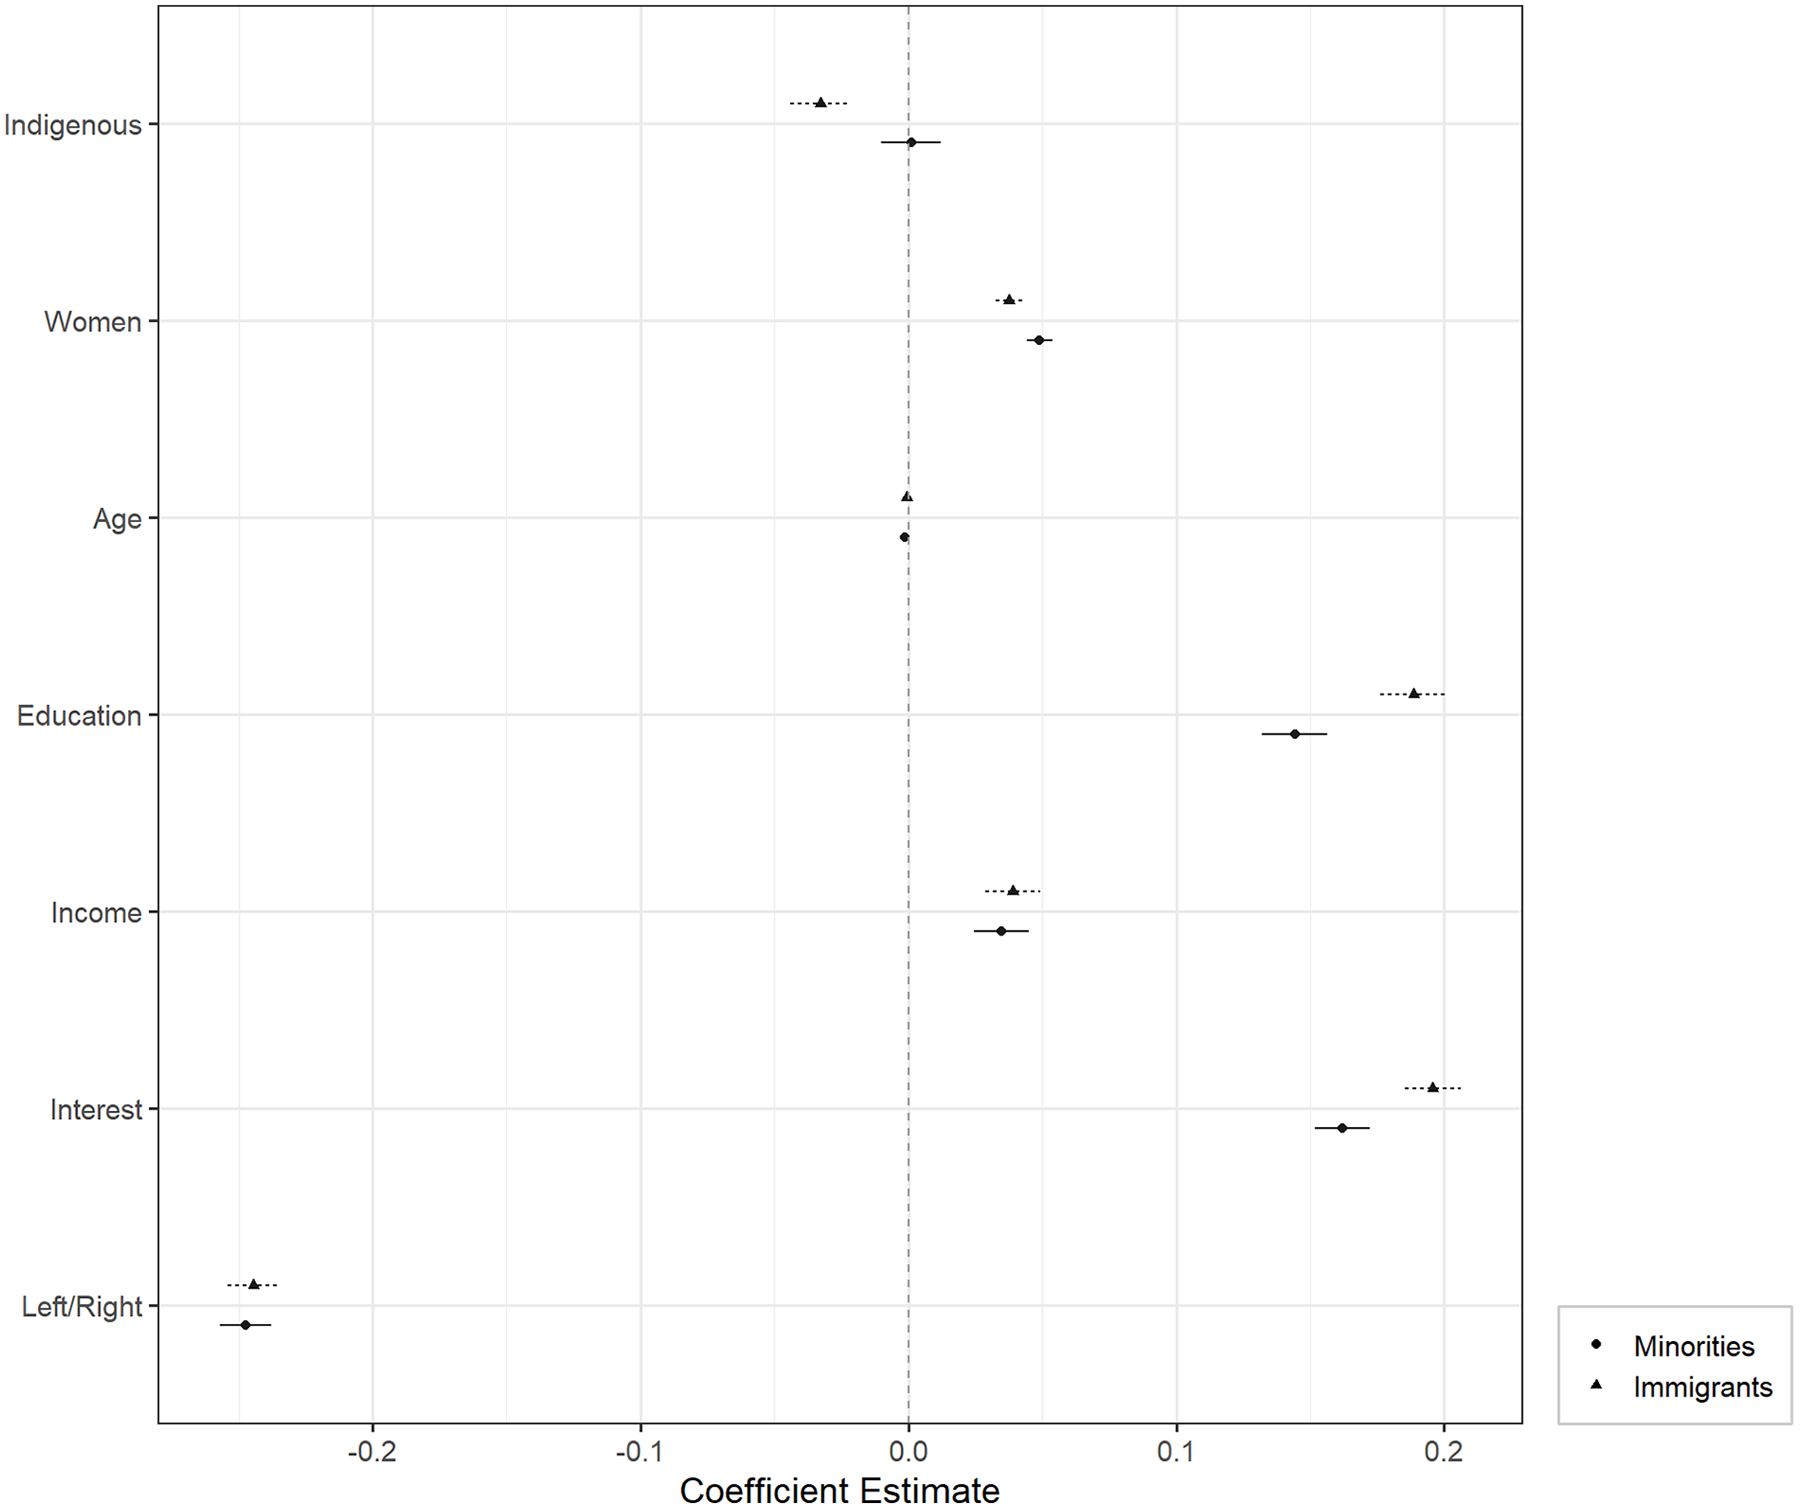
Figure 10 Long description
A scatter plot illustrates the influence of indigeneity on the evaluation of racial minorities and immigrants from 2019 to 2021. The plot features several data points, with two distinct markers: circles representing minorities and triangles representing immigrants. The x-axis represents coefficient estimates ranging from approximately -0.2 to 0.2, while the y-axis lists categories such as Indigenous, Women, Age, Education, Income, Interest, and Left/Right. Each category shows the coefficient estimates for both minorities and immigrants, with error bars indicating the range of estimates. Notable patterns include positive estimates for Education, Income, and Interest, and negative estimates for Left/Right. The data points for Indigenous and Women categories show higher estimates for immigrants compared to minorities. All values are approximated.
Beginning with our control variables, identifying as a woman has a positive impact on one’s evaluation of minorities (.049) and immigrants (.038). Education, income, and political interest also have a positive effect (respectively, .144, .035, and .162 for minorities and .189, .039, and .196 in the case of immigrants). Age has a negative effect, both for minorities (−.001) and immigrants (−.001). Associating with the right end of the spectrum has a negative effect on both the evaluation of racial minorities (−.247) and immigrants (−.244) as social groups.
Regarding our variable of interest, we note that while identifying as Indigenous does not have a statistically significant effect on the evaluation of racial minorities, the effect on the evaluation of immigrants is both statistically significant and negative (−.033), which appears consistent with our previous results.
To evaluate the accuracy of our hypothesis, we must determine what the attitudes of left-leaning and right-leaning individuals are in terms of public spending. To do so, we turn to Figure 9. As mentioned, spending in education, the environment, and immigration and minorities were viewed favorably by left-leaning individuals, whereas identifying with the left had a negative impact on one’s opinion on defense and justice spending. As Indigeneity has a positive impact on one’s opinion toward spending related to education and defense, as well as a negative outlook on spending on immigrants and minorities, we reject our last hypothesis: “Indigeneity has a positive impact on the likelihood of adopting views toward public spending on the left or center-left of the ideological spectrum.”
Discussion and Conclusion
This article offers an analysis of partisanship, political attitudes, and behaviors among members of Indigenous Nations in Canada. We hope that our analysis will contribute to this small but growing body of literature (Beatty et al. Reference Beatty, Doraty, Kocdag, Waldbillig, Carriere, Berdahl and Poelzer2013; Dabin Reference Dabin2021; Harell et al. Reference Harell, Panagos and Matthews2010; Henderson Reference Henderson2004) by filling in important gaps in Canadian electoral studies (Gidengil 2022) regarding Indigenous political views. We also encourage comparative efforts on these dynamics (Evans Reference Evans2014). We use data from the 2019 and 2021 CES, which included an unprecedented number of Indigenous respondents. Relying on both qualitative and quantitative literature that highlight low levels of trust in Canadian institutions and high abstention rates, we expect Indigenous individuals to be less likely to vote or affiliate with political parties than their non-Indigenous counterparts, but nonetheless more likely to support centrist or left-leaning parties or ideas. Table 2 presents the hypotheses we therefore considered:
Overview of the hypotheses and results
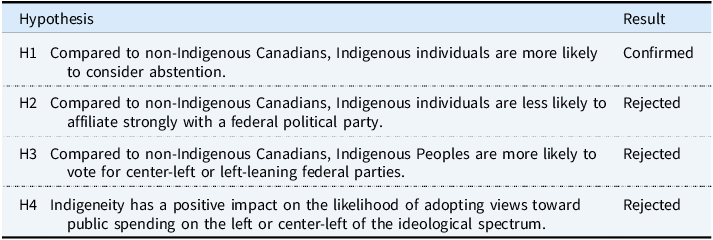
Table 2 Long description
The table presents an overview of four hypotheses and their results concerning Indigenous Canadians’ political behaviors and views compared to non-Indigenous Canadians. It consists of two columns and four rows. The first column lists the hypotheses labeled as H1, H2, H3, and H4, while the second column shows the results for each hypothesis. H1 states that Indigenous individuals are more likely to consider abstention and is confirmed. H2 states that Indigenous individuals are less likely to affiliate strongly with a federal political party and is rejected. H3 states that Indigenous Peoples are more likely to vote for center-left or left-leaning federal parties and is rejected. H4 states that Indigeneity has a positive impact on the likelihood of adopting views toward public spending on the left or center-left of the ideological spectrum and is rejected.
Overall, this study illustrates the gap in knowledge in Canadian electoral studies on the political behavior and attitudes of Indigenous Peoples. The fact that we could not support three of our hypotheses not only demonstrates the limited scope of the current literature but also defies prior expectations. As Gidengil (2022, 923) argues, “we need to go beyond trying to fit Indigenous voters into pre-existing theoretical categories and develop theories that fit these voters.”
As the Canadian electoral landscape develops, this research has several policy implications. First, we highlight the greater tendency of Indigenous individuals to consider third parties over the long-established LPC, both in terms of vote and partisanship, than their non-Indigenous counterparts. These third parties include the PPC, a far-right alternative that could be qualified as both populist and anti-system. Overall, it showed that Indigenous voters are not necessarily more likely to conform to the expected center-left partisan allegiance. Moreover, we note that they also do not adopt clear-cut views that could easily be associated with the left or the right side of the ideological spectrum. Together, these results point to a redefinition of our expectations regarding the political behaviors and attitudes of Indigenous Peoples and show the limit of relying on a conception of politics shaped by non-Indigenous experiences and settler-state institutional logics.
Indeed, Indigenous voters could be less concerned by left–right ideology in settler institutions, such as the House of Commons, than by the full implementation of their right to self-determination. Past and present land dispossession and forced integration into mainstream Canadian politics may explain their greater propensity toward abstention or why they are more likely than their non-Indigenous counterparts to consider third parties, particularly when such parties define themselves in opposition to the dominant actors that have historically structured the Canadian political landscape. Overall, these findings echo previous scholarship highlighting that the enduring colonial legacy and uneasy relationship between Indigenous Peoples and settler institutions contribute to shaping their attitudes and actions as potential voters or elected officials (Bouchard and Bourgeois Reference Bouchard and Bourgeois2024; Carrière and Koop Reference Carrière and Koop2023; Midzain-Gobin et al. Reference Midzain-Gobin, Snagovsky and Cowie2024).
Our analysis also appears coherent with the dissatisfaction among Indigenous individuals in the way democracy works in Canada, as well as their more negative perception of certain political institutions (Bouchard and Bourgeois Reference Bouchard and Bourgeois2024). The rejection of establishment/settler government politics holds significance for the Canadian political landscape more broadly. As mentioned previously, the Truth and Reconciliation Commission (2015, 202) noted that “many Aboriginal people have a deep and abiding distrust of Canada’s political and legal systems.” Considering Canada’s colonial legacy and the consequences of a “delayed recognition of citizenship” (Cowie Reference Cowie2021), some Indigenous voters may see the act of voting as a form of assimilation or acceptance of Canadian citizenship as well as the colonial system, while others may vote as citizens of their own Nations to address their concerns about Indigenous issues (Alfred et al. Reference Alfred, Pitawanakwat and Price2007; Harell et al. Reference Harell, Panagos and Matthews2010; Huebert and Liu Reference Huebert and Liu2016).
The propensity of Indigenous individuals to abstain from taking part in the electoral process through voting nonetheless raises concerns about their capacity to influence Canadian politics through traditional means of participation. Their limited numbers—roughly 5% of the total Canadian population—means that collective action is particularly important in order to be heard. In other words, while Indigenous individuals may seek to attain some of their political goals through partisanship, Indigenous self-determination pathways and contentious politics will also likely continue to shape how they interact with Canadian politics.
Given the size of the Indigenous sample of this study, we were also able to explore the intersection of Indigeneity and gender further. Among Indigenous respondents, Indigenous women share some similarities with non-Indigenous women, as they did tend to favor parties associated with the left or center-left when compared to Indigenous men. We also saw that, among women, respondents who identify as Indigenous are actually significantly more likely to vote for those parties than other women. However, the picture we paint of heterogeneity among Indigenous voters remains partial, as we were unable to analyze the behaviors and attitudes of First Nations, Inuit, and Métis respondents separately. This is both an important limitation of our data and a crucial topic of inquiry for future research. Moreover, another of the major limitations of this study is the fact that we relied on auto-identification, using a single question.
These findings point to the need to deepen our understanding of Indigenous political participation, vote choice, and political attitudes. Indeed, the unique challenges involving surveying Indigenous Peoples should not keep us from investigating their political attitudes and behaviors on a greater scale. While certain patterns appeared to emerge upon comparing this sample to the rest of the respondents, we would benefit from a more comprehensive sample that is truly representative of the Indigenous population of Canada and allows us to investigate the distinction between First Nations, Inuit, and Métis individuals. In Canada, like elsewhere, different research techniques (e.g., participatory research, mixed methods braiding Indigenous epistemologies and respecting Indigenous data jurisdiction) could be leveraged to deepen our knowledge of Indigenous political behaviors and opinions (Lavelle et al. Reference Lavelle, Larsen and Gundersen2009; Perry et al. Reference Perry, Moore, Vanchu-Orosco, West-Johnson, Watts, Edinger and Bouchard2023; Steffler Reference Steffler2016) and explore differences between groups, genders, and generations while also distancing ourselves from the “pre-existing theoretical categories” (Gidengil Reference Gidengil2022, 923) through which we traditionally seek to understand politics.
Lastly, international comparison would also be critical to explore political trends among Indigenous Peoples and examine the variety of interactions between them and settler politics as well as their consequences (Evans Reference Evans2014). For now, this study raises at least as many questions as it resolves. As Indigenous Peoples around the world assert themselves as key political actors on a range of contemporary issues, this is a pivotal moment for scholars to engage with Indigenous political cultures and reflect on the roles, challenges, and opportunities of Indigenous Peoples within nested politics.
Acknowledgements
The authors would like to express their gratitude to the reviewers for their insightful comments and suggestions.
They have read and agree to comply with the Cambridge University Press Artificial Intelligence (AI) Contributions to Research Content Policy. Therefore, they would like to declare the use of AI tools to support translation and to improve the clarity of the English language. It was not used for content generation, data analysis, or interpretation.
Funding statement
No funding was received.
Competing interests
At the time of writing this article, Sabrina Bourgeois was employed by the Government of Canada. The authors would like to emphasize that the views and opinions expressed in this article are their own and do not reflect the official policies or positions of any Canadian federal departments.
Appendix
Influence of Indigeneity on vote likelihood
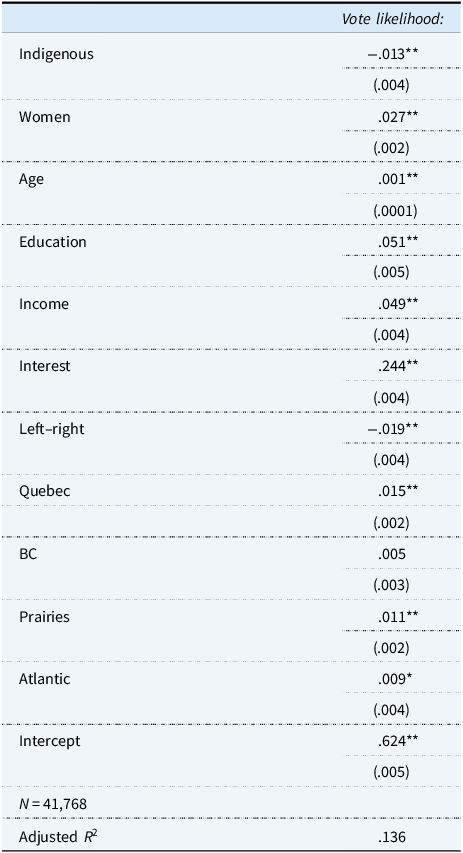
Table A1 Long description
The table presents data on the influence of various factors on vote likelihood, including Indigenous status, gender, age, education, income, interest, political orientation, and regional factors. It consists of 14 rows and 3 columns. The columns are labeled with the factors and their corresponding vote likelihood values along with standard errors in parentheses. Notable trends include a negative influence of Indigenous status and a positive influence of education, income, and interest on vote likelihood. The intercept value is also provided, along with the adjusted R-squared value indicating the model’s fit.
*p < .05; **p < .01; ***p < .001.
Influence of Indigeneity on vote intentions (campaign survey)
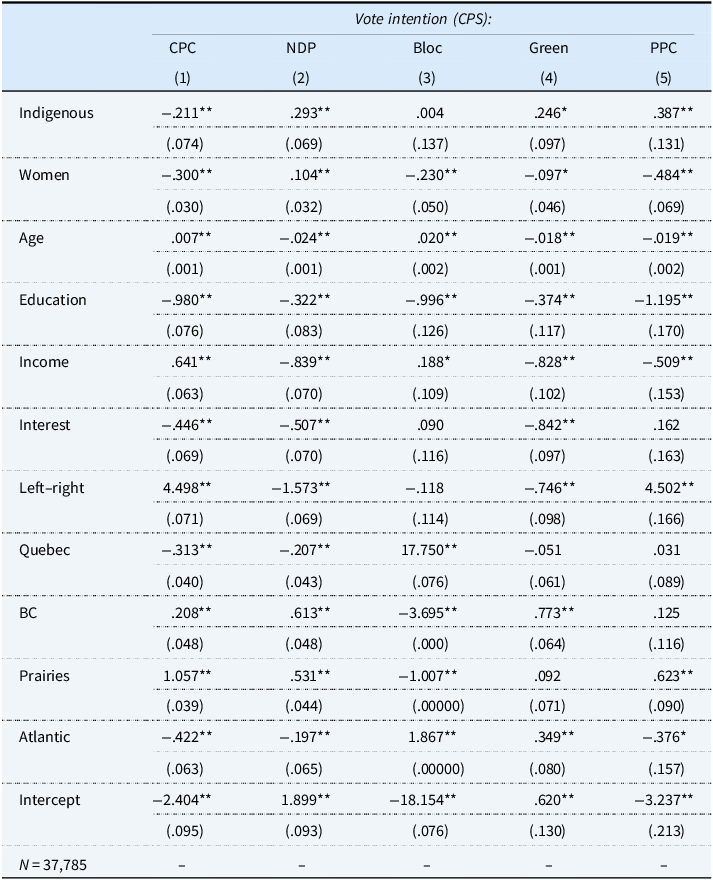
Table A2 Long description
The table presents vote intention data for various political parties in Canada, including the Conservative Party of Canada (CPC), New Democratic Party (NDP), Bloc Québécois (Bloc), Green Party (Green), and People’s Party of Canada (PPC). It includes statistical values for different demographic groups such as Indigenous, Women, Age, Education, Income, Interest, Left-right ideology, and regional factors like Quebec, British Columbia (BC), Prairies, and Atlantic. The table has five columns representing each party and multiple rows for each demographic variable. Notable trends include women being less likely to vote for most parties except the NDP, age having varying impacts on different parties, education negatively affecting the likelihood of voting for any party other than the Liberals, and higher income levels increasing the likelihood of voting for the CPC while decreasing the likelihood of voting for the NDP, Green Party, or PPC. Political interest negatively impacts the likelihood of voting for the CPC, NDP, and Green Party. Right-leaning respondents are more likely to favor the CPC or PPC and less likely to vote for the NDP or Greens.
*p < .05; **p < .01; ***p < .001.
Influence of Indigeneity on vote choice (post-election survey)
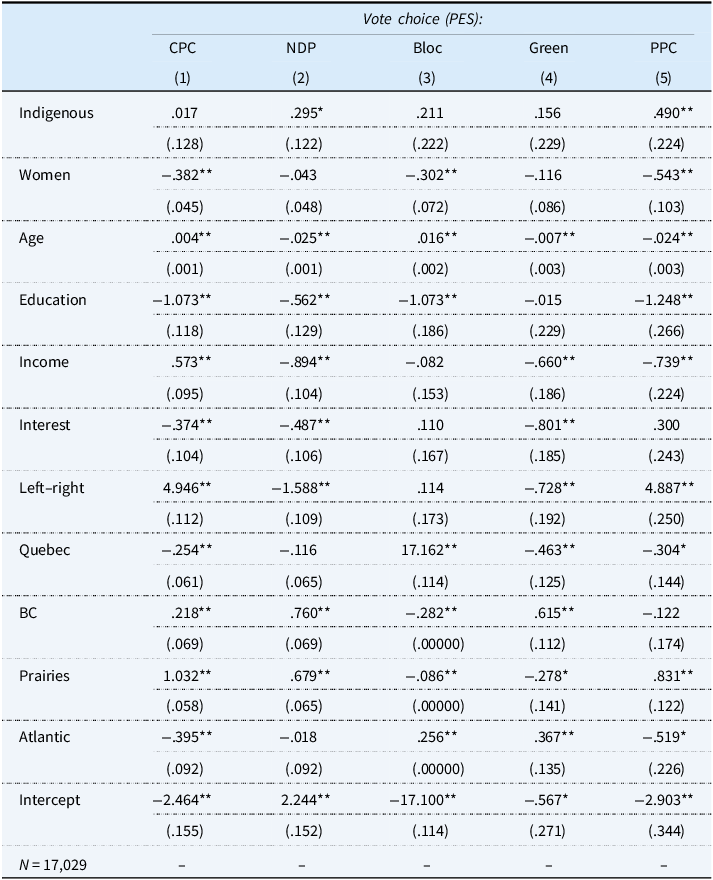
Table A3 Long description
The table presents data on the influence of Indigeneity on vote choice across different political parties, including CPC, NDP, Bloc, Green, and PPC. It includes rows for factors such as Indigenous, Women, Age, Education, Income, Interest, Left-right, Quebec, BC, Prairies, Atlantic, and Intercept. Each row lists the impact of these factors on vote choice, with corresponding values and standard errors. Notable trends include significant positive impacts of Indigenous status on voting for the NDP and PPC, and significant negative impacts of being a woman on voting for the CPC and Bloc. Education and income also show significant negative impacts across most parties. The table provides a detailed comparison of how different demographic and socio-economic factors influence voting preferences.
*p < .05; **p < .01; ***p < .001.
Vote intentions among Indigenous respondents (2019–2021)
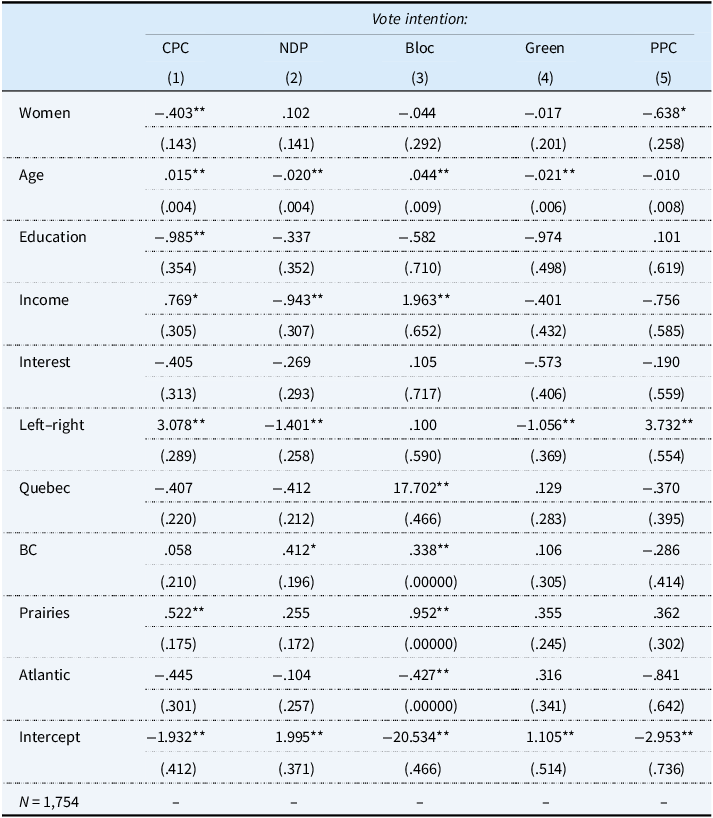
Table A4 Long description
The table presents vote intentions among Indigenous respondents from 2019 to 2021, focusing on different political parties and demographic factors. It includes five columns for political parties: Conservative Party of Canada (CPC), New Democratic Party (NDP), Bloc Québécois (Bloc), Green Party (Green), and People’s Party of Canada (PPC). The rows represent demographic factors such as Women, Age, Education, Income, Interest, Left-right, Quebec, BC, Prairies, and Atlantic. Each cell contains a value indicating the influence of each demographic factor on vote intention for the respective party. Notable trends include significant negative values for Women and Education across most parties, and positive values for Income and Left-right for certain parties. The table provides a detailed comparison of how different demographic factors influence vote intentions among Indigenous respondents.
*p < .05; **p < .01; ***p < .001.
Influence of Indigeneity on vote intention among women
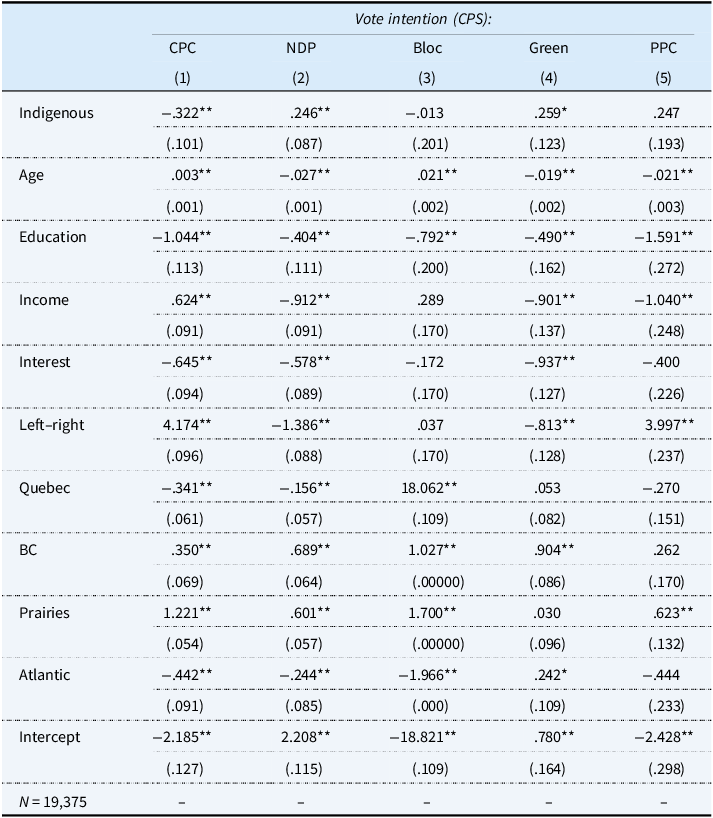
Table A5 Long description
The table presents data on the influence of various factors on vote intention among women for different political parties. It includes columns for CPC, NDP, Bloc, Green, and PPC, with rows for factors such as Indigenous, Age, Education, Income, Interest, Left-right, Quebec, BC, Prairies, and Atlantic. Each cell contains a value representing the influence of the corresponding factor on vote intention for the respective party. Notable trends include significant positive and negative influences across different factors and parties, with some factors showing strong correlations with specific parties.
*p < .05; **p < .01; ***p < .001.
Influence of Indigeneity on strength of partisanship (2019–2021)
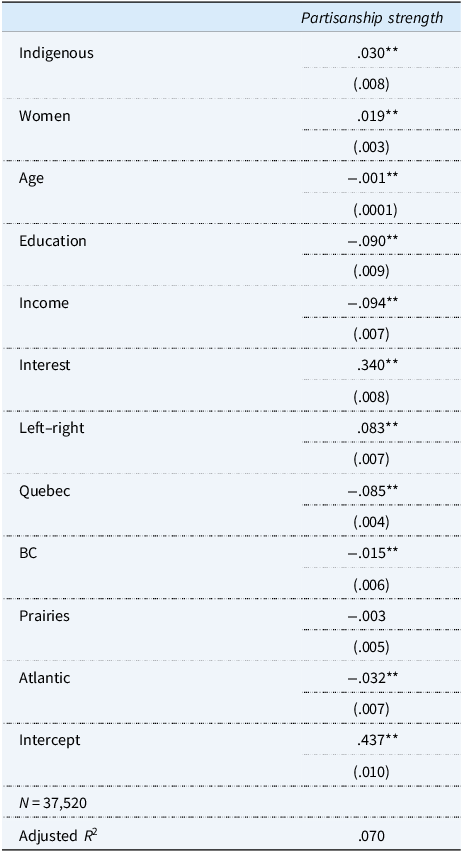
Table A6 Long description
The table presents data on the influence of various factors on partisanship strength from 2019 to 2021. It includes rows for Indigenous, Women, Age, Education, Income, Interest, Left-right, Quebec, BC, Prairies, Atlantic, Intercept, and Adjusted R squared. Each row lists a factor and its corresponding partisanship strength value, along with standard errors in parentheses. Notable trends include positive influences from Indigenous status, being a woman, interest, and left-right orientation, while age, education, income, and regional factors like Quebec and Atlantic show negative influences. The intercept value is 0.437, and the adjusted R squared is 0.70, indicating the model’s explanatory power. The table provides a comprehensive overview of how different demographic and regional factors impact partisanship strength.
*p < .05; **p < .01; ***p < .001.
Influence of Indigeneity on strength of party affiliation
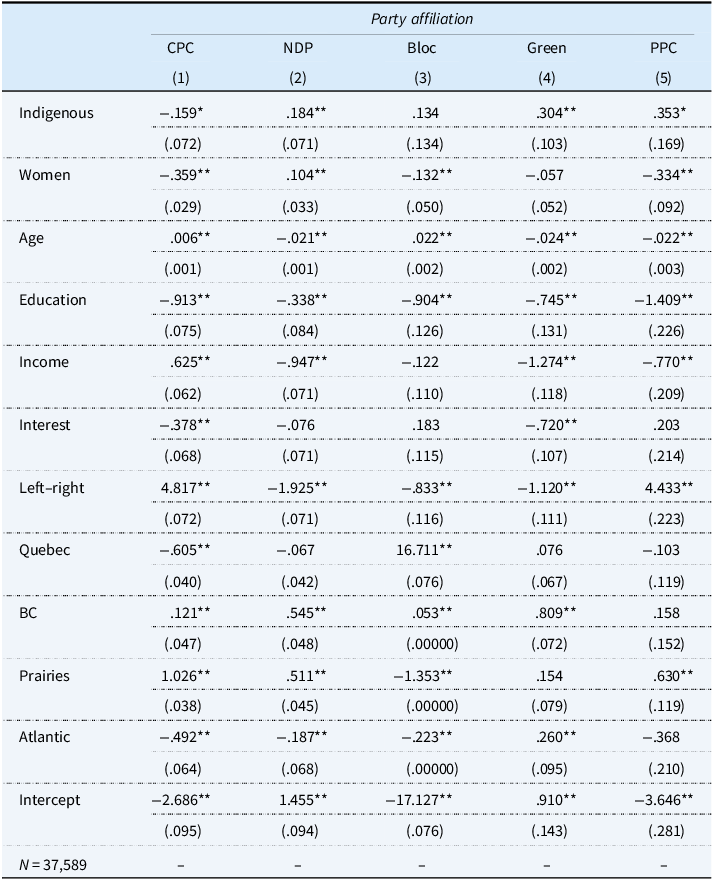
Table A7 Long description
The table presents data on the influence of indigeneity on the strength of party affiliation across five political parties: CPC, NDP, Bloc, Green, and PPC. It includes rows for various demographic factors such as Indigenous, Women, Age, Education, Income, Interest, Left-right, Quebec, BC, Prairies, Atlantic, and Intercept. Each row lists the corresponding values for each party, with standard errors in parentheses. Notable trends include significant negative values for Women and Education across most parties, and positive values for Indigenous and Left-right in certain parties. The table provides a comprehensive view of how different factors influence party affiliation strength.
*p < .05; **p < .01; ***p < .001.
Influence of Indigeneity on the opinion on education spendings
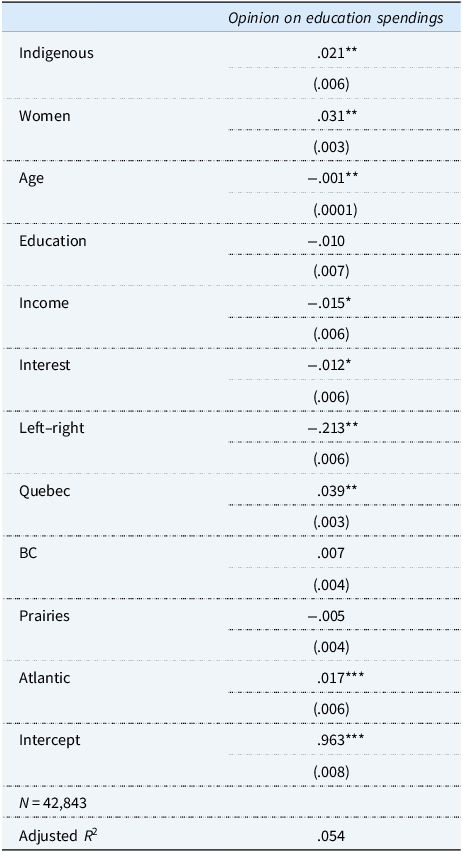
Table A8 Long description
The table presents a linear regression model analyzing the influence of various factors on opinions about education spending. It includes columns for the factors and their respective coefficients and standard errors. The factors include Indigenous status, gender, age, education, income, interest, political orientation, and regional differences. Notable findings include positive influences from Indigenous status and being a woman, a negative influence from age, and significant regional differences, particularly in Quebec. The table also shows the intercept and the adjusted R-squared value, indicating the model’s fit. Each row provides the coefficient and standard error for each factor, highlighting their impact on opinions about education spending.
*p < .05; **p < .01; ***p < .001.
Influence of Indigeneity on the opinion on environment spendings
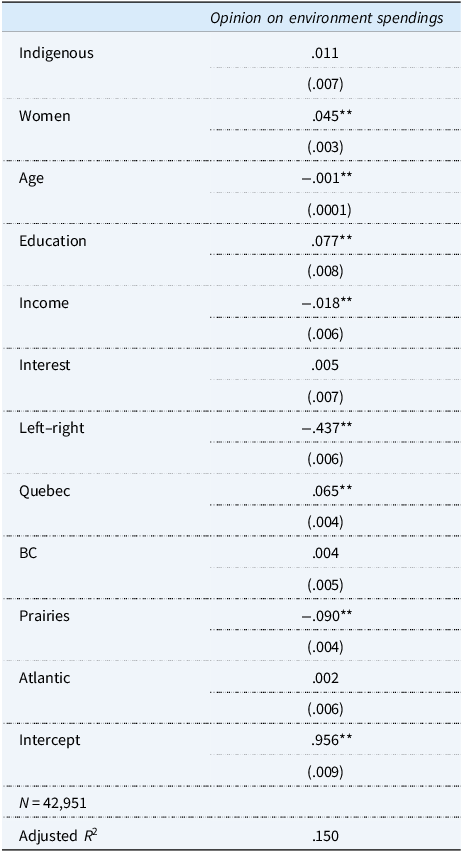
Table A9 Long description
The table presents data on the influence of various factors on opinions regarding environmental spending. It includes rows for Indigenous, Women, Age, Education, Income, Interest, Left-right, Quebec, BC, Prairies, Atlantic, and Intercept, each with corresponding values and standard errors. Notable trends include significant positive influences from Women, Education, and Quebec, and significant negative influences from Age, Income, Left-right, and Prairies. The table also shows the intercept value and the adjusted R-squared value, indicating the model’s explanatory power.
*p < .05; **p < .01; ***p < .001.
Influence of Indigeneity on the opinion on justice spendings
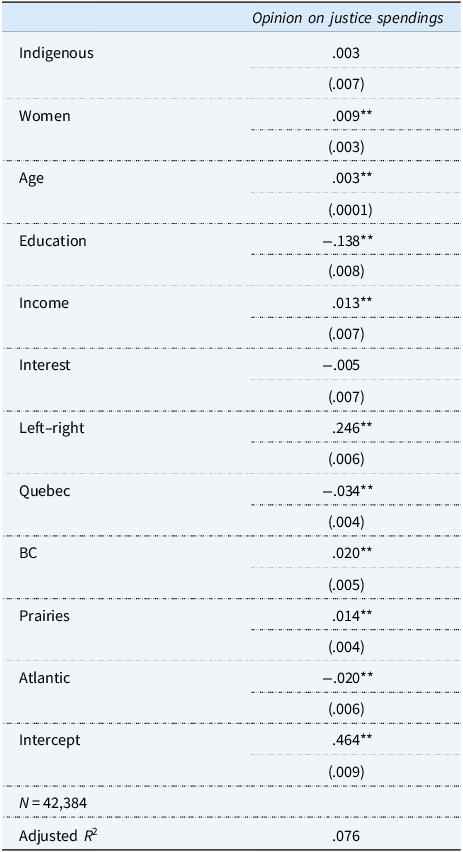
Table A10 Long description
The table presents data on the influence of various factors on opinions about justice spending. It includes columns for Indigenous status, gender, age, education, income, interest, political orientation, and regional differences. The table has 13 rows and 3 columns. The first column lists the factors, the second column shows the corresponding coefficients, and the third column displays the standard errors. Notable trends include significant positive influences from women, age, income, and left-right political orientation, while education shows a significant negative influence. Regional differences are also noted, with Quebec, British Columbia, the Prairies, and the Atlantic regions showing varying levels of influence. The intercept value is 0.464 with an adjusted R-squared value of 0.076, indicating the model’s explanatory power. The sample size is 42,384.
*p < .05; **p < .01; ***p < .001.
Influence of Indigeneity on the opinion on defense spendings
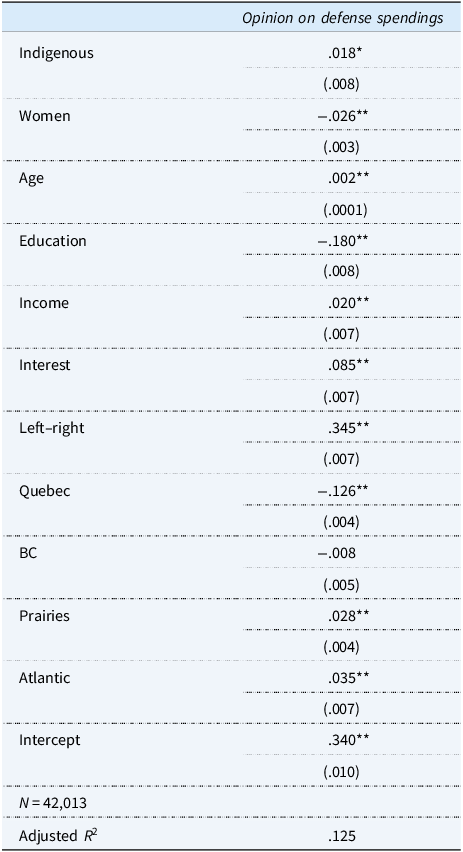
Table A11 Long description
The table presents data on the influence of various factors on opinions about defense spending. It includes rows for Indigenous, Women, Age, Education, Income, Interest, Left-right, Quebec, BC, Prairies, Atlantic, and Intercept. Each row lists a coefficient and a standard error in parentheses. Notable trends include significant influences from Education, Left-right, and Quebec. The table also includes the total number of observations (42,013) and the adjusted R-squared value (0.125).
*p < .05; **p < .01; ***p < .001.
Influence of Indigeneity on the opinion on education spendings
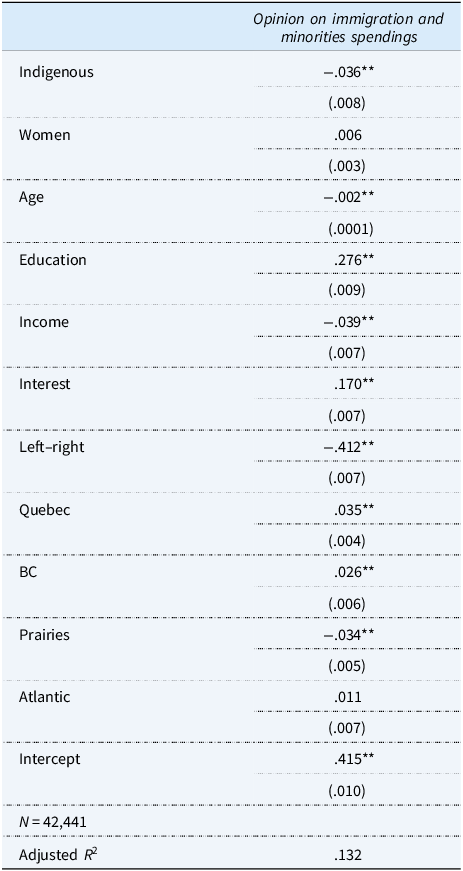
Table A12 Long description
The table presents a linear regression model analyzing the influence of various factors on opinions regarding immigration and minority spending. It includes rows for Indigenous, Women, Age, Education, Income, Interest, Left-right, Quebec, BC, Prairies, Atlantic, Intercept, and Adjusted R squared. Each row lists a coefficient value and a standard error in parentheses. Notable trends include significant negative coefficients for Indigenous and Left-right, and significant positive coefficients for Education and Interest. The Adjusted R squared value is 0.132, indicating the model explains 13.2 percent of the variance in opinions on immigration and minority spending.
*p < .05; **p < .01; ***p < .001.
Influence of Indigeneity on the evaluation of minorities
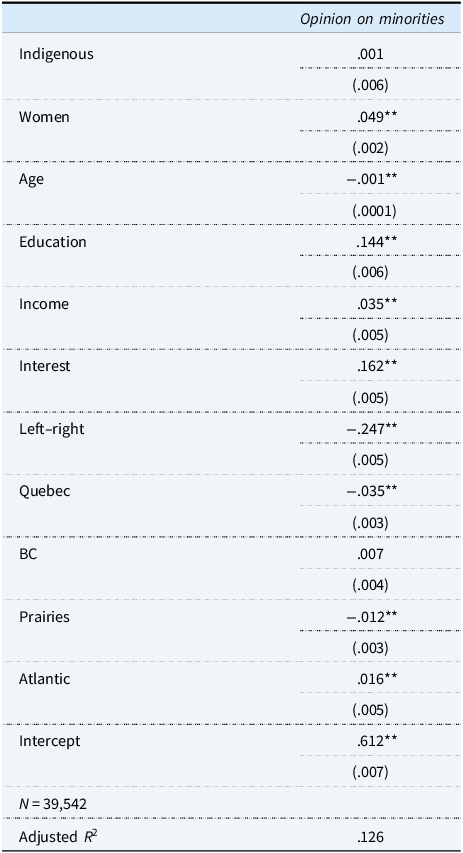
Table A13 Long description
A table with 13 rows and 3 columns presents data on the influence of various factors on the evaluation of minorities. The columns are labeled with the factors and their corresponding values. The factors include Indigeneity, Women, Age, Education, Income, Interest, Left-right, Quebec, BC, Prairies, Atlantic, Intercept, and Adjusted R squared. Each row lists a factor and its impact value, with standard errors in parentheses. Notable trends include significant positive impacts from Women, Education, Income, Interest, and Atlantic, while Age, Left-right, Quebec, and Prairies show negative impacts. The Adjusted R squared value is 0.126, indicating the model’s explanatory power.
*p < .05; **p < .01; ***p < .001.
Influence of Indigeneity on the evaluation of immigrants
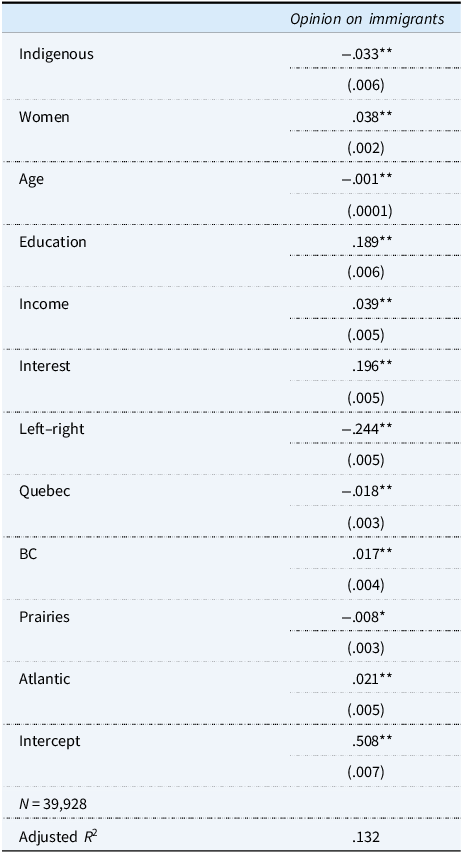
Table A14 Long description
The table presents data on the influence of various factors on opinions about immigrants. It includes columns for the factor names, their coefficients, and standard errors. The factors listed are Indigeneity, gender, age, education, income, interest, political orientation, and regional differences. Each factor’s impact is quantified with a coefficient, and standard errors are provided in parentheses. Significant values are marked with asterisks, indicating levels of statistical significance. The table also includes the total number of observations and the adjusted R-squared value, which measures the model’s fit. Notable trends include the significant negative impact of Indigeneity and the positive impact of education and interest on opinions about immigrants.
*p < .05; **p < .01; ***p < .001.
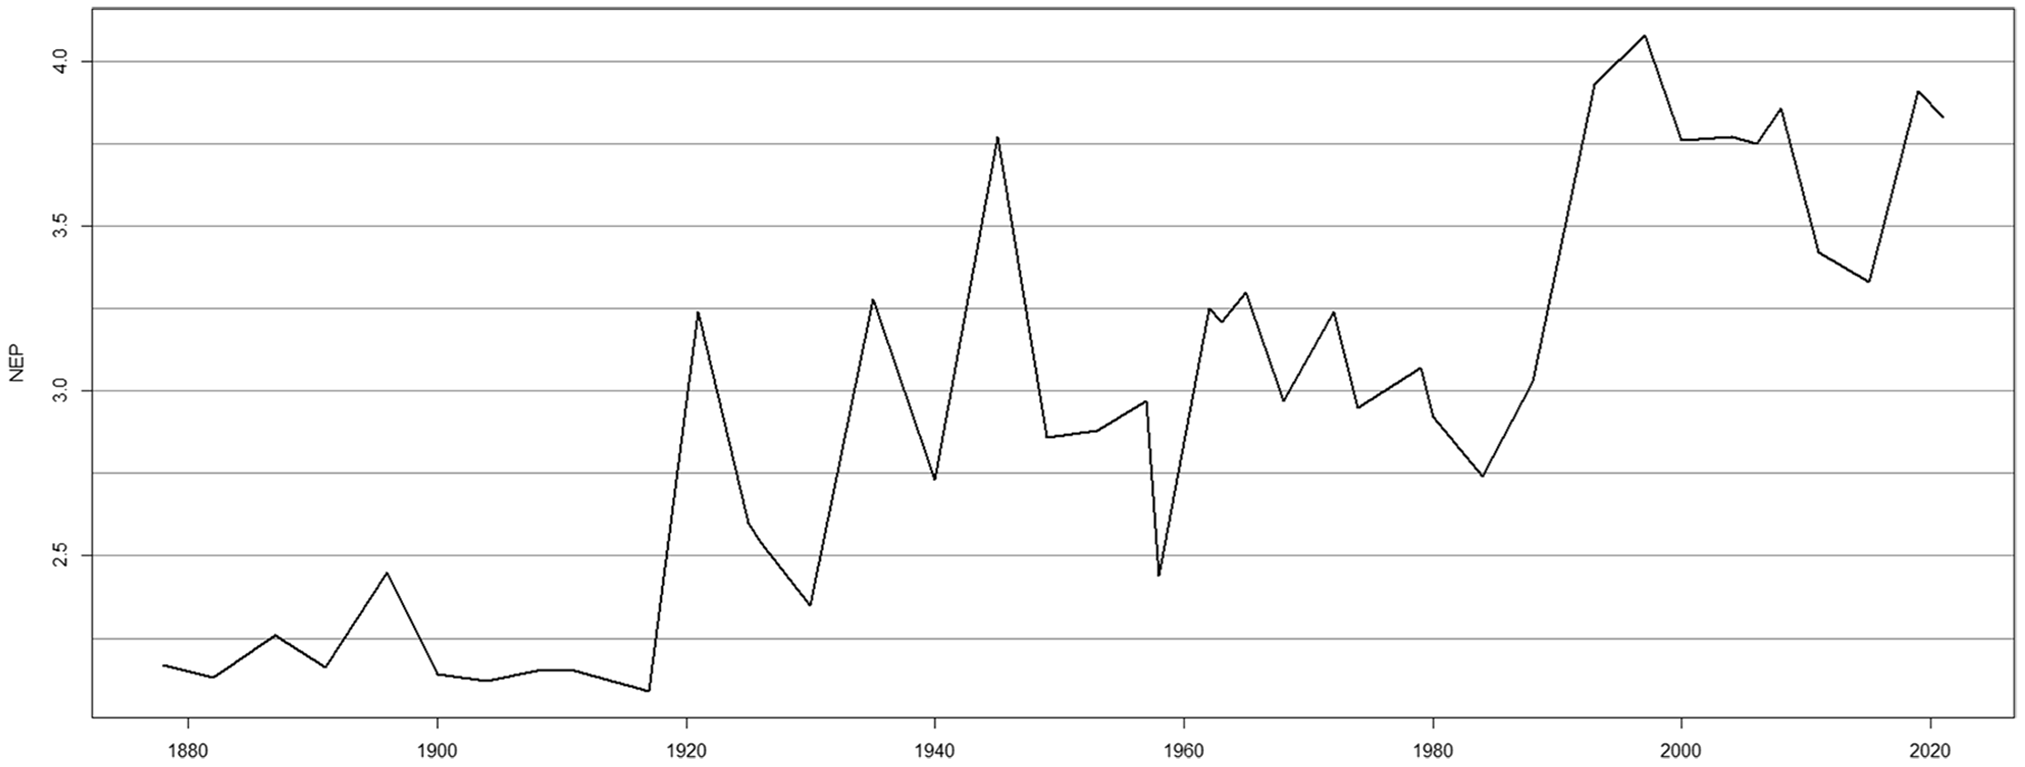
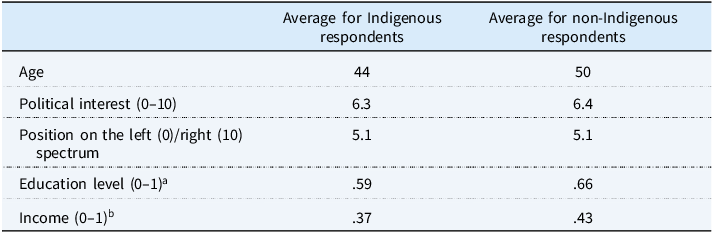
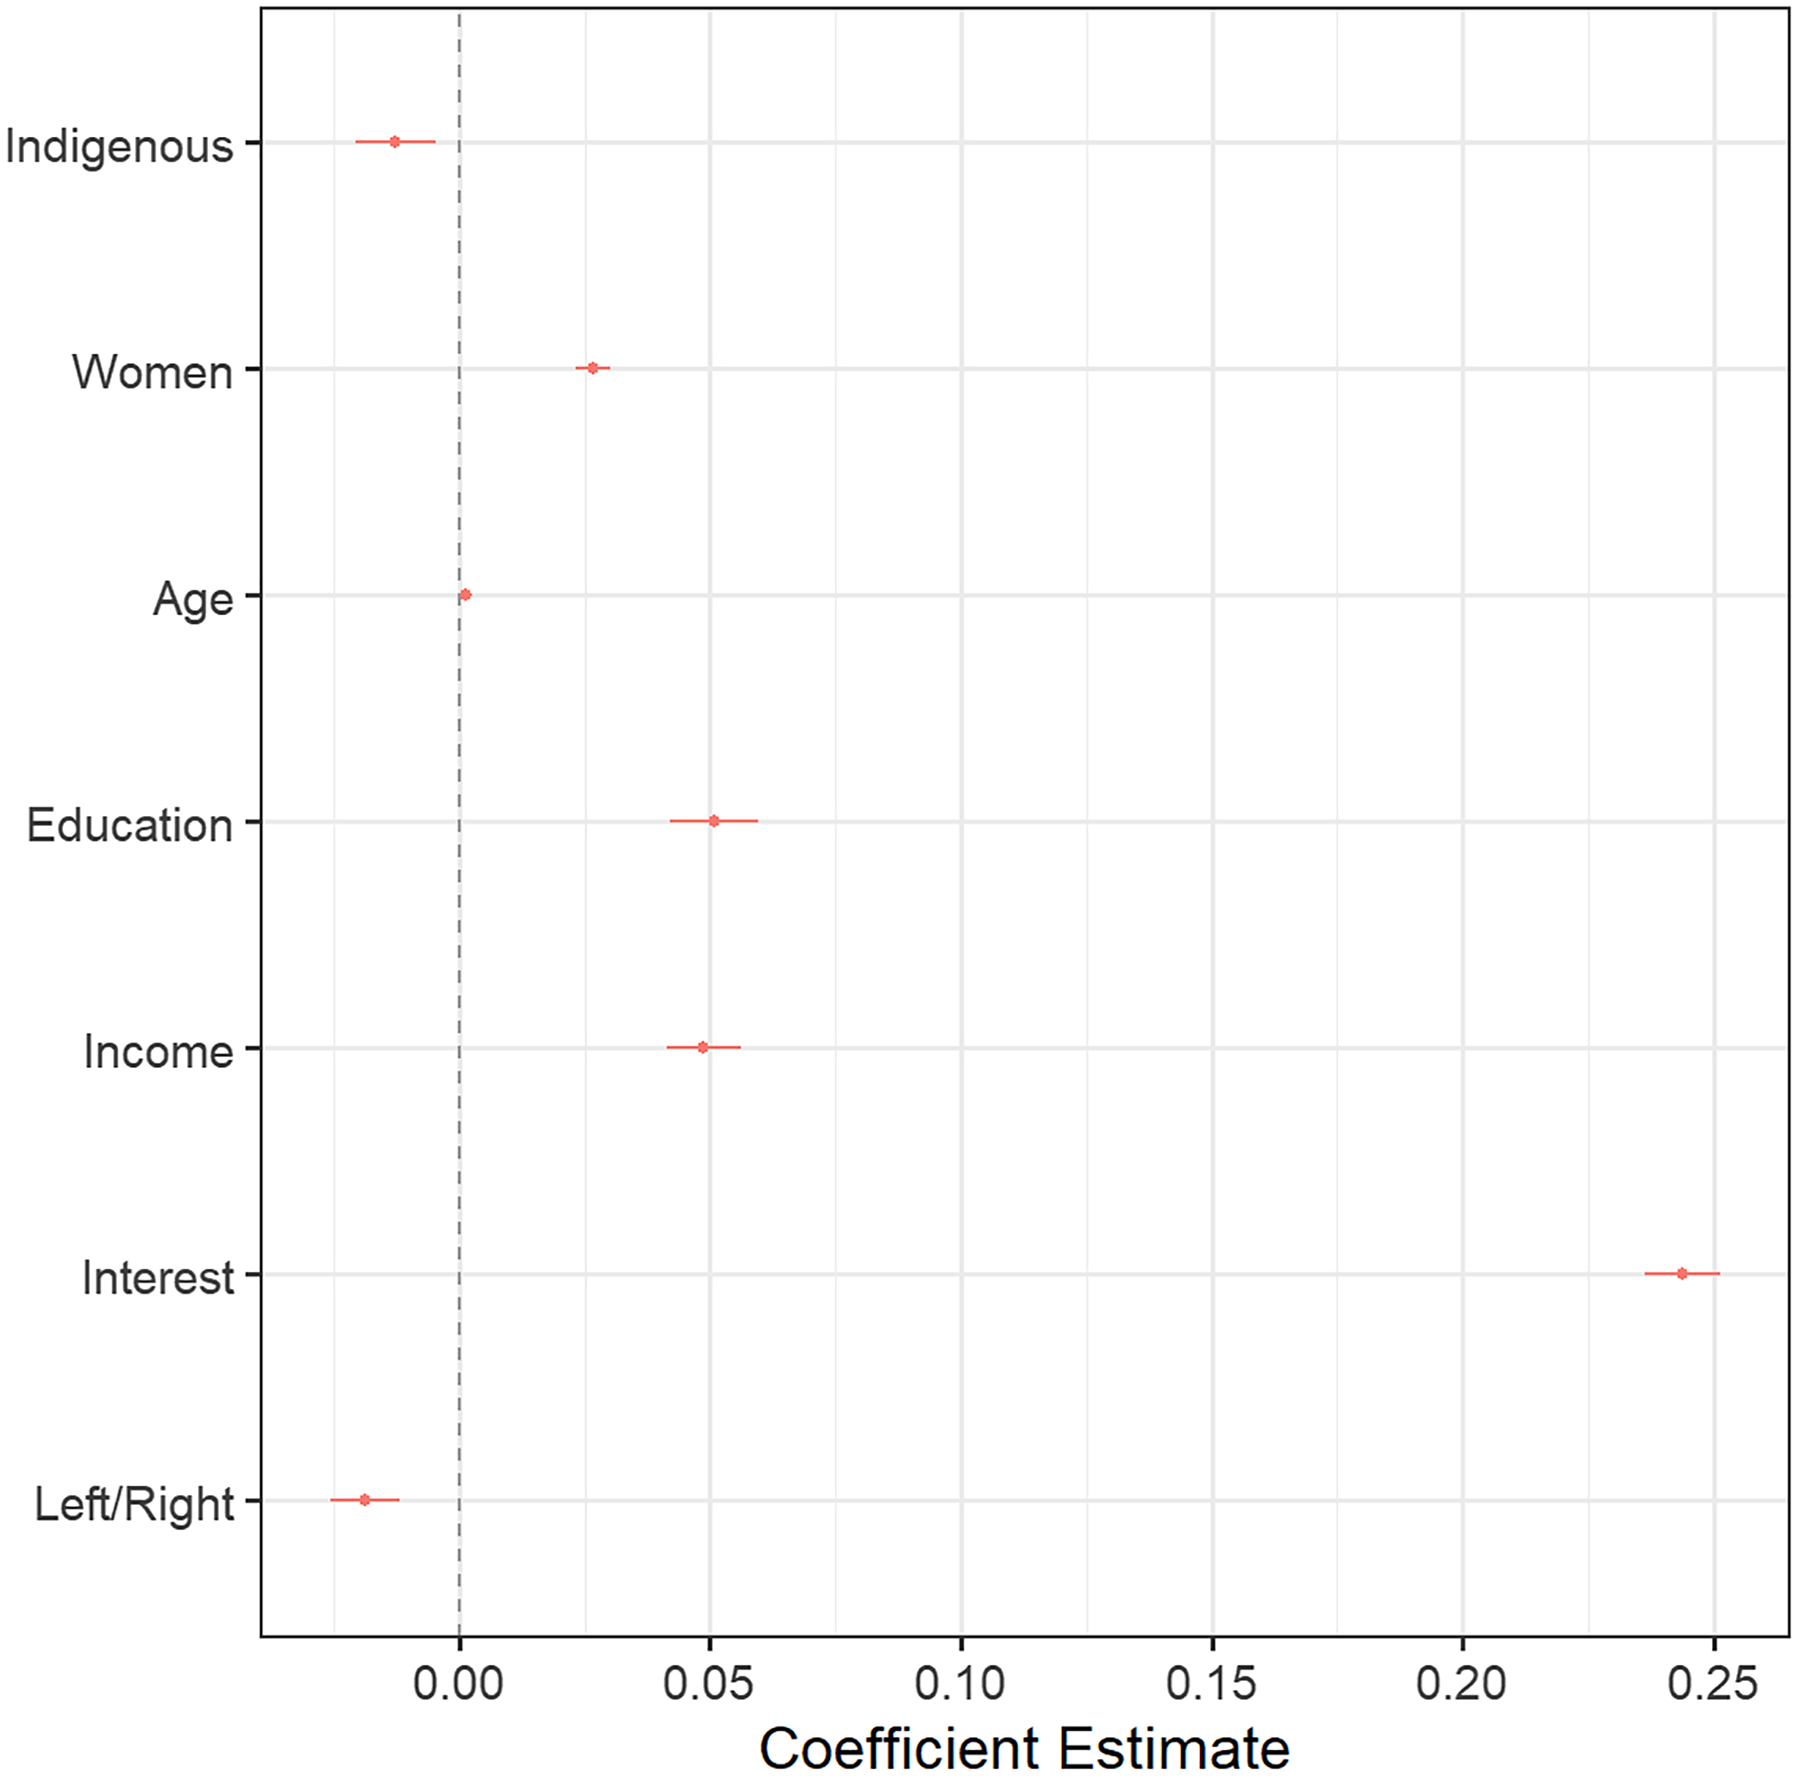
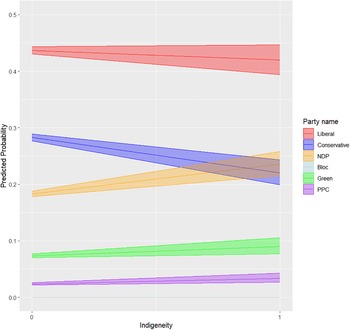
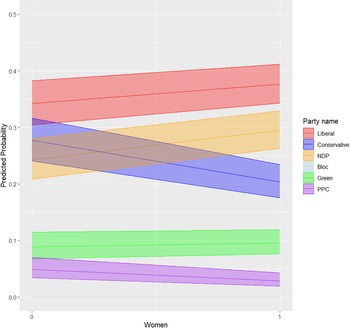
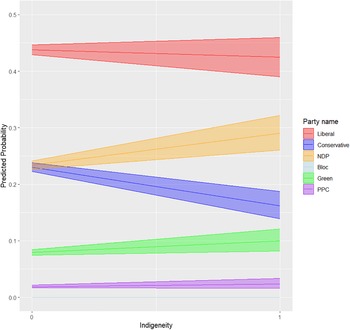
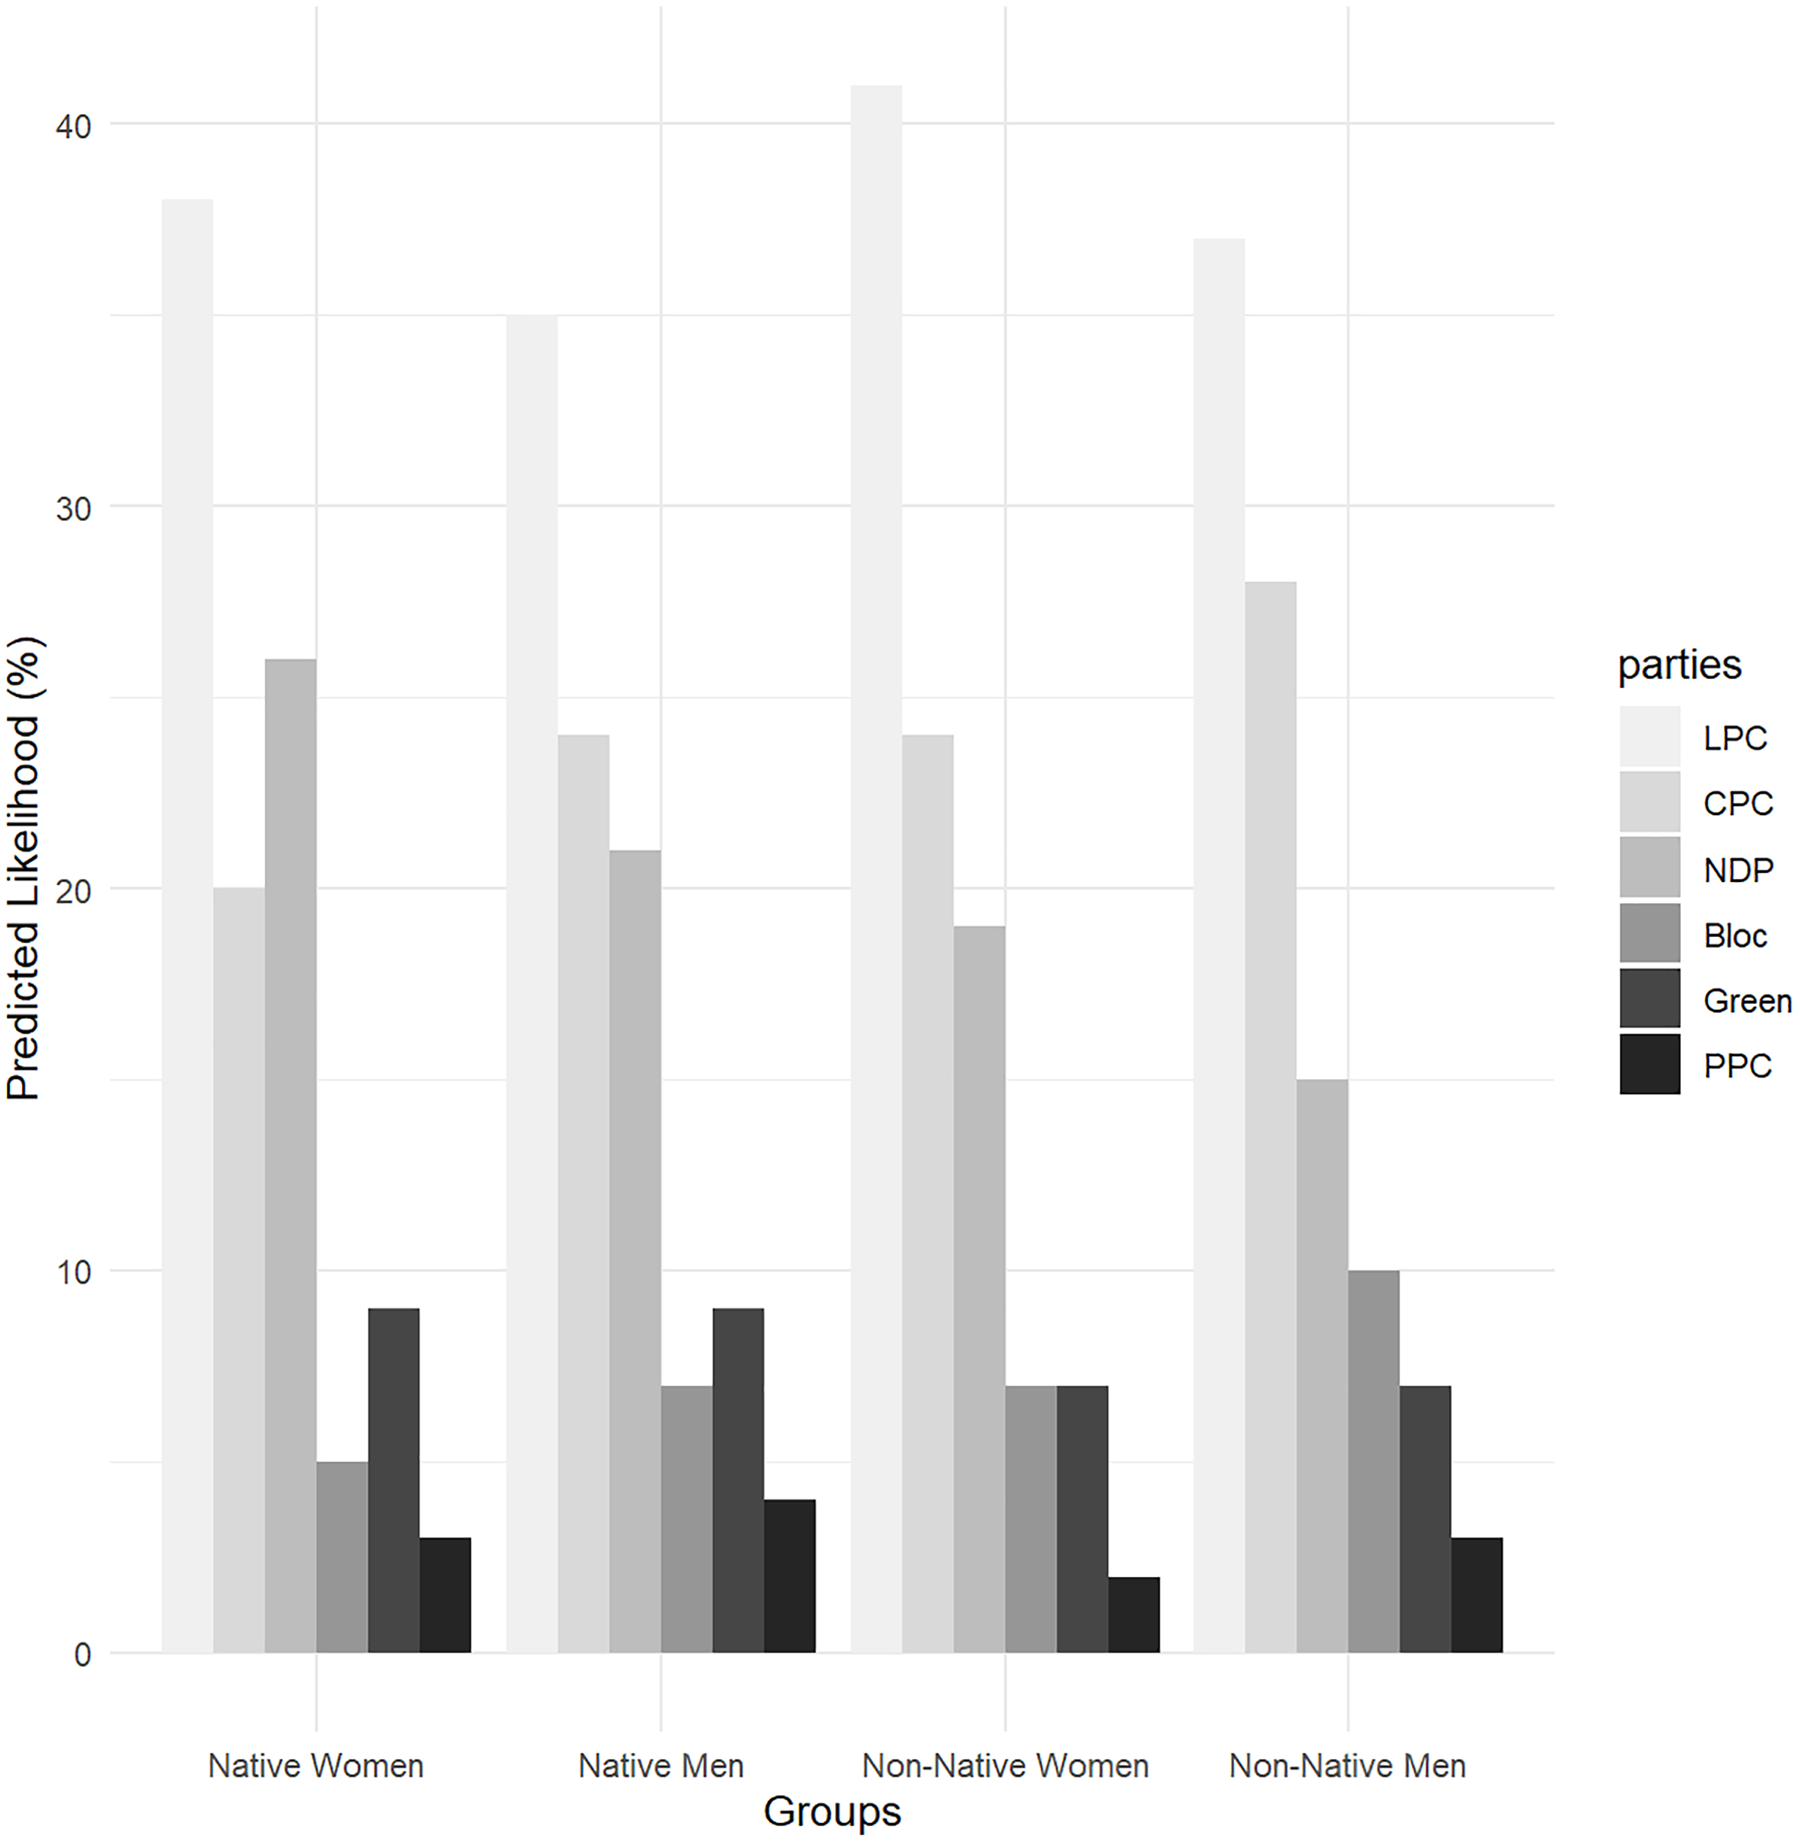
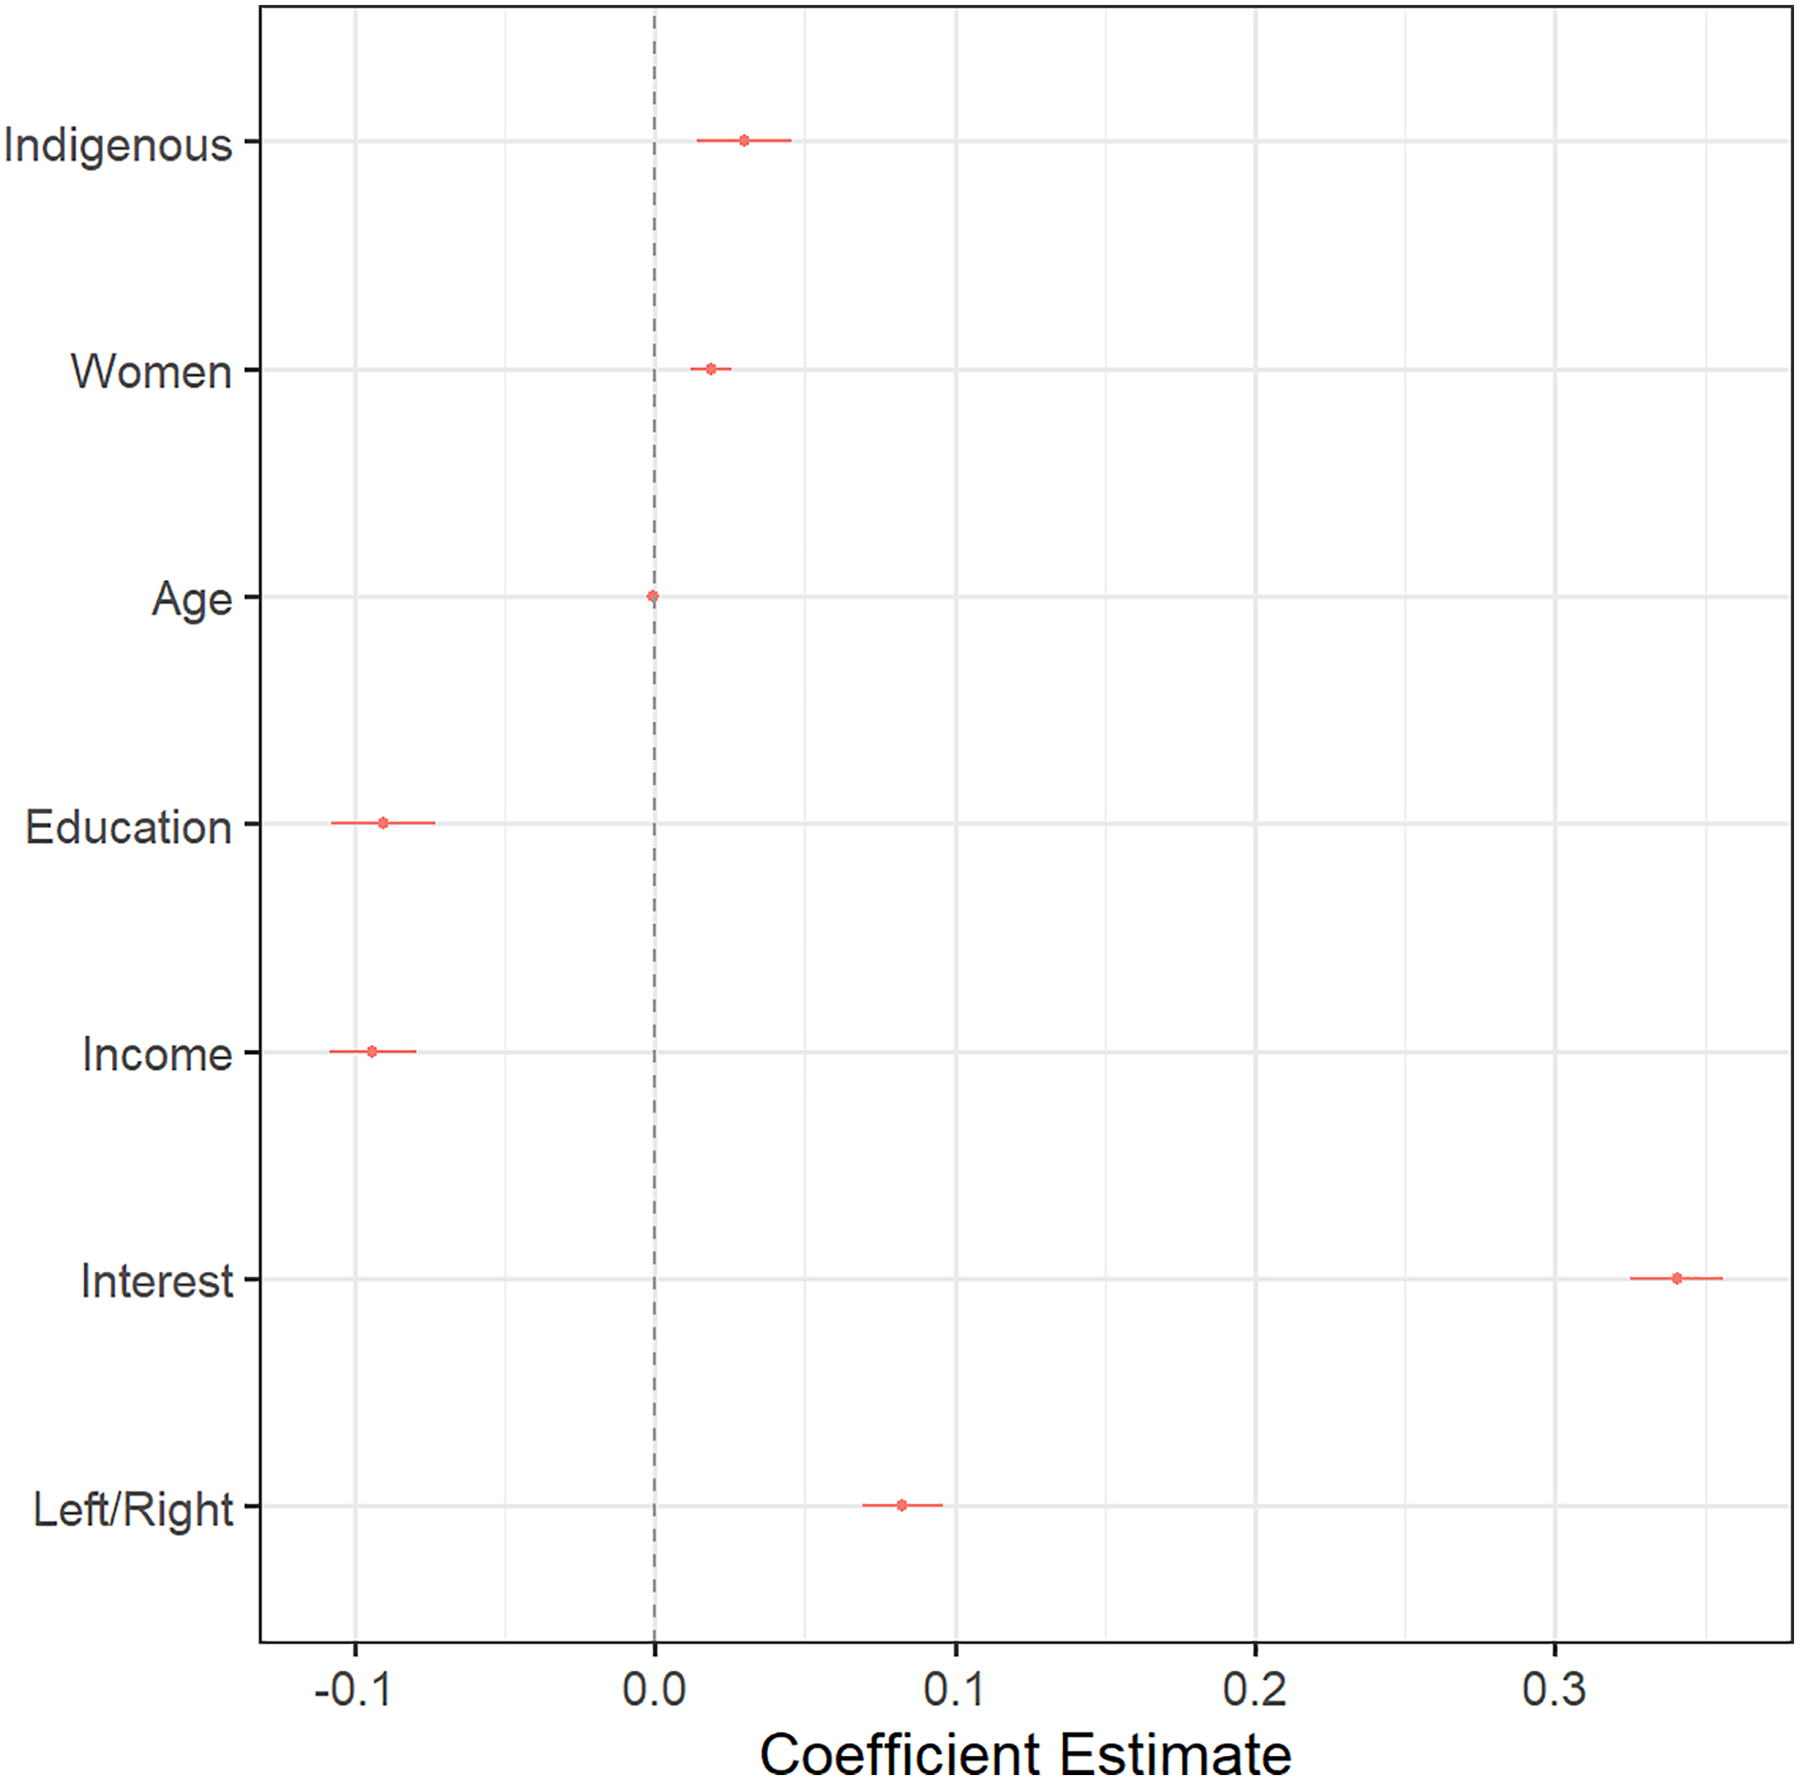
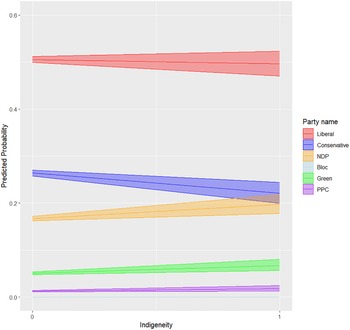
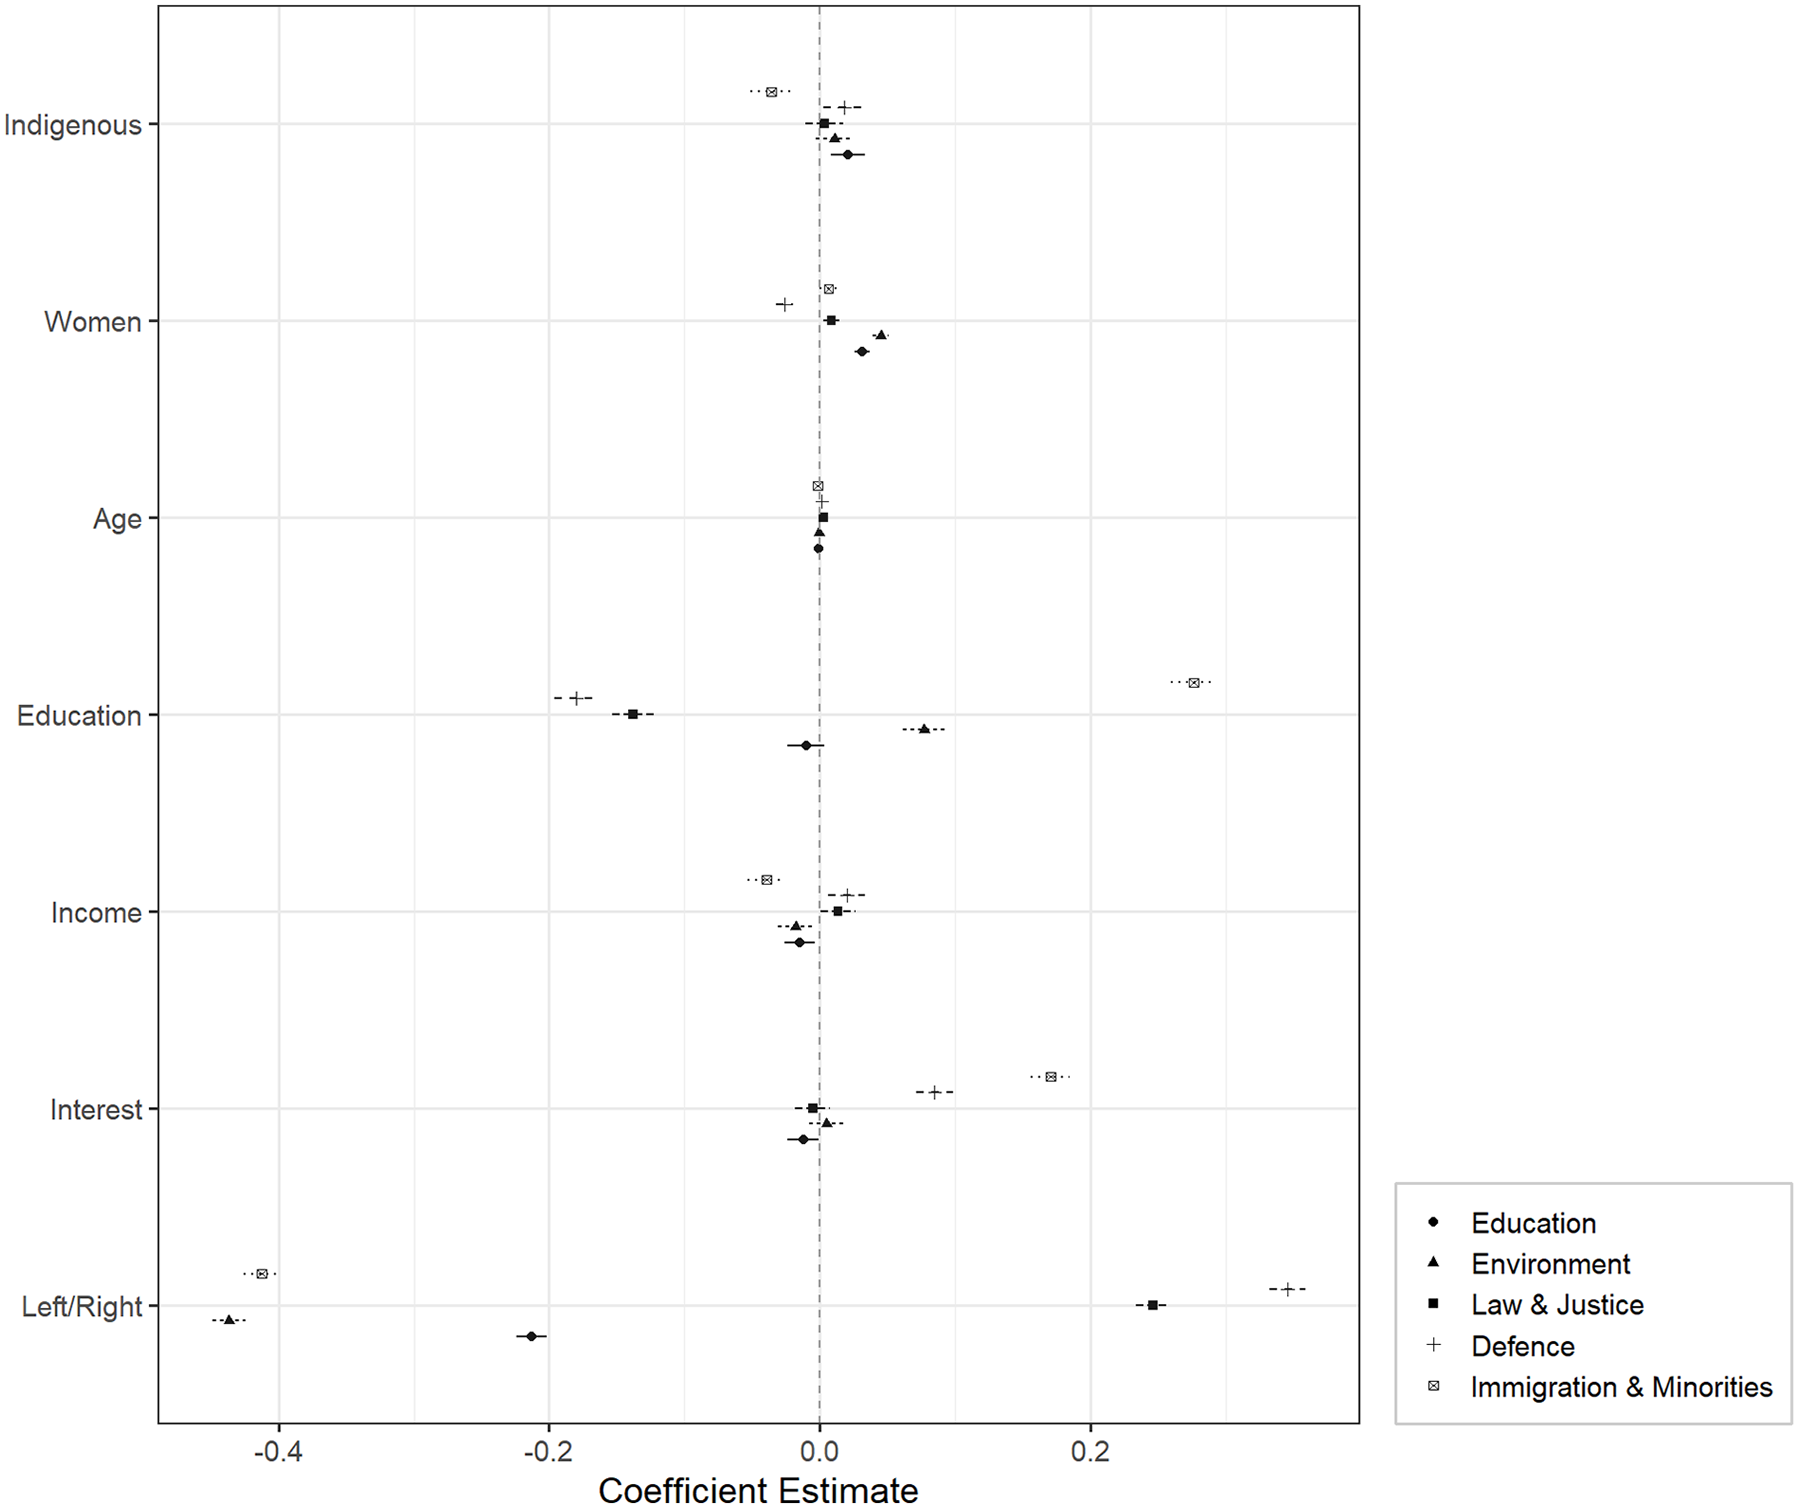
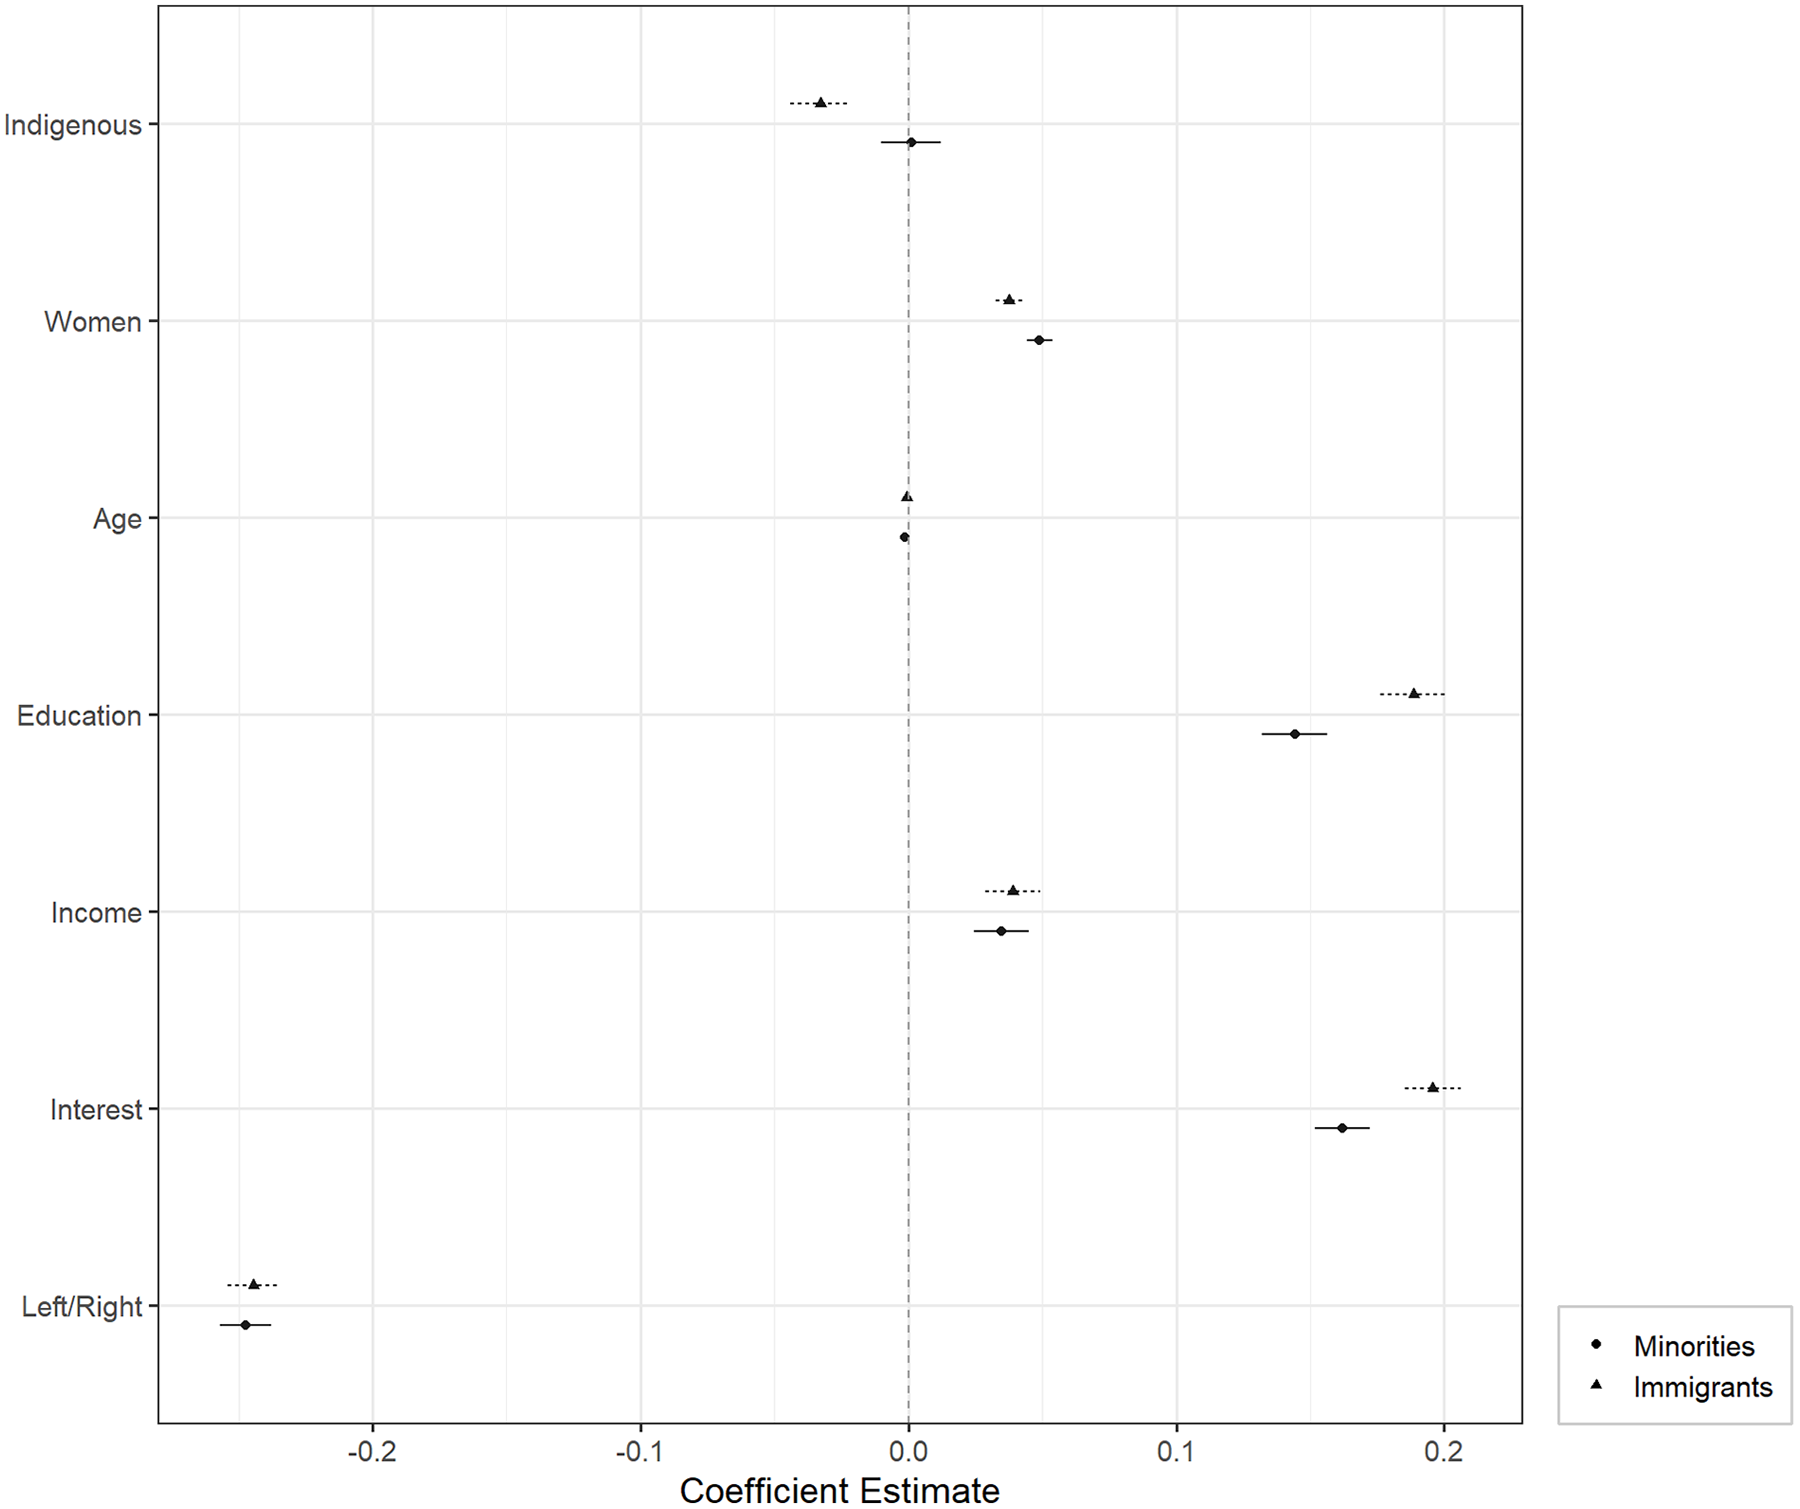
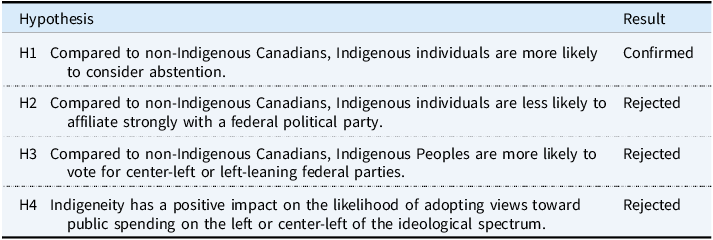
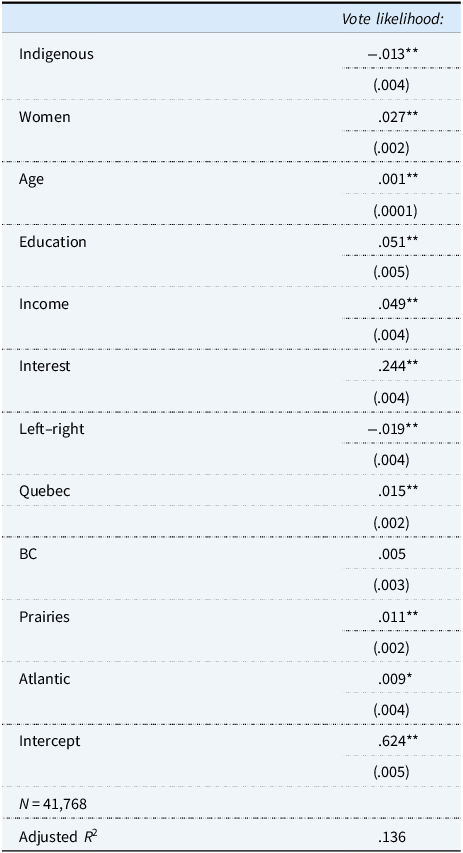
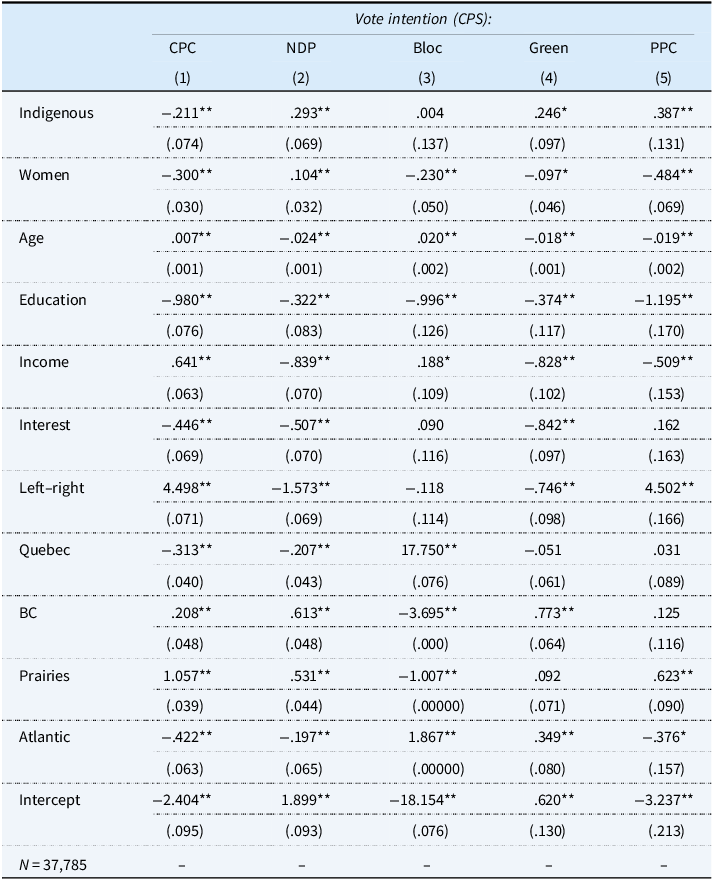
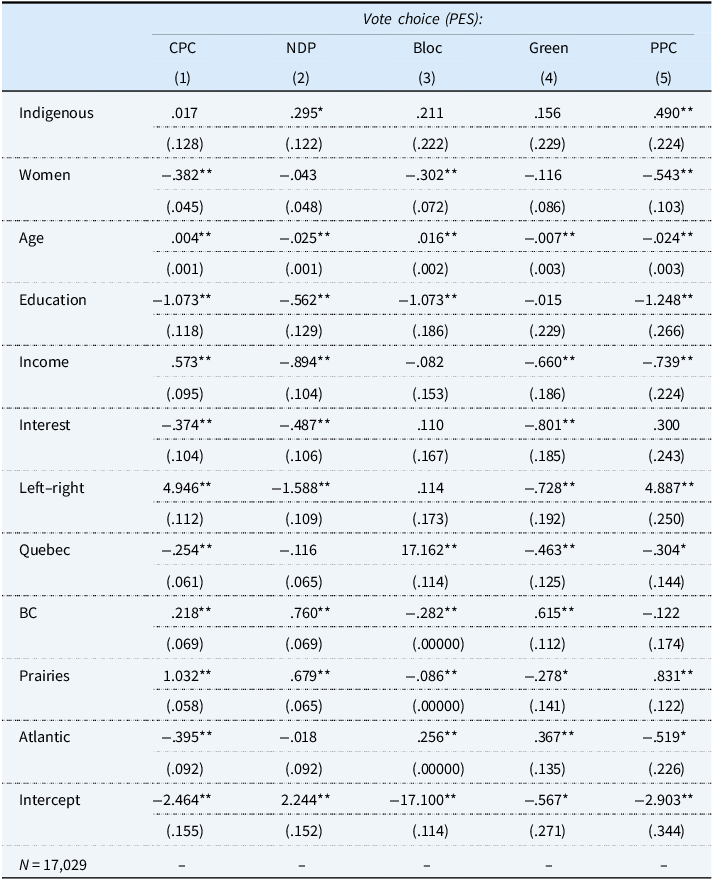
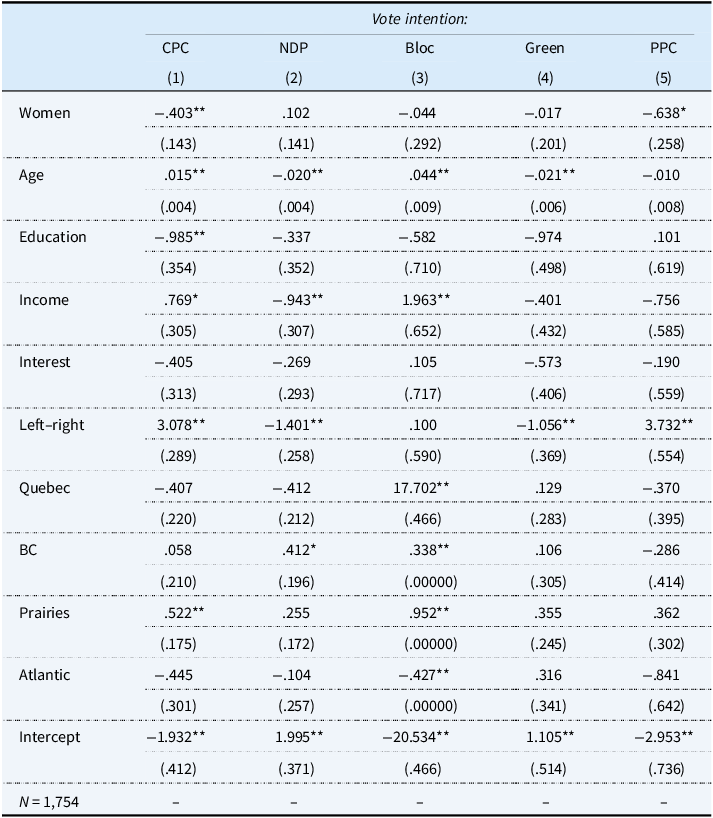
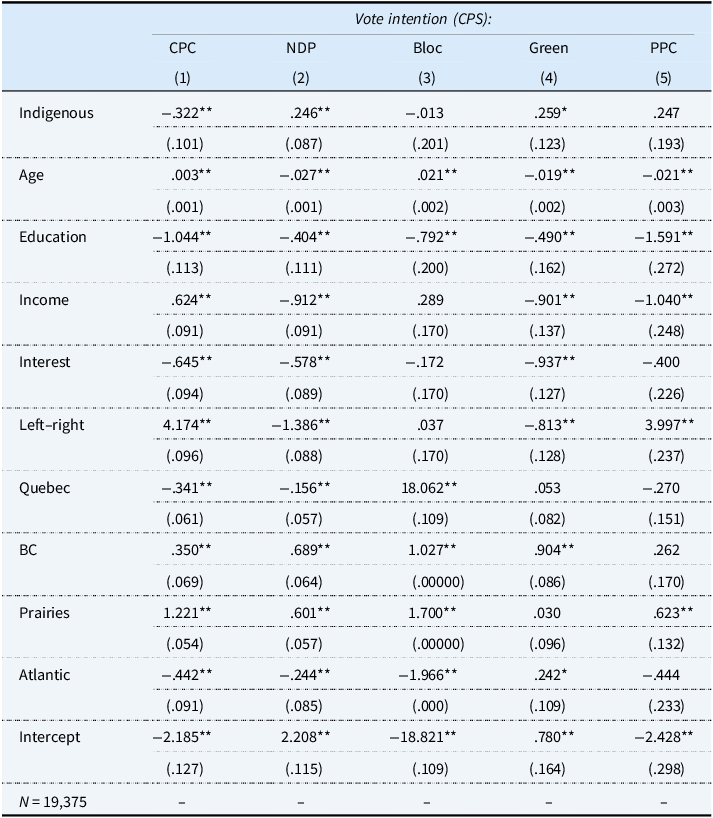
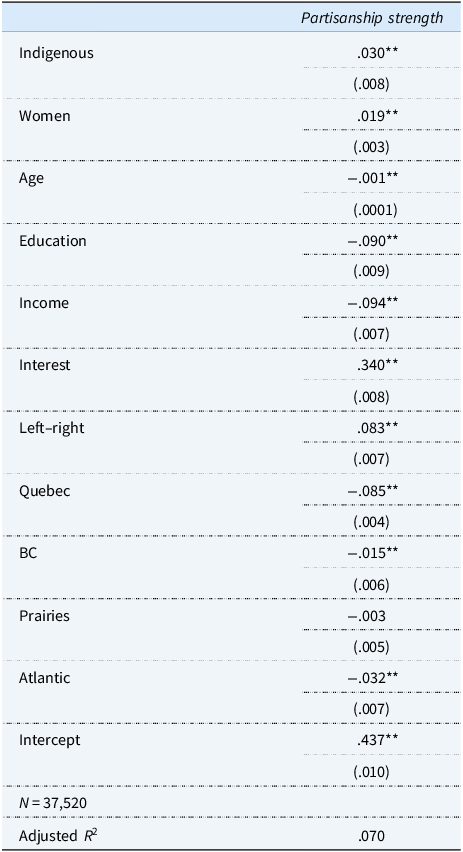
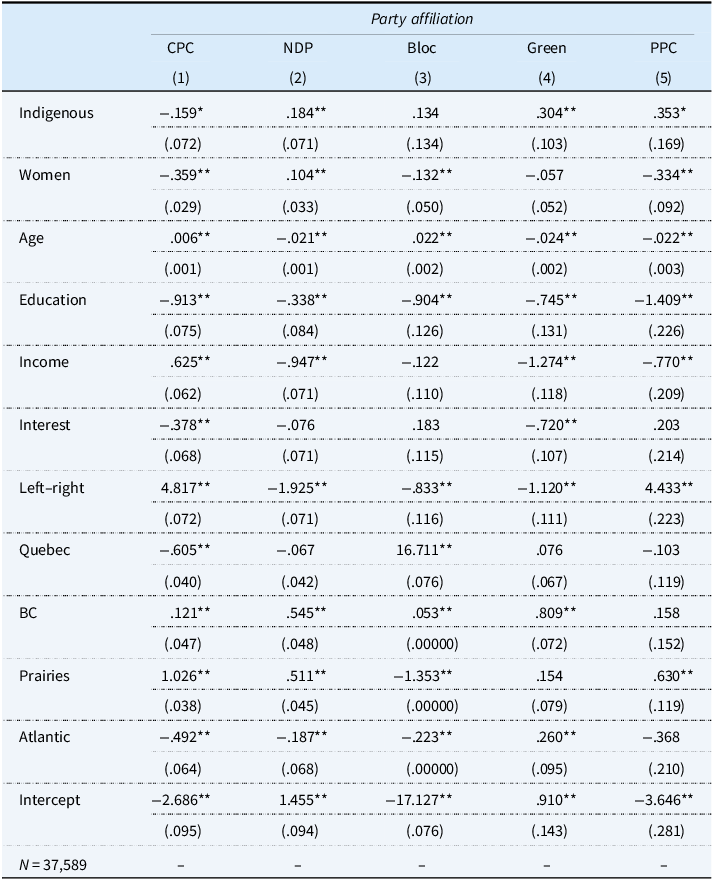
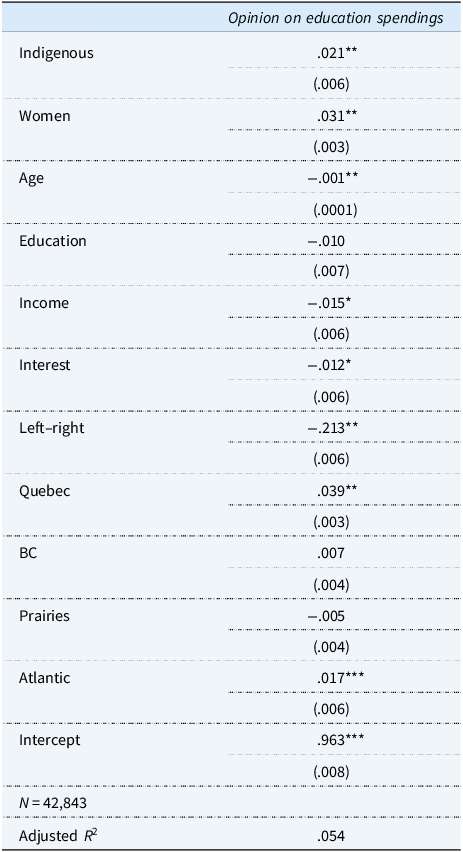
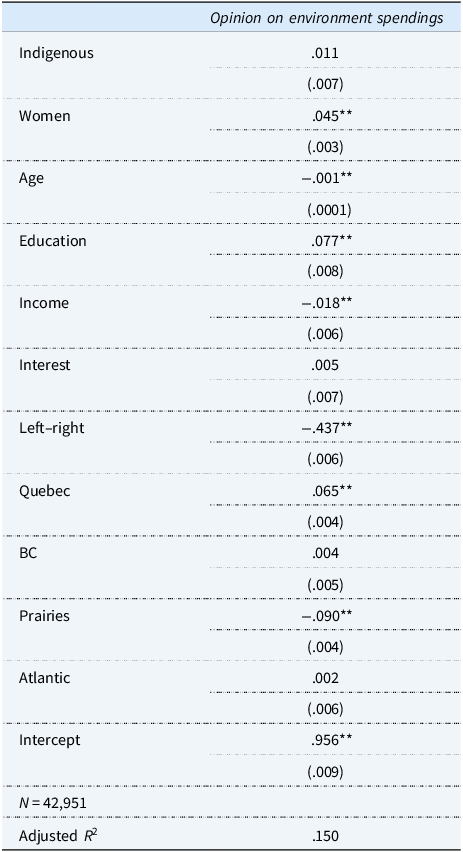
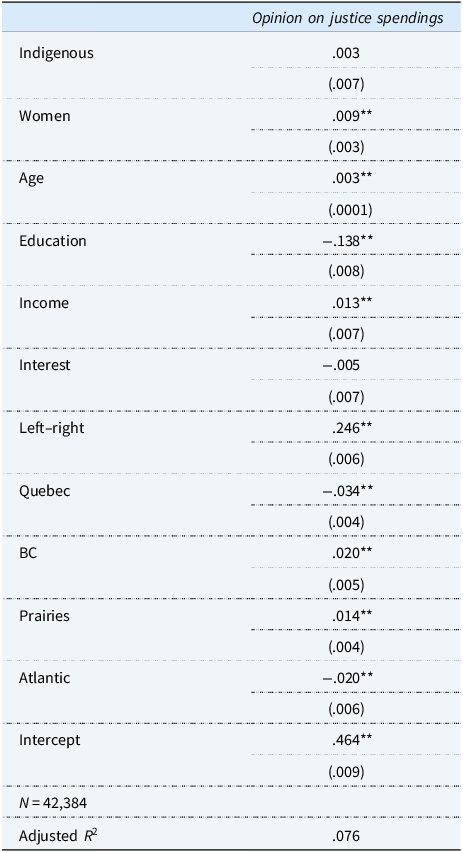
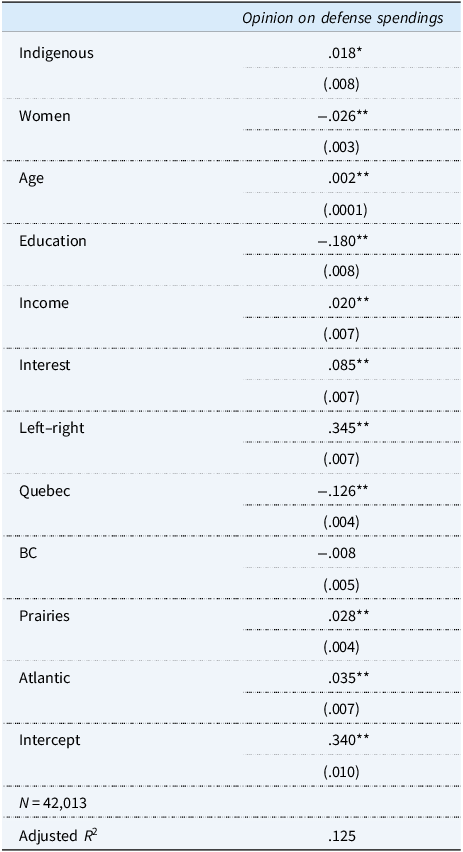
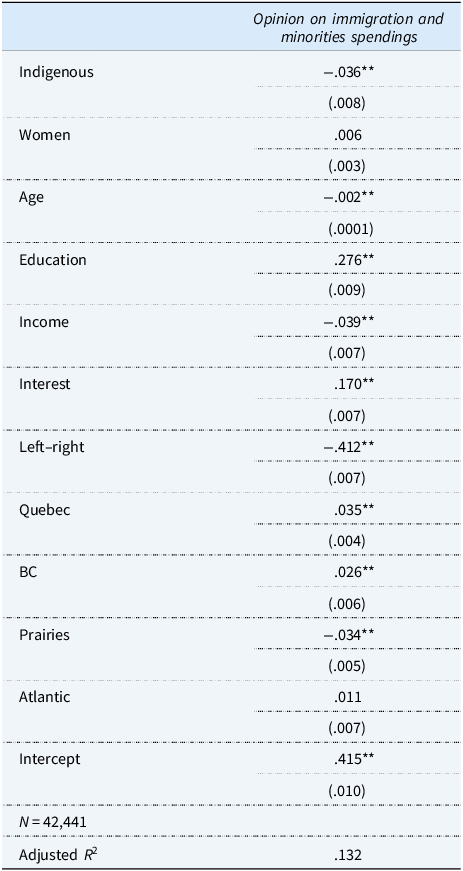
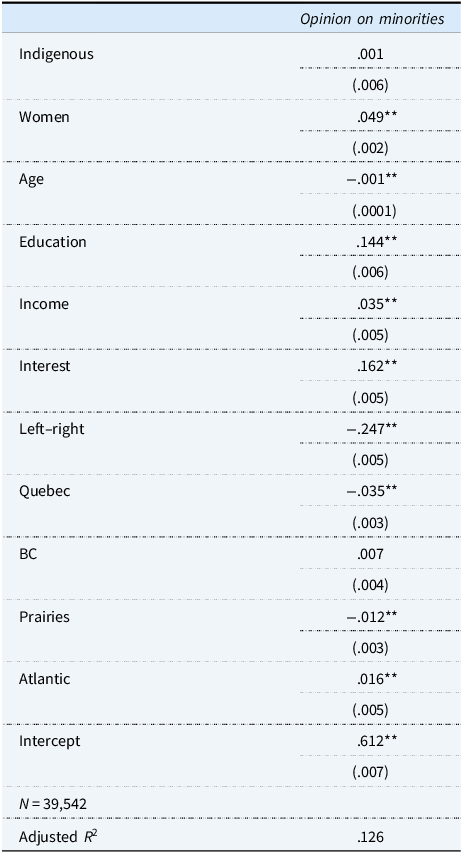
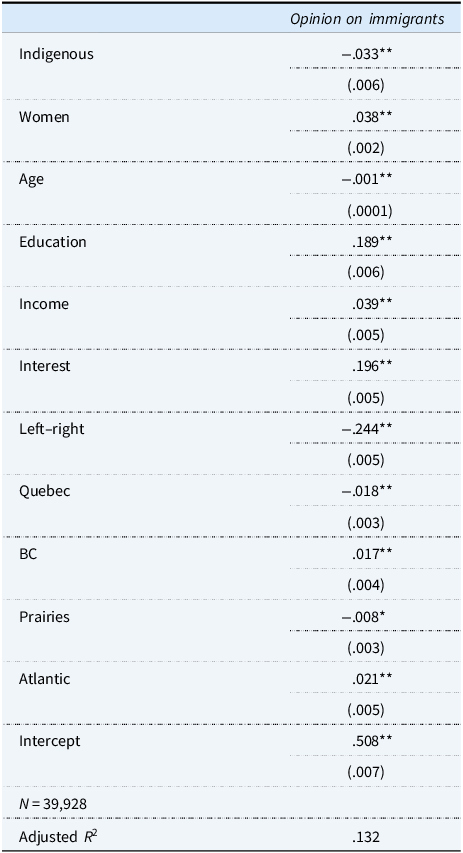

 Open access

