


It has long been known that people’s expectations about the outcomes of elections are closely tied to their preferences. In the social psychological literature, Hayes (Reference Hayes1936) was the first to demonstrate this effect, finding that over 90% of Roosevelt supporters expected Roosevelt to win the 1932 U.S. presidential election, while over 70% of Hoover supporters expected Hoover to win.Footnote 1 Over the past 90 years, numerous studies have shown that supporters overwhelmingly expect their candidate to win upcoming elections (e.g., Babad and Yacobos, Reference Babad and Yacobos1993; Blais and Turgeon, Reference Blais and Turgeon2004; Cantril, Reference Cantril1938; Dolan and Holbrook, Reference Dolan and Holbrook2001; Granberg and Brent, Reference Granberg and Brent1983; Krizan et al., Reference Krizan, Miller and Johar2010; Lewis-Beck and Skalaban, Reference Lewis-Beck and Skalaban1989; Meffert et al., Reference Meffert, Huber, Gschwend and Pappi2011; Searles et al., Reference Searles, Smith and Sui2018). Not only is this preference–expectation link easily replicable, it is also quite robust. In an evaluation of U.S. presidential elections from 1952–1980, Granberg and Brent (Reference Granberg and Brent1983) found that approximately 80% of people expected that their preferred candidate would win the election. In other words, for every pessimistic supporter, there were 4 optimistic supporters.
Although it appears that preference–expectation links in elections can be quite strong in magnitude, they are not ubiquitous across all situations. For example, Hayes’s (Reference Hayes1936) data show that supporters of fringe candidates do not necessarily expect them to win. Similarly, Granberg and Brent (Reference Granberg and Brent1983) found that the preference–expectation link was slightly reduced in years when there was a clear favorite to win the election. Studies examining whether the preference–expectation link varies as a function of individual differences rather than situations have produced mixed results. For example, some studies have found that the preference–expectation link does not seem to vary as a function of people’s knowledge or experience with a domain (Babad, Reference Babad1995; Krizan and Sweeny, Reference Krizan and Sweeny2013; Massey et al., Reference Massey, Simmons and Armor2011). However, other studies have found that the preference–expectation link in elections is related to education (Lewis-Beck and Skalaban, Reference Lewis-Beck and Skalaban1989) and political knowledge (Dolan and Holbrook, Reference Dolan and Holbrook2001).
More relevant to the current paper are studies that have examined whether certain debiasing techniques can be used to mitigate the preference–expectation link. Although preference–expectation links could reflect a variety of underlying causal influences (Krizan and Windschitl, Reference Krizan and Windschitl2007; Meffert et al., Reference Meffert, Huber, Gschwend and Pappi2011), it is widely assumed that the links substantially reflect wishful thinking—i.e., the biasing impact of preferences on expectations. One type of attempt to mitigate this bias has been to simply offer monetary incentives for accurate predictions, which is sensible if one assumes that people become more clear-eyed when it is beneficial to do so. Contrary to expectations, incentives for accuracy have not been found to decrease wishful thinking (Babad, Reference Babad1987; Irwin and Metzger, Reference Irwin and Metzger1966; Irwin and Snodgrass, Reference Irwin and Snodgrass1966; Simmons and Massey, Reference Simmons and Massey2012).
Another study that targeted but failed to remove a preference-induced bias—this time in a sports context—was by Markman and Hirt (Reference Markman and Hirt2002). They used a technique similar to what had been successful in reducing knowledge–overconfidence effects (Koriat et al., Reference Koriat, Lichtenstein and Fischhoff1980). Specifically, they had some participants write about a team winning an upcoming college football game before stating expectations about the outcome. This writing intervention influenced the expectations of nonfans (those with no allegiance to either team), but it did not quell the preference–expectation link among fans.
One recent exception to the failures to debias wishful thinking was recently documented by Rose and Aspiras (Reference Rose and Aspiras2020). They tested whether a short perspective-taking intervention would reduce the preference–expectation link in the context of the 2016 U.S. presidential election. The perspective-taking intervention asked participants to imagine someone who had different voting preferences and to ‘try to look at the world through this other person’s eyes’. Rose and Aspiras (Reference Rose and Aspiras2020) noted how perspective taking has been used as an intervention to reduce attention biases relevant to other, related judgment phenomena (e.g., social comparative under-/overplacement). They thought that their manipulation would broaden people’s thoughts—away from overfocusing on their own candidate or their desires for that candidate winning—and this would thereby reduce bias in expectations. Consistent with their hypothesis, the perspective-taking intervention in their studies significantly reduced the preference–expectation link.
Rose and Aspiras’s (Reference Rose and Aspiras2020) studies were important because, although they were consistent with other studies showing that perspective-taking manipulations can debias people’s judgments, they were the first to demonstrate this effect when examining the preference–expectation link. Also, they presented a simple and robust debiasing technique for an effect that is largely resistant to other debiasing efforts. Despite the potential promise of the perspective-taking technique, Rose and Aspiras’s studies were only tested in a limited set of contexts. We designed our study to examine the same debiasing technique—this time using the 2020 U.S. presidential election as the prediction context.
In addition to examining the influence of the perspective-taking treatment in a new context, we extended the research in 2 important ways. First, all participants in the study were given an incentive for making accurate predictions. Rose and Aspiras did not include an accuracy incentive, and although this is common in studies investigating the preference–expectation link, it does raise potential problems when examining debiasing techniques. For example, after reading a passage about taking another person’s perspective, participants might be more willing to give predictions that do not represent their actual beliefs (perhaps due to demand characteristics). However, with an accuracy incentive, there is a potential cost to making a prediction that does not reflect one’s belief about what is actually most likely to happen. Therefore, a debiasing technique that is effective when there is nothing on the line might be ineffective when people are invested in making an accurate prediction. Our inclusion of the accuracy incentive allowed us to examine this possibility.
Second, we included a second type of perspective-taking condition. In addition to the control and original perspective-taking conditions used by Rose and Aspiras (Reference Rose and Aspiras2020), we added a condition in which participants were not only asked to take the perspective of a person with opposing views, but also to make a prediction from that person’s perspective. We thought that having people make a prediction from another person’s perspective would strengthen the perspective-taking manipulation, thereby enhancing the debiasing influence. Furthermore, this provided a direct check on what participants thought people with opposing preferences would expect as to the outcome of the election. It was possible, for example, that people assume others—regardless of their political views—share their expectations about the election. Therefore, by having people make predictions from another person’s perspective, we strengthened the manipulation and gained more insight into people’s assumptions about others.
In summary, with the 2020 U.S. presidential election as the prediction context, we used the procedures from Rose and Aspiras (Reference Rose and Aspiras2020) to examine the efficacy of the perspective-taking treatment to reduce the preference–expectation link. Critically, our study added an accuracy incentive, giving this study the ability to determine whether the debiasing effect operated on a deeper-than-superficial level. We also added a second perspective-taking condition that we thought might be even more powerful for debiasing than was the original. The materials and data for our study can be found at https://osf.io/n6kxc/. We report all data exclusions, all manipulations, and all measures in our study.
1. Method
1.1. Participants
Participants were recruited from Amazon’s MTurk using CloudResearch’s MTurk Toolkit. Participation was restricted to people from the United States, and participants were paid $1.00 for their participation, with the opportunity to get a $1.00 bonus for correctly predicting the outcome of the election. We had a target sample size of 300 participants (100 per perspective-taking condition) based on Rose and Aspiras’s (Reference Rose and Aspiras2020) sample sizes (N = 45 per perspective-taking condition in Study 1 and N = 100 per perspective-taking condition in Study 2) as well as funding considerations. The primary analyses excluded participants who indicated they did not have a preferred candidate, so we recruited 345 (115 per condition), anticipating we would exclude roughly 10% of the participants for those analyses. Only 16 participants were excluded for not having a preferred candidate, leaving us with a sample size of 329 for the primary analysis (108 in the control condition, 111 in the perspective condition, and 110 in the perspective + prediction condition; see Appendix A for demographic information). We conducted a sensitivity power analysis for the primary analyses described below. The power analysis showed that, with a sample size of 329, we had an 80% chance of detecting a debiasing effect approximately half the size of what Rose and Aspiras (Reference Rose and Aspiras2020) found, and a 99% chance of detecting an effect slightly smaller than their observed debiasing effect sizes.Footnote 2
1.2. Design and procedure
On November 2, 2020 (i.e., a day before the election), we posted a survey ‘regarding the U.S. presidential election’. The survey description informed the participants that they would receive $1.00 for completing the survey and could get a $1.00 bonus if they correctly predicted the winner of the election. People who agreed to participate were then shown the informed consent document, which also informed the participants they could get a $1.00 bonus for correctly predicting the winner of the election. After agreeing to the informed consent, the participants were asked who they would prefer to win the election (‘Who would you prefer to win the upcoming U.S. presidential election?’ Strongly prefer Biden; Somewhat prefer Biden; Equally prefer Biden and Trump; Somewhat prefer Trump; Strongly prefer Trump).
Next, participants were randomly assigned to 1 of the 3 conditions: perspective, perspective + prediction, or control. Participants in the perspective condition were shown perspective-taking instructions adapted from Rose and Aspiras (Reference Rose and Aspiras2020). The instructions asked them to imagine someone who has a different voting preference and look at the world through this other person’s eyes (see Appendix B for exact instructions). Participants in the perspective + prediction condition were shown the same perspective-taking instructions, but then they were asked to continue thinking about someone with a different voting preference and to indicate who they think this other person would predict to win the election (see Appendix B for the exact question). For participants in the control condition, there was no perspective-taking instruction or question.
Participants in all conditions were then reminded that they would get a $1.00 bonus if they correctly predicted the winner of the election, and they answered 2 questions about their expectations. First, they made a dichotomous outcome prediction (‘Who do you think will win the U.S. presidential election?’ Biden will win; Trump will win). Second, they estimated the probability that each candidate would win the election (‘How likely is it that each candidate will win the election? Please enter a number from 0 to 100 for each candidate below.’), with the requirement that the 2 probability estimates add up to 100.
Participants then answered follow-up questions including their confidence in their view of who was going to win the election, their interest and knowledge in political news and issues, whether the media was favoring 1 candidate, who was projected to win the election based on recent national polls, the usefulness of pre-election polls in accurately predicting the outcome of the election, and whether participants planned on or already had voted in the election (see Appendix C for the exact questions). Finally, participants indicated their political orientation (Very liberal, Moderately liberal, Neither liberal nor conservative, Moderately conservative, Very conservative), age, gender, education level, and ethnicity. Approximately a week after participation, participants who had correctly predicted the winner (Biden) received their $1.00 bonus payment.
2. Results
2.1. Preliminary analyses
Before testing the influence of the perspective-taking condition, we examined relationships between measured variables. We will highlight some of the relevant correlations, but see Appendix D for a complete list of correlations and descriptive statistics. Note that all variables are coded so that higher numbers indicate greater preference for, predictions about, or support for Trump. As expected, there was a strong preference–expectation link; participants’ preferences were strongly correlated with their outcome predictions (r(327) = 0.69, p < 0.001) and their probability estimates (r(327) = 0.63, p < 0.001). Participants who preferred that Trump win the election (N = 121) were more likely to predict that Trump would win the election, and participants who preferred that Biden win the election (N = 208) were more likely to predict that Biden would win the election. Specifically, 81.8% of Trump supporters (i.e., people who indicated either somewhat or strongly preferring Trump to win the election) predicted that Trump would win, while 86.1% of Biden supporters (i.e., people who indicated either somewhat or strongly preferring Biden to win the election) predicted that Biden would win.
We next examined the opposite-perspective predictions solicited from the 110 participants in the perspective + prediction condition (recall that they were asked to indicate who a person with an opposing view would predict as the election winner). We found that participants tended to believe that a person with an opposing preference would predict in line with their preference. This is revealed by a strong negative correlation between people’s preferences and their beliefs about an opposing person’s prediction (r(108) = −0.70, p < 0.001). More specifically, of participants who preferred that Trump win the election, 74.4% said a Biden supporter would predict Biden to win. Of participants who preferred that Biden win the election, 93.0% said a Trump supporter would predict Trump to win. Interestingly, participants’ belief that people who support the other candidate will have expectations that match their preference is evidence of their awareness of the preference–expectation link.
2.2. Primary analyses
Following Rose and Aspiras (Reference Rose and Aspiras2020), we categorized participants into those who preferred Biden, preferred Trump, and had no preference, based on participants’ responses to the preference question. We then excluded participants who had no preference (N = 16). Next, we conducted a 2 (candidate preference: Biden vs. Trump) × 3 (condition: control, perspective, perspective + prediction) between subjects ANOVA on participants’ outcome prediction that Trump would win the election. Although the outcome variable was binary, we employed this linear framework (i.e., a linear probability model) rather than logistic regression, following the recommendations by Gomila (Reference Gomila2021; see also Lunney, Reference Lunney1970). Gomila argued that for experimental designs, linear models provide more interpretable results, especially when examining interaction effects. Furthermore, this allows for the direct comparison of our results with the results reported by Rose and Aspiras (Reference Rose and Aspiras2020).Footnote 3
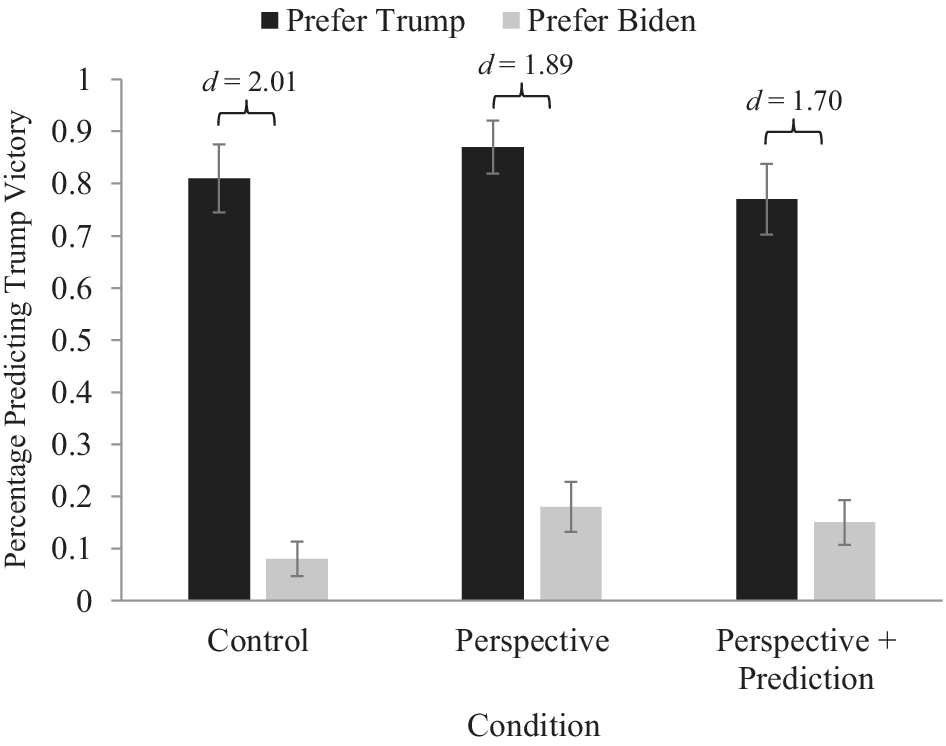
The ANOVA examining participants’ outcome predictions found that there was not a significant main effect of the intervention conditions on prediction rates. That is, predictions were not more or less likely to favor Trump because of the perspective-taking manipulations (F(2, 323) = 1.31, p = 0.272, ηp2 = 0.008, 90% CI [0.000, 0.027]). More important was whether there was a preference–expectation link. Indeed, there was a robust overall effect of participants’ preferences on their predictions, as evidenced by a main effect of candidate preferences (F(1, 323) = 264.34, p < 0.001, ηp2 = 0.450, 90% CI [0.386, 0.505]); as shown in Figure 1, participants who preferred that Trump would win the election were much more likely to predict that Trump would win than participants who preferred Biden. Most important, however, is whether the preference–expectation link was reduced by the perspective-taking manipulations. This analysis found that the preference–expectation link was not different across the 3 perspective-taking conditions; specifically, there was not a significant candidate preference × condition interaction (F(2, 323) = 0.607, p = 0.546, ηp2 = 0.004, 90% CI [0.000, 0.018]). In other words, the perspective-taking manipulations did not successfully reduce wishful thinking, as measured by participants’ outcome predictions.
Outcome predictions of Trump winning the election as a function of participants’ preference and perspective-taking condition.
Note: Error bars represent ±1 SE.

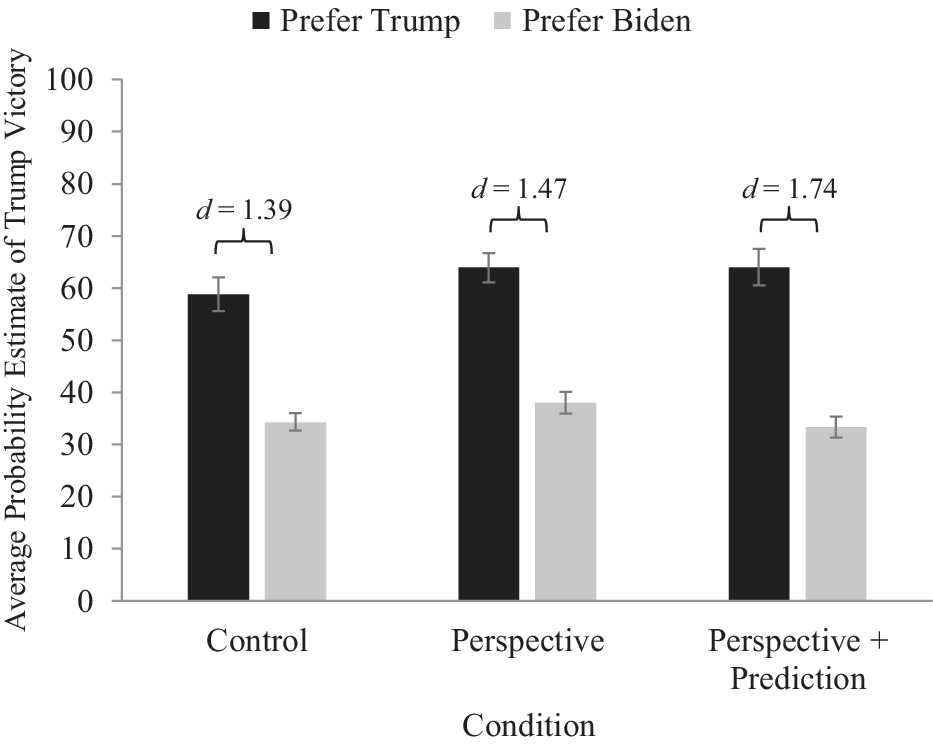
We next conducted a 2 (candidate preference: Biden vs. Trump) × 3 (condition: control, perspective, perspective + prediction) between-subjects ANOVA on participants’ probability estimates of Trump winning the election.Footnote 4 The pattern of results mimics what was found in the analysis on outcome predictions. Unsurprisingly, there was no main effect of condition (F(2, 323) = 1.57, p = 0.210, ηp2 = 0.010, 90% CI [0.000, 0.305]). The preference–expectation link, in the form of a main effect of candidate preference, was significant (F(1, 323) = 178.26, p < 0.001, ηp2 = 0.365, 90% CI [0.289, 0.416]). People who preferred Trump gave higher probability estimates about the likelihood of Trump winning the election than people who preferred Biden (see Figure 2). Most importantly, and again in contrast to what Rose and Aspiras (Reference Rose and Aspiras2020) found, there was not a significant candidate preference × condition interaction (F(2, 323) = 0.86, p = 0.426, ηp 2 = 0.005, 90% CI [0.000, 0.022]). Similar to the analysis of participants’ outcome predictions, neither of the perspective-taking manipulations successfully reduced wishful thinking as measured by participants’ probability estimates.
Probability estimates of Trump winning the election as a function of participants’ preference and perspective-taking condition.
Note: Error bars represent ±1 SE.

2.3. Equivalence test
The above analyses did not find evidence that the perspective-taking intervention reduced wishful thinking. Though useful, they cannot provide evidence that there is no effect of the intervention, just that there is no evidence of an effect. As a step toward providing evidence that there is no effect, we conducted an equivalence test using the procedure described by Lakens et al. (Reference Searles, Smith and Sui2018). Equivalence testing evaluates the absence of a meaningful effect by determining whether the observed result is significantly smaller than the smallest effect size of interest (SESOI). We defined the SESOI based on the interaction effect size reported by Rose and Aspiras (Reference Rose and Aspiras2020) for the reduction in the wishful thinking effect due to perspective taking. We conservatively set our SESOI as 33% of the effect reported by Rose and Aspiras. Given that Rose and Aspiras reported interaction effect sizes $\eta^2_p$
= 0.09 (Experiment 1) and
$\eta^2_p$
= 0.09 (Experiment 1) and $\eta^2_p$
= 0.11 (Experiment 2), we established the equivalence bound as
$\eta^2_p$
= 0.11 (Experiment 2), we established the equivalence bound as $\eta^2_p$
= 0.030 (0.33 * 0.09).
$\eta^2_p$
= 0.030 (0.33 * 0.09).
The equivalence test procedure tested the null hypothesis that the true effect was at least as large as the defined SESOI ( $\eta^2_p$
> 0.030). The 90% confidence intervals for the candidate preference × condition interactions were [0.000, 0.018] and [0.000, 0.022] when examining participants’ outcome predictions and probability judgments, respectively. The upper limit of the observed 90% confidence intervals fell below the equivalence bound for both prediction types. This result shows that the observed reduction in the perspective-taking intervention on wishful thinking is smaller than the SESOI. The equivalence test cannot conclusively show that the perspective-taking manipulation had no debiasing effect on people’s predictions, but it does support the finding that the manipulation is likely to be so small (i.e., smaller than one-third the size that Rose and Aspiras [Reference Rose and Aspiras2020] found) that it is unlikely to be practically meaningful.
$\eta^2_p$
> 0.030). The 90% confidence intervals for the candidate preference × condition interactions were [0.000, 0.018] and [0.000, 0.022] when examining participants’ outcome predictions and probability judgments, respectively. The upper limit of the observed 90% confidence intervals fell below the equivalence bound for both prediction types. This result shows that the observed reduction in the perspective-taking intervention on wishful thinking is smaller than the SESOI. The equivalence test cannot conclusively show that the perspective-taking manipulation had no debiasing effect on people’s predictions, but it does support the finding that the manipulation is likely to be so small (i.e., smaller than one-third the size that Rose and Aspiras [Reference Rose and Aspiras2020] found) that it is unlikely to be practically meaningful.
3. Discussion
People’s expectations about elections are often related to their preferences (Granberg and Brent, Reference Granberg and Brent1983). In our study, we tested whether a short perspective-taking intervention could reduce the link between people’s preference for who wins the election and their expectation about who would, in fact, win the 2020 U.S. presidential election. We chose this intervention because Rose and Aspiras (Reference Rose and Aspiras2020) used this technique and showed promising results. Unfortunately, the intervention was largely unsuccessful; approximately as many people in the intervention conditions predicted that their preferred candidate would win the election as people in the control condition. Similarly, participants’ probability estimates were unaffected by the intervention. This was true even in our new condition, where participants made a prediction from another person’s perspective before giving their own prediction. This is particularly telling because, by and large, participants knew that someone with opposite political views would likely have opposite expectations about the outcome of the election. In other words, participants appear to know that other people are biased by their preferences, but then still make their own predictions in a biased way—a finding akin to the bias blind spot (Pronin et al., Reference Pronin, Lin and Ross2002).
The finding that participants appear to be aware of the preference–expectation link (i.e., they accurately predicted that someone with opposing preferences would likely have opposing expectations about the outcome of the election) is notable. Although many studies have examined wishful thinking, few have looked at people’s awareness of the bias in themselves and others. Future research could examine whether this awareness varies across people and whether the awareness is predictive of the amount of wishful thinking people demonstrate. Regardless of this interesting finding, what is clear is that in our study, even though people seemed aware of the preference–expectation link, the perspective-taking manipulation did not reduce wishful thinking.
Why is it that getting people to perspective-take and presumably recognize other people’s biases did not reduce participants’ own optimistic predictions? Many factors likely contribute to a preference–expectation link (Krizan and Windschitl, Reference Krizan and Windschitl2007), and only some would be targeted by a perspective-taking intervention. For example, people are likely to expose themselves to information consistent with their preferences (Scherer et al., Reference Scherer, Windschitl, O’Rourke and Smith2012; Windschitl et al., Reference Windschitl, Scherer, Smith and Rose2013). Trump supporters, for example, are likely to watch conservative news sources and discuss politics with other conservatives. When developing expectations about the outcome, people are relying on a biased set of information. Taking the perspective of another person would not change people’s biased information. Another factor that could contribute to the resiliency of the preference–expectation link is loyalty concerns (Morewedge et al., Reference Morewedge, Tang and Larrick2018). Biden supporters, for example, might be reluctant to predict that Trump will win the election because that might signal to others (or themselves) that they are not a true Biden supporter—that is, they will seem disloyal. Again, taking the perspective of another person likely would not counteract people’s concerns about being perceived as a disloyal supporter.
It is noteworthy that the results of our study differed from those found by Rose and Aspiras (Reference Rose and Aspiras2020). One reason for this discrepancy might be tied to the fact that we included an accuracy incentive to help motivate participants to give their best estimates. It is possible that a perspective-taking manipulation does momentarily influence how people think about predicting an outcome, but this influence is fleeting. That is, the perspective-taking instructions do not prompt any special insight that thereby changes a person’s predictions; for example, they do not trigger a new realization about the existence of very passionate supporters of the opposing candidate who will be highly motivated to turn out and vote. Instead, the perspective-taking instruction simply makes an opposing perspective momentarily highly accessible, perhaps even causing people to (at least partially) adopt that perspective for thinking about how to answer a prediction question. By including an accuracy incentive, along with a pre-prediction reminder that the monetary incentive is achieved if the prediction matches the actual outcome, we may have immediately disrupted the accessibility shifts caused by the perspective-taking instruction and reset people to be thinking squarely about what they think they should say for their own prediction. Furthermore, the accuracy incentive might have caused people to focus more on their own beliefs and preferences, rather than taking into account the thoughts of an imagined supporter with opposing views.
Another possible explanation is that the influence of the accuracy incentive and the perspective-taking manipulation is not additive. Perhaps, for example, there is a limit on how much people will update their judgments in response to external factors. If the accuracy incentive, by itself, reached this limit, then the perspective-taking manipulation would not have an effect. While accuracy incentives appear to have minimal impacts on reducing wishful thinking (Simmons and Massey, Reference Simmons and Massey2012), we cannot rule out this explanation as we did not manipulate the presence of the accuracy incentive.
There are other differences between our study and the study by Rose and Aspiras (Reference Rose and Aspiras2020) that could also account for the discrepancy in findings. For example, when asking about historical events (e.g., an election), the context from one to another changes. Each election is different, and we necessarily modified the materials of Rose and Aspiras’s study to ‘capture the same psychological situation as the original experiment’ (Brandt et al., Reference Brandt, IJzerman, Dijksterhuis, Farach, Geller, Giner-Sorolla, Grange, Perugini, Spies and van’t Veer2014, p. 219). However, it is possible that the uniqueness of the elections contributed to the disparate findings. This may be especially pertinent in the case of the 2020 election, which took place in a rising tide of political polarization in the United States (Boxell et al., Reference Boxell, Gentzkow and Shapiro2024).
In contexts other than elections, studies have found that optimism tends to decrease across time (e.g., Shepperd et al., Reference Shepperd, Ouellette and Fernandez1996). We conducted our study about a day before the election, while Rose and Aspiras (Reference Rose and Aspiras2020) conducted their study about a month before the election. Participants in our study were still quite optimistic that their preferred candidate would win the election. However, it is possible that people’s expectations become less malleable as the election draws near, thereby reducing the effectiveness of the intervention.
Relatedly, it may be the case that the results are specific to the political domain or to a highly polarized political climate. Perhaps the intervention could have had a significant effect in a less charged context such as sports fans making predictions about the outcome of a game. Political affiliation during a contentious election could have resulted in responses being shifted due to social desirability. Even though responses were anonymous, participants may have felt socially obligated to provide unrealistic assessments of support for their preferred candidate.
At this point, we cannot draw any firm conclusions about these reasons why the perspective-taking intervention significantly influenced people’s forecasts in Rose and Aspiras’s (Reference Rose and Aspiras2020) studies but did not in ours. Additional research is needed to identify when perspective taking could reduce undue optimism and when it might not. Developing effective interventions is important because being overly optimistic about one’s preferred outcome can have costly consequences in many situations, from sports betting to investing. Also, people who tend to be the most optimistic tend to be the most disappointed if their preferred outcome does not happen (Krizan et al., Reference Krizan, Miller and Johar2010). Despite the need for effective interventions, successfully debiasing undue optimism has remained relatively elusive (e.g., Markman and Hirt, Reference Markman and Hirt2002; Simmons and Massey, Reference Simmons and Massey2012). Rose and Aspiras (Reference Rose and Aspiras2020) identified a potentially successful debiasing technique, but what is clear from our study is that a brief perspective-taking intervention will not always mitigate wishful thinking in elections.
Data availability statement
The data for this study are available at https://osf.io/n6kxc/.
Funding statement
This study was supported by grants SES-1851766 to Andrew Smith and SES-1851738 to P.W. from the National Science Foundation.
Competing interest
The authors have no known competing interests.
AI use statement
AI (Google Gemini) was used to review the final draft of this manuscript, looking for typos, APA style errors, and other clarity issues.
Appendix A
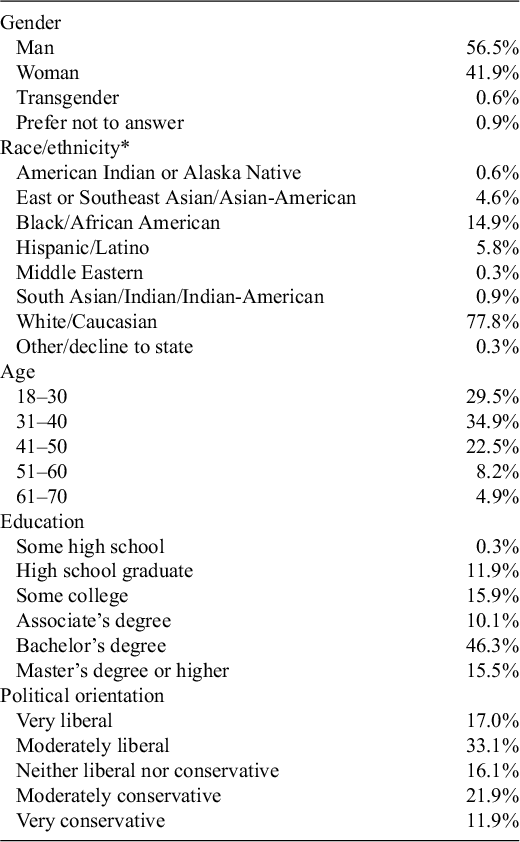
Summary of participant demographic characteristics (N = 329)

* Participants could indicate more than 1 race/ethnicity so the percentages add up to more than 100%.
Appendix B
Perspective-taking instructions
Participants in the perspective condition read these instructions, which were adapted from Rose and Aspiras (Reference Rose and Aspiras2020):
Before providing your election expectations, imagine what someone who has a different voting preference than you might be expecting and thinking. For example, if you are a Biden supporter, imagine what a Trump supporter might be thinking and expecting about the election. If you are a Trump supporter, imagine what a Biden supporter might be thinking and expecting about the election. That is, try to look at the world through this other person’s eyes and keep this in mind when making predictions about the election.
Participants in the perspective + prediction condition read the same instructions as above but also answered this question:
Please continue to think about someone who has a different voting preference than you. Who do you think this other person will expect to win the election? In other words, if someone with a different voting preference than you was asked to predict the outcome of the election, who would they predict would win?
Appendix C
Additional questions:
-
• Confidence: How are you currently feeling about your view of who is going to win the election? (Not at all confident, somewhat confident, very confident, extremely confident)
-
• Interest: Over the past few weeks, how interested have you been in political news and issues? (Not at all interested, slightly interested, somewhat interested, fairly interested, very interested)
-
• Knowledge: How knowledgeable are you about the political news and issues that have occurred over the past few weeks? (Not at all knowledgeable, Slightly knowledgeable, Somewhat knowledgeable, Fairly knowledgeable, Very knowledgeable)
-
• Media: According to what you have personally experienced, how would you characterize recent media coverage of the presidential candidates? (Strongly favoring Biden, Somewhat favoring Biden, Neither favoring Biden nor Trump, Somewhat favoring Trump, Strongly favoring Trump)
-
• Polls: According to the most recent national polls (i.e., polls occurring within the last week), which candidate is projected to win the U.S. presidential election? (Biden, They are tied, Trump)
-
• Poll accuracy: Do you think pre-election polls are helpful for accurately predicting the outcome of this election? (Definitely not helpful, Probably not helpful, Unsure, Probably helpful, Definitely helpful)
-
• Do you plan to vote or have you already voted in the upcoming presidential election? (Yes, I have already voted; Yes, I plan on voting; No, I do not plan on voting)
Appendix D
Descriptive statistics and bivariate correlations between measured variables.

* p < 0.05, ** p < 0.01, *** p < 0.001.
Note: Outcome prediction: 0 = Biden, 1 = Trump; probability estimates: 0–100% estimate of likelihood that Trump will win the election; see Appendix C for exact wording and response scales for confidence, interest, knowledge, media, polls, and poll accuracy; gender: 1 = man, 2 = woman, other responses excluded due to low sample sizes.
Appendix E
Descriptive statistics for participants’ outcome predictions and probability estimates split by condition and whether participants preferred Biden or Trump to win the election.

Note: Outcome predictions indicate the percentage of participants who predicted that Trump would win the election. Probability estimate is the average 0–100-point estimate of the likelihood that Trump would win the election.

 Open access