

1 INTRODUCTION
Radio astronomy is allocated several frequency windows below 2 GHz for observations from ground level (Table 1). These frequencies are listed by the International Telecommunication Union in Article 5 of the Radio Regulations. Recommendation ITU-R RA.769 (Thompson Reference Thompson, Lewis and Emerson2004) outlines the protection criteria that are necessary to enable radio astronomical observations without interference. Most of the allocated windows are also listed for radio astronomy for our national spectrum manager, monitored by the Malaysian Communication and Multimedia Commission (MCMC) (Spectrum Plan 2011). We compare the allocations to our neighbouring country's spectrum manager, namely the Thailand National Broadcasting and Telecommunication Commission (NBTC) (Thailand Table of Frequency Allocations 2011).
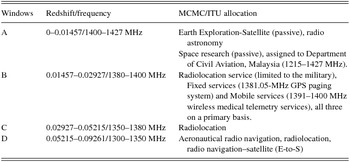
Malaysia (MCMC), Thailand (NBTC), and ITU allocation for radio astronomical windows below 2 GHz.

One of the most widely observed spectral lines occur at a wavelength of 21 cm, which has a rest frequency of 1420.4057 MHz relating to the neutral atomic hydrogen line (H i). Important H i researches include study of evolution of galaxy and galaxy clusters. Examples of galaxy clusters within the L band are the Virgo cluster (at frequency 1415 MHz) and the Coma cluster (around 1388 MHz). The galaxy clusters that this study has identified as suitable candidates for our L-band observations are A262 and A569.
Observations of galaxy and galaxy clusters in the L band can lead to research in cosmology as the effect of dark matter and dark energy to our universe can be seen through the observational effect of galaxy rotation curves in individual spiral galaxies (Rubin & Ford Reference Rubin and Ford1970), velocity dispersion distribution by applying the virial theorem (Zwicky Reference Zwicky1937), and gravitational lensing due to foreground objects of galaxy cluster (Einstein Reference Einstein1933). These techniques can also be used for galaxy cluster (both in low and high redshifts). In the large scale of the galaxy cluster, the distribution of the galaxy cluster is varied by the richness of the cluster. For the intermediate clusters, H i is distributed evenly throughout the field of the clusters. When the galaxies tend to move towards the cluster centre, an H i deficiency is more noticeable. This is due to the ram-pressure stripping that has occurred within the galaxies because the hot intracluster gas in the cluster centre is sweeping out the H i gas from the galaxies (Giovanelli & Haynes Reference Giovanelli and Haynes1985; Bravo-Alfaro et al. Reference Bravo-Alfaro, Szomoru, Cayatte, Balkowski and Sancisi1997; Chung et al. Reference Chung, Van Gorkom, Kenney, Crowl and Vollmer2009). H i surveys especially in clusters provide better and concrete understanding about the composition of matter, formation, and evolution of the clusters. Another significant phenomenon that can be studied in the nearby L-band frequencies is the rotation curves of galaxies such as the spiral and dwarf galaxies.
The evolution of the galaxy can also be studied in the nearby L-band frequencies by comparing H i and CO data. The Atacama large millimeter Array (ALMA) telescope observes the emissions of both CO(10) and CO(32) in order to see the rotational transitions of the prototypical Seyfert 2 galaxy NGC 1068 (Tsai et al. Reference Tsai, Hwang, Matsushita, Baker and Espada2012). Active galactic nuclei (AGNs) play an important role in different behaviours of these two CO transition lines.
Applying this study, there is a possibility to investigate the structure of AGNs using the same technique as in Kennicutt (Reference Kennicutt1998) by replacing CO with H i. In an effort to build a radio astronomy observatory operating at the L band, there is a need to do a radio frequency interference (RFI) survey on a few selected sites in Malaysia. We considered some methods for this operation. For example, a previous RFI study was performed by the Chinese SKA team particularly for the Kilometer-square Area Radio Synthesis Telescope (KARST) to identify interference from frequency 70 MHz to 22 GHz (Peng et al. Reference Peng2004). Fonseca also performed RFI measurement for several sites in Portugal to identify potential galactic emission mapping experiment (GEM) research in the 5–10 GHz band (Fonseca et al. Reference Fonseca, Barbosa, Cupido, Mourao, Santos, Smoot and Tello2006). Another RFI measurement study focusing on self-generated RFI around radio telescope was done due to the demand of having installation sites with a very quite radio frequency environment (Ambrosini et al. Reference Ambrosini, Bolli, Bortolotti, Gaudiomonte, Messina and Roma2010). Our own previous study of RFI measurement with our own standard practice and procedure detail can be seen in Abidin et al. (Reference Abidin, Ibrahim, Rosli, Malim, Anim and Noorazlan2012).
Compared with the Square Kilometre Array (SKA) RFI protocol, we only focus on a general study of RFI and within the L band. For the SKA project, they performed a broadband study covering frequencies from 150 MHz to 22 GHz. The SKA protocol is divided into two broad classes, mode 1 (strong RFI) and mode 2 measurement (weak RFI). They used both types of antennas, which are horizontally and vertically linear polarised (Ambrosini et al. Reference Ambrosini, Beresford, Boonstra, Ellingson, Tapping and Terzian2003). For our study, it is deemed sufficient to observe a more general level of RFI, which can be seen as a mixed mode of the SKA protocol.
As a pre-survey study, we identified that there are several signals that originate from human-generated interference affecting the L band and nearby frequency observations, for example, closed-circuit TV link (at 1393 MHz), GPS navigation satellite (1381 MHz), and point-to-point radio link (narrowband signal between 1385 and 1389 MHz), as shown in Cohen et al. (Reference Cohen, Ambrosini and Van Drie2005). The harmful interference from GPS allocated at 1381.05 MHz to the L3 carrier of the satellite is not of continuous use but when it is switched on, it is devastating to radio astronomy service (Ponsonby Reference Ponsonby1991). One of the suggestions to mitigate interference from all electronic equipment and computers in use around the observatory is to put them in a shielded room or Faraday cage. RFI can be suppressed using blanking. Cancelling the RFI adaptively can also be done. The easiest method is simply by estimation and then subtract these RFI (Gilloire & Sizun Reference Gilloire and Sizun2009). The use of interferometer techniques can also cancel out major peaks of RFI (Thompson Reference Thompson1982). Intermodulation products are a problem for Very Long Baseline Interferometry (VLBI). A good approach to overcome this problem is to adopt the system with cryogenic filters in the low noise amplifier (LNA) system (Tuccari et al. Reference Tuccari, Caddemi, Barbarino, Nicotra, Consoli, Schilliro, Catalfamo, Bachiller, Colomer, Desmurs and de Vicente2005).
2 METHODOLOGY
Celestial radio sources in radio frequency windows of 1300–1500 MHz covering both continuum and spectral line observations were initially investigated in this study. Two databases, i.e. the NASA/IPAC Extragalactic Database (NED) and the Set of Identifications, Measurements, and Bibliography for Astronomical Data (SIMBAD), were chosen. Almost 34 000 radio sources (in NED; Worrall, Biemesderfer, & Barnes Reference Worrall, Biemesderfer and Barnes1992) and about 8400 radio objects (in SIMBAD; Egret, Wenger, & Dubois Reference Egret, Wenger and Dubois1991) are found in the L-band range.
In Malaysia, the selected sites include the University of Malaya (UM) in Kuala Lumpur and Universiti Pendidikan Sultan Idris (UPSI) in Perak. In Thailand, the chosen sites are Doi Inthanon in Chiang Mai (CM) and Pha Tam in Ubon Ratchatani (UB). These four sites were chosen due to the recently proposed plan to build a radio telescope on them. UM is located about 10 km from the city of Kuala Lumpur while UPSI is about 100 km from Kuala Lumpur and also 6 km from the suburban city of Tanjung Malim. The UPSI site is conveniently shielded by several mountains around its area at around 20-km radius. The population density of the UM and UPSI sites is 7089 ppl km−2 and 70 ppl km−2, respectively. In Thailand, the candidate sites are selected by the National Astronomical Research Institute of Thailand (NARIT). Both sites, CM and UB, are selected mainly due to their low population density (refer Table 2), high altitude, and shielding by terrain areas. The population density of CM and UB is 91.5 ppl km−2 and 111.5 ppl km−2, respectively. The CM site is located about 100 km from the city of Chiang Mai and at about 1050-m altitude. UB is located near the border of Thailand and Laos. It is also a remote area and located 80 km from the Ubon city and is at about 150 m in altitude. This site is also conveniently located in the national reserve forest.
Population densities of the seven RFI monitoring sites in Malaysia and the two sites in Thailand.

a Observation sites in Thailand (Pawaputanon Reference Pawaputanon Na Mahasarakarm2007).
The RFI measurement system utilised here comprises of a spectrum analyser (Protek 3290N) that covers frequencies up to 2.8 GHz with a 180-kHz resolution bandwidth. A 1.4-GHz LNA with 28 dB gain/0.34 dB NF was used with a discone antenna optimised at 1420 MHz. Focus was divided on the L band into four new windows based on the redshift of important radio objects at H i. The windows are labelled as window A (1400–1427 MHz), window B (1380–1400 MHz), window C (1350–1380 MHz), and window D (1300–1350), which correspond to redshifts of 0–0.01457, 0.01457–0.02927, 0.02927–0.05215, and 0.05215–0.09261, respectively (see Table 3). The radio objects were categorised from the NED and SIMBAD databases by galaxy types in order to investigate their total number in the four windows. The astrophysical importance of these radio objects was also studied, especially in windows A and B (Worrall et al. Reference Worrall, Biemesderfer and Barnes1992; Egret et al. Reference Egret, Wenger and Dubois1991).
MCMC and ITU allocation between 1300 and 1427 MHz.
By referring to these windows, the averaged RFI values and peaks were also measured within them as well as in the overall L-band range. These values were then compared with the ITU threshold level. Investigation was also done to determine whether window B has any significant number and types of radio sources coupled with a high level of RFI than window A. Additionally, the population density effect on all the four sites was also studied, plus seven more sites in Malaysia, within the selected windows in order to find out how much RFI is affecting the windows, especially windows A and B.
3 RESULTS
The RFI spectra observed in the selected sites are listed and analysed in Figures 1–5. For the frequency band 1–2900 MHz, the average RFI level at the CM site is −93.6 dBm (with standard deviation as 6.7 dBm) shows a high RFI level (see Figure 1) than at UB, which is −97.6 dBm (with a standard deviation of 4.4 dBm). In the L-band window, i.e. 1300–1500 MHz (see Figure 2), it is evident that the UB site has lower RFI levels than the CM site in the four windows. The average RFI level in the L band at CM is −96.6 dBm (with a standard deviation of 4.1 dBm); however, in UB, this value is −97.4 dBm (with a standard deviation of 2.2 dBm). The RFI level in the frequency allocation in the L band shows a much lower RFI value than that within 1–2900 MHz.
Spectrum of RFI of sites in Malaysia and Thailand, frequency ranges from 0–2.8 GHz.

Spectrum of RFI of sites in Malaysia and Thailand in the L band (1300–1500 MHz).

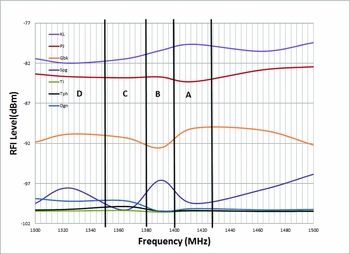
RFI level in Malaysia and Thailand for the all windows at the L band.

RFI level with various population densities in Malaysia.

Averaged RFI level within the four windows for the seven selected sites with varying population densities, in increasing values (i.e. from DGN to KL).
The averaged RFI value in window B at Chiang Mai is −98.1 dBm (with a standard deviation of 0.6 dBm). However, the averaged RFI level in window B in Ubon is −98.6 dBm (the standard deviation is 0.6 dBm) and shows even lower averaged RFI level. In conclusion, the RFI level in all three categories in UB is much lower than in CM.
In the UM and UPSI sites, the overall (0–2900 MHz) averaged RFI levels are −97.9 dBm (with a standard deviation of 5.0 dBm) and −98.7 dBm (with a standard deviation of 5.0 dBm), respectively. The averaged RFI levels in the L band (Figure 3) for the two sites are −99.7 dBm (with a standard deviation of 2.7 dBm) and −100.3 dBm (with a standard deviation of 1.1 dBm), respectively, while the averaged RFI levels in windows B for the two sites are −100.3 dBm (with a standard deviation of 0.3 dBm) and −100.5 dBm (with a standard deviation of 0.1 dBm), respectively. It is clear that the RFI levels in all three categories are lower for the UPSI site. A summary of these values can be seen in Table 4.
Averaged RFI levels in the three frequency categories at the four selected sites.
In order to see the relationship between population density and RFI, especially in window B, spectra at seven sites in Malaysia were obtained (Figure 4). Two sites are very high in the RFI level, namely Petaling Jaya and Kuala Lumpur, with averaged RFI levels in the L band as −83.5 ± 1.4 dBm and −80.5 ± 2.4 dBm, respectively. This is due to the high commercial and residential densities in these sites. Figure 5 shows the average RFI levels in each window for the seven sites. The RFI level was plotted within the four windows compared with the population densities of the seven sites (Figure 5).
As mentioned before, by referring to the spectrum management plan provided by MCMC, researchers separate the radio astronomy L-band window into four windows. It is calculated that the total numbers of radio sources in the four windows in both databases of NED and SIMBAD are shown in Table 5.
Total radio objects in the SIMBAD and NED databases.

The radio objects in Table 5 found in SIMBAD for the L band in the chosen windows are high-velocity clouds, H i sources, and galaxies. The nature of these sources is analysed especially in relation to their redshift depending on which window they are listed in. There are much less high-velocity clouds in windows B, C, and D than in window A (Table 6). More importantly, there are fewer galaxies in window A (28% or 127 numbers of galaxies) than in window B (79% or 1271) (see Figure 6). In the NED database, most radio objects in window A are spiral galaxies (67% or 694 numbers of galaxies). It is evident that there are more spiral galaxies in window B (83% or 10 687 galaxies) than in window C (81% or 3825 galaxies) and window D (63% or 212 galaxies) as shown in Figure 7.
Number of H i radio sources in the SIMBAD and NED databases.

HVC, H i, Gal, SpG, SpGO are notations for high-velocity cloud, hydrogen line, galaxies, spiral galaxy, and spiral galaxy pair/triple/groups, respectively.
Number of radio objects in SIMBAD according to types of sources.

Number of radio objects in NED according to types of sources.

By referring to Table 3 for the measurements of the spectrum in the L band down to 1300 MHz, it has been determined that the RFI are produced mainly by radiodetermination service in radiolocation (1300–1400 MHz), fixed service for point-to-point apparatus (1350–1400, 1427–1429, and 1429–1452 MHz), GPS paging system (1381.05 MHz), mobile service for repeaters, base and mobile/walkie talkies used in mobile services and maritime and aeronautical mobiles (1350–1400, 1427–1429, and 1429–1452 MHz), wireless medical telemetry services (1391–1400 MHz) and Digital Sound Broadcasting (assigned to the Malaysia East Asia Satellite (MEASAT) Network satellite at 1452–1492 MHz). We found that the Department of Civil Aviation of Malaysia is assigned a frequency range of 1215–1427 MHz, which is transmitted within the four windows and inside the allocated frequency for radio astronomy.
For RFI measurements in Thailand, we found two significant peaks at 1388.75 MHz (at −85.9 dBm) in window B and 1401 MHz (at −95.4 dBm) in window A (this peak is used for radiolocation which is a large spike as shown in Figure 2). In window B, there is a peak detected at 1388.8 MHz (−85.9 dBm) at the CM site. This frequency belongs to the point-to-point radio link which is a telecommunication usage (narrowband signal between 1385 and 1389 MHz). The free-space power loss is given by the equation 20log 10(4πdf/c) dB, where f is the frequency of the radio signal (i.e. 1420 MHz in our case) and d is the distance between the receiver and the transmitter. The distance during RFI measurements between the antenna and the device (5 m in our case) contributes to a −50 dB power loss. The power of the RFI seen as the antenna focus will then be −85.9 dBm + (−50 dB) = −136.4 dBm = −166.4 dBW. Therefore, this peak in the CM site generated an RFI exceeding the ITU-R RA.769-2 threshold level (−215 dBW) by 49 dB. Using the same calculation technique, the second peak (in window A) at the CM site (at −95.4 dBm) exceeded the ITU-R RA.769-2 threshold level by about 39 dB. However, there is no significant peak in the Malaysian sites in any of the windows except for the Department of Civil Aviation of Malaysia (1215–1427 MHz). This is not detected in our measured spectra but it is allocated for this organisation in the MCMC spectrum management.
From this paper, we also conclude that based on the RFI level, the UB site is better than the CM site for the purpose of building a radio telescope facility. While, in Malaysia, we can conclude that the UPSI site is better than the UM site for the same purpose.
4 CONCLUSION AND DISCUSSION
We have determined that the frequency window B (with frequency between 1380 and 1400 MHz) is a very important window for radio astronomers on the ground for H i observations. We found that there exist some RFI sources being transmitted in this window and we would like to press on the suggestion that we should protect this window before it is used for other RFI sources in the future. If this happens, the important radio sources listed in this paper, particularly in this window, will not be such good candidates for ground-based radio astronomy observations for many observatories in the world. It is also important to raise the awareness of people around the world about ITU Radio Astronomy Regulation. As determined in this study, it is important to avoid any emissions in the passive band from unwanted emissions due to active services in lower and upper bands at 1400–1427 MHz (Oliva et al. Reference Oliva, Daganzo-Eusebio, Kerr, Mecklenburg, Nieto, Richaume and Gruhier2012). Although RFI can be removed (Ellingson & Hampson Reference Ellingson and Hampson2003), it is better, albeit more difficult to actually realise it, if we can prohibit users from emitting these RFI in the first place.
In Malaysia, we have recently started converting an existing telecommunication antenna into a radio astronomy telescope at the L band, ultimately to be used for VLBI purposes (Abidin et al. Reference Abidin, Ibrahim, Rosli, Malim, Anim and Noorazlan2012). The initial aim is to observe galaxy clusters for the purpose of learning about their dark matter mass (Battye, Davies, & Weller Reference Battye, Davies and Weller2004). We have also started a collaboration with the International Centre for Radio Astronomy Research based in Perth, Australia, in order to be part of the first ever Asia–Oceania interferometer network involving China, Japan, South Korea, Malaysia, and Australia. The network will initially start with L-band observations of bright radio sources such as AGNs.
Acknowledgements
This paper is made possible by the usage of the University of Malaya's grants UMRG (RG118-10AFR) and IPPP (PV025 2011A) and the Ministry of Higher Educations HIR grant (H-21001-00-F000028). We specially thank researchers at the University of Malaya's Radio Cosmology Research Lab for their assistance for this work. The co-author, Roslan Umar, thanks Universiti Sultan Zainal Abidin for the award of his PhD scholarship. The authors also thank the National Astronomical Research Institute of Thailand (NARIT), especially Suparerk Aukkaravittayapun and Nikom Prasert, for making the observation in Thailand a success.


