


Introduction
The surveillance of carbon dioxide concentrations is crucial for comprehending the local carbon cycle and its interactions with the environment (Fang et al. Reference Fang, Zhou, Tans, Ciais, Steinbacher, Xu and Luan2014; Gorka and Lewicka-Szczebak Reference Górka and Lewicka-Szczebak2013; Hua et al. Reference Hua, Barbetti and Rakowski2013; Kuc et al. Reference Kuc, Różański, Zimnoch, Necki, Chmura and Jelen2007; Pawlak et al. Reference Pawlak, Fortuniak and Siedlecki2010; Vardag et al. Reference Vardag, Gerbig, Janssens-Maenhout and Levin2015; Zimnoch et al. Reference Zimnoch, Jelen, Galkowski, Kuc, Necki, Chmura, Gorczyca, Jasek and Różański2012). The rise in atmospheric carbon dioxide levels over recent decades has been attributed, among other causes, to the intensified extraction and combustion of fossil fuels (notably coal, petroleum, natural gas, and their derivatives). The combustion of fossil fuels results in decreased 14C concentrations in the atmosphere and, through carbon exchange processes between reservoirs, also leads to changes in the biosphere. The literature indicates that local reductions in radiocarbon concentrations are observed in industrial agglomeration areas, known as the local Suess effect (Keeling Reference Keeling1979). These reductions occur where there are significant CO2 emissions from fossil fuel combustion, including emissions from industrial sources, road transport, and households. Although industrial emissions have been reduced in Poland, traffic and household emissions continue to be significant contributors (Jasek-Kamińska et al. Reference Jasek-Kamińska, Zimnoch, Wachniew and Różański2020; Rozanski Reference Rozanski1991; Zimnoch et al. Reference Zimnoch, Jelen, Galkowski, Kuc, Necki, Chmura, Gorczyca, Jasek and Różański2012). The long-term evolution of CO2 emissions from fossil fuels in Kraków, located in southern Poland, has been extensively studied (Kuc Reference Kuc1991; Kuc et al. Reference Kuc, Różański, Zimnoch, Necki, Chmura and Jelen2007; Necki et al. Reference Necki, Schmidt, Różański, Zimnoch, Korus, Lasa, Graul and Levin2003; Zimnoch et al. Reference Zimnoch, Jelen, Galkowski, Kuc, Necki, Chmura, Gorczyca, Jasek and Różański2012).
The needles of the Scots pine (Pinus sylvestris L.) have been widely used as bioindicators to assess the success of reforestation efforts in regions of central Europe affected by mining activities. Anthropogenic activities leading to the release of various atmospheric pollutants have an impact on the physiological processes that regulate tree growth (Białobok Reference Białobok1976; Leavitt and Long Reference Leavitt and Long1982, Reference Leavitt and Long1986; Schleser Reference Schleser, Esser and Overdieck1991). Analysis of tree rings and foliage characteristics is essential for examining local and global environmental transformations. Environmental biomonitoring serves as a valuable tool to quantify the aggregate impact of various environmental pressures, including atmospheric pollutants originating from diverse sources. Over the past two centuries, anthropogenic activities have considerably increased atmospheric carbon levels. This increase has been achieved through direct carbon emissions, such as those resulting from fossil fuel combustion, as well as through alterations in ecosystems’ capacity to sequester CO2 from the atmosphere, as exemplified by deforestation. Additionally, the carbon isotopic composition has also been altered as a result of human activities, e.g., the combustion of fossil fuels has diluted the 14CO2 in the air, a phenomenon known as the Suess effect (Hua et al. Reference Hua, Barbetti and Rakowski2013; Keeling Reference Keeling1979). Activities related to nuclear technology, including nuclear testing and nuclear power plant operations, have contributed to the elevation of anthropogenically derived 14CO2 in the atmosphere. Understanding the local carbon cycle is essential for elucidating biological and chemical processes, as well as the various interactions with the environment.
The particular background to these studies of pine needles was a series of results obtained in 2012–2014 and in 2022 (Sensuła et al. Reference Sensuła, Michczyński, Piotrowska and Wilczyński2018, Reference Sensuła, Fagel and Michczyński2021). In the period from 2019 to 2023, the 14C levels were significantly lower compared to those observed during 2012–2014 (Sensuła et al. Reference Sensuła, Toroń, Rocznik, Sasiela, Świątkowski and Tomaszowska2022, Reference Sensuła, Piotrowska, Nowińska, Koruszowicz, Lazaj, Osadnik, Paluch, Stasiak and Strączek2023). We assumed that in the region of Silesia far from the nuclear power plant, the observed enrichment of 14C in pine needles seemed to be connected with point-source emitters, where products enriched in 14C were utilized and combusted (for example, products used in 14C-labeling in the medical sector, or probably also household wood burning). Additional longer analyses with a higher time resolution are reported in the current study.
Radiocarbon concentrations in pine needle samples have been analyzed since 2019. One, two, and three year old needles were investigated to check if the concentration of radiocarbon was constant or if any fluctuation was present. The analysis was conducted each 3 months’ period.
Another principal aim of the research was to systematically observe carbon dioxide concentrations and perform comprehensive analyses of the carbon cycle, employing mass spectrometric examination of the isotopic composition of carbon dioxide in the atmospheric air within an urban area located in the southern region of Poland. The establishment of sampling sites within urban agglomerations is essential for examining the monthly fluctuations in the 14C concentration. Our initial results (Sensula et al. Reference Sensuła, Piotrowska, Nowińska, Koruszowicz, Lazaj, Osadnik, Paluch, Stasiak and Strączek2023) showed that monitoring should be continuous, and additional atmospheric carbon isotopic air research could be an important source of data on the carbon cycle in the selected area.
The initial analyses of carbon isotopes ratio in the atmospheric air in Gliwice for the period 2023–2024 were conducted utilizing MICADAS at the recently established CEMIZ (Center of Isotopic Methods), inaugurated in December 2022 within the Division of Geochronology and Environmental Isotopes at the Institute of Physics-CSE, part of The Silesian University of Technology.
Methods
Sampling site
Gliwice (Figure 1), ranking as the third largest city within the Upper Silesian metropolitan area, has a population of approximately 180,000 inhabitants. It is positioned roughly 30 km to the west of Katowice, which has an estimated population of 300,000. The Upper Silesian metropolitan area exemplifies a typical urban setting, distinguished by rapid increases in vehicular traffic and substantial industrial activity. This region is significantly impacted by extensive coal mining operations, steel production facilities, power generation plants, and chemical manufacturing industries located within the industrial district. The primary contributors to anthropogenic carbon dioxide emissions in this region are the combustion of coal, natural gas, oil, and biomass for both communal use and transportation.
Sampling site.

The measurement site for the mole fraction in the air in Gliwice was situated on the university campus located in the city center (18.68°E 50.29°N). The air intake system was positioned on the roof of a faculty building, at an elevation of approximately 2 m above the roof and about 20 m above ground level. Continuous atmospheric CO2 measurements at the Silesian University of Technology site in Gliwice commenced in August 2022.
In the present study, the needles of the Scots Pine (Pinus Sylvestris L.) samples were analyzed. These were taken from Scots pines that were about 20 years old, growing in Gliwice in the area of the campus of the Silesian University of Technology, located near the main highway (Drogowa Trasa Średnicowa), less than 50 m. The needles (one, two, or three years old) were collected from the crown of the pines, in the period from spring 2021 to summer 2024, every three months in the middle of each season. Samples of approximately 100 grams of pine needles from a selected age year were collected. The samples were divided according to their age into three groups and investigated separately taking into account their age and the season of collection.
Determination of the mole fraction of CO2 in the air
The determination of the mole fraction of CO2 was conducted utilizing a CARBOCAP GMP343 probe (Vaisala) integrated with a temperature sensor, facilitating precise correction of optical cavity fluctuations. The measurement method employed with the GMP343 probe, which possesses the ability to interface with two distinct recorders (a DL2 data logger and directly with a PC), has been described previously (Sensuła et al. Reference Sensuła, Piotrowska, Nowińska, Koruszowicz, Lazaj, Osadnik, Paluch, Stasiak and Strączek2023). Interlaboratory calibration of the instruments has been done twice per year. The calibration of CABROCAP has been done each month with using certified synthetic air samples origin from SIAD company.
Integrated sample collection system
Monthly integrated samples were collected using an automatic sampling system connected to two 50 L alumina-coated polyethylene bags. The system consisted of two modules (Figure 2): the first one, presented on the left part of the schematic diagram, was responsible for filling the bags with a constant flow rate stabilized by a mass flow controller according to a predefined time schedule, while the second one was designed for the easy repetitive flushing of collected air into glass flasks, allowing the sample to be transferred to the next preparation steps, such as mole fraction measurement or isotopic analysis. To ensure a leak-proof seal, the system was constructed using 1/8” OD stainless steel tubing and Swagelok connections. In both modules, the airflow was forced by a KNF pump equipped with a Viton membrane, ensuring no isotopic fractionation during sample collection. In the filling module, a buffer volume was installed between the pump and the flow controller to dampen pressure fluctuations generated by the pump, which negatively affected the operation of the mass flow controller. A release valve was installed after the buffer volume to stabilize the flow controller inlet pressure and, at the same time, to allow for flushing the system inlet with a higher flow, which reduced the residence time of the air collection system. The last element of the filling system was a container with magnesium perchlorate, which was designed to dry the collected air. The output of the filling module was connected to alumina-coated polyethylene bags through the changeover valve system (V1 and V2), allowing for easy switching of two alternative bag connections between the filling of the flushing module. This module (right part of the diagram) consisted of a pump, pressure and flow sensors, and electromagnetic valves (V3, V4, and V5) controlling the airflow through the glass flask or purge vent output. The sampler was configured to collect air samples with a 2 ml/min flow rate over each month.
Diagram of the automatic integrated sample collection system. The left part represents the filling module responsible for the collection of air in the bag. The right part is designed for flushing the collected air from the bag into the glass flask for further preparation steps.

Extraction of CO2
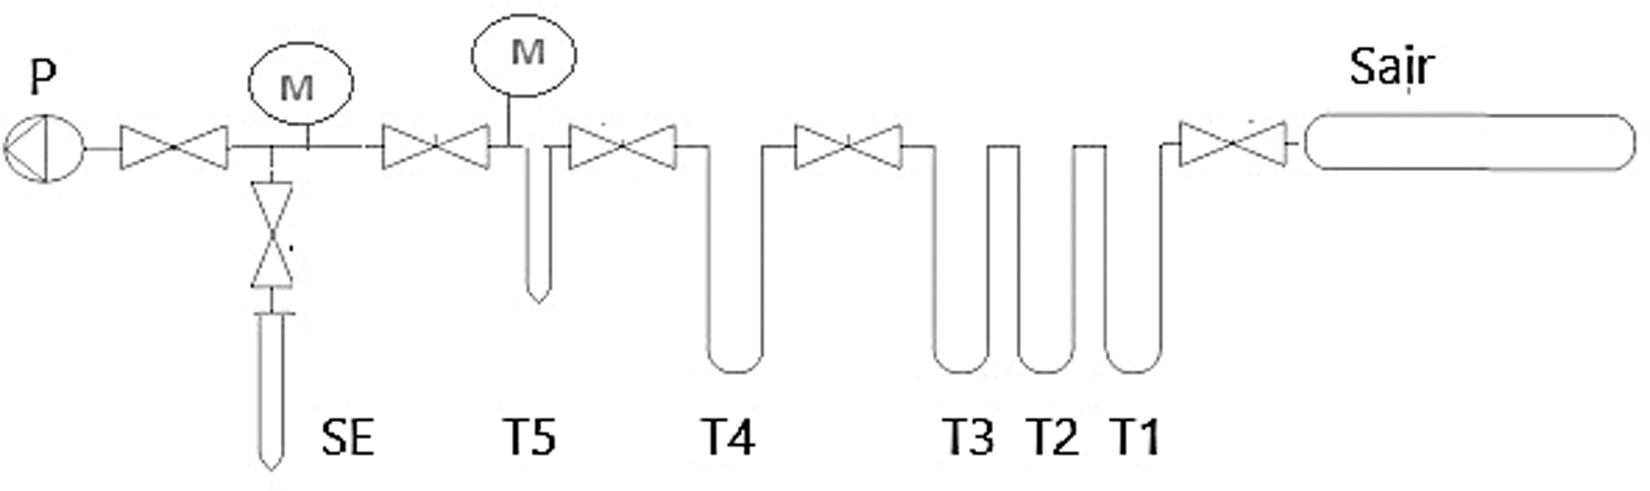
The vacuum line (Figure 3) that was used to extract the CO2 from the air samples consisted of the following parts: flask for the air sample (Sair), three water traps (T1, T2, and T3), CO2 traps (T4 and T5), extracted sample vial (SE), a pump (P), and two manometers (M) to control the flow and pressure in the vacuum line (p∼10–3mbar). This system consisted of different sectors, which were separated by gas valves, giving the possibility of separating the extracted gas from contaminants, such as water vapor. CO2 was collected in traps cooled with liquid nitrogen (temperature ∼ –196°C), while water vapor was collected in traps cooled with a mixture of the dry ice and ethanol (temperature ∼ –77°C). In the final step, when pure CO2 has been extracted from the air, the extracted CO2 was collected, encapsulated in quartz tubes, and graphitized.
The diagram of the vacuum line used to extract CO2 from the atmospheric air samples. Sair – vial with the air sample, T1, T2, T3, T4, and T5 – traps, M – manometers, P – pump, SE – vial to collect the extracted CO2.

14C/12C measurement using MICADAS
Graphite for AMS radiocarbon measurements was prepared using an AGE-3 system (Wacker et al. Reference Wacker, Christl and Synal2010a) equipped in manual cracker device (MCD, IonPlus). The radiocarbon concentration in the graphitized samples was measured using a MICADAS accelerator mass spectrometer (Synal et al. Reference Synal, Stocker and Suter2007; Wacker et al. Reference Wacker, Nemec and Bourquin2010b). In addition to the CO2 samples, three background (marble) and five standard samples (triplicated NIST Oxalic Acid II SRM4990C and secondary standards IAEA-C-7 and IAEA-C-8) were measured. The secondary standards were placed in the magazine to control the accuracy of the measurements and were analyzed as unknown samples (Ustrzycka et al. Reference Ustrzycka, Piotrowska, Kłusek, Pawełczyk, Michczyńska, Michczyński, Kozioł and Jędrzejowski2024; Wacker et al. Reference Wacker, Bonani and Friedrich2010c). For each series of the samples, a sample from synthetic air (SIAD) was used as a comparative control sample between the series.
The calculations of F14C and their uncertainties were performed using BATS software (Wacker et al. Reference Wacker, Christl and Synal2010a) including 13C fractionation corrections.
In the analysis of the results, as comparative data from an continental background site (Jungfraujoch, in Switzerland), we used data from Hersbach et al. (2024) with further extrapolation of these data to estimate the mean value of 14C in the continental background site atmospheric air.
Determination of CO2 from fossil fuel sources
The calculaction were perfomed using mass and isotope balance method
 $${{\rm{C}}_{{{tot}}}} = {{\rm{C}}_{{{bg}}}} + {{\rm{C}}_{{{ff}}}}$$
 $$
\Delta^{14}C_{{obs}} =\frac{{C_{{bg}} \cdot {{\Delta }}^{14}{C_{{bg}}}+ C_{{ff}}}\cdot \Delta^{14}{C_{{ff}}}}{{C_{{bg}}}+{ C_{{ff}}}}
$$
$$
\Delta^{14}C_{{obs}} =\frac{{C_{{bg}} \cdot {{\Delta }}^{14}{C_{{bg}}}+ C_{{ff}}}\cdot \Delta^{14}{C_{{ff}}}}{{C_{{bg}}}+{ C_{{ff}}}}
$$
 $$
{C_{{ff}}}={{C}_{{tot}\cdot}\frac{{{{{{\Delta }}^{14}{C_{{bg}}} -{{\Delta }}^{14}C_{{obs}}}}}}{{{{\Delta }}^{14}{C_{{bg}}}}+1000}}
$$
$$
{C_{{ff}}}={{C}_{{tot}\cdot}\frac{{{{{{\Delta }}^{14}{C_{{bg}}} -{{\Delta }}^{14}C_{{obs}}}}}}{{{{\Delta }}^{14}{C_{{bg}}}}+1000}}
$$
Fraction of fossil of total CO2 can be expressed as a ratio:
 $${{{f_{{ff}}}}}= {{{C_{{ff}}}}\over{{{{\rm{C}}_{{{tot}}}}}}}$$
where: ${C_{tot}}$
is a total CO2 concentration in the air sample (in ppm),
${C_{tot}}$
is a total CO2 concentration in the air sample (in ppm), ${C_{ff}}$
is a CO2 concentration from fossil fuels(in ppm),
${C_{ff}}$
is a CO2 concentration from fossil fuels(in ppm), ${C_{bg}}$
is a background (non-fossil) CO2 concentration (in ppm),
${C_{bg}}$
is a background (non-fossil) CO2 concentration (in ppm), ${\Delta ^{14}}{C_{obs}}$
is a measured Δ14C of the air sample (in‰),
${\Delta ^{14}}{C_{obs}}$
is a measured Δ14C of the air sample (in‰), ${\Delta ^{14}}_{bg}$
is a Δ14C of background air (without fossil influence) (in‰),
${\Delta ^{14}}_{bg}$
is a Δ14C of background air (without fossil influence) (in‰), ${\Delta ^{14}}{C_{ff}}$
is a Δ14C of fossil CO2 (≈ –1000‰) (in‰).
${\Delta ^{14}}{C_{ff}}$
is a Δ14C of fossil CO2 (≈ –1000‰) (in‰).
Radiocarbon concentration in pine needles samples
The radiocarbon concentration was determined using a liquid scintillation counter (LSC, Quantulus). Needles were collected from the crowns of trees and separated manually in the laboratory. For the analysis of 14C and the determination of the fraction modern (F14C), the needles were prepared using a standard acid-alkali-acid treatment in a three-step process: firstly, they were treated with 2% HCl at 80 °C for 2 hr and then neutralized with deionized water. After this, they were treated with 2N NaOH at 80 °C for 2 hr and again neutralized with deionized water. Finally, they underwent a treatment with 2% HCl at 80 °C for 2 hr, followed by neutralization with deionized water and drying. After neutrality was reached, the samples were converted to benzene for LSC measurements. Quantification of the 14C concentrations present in pine needles was carried out using a β-radiation LSC, a Quantulus 1220 (Pazdur et al. Reference Pazdur, Fogtman, Michczyński and Pawlyta2003).
The measured 14C concentration was normalized to the modern biosphere standard and presented as the value F14C. In our research, we performed a test to double the time of the analysis by LSC, which showed that a longer period of analysis had no impact on the uncertainty of the determination of the radiocarbon concentration in single samples.
The background F14C was equal to 0.019 pMC (–999.8‰). The ANU Sucrose reference material (Rozanski Reference Rozanski1991) was used, and the F14C was calculated according to the method of Mook and van der Plicht (Reference Mook and van der Plicht1999).
Results and discussion
We present a database of the 14C in the contemporary biosphere. Figures 4–6a-c and Table 1 provide an overview of data for atmospheric air. Figure 7 provides comparisons of 14C in the atmospheric air and in the biosphere (pines). Figures 8–9 and Table 2 provide an overview of the data for pine needles.
The similarities and contrasts in the CO2 air mole fraction in Gliwice in selected months.

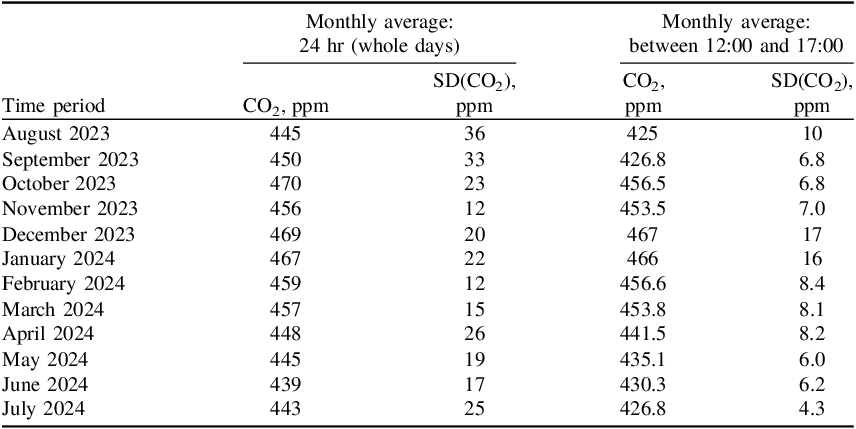
The monthly average of the total diurnal and afternoon CO2 air mole fraction in Gliwice.

The Planetary Boundary Layer (PBL; ECMS 2025) and CO2 concentration in the air at mid-day (a), at midnight (b), and detailed analyses of the fluctuation of CO2 depends on PBL height with monthly resolution (c).

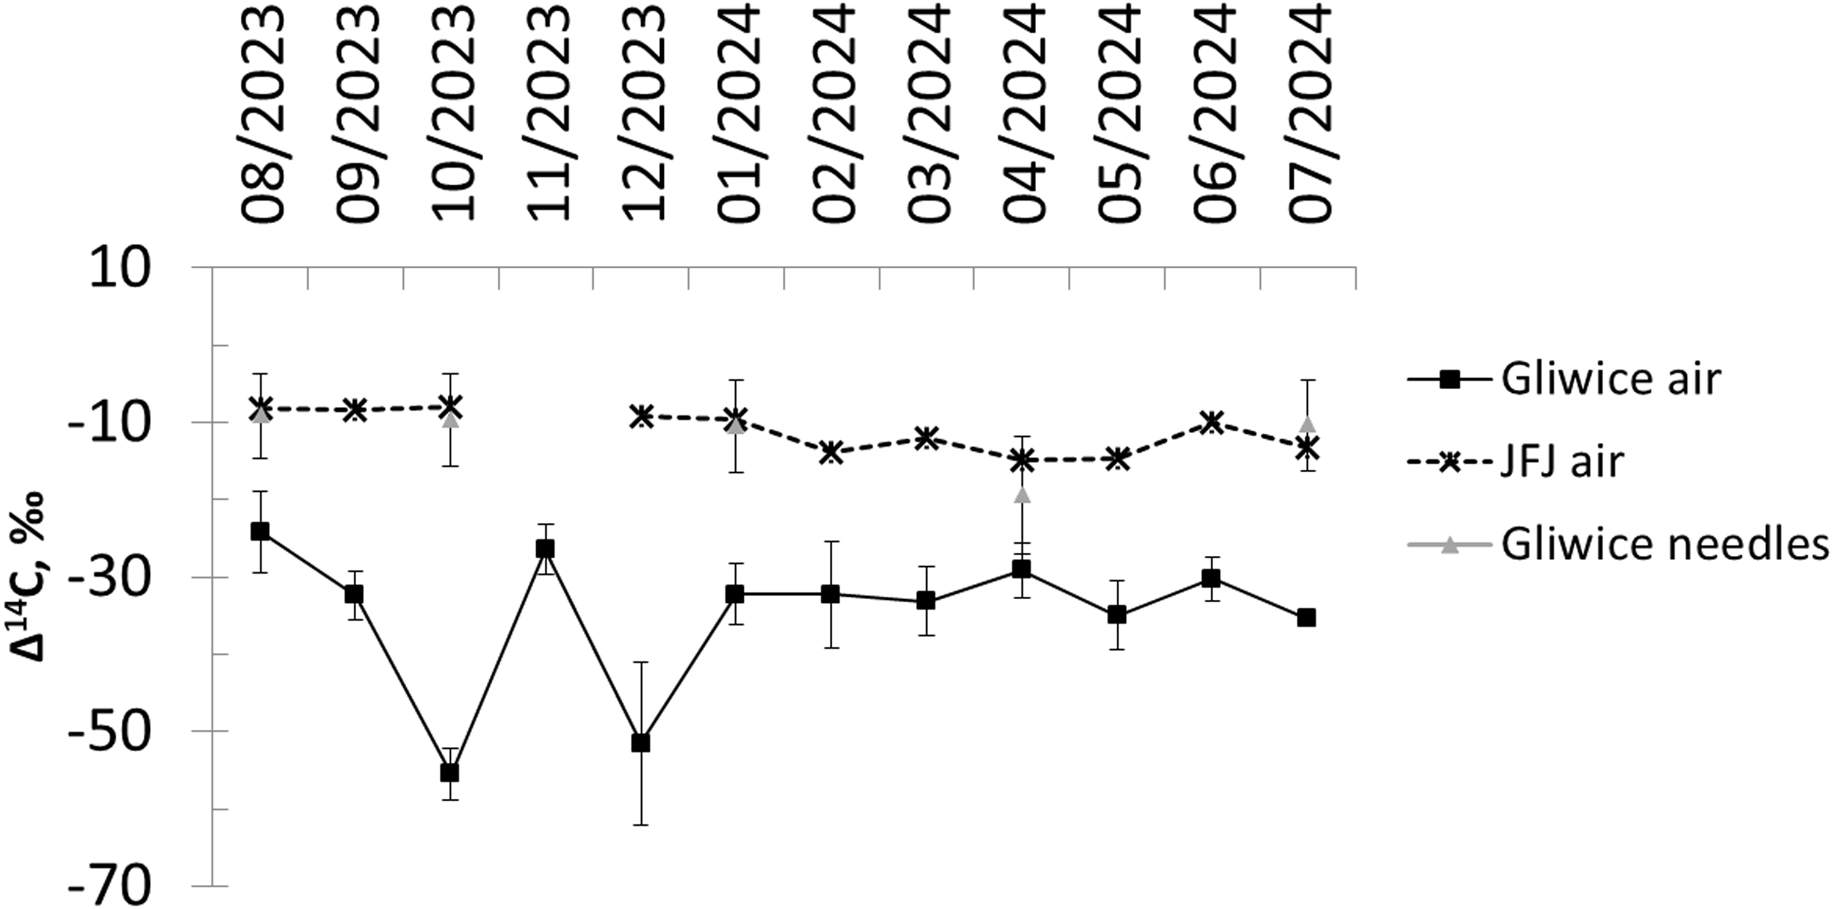
The monthly average of radiocarbon concentrations in the pine needles growing in Gliwice, in the atmospheric air samples in Gliwice and in the atmospheric air in the natural background in the Alps (ICOS ATC 14C Release analyzed by ICOS CRL from Jungfraujoch Emmenegger et al. Reference Emmenegger, Leuenberger and Steinbacher2025).

Comparison of F14C in pine needles growing in Silesia. The numbers indicate the age (in months) of the needles, collected with 3 months’ resolution, in the middle of each season between 2019 and 2024.

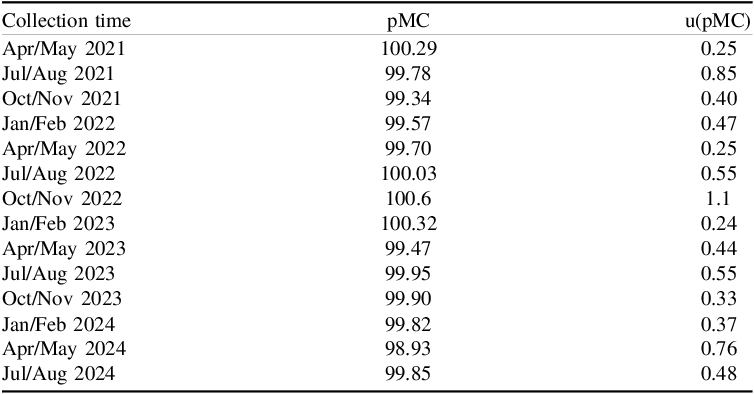
The average F14C in the needles (without taking into account the age of the needles) collected with 3 month’s resolution in the middle of each season between 2021 and 2024.

The average pMC in the needles

Atmospheric air
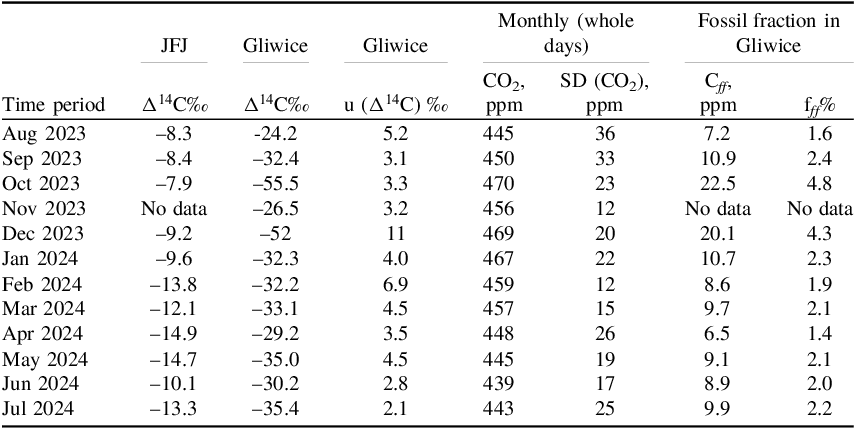
The radiocarbon level in the air samples (Δ14C) over the investigated period of time was –36 (10)‰ and showed significant fluctuations over time, ranging from –55‰ to –24‰. The monthly mole fraction of CO2 varied randomly from 439 to 470 ppm. The fraction of fossil of total CO2 has been estimated at the level of 2.5% during the investigated period of time.
The continuous monitoring of CO2 mole fractions in the air in Gliwice, initiated in August 2022 with high temporal resolution and sufficient accuracy to capture the diurnal variations, was designed to track local CO2 dynamics (Sensuła et al. Reference Sensuła, Chmura, Nęcki and Zimnoch2023a, Reference Sensuła, Piotrowska, Nowińska, Koruszowicz, Lazaj, Osadnik, Paluch, Stasiak and Strączek2023b). The daily variations in CO2 concentrations are influenced mainly by biological processes such as soil respiration, alongside anthropogenic activities related to fossil fuel use (e.g., fluctuations in traffic, heating, and air conditioning demands), as well as atmospheric transport and planetary boundary layer dynamics (Bezyk et al. Reference Bezyk, Górka, Sówka, Nęcki and Strąpoć2023; Fang et al. Reference Fang, Zhou, Tans, Ciais, Steinbacher, Xu and Luan2014; Metya et al. Reference Metya, Datye, Chakraborty, Tiwari, Sarma, Bora and Gogoi2021; Vardag et al. Reference Vardag, Gerbig, Janssens-Maenhout and Levin2015). The Planetary Boundary Layer (PBL) forms the lowest section of the troposphere and reacts immediately to surface-driven processes, including friction, heat and moisture exchange, and the release of gases.
The height of the PBL changes over the course of the day and is largely determined by meteorological factors—most notably solar heating, the intensity of turbulence, and the stability of the atmosphere. During the daytime, surface heating enhances convection and turbulent mixing. As a result, the boundary layer becomes deep, and CO2 concentrations near the surface decrease because emissions are diluted within a large volume of air. At night, surface cooling produces a temperature inversion, turbulence weakens, and the boundary layer becomes very shallow. CO2 emitted from soil respiration, vegetation, and anthropogenic sources (e.g., traffic) accumulates in this limited air volume, causing a sharp increase in near-surface CO2 concentration. The analysis of the PBL (Figure 6a–c) conducted at midday (12:00) and midnight (00:00) showed a significant impact of PBL height on CO2 concentration. When the PBL is shallow, CO2 levels increase, whereas when the PBL is deep, CO2 levels decrease. By analysing CO2 and PBL trends at two different times of day throughout the year, it is clearly visible that at midnight the trends are similar, while at midday CO2 shows an opposite pattern to the PBL height.
The CO2 concentration in the atmospheric air is not constant (Table 1 in Appendix; Figures 4–6a–c). Mothly data from the European reference site in the Swiss Alps (Jungfraujoch) in the atmospheric air during the period from August 2023 to July 2024, shown fluctuation between –14.87 to –7.89‰. A comparison of radiocarbon concentrations of CO2 in Gliwice with data from the European reference site in the Swiss Alps (Jungfraujoch, Emmenegger et al. Reference Emmenegger, Leuenberger and Steinbacher2025) suggested the impact of fossil-fuel-related CO2 emissions on CO2 concentration in the atmosphere. Figure 3 provides an overview of the CO2 levels in the atmospheric air during the period from August 2023 to July 2024, whereas Figure 4 presents a comparison between CO2 level in the samples analyzed during whole days (total) and for a selected period (from 12.00–17.00). Between 12.00 and 17.00, a plateau in the CO2 level was noted during a vegetation period, the data for this period of time being compared for each month. This period of time was also visible when comparing the scatter values of the standard deviation of CO2, showing the impact of different sources of CO2 and of important processes that affect the daily variation in CO2 level. Figure 5 shows the similarities and differences in 14C in the atmospheric air. There was a clear trend of a decrease in 14C during winter in comparison with other seasons. Thermal effects in the atmosphere, particularly at night, have been noted, which can result in higher CO2 concentrations persisting for extended periods. Additionally, biospheric activity is more pronounced (though not exclusively) in the summer and fall, while anthropogenic sources tend to dominate in winter, after the growing season ends. From late autumn to the start of the new growing season in mid-March, the role of photosynthesis and plant respiration in regulating CO2 concentrations is minimal. During this time, there is no significant reduction in CO2 levels during the day or an increase at night, which is typical of the summer period. The mixing of air masses and fluxes can also influence CO2 concentrations in urban areas.
Research conducted in Łódź showed that CO2 emissions generally exceed absorption throughout the year, except in summer, when lower anthropogenic emissions coincide with photosynthetic absorption, leading to the lowest net CO2 flux (Pawlak et al. Reference Pawlak, Fortuniak and Siedlecki2010). These findings emphasize the complex interplay of factors that govern CO2 concentrations in urban environments, including emissions, seasonal fluctuations, and biosphere interactions. Similar patterns were found by Bezyk et al. (Reference Bezyk, Górka, Sówka, Nęcki and Strąpoć2023), who identified two main source categories in urban areas: fossil fuel combustion and biogenic processes. In the studies of Wrocław in 2017 and 2018, biogenic emissions dominated during the growing season, whereas fossil-fuel-derived CO2 from heating, vehicle emissions, and power plants became more significant in winter. These results are consistent with global studies (e.g., Fang et al. Reference Fang, Zhou, Tans, Ciais, Steinbacher, Xu and Luan2014; Metya et al. Reference Metya, Datye, Chakraborty, Tiwari, Sarma, Bora and Gogoi2021; Vardag et al. Reference Vardag, Gerbig, Janssens-Maenhout and Levin2015), which showed that CO2 mole fractions vary on synoptic, diurnal, daily, and seasonal timescales. CO2, which accumulates near the Earth’s surface from plant and soil respiration, can be lifted by convection into higher atmospheric layers, leading to dilution and a decrease in CO2 concentrations if the air masses mix sufficiently. Recently, the also some other research encompasses studies focusing on the isotopic composition of carbon (13C and/or 14C) in atmospheric CO2 or plant materials, across different environments (urban, clean-air, vertical atmospheric column) for example in the Northern Adriatic coast of Croatia, the city of Gyeongju in South Korea, and the northern foot of the Qinling Mountains in China (Borkovic et al. Reference Borković, Krajcar Bronić, Kanduč, Sironić and Barešić2024; Lee et al. Reference Lee, Kong, Lee, Park and Kim2023; Liang et al., Reference Liang, Zhenchuan, Weijian, Wang, Feng, Lyu, Lu, Liu and Qu2024). Although these results pertain to a different time period and tree species, this research remains noteworthy and relevant to the discussion. The results of vertical measurements in 2021 in China using a hexacopter UAV found significant stratification: in summer CO2 slightly decreased with height, in early winter a peak at 100–500 m (443.4–475.7 ppm), and estimated the fossil-fuel derived CO2 contribution in winter excess to be ∼56(15)%, mostly (∼81%) from coal combustion (Liang et al. Reference Liang, Zhenchuan, Weijian, Wang, Feng, Lyu, Lu, Liu and Qu2024). The results of the analysis of the isotopic composition of atmospheric CO2 (δ13C and Δ14C), monitored over one year (2021) at three sites in Croatia—in the city of Rijeka and two rural/clean-air sites showed seasonal variation and systematically lower 14C values at the urban site compared to the clean site, indicating a fossil-fuel influence (Borkovic et al. Reference Borković, Krajcar Bronić, Kanduč, Sironić and Barešić2024). Whereas analyses of radiocarbon (14C) in deciduous tree leaves collected in Gyeongju over three years (2018, 2020 and 2021) at urban, tourist and rural locations shown an increase in Δ14C values in leaves over time (e.g., –25.1(20)‰ in 2018, –20.7(20)‰ in 2020, −18.4(30)‰ in 2021), which the authors attribute to reduced tourism/transport activity post-2019 (Lee et al. 2022). Our research shown that in Gliwice, between August 2023 and July 2024, average Δ14C values in leaves was −11.9(19)‰.
Pine needles
Figure 8 and 9 and Table 2 show the similarities and differences in 14C in the needles collected in the middle of each season between 2019 and 2024, whereas Figure 8 provides a comparison of the average F14C in the needles (without taking into account the age of the needles) and that in the atmospheric air samples.
The results showed no great difference between seasons and the ages of the needles, taking into account the uncertainty of each result (random between 0.25 and 1.1 pMC). The results show that the radiocarbon composition of pine needles was 99.80(70) pMC, which is equal to ∼ –11.9(19)‰. The most important limitation is due to the fact that there are limits in the precision of the LSC analysis of the samples originating from the contemporary environment. The homogeneity of the samples may be crucial in this kind of analysis to obtain correct results (Białobok Reference Białobok1976). For this reason, even though the AMS technics could give results with better precision, the LSC method seems to be the most adequate method in this case due to the possibility and known effect of the inhomogeneous distribution of 14C within single needles (Białobok Reference Białobok1976).
Conclusions
Monitoring atmospheric CO2 levels is essential for understanding the local carbon cycle and its environmental interactions. Given recent policy changes in the energy sector, CO2 data can offer valuable insights into how urban carbon cycles compare to those in natural environments.
Monthly measurements of CO2 mole fractions showed irregular fluctuations between 428 and 470 ppm. Based on isotopic mass balance it has been estimated that in Gliwice atmospheric air, about 11 ppm of CO2 comes from fossil fuels, which is approximately 2.5% of the total CO2. Temporal variations in the PBL are one of the factors controlling short-term fluctuations in atmospheric CO2. The study confirms that PBL height has a strong influence on CO2 concentration for most of the year, especially in summer and spring. Shallow boundary layers lead to higher CO2 levels, while deeper layers result in lower concentrations. This phenomenon was less strong in winer. Furthermore, the relationship between CO2 and PBL varies throughout the day: at midnight, CO2 and PBL trends are similar, whereas at midday, CO2 exhibits an opposite pattern to PBL height.
The results show also that the radiocarbon composition of the biosphere is different in different archives. The results do not confirm previous research by Sensuła et al. (Reference Sensuła, Michczyński, Piotrowska and Wilczyński2018, Reference Sensuła, Fagel and Michczyński2021), where a very high concentration of 14C in the needles was observed in Silesia. This research confirms that the effect of the high concentration of 14C in the needles observed ten years ago may have been due to a local effect observed over a certain period of time. It also seems that there are no other results of 14C in the foliage that could give the possibility of comparing our results to find similarities or differences with our current and previous observations. Even the concentration of radiocarbon in the needles was higher in comparison with the atmospheric air samples, the Suess effect being observed in both the air and the pine needles samples. The enrichment that was observed in the pine needles in comparison with the air samples is difficult to explain at present. We cannot exclude the impact of time resolution.
Acknowledgments
This study was supported by an EU grant for Silesia 2021–2027, within the MONCO2 project (Modern methods of monitoring the level and isotopic composition of atmospheric CO2, no. FESL.10.25-IZ.01-06C9/23-00) Fundusz na Rzecz Sprawiedliwej Transformacji FSD – 10.25 Rozwój kształcenia wyższego zorientowanego na potrzeby zielonej gospodarki Fundusze Europejskie dla Śląskiego 2021–2027 (PM: Barbara Sensuła).
Appendix
Overview of the monthly data of CO 2 levels, in Gliwice atmospheric air with monthly resolution. Results cover whole day and selected period of time since 12-17.00.

Overview of the monthly data of 14C and CO2 levels, in Jungfraujoch and in Gliwice with monthly resolution. Data for Gliwice cover whole day and selected period of time since 12:00–17:00, and fossil fuel fraction including percentage of fossil fuel fraction


 Open access