


1. Introduction
In the fallout of the 11 March 2011 Fukushima nuclear catastrophe in Japan, Germans held a vigorous debate about whether to keep their own nuclear power plants. At first, Chancellor Angela Merkel maintained her earlier position that nuclear energy was still required as a “bridging technology” and, following a safety review of those plants currently running, could continue being used. This was initially supported by other leading politicians from Merkel’s Christian Democratic Party (CDU) and some energy companies owning nuclear power plants. However, the Minister for the Environment, Norbert Röttgen, questioned his government’s position, arguing that German nuclear power policy should be put to the test. Opposition actors voiced more far-reaching concerns, arguing for a phase-out of nuclear energy and an immediate shutdown of the oldest nuclear reactors. The discourse shifted as these claims gained support not only from environmental groups and other opposition actors but also, increasingly, from politicians from the governing parties. The debate concluded less than four months after Fukushima in a dramatic “policy pivot” with parliament’s decision to phase out nuclear energy use by 2022.
This policy pivot has proven puzzling. Previous research has shown that it cannot be explained by traditional political science theories about political economy, party politics, or power shifts (Haunss et al., Reference Haunss, Dietz and Nullmeier2013; Rinscheid, Reference Rinscheid2015). What did shift in the intervening months was the discourse. Understanding the development of the political discourse is therefore a promising strategy for explaining the policy outcome. However, modeling the complex discursive interactions among a large number of actors typical of many political debates represents a conceptual and methodological challenge.
We argue that to understand how German nuclear policy pivoted despite very little inconsistency in politicians’ statements, we need to approach and model this political discourse as a multimodal, dynamic network. First, politicians—like any actor—operate in a complex, multimodal, and multilevel space (Hollway et al., Reference Hollway, Lomi, Pallotti and Stadtfeld2017). A multimodal network is a network in which ties are defined as occurring between multiple types of nodes, such as networks of women’s participation in events, directors’ affiliations to company boards, or countries’ ratifications of treaties (Knoke et al., Reference Knoke, Diani, Hollway and Christopoulos2021). Such networks may also be multilevel (Wang et al., Reference Wang, Robins, Pattison and Lazega2013), multiplex (Snijders et al., Reference Snijders, Lomi and Torló2013), or mixed-mode (Dabkowski et al., Reference Dabkowski, Fan and Breiger2020), with multiple, interlocking networks between and among the multiple node sets. Our case is a simple, two-mode network of political actors’ supporting claims circulating in the debate (Knoke et al., Reference Knoke, Diani, Hollway and Christopoulos2021; Leifeld, Reference Leifeld2017; Leifeld & Haunss, Reference Leifeld and Haunss2012). Actors’ decisions to make some claims and not others change the space or topography in which actors make subsequent claims. Second, it is important to approach how this multimodal space changes in the smallest reasonable unit of change possible: daily reports of politicians’ claims. We investigate a sequence of network (interdependent) events to trace as closely as possible the temporal dependencies as well as the spatial dependencies (Hollway, Reference Hollway2021). Periodization helps us understand whether and when different mechanisms apply across the entire discursive episode.
To integrate these two moves, we introduce a multimodal extension of the dynamic actor network event model (DyNAMs; Stadtfeld, Reference Stadtfeld2012; Stadtfeld et al., Reference Stadtfeld, Hollway and Block2017b; Stadtfeld & Block, Reference Stadtfeld and Block2017). This enables us to model how this two-mode network evolves as a function of not only nodal attributes but also the changing structure of support for the claims present in the discourse. With this, we seek to answer two related questions: (1) which actors support claims more frequently, and (2) which claims do they support? The first question engages the broader political question of who gets to speak in public political discourse. Are actors in a position of power or holding official posts asked for their opinion more often? Or do the media return to those who are already visible in the debate through repeated appearances? The second question is a more typical network question, explaining the choice of ties in particular structural configurations. Are actors likely to support claims that are popular, pitched by the powerful, others in their party, or that attract cross-party support? We argue that to understand how claim support shifts in our case, we must answer both questions.
This paper makes several contributions to the literature on political discourse and discourse network dynamics. The first, main contribution is the identification of a set of micro-mechanisms that may drive political discourse dynamics. Many of these are familiar network effects. However, while homophily effects typically play a major role in specifying one-mode network models, they are often overlooked when it comes to identifying mechanisms in two-mode networks. We therefore extend the vocabulary for nodal covariates in actor-oriented models (Snijders et al., Reference Snijders, van de Bunt and Steglich2010), ego and alter, by formalizing the “tertius” group of network effects. Tertius effects summarize the attributes of nodes tied to a considered choice, thereby capturing how a node’s attractiveness as a choice is inherited from its associated nodes. The function summarizing these attributes can be defined arbitrarily, and we illustrate several that may be of regular interest. These effects are of particular utility to multimodal network analysis as they are capturing notions of indirect or associated attributes—for example how an actor might choose to support a claim based on the attributes of those already supporting that claim—but can be applied too in the context of one-mode network analysis. These and other micro-mechanisms help to explain a policy pivot in which government actors have abandoned their initial position and in which the debate ends with a new cross-party consensus.
The second contribution of this paper is to introduce multimodal DyNAMs and demonstrate how they can be used to fruitfully model political discourse networks. Multimodal DyNAMs offer ways to model the rate and choice of network events between two different node sets. We investigate the particularly rich and dynamic case of Germany’s nuclear policy pivot to illustrate how a fine-grained model can provide substantial insights. Although most contemporary work on discourse networks and on this empirical case seeks only to describe its structure (Kaiser et al., Reference Kaiser, Rhomberg, Maireder and Schlögl2016), we find evidence for a variety of different mechanisms across several phases of the debate that can explain the dramatic nuclear policy change in Germany after Fukushima. Prominent mechanisms are the increased rate of participation in the discourse for powerful actors and a widespread tendency to support claims that have already found support by cross-party coalitions. Multimodal DyNAMs thus allow us to identify general mechanisms for how and when political discourses change.
In the next section, we outline literature on political discourse and discourse networks, and develop a set of propositions about micro-level mechanisms that may govern the interactions between political actors in a public political discourse about a controversial issue. We then introduce and justify the case, multimodal DyNAMs, and tertius effects that are prominent features of the paper. The results are presented in the fourth section, which includes a discussion of how the periodization was evaluated. We conclude by pointing to various directions for future research our results provoke.
2. Understanding claim support
Political discourse can be understood as strategic political communication (Kriesi, Reference Kriesi2004) in which actors try to advance their position by making claims and contesting others. Political discourse evolves as some claims grow in attention or favor and others recede. Research on political discourse has traditionally focused either on the attributes of claims or the speakers that support them to explain why some claims prevail and not others.
Within the first perspective, Argumentation Theory has identified numerous schemes to help classify the kinds of arguments used in political statements that may influence a claim’s potential (O’Keefe & Jackson, Reference O’Keefe and Jackson1995; Steffensmeier & Schenck-Hamlin, Reference Steffensmeier and Schenck-Hamlin2008; Walton, Reference Walton2006). For example, an “argument from popular opinion” is an argumentation scheme that draws on supposedly broad popular support to boost a claim, whereas an “argument from analogy” draws on supposed similarity to support a claim. But these analytical distinctions do not necessarily explain which will be more successful in a political debate. Steenbergen et al.’s (Reference Steenbergen, Bächtiger, Spörndli and Steiner2003) “Discourse Quality Index” (DQI) starts from a normative perspective. It builds on Habermas’ (Reference Habermas1995) ideal of the “unforced force of the better argument” and presents a set of criteria to measure the discursive quality of arguments put forward in political discourse. The DQI thus provides a measurement for a normatively better argument but, again, arguments with a higher quality do not necessarily win a debate.
Others have studied the properties and abilities of those espousing different claims to explain which claim wins. Discursive Power summarizes a number of these factors to measure “the influence of different types of contributors to communication spaces” (Jungherr et al., Reference Jungherr, Posegga and An2019, p. 408). It highlights structural features of the discourse arena and individual characteristics of the actors involved in a debate that may increase the influence of claims made by some actors and not others. Especially prominent here is the role of different kinds of media and the chances of actors to gain access to media reporting.
Both literatures on discursive quality and discursive power recognize that political discourse is inherently relational (or dialogical in its simplest form), yet rarely model such relationality explicitly. For example, linguistic studies of metaphorical and rhetorical form focus on the direct interaction between speaker and audience without formalizing the broader discursive and temporal context (Chilton, Reference Chilton2004; Lakoff & Johnson, Reference Lakoff and Johnson2003).
By contrast, discourse network analysis explicitly focuses on the relational context in which discursive mechanisms like discursive quality and power exist. We build on existing discourse network analysis studies which have introduced discursive macro-mechanisms like cohesion (Černý & Ocelík, Reference Černý and Ocelík2020; Leifeld & Haunss, Reference Leifeld and Haunss2012) or polarization (Leifeld, Reference Leifeld2016). These macro-mechanisms help to explain success or failure of discourse coalitions and the broad development of political discourses over time, but they are too coarse to analyze the discursive behavior of individuals. Moreover, political discourse network analysis has been mostly restricted to static or cross-sectional studies. Change over time has been addressed only by comparing aggregated slices of discourse networks for given time periods (e.g. Leifeld & Haunss, Reference Leifeld and Haunss2012; Leifeld, Reference Leifeld2013). While this work recognizes certain macro processes, it does not model how micro-mechanisms generate these macro patterns (Stadtfeld and Amati, Reference Kriesi2021).
In this paper, we argue that studies will profit from conceptualizing political discourse as a dynamic, two-mode network of speakers and claims. In such a multimodal (and sometimes multilevel) social space (Hollway et al., Reference Hollway, Lomi, Pallotti and Stadtfeld2017; Knoke et al., Reference Knoke, Diani, Hollway and Christopoulos2021), speakers support (and contest) claims cognizant of which other actors are supporting/contesting claims and when. As such, we are both tackling the multimodal and dynamic aspects of political discourse.
2.1. Propositions for mechanisms governing political discourse
As the existing literature tends to concentrate on identifying macro-level mechanisms, we introduce several new micro-level structural effects for explaining the evolution of political discourse. On a conceptual level (and in the model), we can distinguish between mechanisms for explaining the temporal frequency or rate of claims-making (which actors speak more frequently?) and the choice of claims (which claims do they support?).
Regarding the rate, we propose four plausible mechanisms. Since the rate of activity in public political discourse depends on how much facetime media are willing to give each actor, we cast our mechanisms in terms of the attributes and structural configurations that drive the media to solicit claims from political actors rather than what drives actors to offer their opinions.
The first mechanism concerns the previous activity and visibility of actors. Media research has shown that some politicians receive much more media coverage than others (Vos, Reference Vos2014). In part, this is a rich-get-richer effect, as those actors who regularly voice their opinions on political events will be more visible and continue to attract attention from media and from their readers. We thus expect that previous claims-making activity should be a good indicator for future activity.
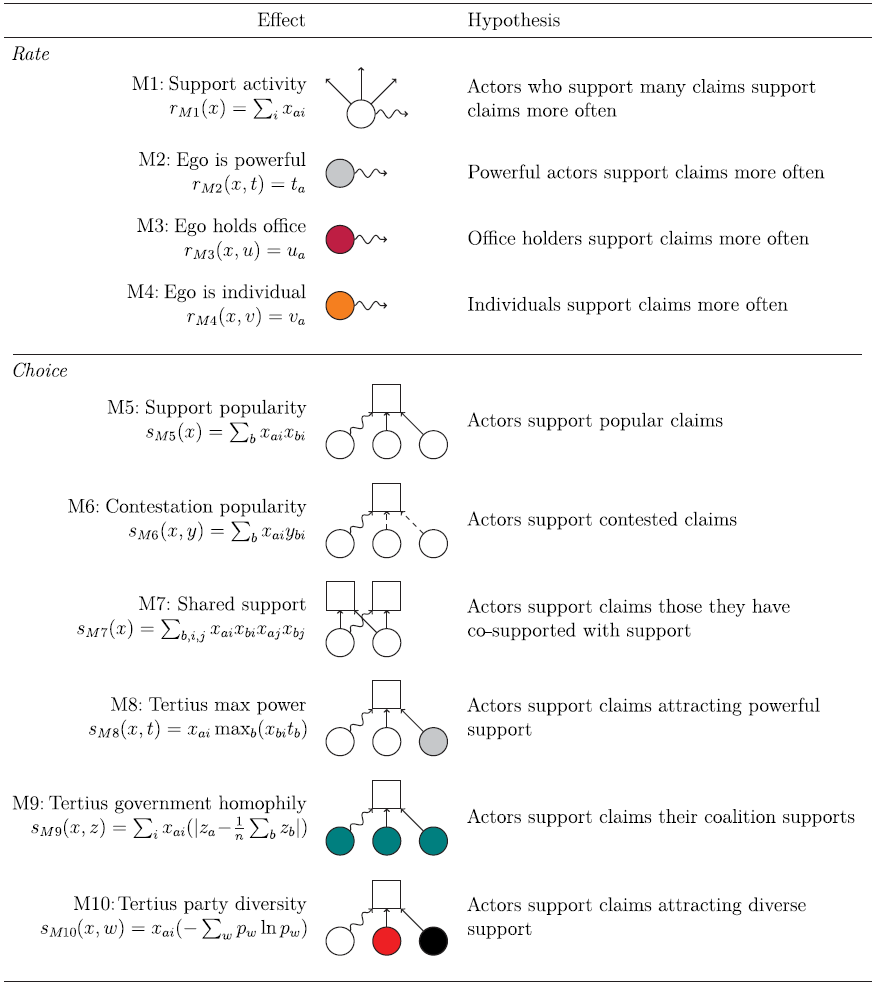
M1: Claim support activity—Actors who have made many claims support claims more often.
Studies investigating the link between media coverage, power, and political institutions show that individuals who hold office or other roles of power in political organizations are more often interviewed and quoted in the media (Vos & Van Aelst, Reference Vos and Van Aelst2018). Statements of officeholders (e.g. ministers or heads of state government) or otherwise powerful actors (e.g. leaders of industry associations) are also presumed to be more consequential. We therefore assume that their statements will be more frequently reported.
M2: Ego is powerful—Powerful actors are reported supporting claims more often.
M3: Ego holds office—Officeholders are reported supporting claims more often.
Political actors or speakers can be individual or collective, with individuals sometimes asked to speak on behalf of a collective. The literature on the personalization of politics (McAllister, Reference McAllister2007) highlights how the media seek to personalize politics wherever possible, soliciting individual opinions, potentially fragmenting organizational positions to imbue discourse with more dynamism. Organizations are also often more conservative and careful about giving statements to the media. Based on these two mechanisms together, we therefore expect individuals to produce more claims in political discourse:
M4: Ego is individual—Individual actors are reported supporting claims more often.
We now come to actors’ choices of which claims to support. In the networks literature, we generally assume that ties are interdependent; ties are often correlated with the presence or absence of other ties in their local environment. To use the choice utility language typical of one-mode actor-oriented network models, an “ego” might choose a specific “alter” because they are a popular choice of others in the network or because an existing friend has already signaled that they have chosen that alter as a friend. In this latter configuration, in which the considered tie would close a transitive triangle, the existing friend is often termed “tertius” in the literature (e.g. Collins-Dogrul, Reference Collins-Dogrul2012; Obstfeld, Reference Obstfeld2005; Obstfeld et al., Reference Obstfeld, Borgatti and Davis2014). We generalize this terminology to the case of two-mode networks: here the ego (actor) still makes a tie choice among alters, but while the alters are all among the other node set, the tertius (or tertii) are all among the original (actors’) node set. As with the original one-mode example above, the existing choices from all relevant “tertii” provide information or signals to ego about the attractiveness of each alter. Since there might be many such tertii for each choice of alter, there are a number of ways such a category of effects might be expressed.
We start with a number of typical network effects that should influence actors’ claims-making strategies and ultimately the adoption of specific claims. The most basic of these network effects is popularity. Once a claim has reached a certain level of attention, it is more likely to be picked up by other actors. We thus expect to see trending patterns like those known from Twitter analyses also in political discourse more generally. Our first network assumption therefore is:
M5: Support popularity—Actors support more popular claims.
Popular claims may also attract contestation, and contested claims may attract more support in defense. A discourse coalition will likely attack the core claims of an opposing coalition to prevent these claims from becoming hegemonic. This then can lead to even more support by the coalition supporting this claim. The claim contestation popularity mechanism thus extends the popularity mechanism to conflictual claims:
M6: Contestation popularity—Actors support more contested claims.
Finally, there is also an expectation of closure. Although this is represented in triadic configurations in a one-mode network, in our two-mode discourse network these are given by a four-path (i.e. closed 4paths in our bipartite network; Opsahl, Reference Opsahl2013). Such a configuration is common where actors that are like-minded in their support of one claim are likely to be like-minded in their support (or not) of other claims. In other words, this is another expression of correlated choices.
M7: Shared support—Actors support claims that other actors with whom they share the support of other claims support
Apart from structural network characteristics, the perceived and formal power of actors may also influence the choice of claims. First, similarly to how powerful individuals and those holding organizational office might be called upon to make media statements more often (M2 and M3), we also assume that claims supported by actors with higher discursive power (Jungherr et al., Reference Jungherr, Posegga and An2019, p. 408) will be more popular than those supported only by rank and file politicians. But is it the total “power” (however defined) of all those supporting a claim that makes it attractive? Is it the average “power”? We argue that the most important signal is the maximum “power” of any claim supporter. That is, if the German chancellor Angela Merkel supports a particular claim, this ought to drive this claim’s attractiveness, regardless of how powerful other supporters of that claim might be. This is prima facie plausible because it might often be irrelevant to backbenchers whether other backbenchers support a claim or not, only that party leaders do or not. Our first expectation about which claims political actors support is thus:
M8: Tertius max power—Actors support claims supported by powerful actors.
Second, actors may choose to support claims based on the coalitional attributes of others supporting that claim. Theories of discourse and advocacy coalitions expect that actors will more likely support claims from other actors with whom they share convictions and strategic or tactical goals (Hajer, Reference Hajer1995; Sabatier & Weible, Reference Sabatier, Weible and Sabatier2007). Political actors may not wish to break ranks from the committed claims of others with whom they are allied, and there may be incentives to contradict central claims of the opposing coalition. For example, politicians from parties in opposition may avoid supporting claims supported by governmental actors and instead be more attracted to those that are not supported by governmental actors. We therefore explore the effect of coalitional (government or opposition) homophily between the ego actor and tertius actors:
M9: Tertius government homophily—Actors support claims supported by members from their camp.
Lastly, while the two homophily mechanisms cement political divisions and existing camps, the kind of discursive development observed in our case represents a process of political change in which original political positions are shed and a new consensus is formed. We argue that politicians are also attentive to areas where there seems to be bipartisan agreement, and speculate that politicians in some political cultures are (still) quick to demonstrate that they recognize a good argument when it is signaled to them (by a varied group of other politicians). Coupling together such an effect with the previous homophily effects can induce phase transitions in support where it takes just a few bold entrepreneurs to change the calculus such that a swarm of new support for a claim results. Diversity scores represent another way to summarize the attributes of actors at distance two:
M10: Tertius party diversity—Actors support claims supported by a diverse set of parties.
These hypotheses are summarized again in Table 2.
3. Methodology
3.1. The German nuclear energy debate case
We test these mechanisms within the development of the political discourse about the future of nuclear energy in Germany after the nuclear catastrophe in Fukushima in 2011. This case is attractive for several reasons. First, it is a great case of a policy pivot. Complete about-turns in policy are rare in politics, but unexpected and consequential when they happen. This unexpectedness demands further theoretical attention to understand their unusual dynamics. Cases like these are also very consequential, as reversing major governmental policy can cost the government financially, or at the polls.
Second, the debate is directly linked to tangible policy outcomes. Less than six months earlier, in September 2010, the conservative government had contentiously reversed the previous red-green government’s policy to phase out nuclear power by 2022 and instead extend German nuclear reactors’ running time, only to commit a mere four months after Fukushima to a politically and economically costly reversal of this recently established policy. Since this 180° change can only be explained as the result of the public debate after Fukushima (Haunss et al., Reference Haunss, Dietz and Nullmeier2013), we must look at how this debate developed. Merkel’s famous quote that “Fukushima changed my attitude towards nuclear energy” (9 June 2011) should be understood not as an individual change of mind but as the result of a political debate.
Third, the debate was intense and high profile. This provides a comparatively high number of events to model. It also provides some confidence that any actors that would have wanted to claim something publicly would have received at least one chance, increasing the representativeness of the discourse. This debate was among the most reported in the German media during this time.
Lastly, the debate was also relatively short. Just four months separated the nuclear meltdown in the Japanese nuclear power plant in Fukushima on 11 March 2011 and the decision by the German parliament on 30 June 2011 to stop using nuclear energy by the end of the year 2022. The debate’s short timeframe means we can exclude some more challenging elements common to longer debates, such as changes in information, interests, institutions, preferences or party membership, or control of government.
The empirical data were gathered from newspaper articles that mentioned nuclear energy between 11 March and 5 July 2011 in two German, quality newspapers (the center-left Süddeutsche Zeitung and conservative Die Welt). These articles were manually annotated by adapting the political claims analysis framework (Koopmans & Statham, Reference Koopmans and Statham1999) to identify actors in the public debate and their claims about nuclear energy in Germany in the relevant time span. In the 398 relevant articles, 1164 instances of claims-making were identified. The dataset thus comprehensively maps the relevant actors and their positions. A more detailed description of the dataset and annotation procedure is provided in the appendix.
Claims and actors per day. Green bars represent the number of claims on each day in the observation period. The orange line plots the 7 day rolling average of distinct actors present in the discourse. Dotted vertical lines indicate the four sub-periods of the analysis.

With the data on claims and actors, the political discourse about the phase-out of nuclear energy use in Germany can be analyzed as a discourse network (Leifeld & Haunss, Reference Leifeld and Haunss2012). A more detailed analysis of the discourse can be found in Haunss et al. (Reference Haunss, Dietz and Nullmeier2013) and in Rinscheid (Reference Rinscheid2015). We only provide a brief description of the debate for readers unfamiliar with the case to get an impression of the actor constellation and the conflict lines present in the debate.
The intensity of the debate varies over time. Figure 1 shows that the debate was most intense in the week immediately following the nuclear catastrophe in Fukushima and in the last week of May. This second peak is the result of an intensifying debate before the party convention of the then-governing conservative party CDU. In between these two peaks and after the second and up to the final policy change, attention continued and days without any claims were rare.
For our analysis, we divide the study period into four sub-periods, reflecting the punctuation of several important events in the debate. We subdivide our data temporally because we expect different mechanisms to operate at different stages of the debate (Amati et al., Reference Amati, Lomi and Mascia2019). Table 1 lists the number of active speakers and claims in each period. The first period (11–16 March) covers the initial peak of the debate and the Government’s decision of a so-called “Moratorium” that included the temporary shutdown of the eight oldest nuclear power plants in Germany until their security was reaffirmed. The second period (17 March—8 April) covers the following intense phase of the political debate and ends with the decision of the German Association of Energy and Water Industries, the lobby organization representing the energy sector, to support the phase-out of nuclear energy use. The third period runs from 9 April until 31 May, when the party convention of the leading governing party CDU decided to support a phase-out decision. The final period covers the remaining month until the German Bundestag decided on 30 June to phase out nuclear energy use in Germany by the end of 2022.
Figure 2 shows two time slices from the discourse during the first and second period from Figure 1. The left panel visualizes the discourse constellation during the first three days of the debate. Core actors from the governing party coalition of CDU, CSU, and FDP (Angela Merkel, Markus Söder, Guido Westerwelle) proposed a review of safety measures in German nuclear power plants as a consequence of the catastrophe in Japan. Actors from the oppositional parties SPD, Greens, and Left immediately demanded a phase-out of nuclear energy use and the immediate shutdown of the oldest nuclear power plants. A phase-out is contested by government actors. Importantly, two members of the governing parties, minister for environment Norbert Röttgen and CSU member Josef Göppel, already questioned their own government’s nuclear energy policy demanding it be put to the test.
Number of speakers and claims in each period

Note: Political actor is here defined as a member of a political party.
Selected time slices (11–13.3.2011, and 23.3–8.4.2011) in the discourse. Circles indicate actors and gray squares represent claims. Political actors from the governing coalition are colored in blue, oppositional actors are colored in red. Claims from the second time slice that were already present in the first slice are highlighted with a darker shade of gray. Nodes are sized according to their eigenvector centrality. Solid lines represent claim support and dashed lines indicate claim contestation. Edge width reflects the number of recurring claims from the same actor in the selected time period.
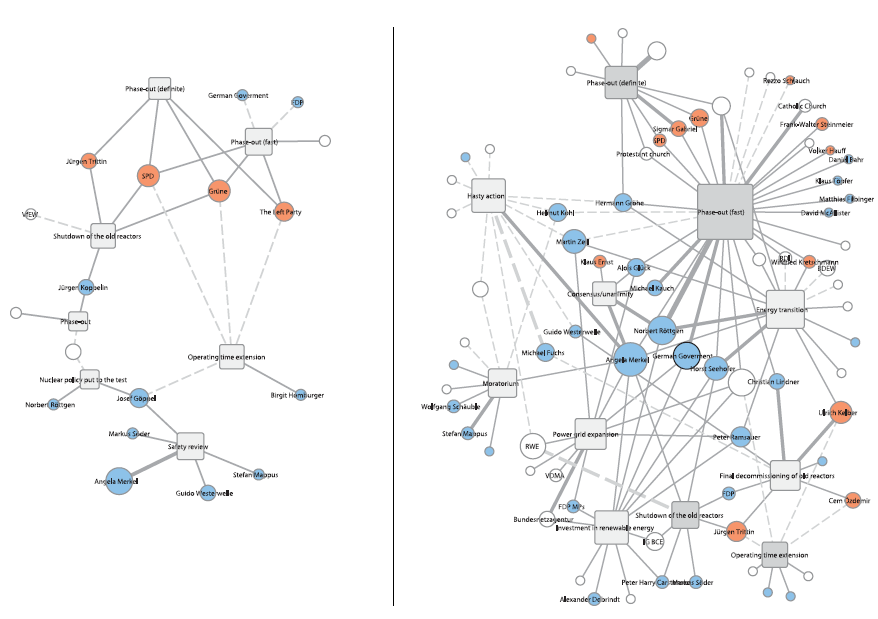
The right panel depicts the aggregated discourse between 23 March and 8 April and highlights the dramatic change in the discourse between these two periods. Core government actors now support the quick phase-out claim initially made by the opposition parties. They also make several claims about extending renewable energy production, thus discussing already in this early phase a future without nuclear power plants. Meanwhile, oppositional actors support a quick phase-out and try to make a phase-out decision irreversible. Nuclear energy supporters are only at the discursive margins in two unconnected clusters, demanding either an extension of reactor operating time or warning against “hasty actions”—a rather defensive claim against a looming phase-out decision.
These two time slices demonstrate the debate’s dramatic shift and its role in the policy pivot that followed.
For this paper, we focus on modeling particular ties of particular actors as the dependent events, with the rest of the network serving as context for those actions. First, we concentrate only on what we call “formal political actors”: those acting publicly in the formal, national political system. This includes individual politicians holding elected office in national government at the time, but also formal political offices such as ministries and political parties.
Second, we concentrate only on their statements that support conceptual claims. This focuses the model on the one hand on statements advocating conceptual claims. While coevolving signed events can be modeled jointly with DyNAMs (Hollway, Reference Hollway2020), claim contestation represents less than a quarter of all the statements made in the data and is likely motivated by quite different mechanisms. On the other hand, we also focus on statements supporting currently circulating claims and not the statements that introduced them, that is the second and further positive associations to claims. Again, we assume that the mechanisms behind claim introduction and claim support may differ (Hollway et al., Reference Hollway, Morin and Pauwelyn2020), and since the swing in discursive support is evidently responsible for the policy pivot, this is what we focus on.
We checked for claims-making consistency to see whether individual actors have explicitly switched their position during the debate. Among the 657 claims from politicians (both supportive and contesting), we record only 11 cases of claims-making inconsistency, so we see actors explicitly contradicting their earlier claims only in 1.6% of all events from these actors. This low level of self-contradiction does not mean that politicians did not change their position, they did. Many de facto changed from being pro nuclear energy at the start of the debate to supporting nuclear exit in the end. But actors who change their position almost always do so by adopting new claims and not by explicitly contradicting their earlier statements. This is perhaps not all that surprising. Politicians are under no incentive to reveal inconsistencies in their opinions, and in a multimodal discursive space, there is ample room to create or co-opt some claim that better reflects a new position without explicitly disavowing the old. Indeed, the famous quote from Angela Merkel, “Fukushima changed my attitude toward nuclear energy,” is famous because it is such an exceptional admission.
The result is a list of 569 support claims from formal political actors; 104 events in the first period, 185 in the second, 200 in the third, and 80 in the final period (see Table 1 for details). Although we focus on formal political actors’ support for claims, all information from the original dataset is used in the model. This includes statements from other actors, such as companies and NGOs, and the claim contestation and introduction from all actors. This is important for specifying the context in which our main focus, formal political actors’ claim support, occurs. For example, a claim’s popularity can be indicated by any actor’s support. Note also that despite separating our study period into four sub-periods, DyNAMs calculate statistics based on all the data available, including those related to events in previous sub-periods. This dynamic political discourse poses a significant modeling challenge. We employ dynamic network actor models for this purpose.
3.2. Two-mode DyNAMs
This paper introduces and applies dynamic network actor models (DyNAMs: Stadtfeld et al., Reference Stadtfeld, Hollway and Block2017b) for two-mode networks. DyNAMs are actor-oriented models for network events (see Stadtfeld et al., Reference Stadtfeld, Hollway and Block2017a) consisting of two components: a rate function that models the waiting time until an actor sends an event, operating as a Poisson process, and a multinomial choice function that governs to which recipient it sends that event (see also Equation (1)). The product of these two functions produces an overall waiting time that is similar to the relational event model (REM; Butts, Reference Butts2008), but the characteristic decomposition into separate functions is ideal for our purposes here: we wish to specify the mechanisms governing when political actors support claims differently from those governing which claims actors support. For example, holding an office may make it more likely that the media may approach an actor, affecting their rate of claims as seen in our newspaper events, but this should not affect which claims they make when approached.
In principle, a two-mode DyNAM represents a relatively straightforward extension of one-mode, directed DyNAMs, as presented in Stadtfeld & Block (Reference Stadtfeld and Block2017; see also Stadtfeld, Reference Stadtfeld2012; Perry & Wolfe, Reference Perry and Wolfe2013; Amati et al., Reference Amati, Lomi and Mascia2019) for studying interpersonal events. The two-mode version is established simply by allowing ties only between senders and receivers from different sets of nodes, a set of actors $a\in A$
and a set of claims
$a\in A$
and a set of claims $i\in I$
, respectively. In goldfish (Stadtfeld & Hollway, Reference Stadtfeld and Hollway2022), a package for estimating DyNAMs and REMs, restricted agency and opportunity sets can be specified flexibly, but two-mode restrictions now work automatically. The result is a model in which the overall waiting time until an actor a makes a claim i,
$i\in I$
, respectively. In goldfish (Stadtfeld & Hollway, Reference Stadtfeld and Hollway2022), a package for estimating DyNAMs and REMs, restricted agency and opportunity sets can be specified flexibly, but two-mode restrictions now work automatically. The result is a model in which the overall waiting time until an actor a makes a claim i, $\lambda _{ai}$
, depends on the process state x and parameters in the rate function, θ, and choice function, β, that weight aspects of the process state as expressed in statistics that reflect certain configurations, r and s respectively:
$\lambda _{ai}$
, depends on the process state x and parameters in the rate function, θ, and choice function, β, that weight aspects of the process state as expressed in statistics that reflect certain configurations, r and s respectively:
 \begin{equation}\lambda _{ai}^{DyNAM} = \left( {x,\,\theta ,\,\beta ,\,r,\,s,\,a \in A,\,i \in I} \right) = \underbrace {\exp \left( {\theta r\left( {x,\,a} \right)} \right)}_{Rate}\underbrace {\frac{{\exp \,\left( {\beta s\left( {x,\,a,\,i} \right)} \right)}}{{\sum\nolimits_{k \in I} {\exp \,\left( {\beta s\left( {x,\,a,\,k} \right)} \right)} }}}_{Choice}\end{equation}
Each component of the model, rate and choice, can thus be specified differently, which is typical among actor-oriented models as similar statistics can result in quite different interpretations depending on whether it is used in the rate or choice component. The parameters are estimated by maximum likelihood, and right censoring is taken into account as described in Stadtfeld and Block (Reference Stadtfeld and Block2017).Footnote 1 To ensure that the model estimates choice utility only among those claims that are already in circulation, we constrain the choice set at each event tick to only those that had already been “introduced.” This operates similarly to composition change in SAOMs. All actors could potentially be active in every period though; there was no composition change on the actor side.
3.3. Tertius and other effects for two-mode networks
When selecting statistics to specify a model, some effects common to statistical network modeling, such as outdegree or indegree statistics, can be translated to two-mode constructions unproblematically. We employ an outdegree effect to capture rich-get-richer endogenous effects on actors supporting a(ny) claims to test for M1, and indegree effects on the support and contestation networks to test M5 and M6, respectively, as shown in Table 2 below.
Table of effects
Note: choice equations represent realized statistics. Statistic subscripts relate to the mechanisms introduced in the previous section. Political actors are circles, claims are squares, new/considered ties are in snake form, whereas existing support and contestation ties are in solid and dashed straight lines, respectively.
Others such as reciprocity and transitivity are irrelevant in a network in which ties are undirected or unallowed within node sets. Still, analogous statistics can be calculated. For example, rather than ties closing two paths (transitivity), we can calculate those ties that would close three paths instead, variably called in the literature four cycles (Robins & Alexander, Reference Robins and Alexander2004), reinforcement, equivalence, or shared choices. We use such a shared choices effect to test for M7.
Effects that relate to ego’s attributes can be ported from a one-mode system unproblematically. Mechanisms M2 (actor power), M3 (officeholders), and M4 (individuals) are operationalized as the ego effect of the respective actor attribute in the rate model. Individual and officeholder are binary attributes, actor power ranges from 0 to 2. It should be noted here that we count ministers and the chancellor for the M4 (individual) effect not as individuals but as organizational actors, since they represent with their statements usually their respective office.
Another set of effects requiring adaptation is those associated with alter’s attributes. In one-mode networks, attributes are defined on the same node set, allowing various attribute mixes to be explored: effects on the sender sending (“ego” in actor-oriented parlance), receiver receiving (“alter”), and senders choosing receivers (homophily and related mechanisms). But in two-mode networks, different node sets rarely see the same attributes coded. Homophily is therefore only operationalizable at a path distance of two, for example $a\rightarrow i\leftarrow b$
where
$a\rightarrow i\leftarrow b$
where $a, b\in A$
and
$a, b\in A$
and $i\in I$
.
$i\in I$
.
We use the term “tertius” (e.g. Obstfeld, Reference Obstfeld2005) as a generalizable extension to the ego/alter terminology of actor-oriented models when referring to the attributes of third nodes. Tertius effects summarize attributes of third nodes to any dyad, so are also of interest in one- or even three-mode networks. In a two-mode case, tertii will be of the same node set as ego and of a different node set to alter.
Since there may be plural tertii associated with an alter, some summarizing function must be chosen to convert this set of observations to a single statistic (similar to an alter effect) that can then be weighted by β. This summarizing function may be arbitrarily defined, but we consider some common choices to be mean, min, max, or sum. In this paper, we take the max of the level of power for M8,Footnote 2 and the Shannon Index of party affiliation to capture the diversity for M10 (see Table 2). Finally, we measure the difference between ego’s affiliation to the government (binary) and the mean affiliation of tertii to test M9.
We identify when and how these mechanisms apply during the political discourse by testing for them across our four periods as explained in Section 3.1. Note that the periodization affects only the window of outcome events and statistics upon which parameters are estimated; the statistics themselves however are still calculated from the cumulated network to that point.
4. Rate and choice results over periods
We fitted DyNAMs, both the rate and choice submodels, to four periods of claim support events using the R package goldfish version 1.5.2 (Stadtfeld & Hollway, Reference Stadtfeld and Hollway2022). All models converged to conventional standards. We tested for outliers in each submodel and in each period using a non-linear Hampel filter or identifier (Hampel, Reference Hampel1974) on the log likelihood trace returned after estimating the models (see also Hollway, Reference Hollway2020). The idea is that individual events that were particularly unlikely under the model could provide clues as to where the model can be improved. We used a default of a window length of half the events in the period and used Pearson et al.’s (Reference Pearson, Neuvo, Astola and Gabbouj2016) rule of three times the median absolute deviation from the (moving) median to establish outliers and found none at this sensitivity. This suggests there are no obvious candidates for omitted variables to improve the model as fitted to this data.Footnote 3
We also checked our periodization. Although the periodization was based on substantive knowledge, we tested for one or more changepoints in the mean of the log likelihood trace returned after fitting each model. The idea is that if there are significant changes in the average likelihood of subsets of events, then this could be evidence of time heterogeneity (Lospinoso et al., Reference Lospinoso, Schweinberger, Snijders and Ripley2011) or subregimes within the model. We used the PELT method in the changepoint package in R to identify these changepoints (Killick et al. Reference Killick, Fearnhead and Eckley2012), with a minimum segment length equal to the maximum number of tied events in the data. There were no changepoints identified within any of our main results, suggesting that no further subdivision is necessary. To see whether a different periodization would be better, we also check for changepoints in rate and choice DyNAMs fitted to the entire event sequence. A single changepoint was found in the choice model quite early on (14 March), whereas five changepoints were identified later in the study period in the rate model (17 April, 6, 9, and 29/30 March, and 9 June). These dates are not too dissimilar from those chosen empirically. While the latter results might suggest that further periods could lead to more accurately estimating the weight given to various mechanisms at the time, the lack of further changepoints within our four periods and the differences in means among the rate regimes being quite low (SD = 1.37) suggests that the periodization chosen is as useful as one can get from this data.
Below, we describe the main results obtained, examining for each period first the rate submodel and then the choice submodel. The results for the rate submodel are shown in the upper part of Table 3, and the results for the choice submodel are shown in the lower part.
Results
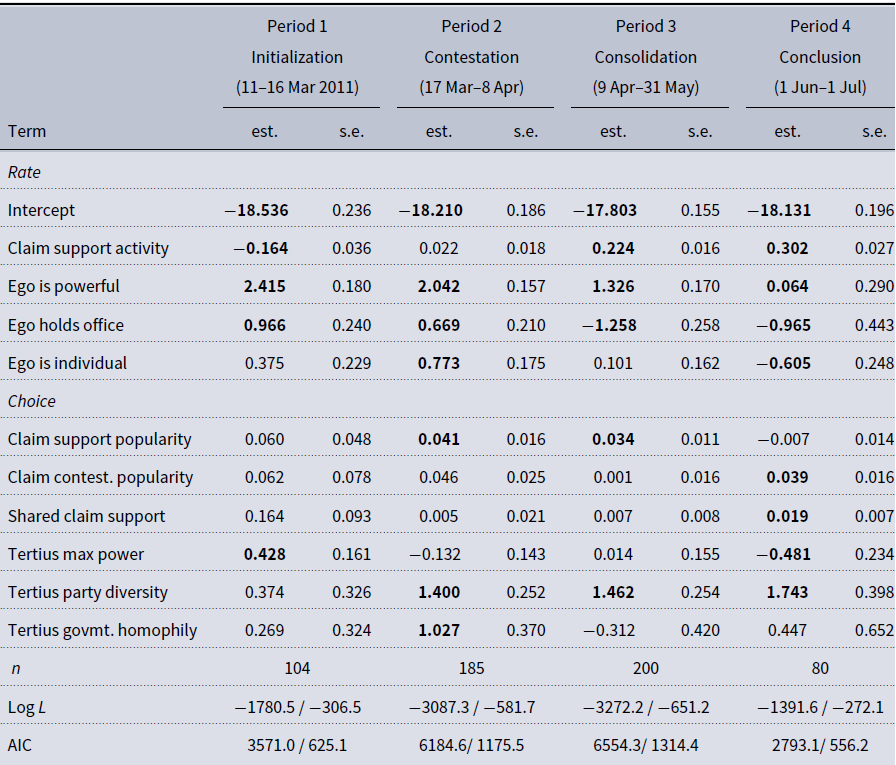
In period 1, we see an initialization phase of the discourse in which power plays an important role. In the rate model, the negative claim support activity suggests the media is indeed surveying the positions of many actors and is less interested in actors whose claims have already been reported within this brief period. The media especially seeks the opinions of those who are powerful or hold political office. While these two groups partly overlap, office-holding and power are only moderately correlated (r = 0.455) and represent different types of status. In the choice model in period 1, the only statistically significant effect is tertius’ power. That is, politicians generally support claims that at least one powerful actor has already supported. Since this effect is specified as the maximum power of all tertii (actors already associated with a particular claim choice), and since the popularity effect is not significant, this suggests politicians prefer claims of the most powerful actors to those that receive support from many actors. These results together indicate that powerful actors set the initial topography of the debate. This is not just Merkel, but also leading politicians from other parties and prominent figures like the Minister for Environment Norbert Röttgen or the Bavarian State Minister for Environment and Health Markus Söder who seized the opportunity to advance their dissenting agenda.
In period 2, a contestation phase, the main discursive battles are fought on the future use of nuclear energy in Germany. The media begins mixing attention between previously visible and new discourse participants, as reflected in the no longer significant claim support activity in the rate model. Powerful and office-holding actors continue to be more active, and individuals are more likely to be present in the media than organizations. Powerful individuals like party leaders and officeholders (e.g. ministers for the environment at the state and federal level) thus try to set the tone of the debate. The power effect from the first period vanishes in the period 2 choice model. Actors instead support claims that are receiving a lot of attention (support popularity). There appear to be competing mechanisms operating. On the one hand, actors seem to close ranks and support claims supported by those who are also within/out of government (positive tertius government homophily). On the other hand, positive tertius party diversity points to actors preferring claims supported by members of a variety of parties. These seemingly contradictory mechanisms may simply represent alternatives, but also point to the pioneering activity of a few prominent dissenting actors like the Minister for Environment Norbert Röttgen. His early support for nuclear phase-out, originally only supported by the opposition, eroded governmental consensus and opened the door for other government actors to follow, increasing both government homophily and party diversity, as suggested by his central, brokering position in the right panel of Figure 2. New claims about renewable energy also quickly gained broad support and became building blocks of an emerging consensus.
In period 3, a consolidation phase sees the stabilization of a new consensus representing a 180° policy change for the governing parties. In the rate model, previously more active actors are now more likely to support claims (positive activity). Power remains a positive driver of claim-supporting activity, but now office-holding has switched to a negative effect. We interpret this as those in office having already made their positions clear in the previous phases of the debate and, without holding a more powerful position, are not returned to by the media to restate their position. The choice model suggests actors continue to support popular claims, especially those that receive multi-party support. Governmental homophily no longer seems to be a significant factor. This phase ends with the CDU’s phase-out decision, and powerful actors are now adopting the nuclear phase-out claim.
In the concluding period, after the CDU’s phase-out decision at their party convention on 31 May, the discourse changed significantly. Individuals and officeholders are now less active in the discourse than organizations and those without a political office. Having power continues to significantly affect rate, but the coefficient has decreased considerably since the first period, whereas the coefficient for activity has grown. Power again becomes significant for choice, but with a negative sign, signaling a rejection of the old orthodoxy, and tertius party diversity remains significant and the coefficient has grown. This reflects a phase in which the core political conflict between government and opposition is gone and a broad consensus on the core issue of nuclear phase-out has been reached. Previously contested claims now attract support and, also for the first time, political actors support the same claims as those actors with whom they share support for other claims. Actors seek to close the books by creating coherence among claims, with the remaining points of debate mostly at the margins, where environmental civil society actors try to persuade the opposition not to support the (in their eyes still too slow and cautious) government phase-out plan. In the end though, most opposition politicians voted in favor of the government phase-out proposal in the German Bundestag on 30 June 2011.
Overall, mechanisms do appear to differ by period, especially in the choice model, which points to the need for further work to theorize how political discourse dynamics are phased or sequenced, perhaps testing whether the four phases identified here are common to policy pivots. Still, two big trends shine through. First, power is important, particularly for rate. Powerful actors often appear to support claims in the media, though this effect seems to weaken in later periods. Powerful actors play an important role until the phase-out decision is de facto secured at the end of the third phase, when other actors contest the margins. Powerful actors’ choices are also quite influential, at least to begin with, though by the end of this debate those actors still participating were supporting claims not supported by powerful actors. Interestingly, while power was reliably positive, officeholders was an independent effect mostly only in the first two periods.
Second, diversity was important for choice. In this case of a policy pivot, tertius party diversity was a strong, significant effect from the second period on. This effect motivates the support of claims across party lines, so long as some have already been entrepreneurial enough to break any exclusive party-claim associations. At first sight, the tertius party diversity mechanism seems to contradict and counteract the tertius government homophily mechanism, which one would ordinarily expect to play a large role in political discourse. But at closer inspection, it becomes clear that the sequence of simultaneous significance of the diversity and homophily mechanism in one phase and the loss of significance for homophily in subsequent phases precisely indicates a breakup of partisan discourse coalitions and the establishment of new cross-party claims. This points to the important role that original aisle-crossers like Röttgen had on how the discourse evolved.
5. Conclusions
The policy pivot of the German conservative government after Fukushima, from extending the running time of nuclear power plants to securing the final shutdown of the last nuclear power plant in 2022 cannot be explained by looking at factors like political economy, party politics, or power shifts. It is largely the result of an intense and controversial debate in the four months following the nuclear catastrophe in Japan. In this paper, we have investigated several discursive mechanisms that we suspect may have influenced the debate and finally led to the decision to exit from nuclear energy by 2022. Our results indicate that all these mechanisms play a role in at least one period, but that none are significant in all periods. Though complex, two component, multimodal and dynamic network actor models on four periods make for rather complicated results, two main takeaways shine through.
First, power matters for who joins the debate as well as which claims are supported, at least early on. This conforms to our expectations from existing research on media representation of politicians (Vos, Reference Vos2014). However, the case itself highlights how powerful actors and the claims they represent do not necessarily dictate the outcome. Contributions from more marginal actors to a continuing debate and especially bridging discursive interventions by some dissenting government actors opened up opportunities for compromise, reconsideration, and innovation.
Second, party diversity plays an important role for actors’ choice of claims to support in this case, especially later on. We believe this picks up on heterogeneity in support as a signal of claim quality or at least multi-party acceptability. This finding, net of general popularity and contestation and support of the powerful or coalitional actors, indicates how significant this effect might be. While it remains to be seen how common such an effect might be, if it is crucial to policy pivots, then it might cast new light on the implications of increasing polarization in many democratic legislatures, but also to help politicians identify when there is a genuine opening for persuasion. It also highlights the important public good that those politicians that at least occasionally cross the aisle provide by opening space for others, where persuaded, to follow.
Our results show that conceptualizing political discourse as multimodal dynamic networks and analyzing them with dynamic actor network models enables us to disentangle a number of micro-mechanisms that together drive even complicated discourse dynamics such as those that appear in our case. Our approach involves modeling political discourse network events with a multimodal extension to the dynamic network actor model. The DyNAM affords the opportunity to separate and specify the rate and choice components—which are fuzed in the per-event parameterization introduced in Butts (Reference Butts2008)—differently. This fits political discourse networks well, as who speaks when, and what they say when they do speak publicly are likely to be governed by different mechanisms. Although the media play a role in determining when different actors are reported, the choice of claims that actors support is more likely to be a function of network interaction patterns in a multimodal discursive space. Data such as this are thus a product of two quite different—or at least differently parameterized—processes, in this case who gets to make public claims and which claims they then support.
This paper points to a number of promising directions for research on political discourse dynamics. First, although the AKW dataset included a range of variables on the actor mode, none exist on the claim mode in this data, restricting how we could model how actors’ claim support choices were made. While the tertius effects used here were useful, future research should identify ways to control also for attributes of the claims themselves. This will no doubt present a challenging coding exercise, but valuable, especially if the opportunity is taken to also establish (perhaps signed) relationships among claims and even among actors to create a truly multilevel network.
Second, though this case had the advantage of being an intense debate with 1164 claims, this paper included choices that reduced statistical power considerably: concentrating on only formal political actors and their subsequent support of claims, and the splitting of the data into four periods. We defend the first decision by arguing that it is more useful to model a well-defined and interpretable set of dependent events than more but heterogeneous observations. The second decision was motivated by substantive knowledge of the case and produced a theoretical contribution to how political debates develop over time. Only future research will be able to establish whether such periodization is typical, at least of cases of policy pivots, but recognizing that these are complex, multimodal, and dynamic debates means that researchers should search for at least as intense debates, if not those with even more events.
This case does not reflect the daily routine of political discourse; it is not a case of “normal” politics. Instead, it represents a relatively rare and accelerated episode of high salience and conflict that concluded with the reversal of previously established policies, a policy pivot. As such, the mechanisms considered here are unlikely to be exactly the same as those that operate in political discourse under typical conditions. A broader application of DyNAMs to other episodes of political claims-making would allow us to judge whether some of our proposed mechanisms (or some specific combinations of them) represent more basic building blocks of political discourse dynamics. However, while rare, other policy pivots have occurred on nuclear energy (for instance Switzerland) and in a range of other domains, and so future research should see whether, for example, powerful actors always play a role early on or that diverse support is important for how these discourses develop.
Acknowledgments
We would like to thank Alvaro Uzaheta for his tireless work on goldfish, the audiences of talks at Victoria University of Wellington and the University of Auckland for their feedback, and the three reviewers and the editor for their very helpful comments.
Competing interests
None.
Data availability statement
Data used in this article as well as the R scripts used in the analysis are available on the Harvard Dataverse: https://doi.org/10.7910/DVN/IRZL21.
Appendix
(A) Dataset and annotation
Our analysis is based on the evaluation of the demands (claims) of all actors reported in two German daily newspapers in the period between the earthquake in Japan and the Bundestag decision to phase-out nuclear energy production. All articles published in the liberal to left-leaning Süddeutsche Zeitung and the conservative to right-wing Die Welt between March 11, 2011 and July 2, 2011 were evaluated. The two newspapers were selected to represent a broad political spectrum, as we assumed that actors critical of nuclear power might be overrepresented in the Süddeutsche Zeitung while supporters of nuclear power might be overrepresented in Die Welt. Before annotating the articles, the first step was to identify all articles in the full-text newspaper database Factiva that were published in the national sections of the two newspapers and that contained the truncated keywords “AKW* OR Atom* OR Nuklear* AND Ausstieg* OR Stilllegung* OR Abschalten* OR Laufzeit*” in all inflections, noun and verb forms. For the first week after the earthquake, we included all articles published in the two newspapers irrespective of whether they contained the keywords in order not to miss possibly relevant claims in articles not mentioning one of the keyword combinations.
In the articles selected through this procedure, all claims were first manually annotated using a codebook that was inductively developed, using a random sample of articles covering the whole time period. The codebook contains 51 claim categories, belonging to the five super-categories: exit scenarios, security, energy policy, procedures, and other. Each article was annotated by two annotators. Conflicting annotations were discussed and then gold-standardized. The paper-based annotations were then transferred to a database, following the coding scheme of the Political Claims Analysis (Koopmans & Statham, Reference Koopmans and Statham1999; Koopmans, Reference Koopmans2002). While Koopmans et al. operate with a very broad concept of claims that also includes evaluative statements, we have coded claims and evaluative statements separately. For this article, we do not consider evaluative statements but only claims. We define a claim as any demand or decision made by an actor in the relevant policy field. A claim can comprise one or more sentences or sometimes only partial sentences. In addition to the claim, the following further elements were annotated in each case: actor (name, organizational and/or party affiliation, actor category), support or rejection of the claim, and date of claim. If the date was not specified, we assumed that the claim was made on the day preceding the publication.
To give an example, the sentence “SPD and Greens demanded not only the withdrawal of the runtime extension but also the shutdown of the seven oldest and most unsafe nuclear power plants”Footnote 4 (Süddeutsche Zeitung, March 14, 2011) was coded as a rejection of the runtime extension by the actors SPD and Greens on March 13, 2011 and as a support for the shutdown of the old nuclear power plants by the actors SPD and Greens on March 13, 2011. The sentence thus contains (each actor is counted individually) four claims. The sentence “the T[echnical]U[niversity] Munich, on the other hand, considers the safety systems to be more than sufficient”Footnote 5 (Süddeutsche Zeitung, April 16, 2011), which would also be evaluated as a claim in Koopmans’ coding scheme, was interpreted by us as an evaluative statement and is therefore not taken into account in the analysis of the claims in this article.
In the entire period, 398 articles were published in both newspapers (Die Welt 159, Süddeutsche Zeitung 239) that contained claims by actors on nuclear policy in Germany, that is an average of 1.7 relevant articles per day in the Welt and 2.5 in the Süddeutsche Zeitung. In these articles, 1299 claims were annotated (Die Welt 584, Süddeutsche Zeitung 715). After consolidating the dataset for duplicates, the analysis is based on 1164 claims.


 Open access