


Introduction
The introduction of cryogenic X-ray crystallography into structural biology led to an explosion of protein structural information (Garman and Schneider, Reference Garman and Schneider1997; Garman, Reference Garman1999; Burley et al., Reference Burley, Berman, Christie, Duarte, Feng, Westbrook, Young and Zardecki2018). Its practical benefits are convincing: long-term storage, easy handling, and transport of crystals in dry shipping containers that enable remote data collection. Arguably, the most important benefit is that cryogenic temperatures mitigate radiation damage of the protein (Holton, Reference Holton2009). This is achieved by reducing secondary radiation damage by decreasing diffusion rates of deleterious radicals and other damaging species (Garman, Reference Garman1999; Juers and Matthews, Reference Juers and Matthews2004; Garman and Owen, Reference Garman and Owen2006; Holton, Reference Holton2009; Warkentin et al., Reference Warkentin, Hopkins, Badeau, Mulichak, Keefe and Thorne2013; Garman and Weik, Reference Garman and Weik2017). Analogously, flash-cooling has been used to trap catalytic intermediates (Makinen and Fink, Reference Makinen and Fink1977; Fink and Petsko, Reference Fink and Petsko1981; Moffat and Henderson, Reference Moffat and Henderson1995; Weik and Colletier, Reference Weik and Colletier2010). In turn, this raises the question of whether protein residues important for function may also be trapped in nonphysiological conformations.
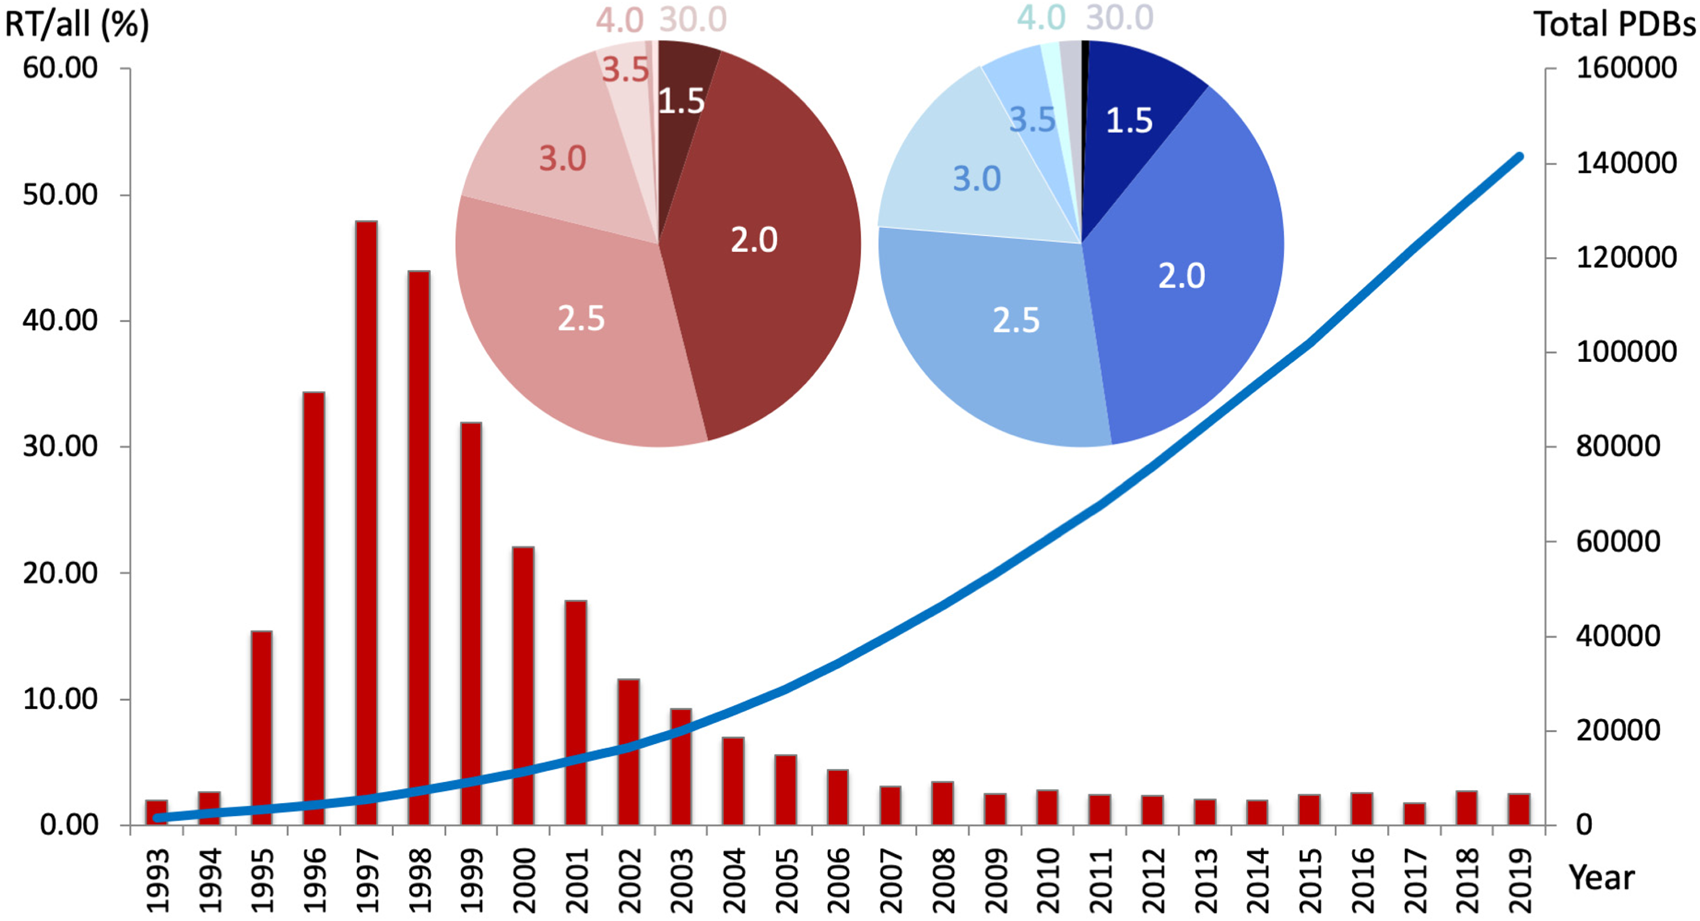
Approaches of cooling crystals to reduce radiation damage date back to the 1970s but were initially abandoned due to undesirable increases in mosaicity (Low et al., Reference Low, Chen, Berger, Singman and Pletcher1966) before reasonable isomorphism was obtained for frozen crystals (Haas and Rossmann, Reference Haas and Rossmann1970). To avoid deleterious ice formation in protein channels, Petsko introduced the use of cryoprotective mother liquors (Petsko, Reference Petsko1975). This allowed several freeze/thaw cycles of the crystal but was deemed cumbersome, preventing its wide-spread use. At the time, the same fate awaited other pioneering approaches including rapid cooling of crystals in liquid propane (Hartmann et al., Reference Hartmann, Parak, Steigemann, Petsko, Ponzi and Frauenfelder1982) and slow crystal cooling (Drew et al., Reference Drew, Samson and Dickerson1982), despite their promise of providing insights into conformational substates in metmyoglobin and the B-DNA dodecamer, respectively. In 1988, Håkon Hope introduced a general method of cryoprotecting protein crystals in oil for X-ray crystallography (Hope, Reference Hope1988). The approach facilitates crystal handling and the collection of high-resolution datasets while reducing radiation damage (Henderson, Reference Henderson1990). One of its first successful applications was ribosomal crystallography (Hope et al., Reference Hope, Frolow, Von Böhlen, Makowski, Kratky, Halfon, Danz, Webster, Bartels and Wittmann1989), which enabled key structural studies on fragile crystals of ribosomal subunits and led to the Nobel Prize in Chemistry in 2009. At the same time, developments of crystal looping methods facilitated crystal handling (Teng, Reference Teng1990) and a variety of suitable materials were tested in the early 1990s. With the impracticalities of cryocrystallography resolved, the field embraced the method for its practical merits and has since produced an exponentially increasing amount of structural data deposited into the Protein Data Bank (PDB) (Burley et al., Reference Burley, Berman, Christie, Duarte, Feng, Westbrook, Young and Zardecki2018) (Fig. 1). Coincidentally, the percentage of datasets collected per year at room temperature (RT) has dropped steadily since Garman and Schneider's seminal paper on ‘macromolecular cryocrystallography,’ which was published more than 20 years ago (Garman and Schneider, Reference Garman and Schneider1997).
The percentage of PDB datasets collected at room temperature (RT; 273–350 K) per year decreased steadily over the past 20 years (red bar graph, left y-axis), whereas the overall number of structures increased exponentially (blue line, right y-axis). Nearly 50% of all RTX structures were collected under 2.0 Å resolution, and over 75% were collected under 2.5 Å resolution. Cumulatively, approximately 94% of all deposited structures were collected at cryogenic temperatures. Inset – The distribution of resolutions (in Å) for RT structures (red pie chart) resembles the distribution of PDB structures collected at any temperature (blue pie chart).
Pioneering work in multitemperature crystallography dates back to 1979, when Frauenfelder et al., shifted temperature from 220 to 300 K to probe the spatial distribution of protein structural dynamics in metmyoglobin (Frauenfelder et al., Reference Frauenfelder, Petsko and Tsernoglou1979). Tilton et al. later extended the temperature range from 98 to 320 K and found that crystallographic B-factors of RNase A show a temperature-dependent biphasic response (Tilton et al., Reference Tilton, Dewan and Petsko1992). The investigators also noted a correlation with the dynamic structure of the surrounding protein solvent. Temperature-derivative fluorescence spectroscopy studies suggested that the dynamics of crystalline proteins strongly depend on the solvent composition and crystal channels (Weik et al., Reference Weik, Vernede, Royant and Bourgeois2004). Work by Juers and Matthews provided a rare example in which a single crystal was successfully re-cycled between RT and low temperature. They proposed that protein distortions due to cryocooling warrant caution (Juers and Matthews, Reference Juers and Matthews2001). This ‘two-state’ model is reminiscent of Halle's work (Halle, Reference Halle2004) on the glass transition temperature (~200 K) (Ringe and Petsko, Reference Ringe and Petsko2003) and kinetic trapping of the protein upon flash-cooling. Moving across the glass transition was later exploited to demonstrate in crystallo substrate turnover when a crystal was warmed to 220 K (Ding et al., Reference Ding, Rasmussen, Petsko and Ringe2006). Since Fraser et al., established a mechanistic link between protein function and protein conformational ensembles observed only at RT (Fraser et al., Reference Fraser, Clarkson, Degnan, Erion, Kern and Alber2009), several articles have reinforced the notion that functionally important conformations that are hidden at cryogenic temperatures can be revealed by shifting temperature (Keedy et al., Reference Keedy, Van Den Bedem, Sivak, Petsko, Ringe, Wilson and Fraser2014; Reference Keedy, Kenner, Warkentin, Woldeyes, Hopkins, Thompson, Brewster, Van Benschoten, Baxter, Uervirojnangkoorn, Mcphillips, Song, Alonso-Mori, Holton, Weis, Brunger, Soltis, Lemke, Gonzalez, Sauter, Cohen, Van Den Bedem, Thorne and Fraser2015b). RT crystallography at synchrotron sources has since been applied to studying ligand binding (Fischer et al., Reference Fischer, Shoichet and Fraser2015), ligand discovery (Fischer et al., Reference Fischer, Coleman, Fraser and Shoichet2014), and characterizing functional contact networks (van den Bedem et al., Reference Van Den Bedem, Bhabha, Yang, Wright and Fraser2013).
However, of all PDB structures with explicit temperature records, under 6% were collected at RT, i.e. cryogenic datasets make up approximately 94% of PDB structures (Fig. 1). Over the past decade, the percentage of RT datasets has remained steadily below 5%. Notably, the range of resolutions obtained at RT follows a similar distribution to that at cryogenic temperatures. While the benefits of cryocooling are well appreciated, some of its downsides include the need to use and optimize cryoprotectants (Alcorn and Juers, Reference Alcorn and Juers2010; Tyree et al., Reference Tyree, Dan and Thorne2018), crystal damage, ice rings that interfere with diffraction from the protein lattice (Thorn et al., Reference Thorn, Parkhurst, Emsley, Nicholls, Vollmar, Evans and Murshudov2017), and exaggerated crystal disorder such as increased mosaicity and R merge values (Ravelli and McSweeney, Reference Ravelli and McSweeney2000; Pflugrath, Reference Pflugrath2015). However, the main problem of common cryocooling is that the protein vitrifies on the intermediate timescale – it is neither fast nor slow (Halle, Reference Halle2004). This traps a mix of conformational states that is not necessarily representative of the physiologically relevant state at equilibrium. Note that even for the same experimenter and protein, varying levels of the cold liquid nitrogen (LN2) gas layer above the glass or foam dewar, as well as varying crystal sizes lead to differences in the freezing rate of crystals.
This review aims to dispel myths about RT X-ray crystallography (RTX) data collection and to provide practical guidance to facilitate collecting more dynamic protein structural data above the glass transition temperature. Advice is aimed to assist experimenters at all stages: before, during, and after the collection of crystallographic data at RT. The review ends with a selection of RTX studies that exemplify ways to gain dynamic insights into protein structures. The examples represent the breadth, rather than depth, of the field to illustrate both the novelty and value of the method to inform basic and biomedical research.
Before: how to prepare for RTX data collection
Crystal transport
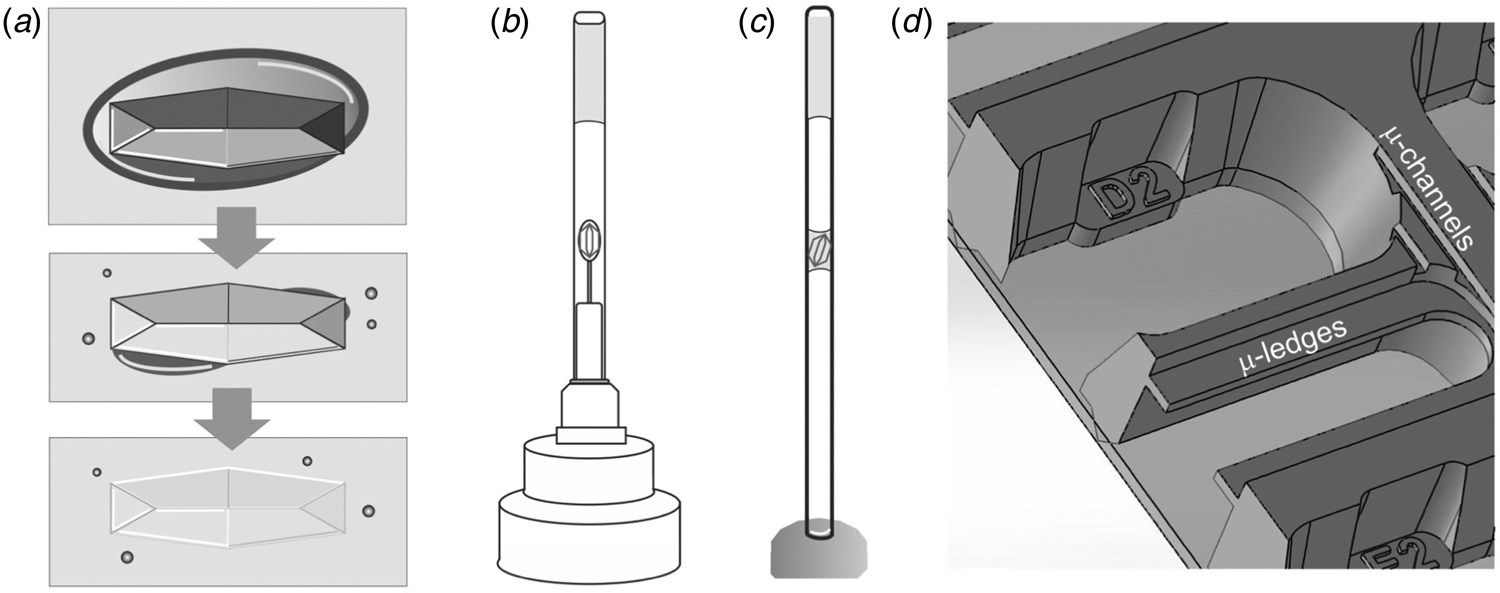
One practical benefit of cryogenic methods becomes immediately apparent when pre-grown crystals need to be transported to a synchrotron – we have to find an alternative to the convenience of sending stably frozen crystals in a cryogenic shipping container. A few popular choices for sizeable (macro) crystals include classic capillary mounting (King, Reference King1954; Basavappa et al., Reference Basavappa, Petri and Tolbert2003) (Fig. 2c), using pins that hold pre-mounted crystals (Fig. 2b), or juggling crystals to the synchrotron in their crystallization tray. Note that pre-mounted crystals protected by a thin-walled polyester sleeve (MiTeGen) with stabilizing solution (Fig. 2b) should be sent via ground transit because pressure changes during a flight can have undesirable effects, including dislodging the sleeve that protects crystals from dehydration. To prevent splashing in crystal trays upfront, it is worth exploring if crystallization is transferable to an in situ crystallization tray format. As the name indicates, in situ plates allow the screening of crystals without removing them from the tray. The In Situ-1TM plate (MiTeGen) allows crystals to be grown, transported and collected directly in the plate. Given its construction, the In Situ-1TM plate promises optional long-distance shipping with reduced cross-contamination of fluid from reservoirs to the protein growth areas due to micro ledges that are absent in conventional plates (Fig. 2d). Alternatively, the Stanford Synchrotron Radiation Lightsource (SSRL) Crystallization Plate Kit (Crystal Positioning Systems; MiTeGen) allows in situ crystallization of proteins on substrates affixed to magnetic sample pin bases (Martiel et al., Reference Martiel, Müller-Werkmeister and Cohen2019). This setup enables the transport of crystals mounted in loops, grids or capillaries in a controlled humidity environment to the synchrotron beamline for robotic sample mounting. As three-dimensional (3D) printers become more accessible, custom 3D printed trays provide a viable alternative (Monteiro et al., Reference Monteiro, Von Stetten, Stohrer, Sans, Pearson, Santoni, Van Der Linden and Trebbin2020).
BEFORE – Preparing macroscopic crystals for room temperature data collection. (a) Mother liquor (dark grey oval) surrounding a crystal in a large drop of oil (light grey box) is sequentially removed, leading to a visually ‘disappearing’ crystal due to the similar refractive indices of protein crystal and oil. (b) A mounted crystal is covered by a thin-walled polyester sleeve that contains a stabilizing solution. (c) In classic capillary mounting, the experimenter tries to achieve a solvent meniscus to hold the protein crystal in place. (d) MiTeGen's In Situ-1TM plate has microchannels and ledges that facilitate growing, shipping, and in situ data collection of crystals. A picture of the SSRL crystallization plate setup (Crystal Positioning Systems) can be found in the supplementary information of Martiel et al. (Reference Martiel, Müller-Werkmeister and Cohen2019). For sample delivery methods of microcrystals that enable serial synchrotron crystallography see the section ‘sample delivery for serial crystallography’.
If crystallization and travel kinetics are favorable, setting trays up locally is another option. However, this comes at the risk of wasting precious beamtime if crystallization does not turn out to be reproducible onsite. While this review focuses on macro-crystals of >100 μm, transferable sample delivery methods for microcrystals are emerging from efforts at X-ray free-electron laser facilities (XFEL). The required slew of microcrystals can simply be transported in a test tube to a suitable microfocus beamline that is equipped with a sample delivery option – reviewed below in the section ‘sample delivery for serial crystallography’.
Mitigating dehydration
Oils
Before carefully handling crystals at the synchrotron, two major crystal killers need to be considered: dehydration and radiation damage (Atakisi et al., Reference Atakisi, Moreau and Thorne2018). First, dehydration is time-dependent, so working fast but gently is crucial. Oils can buy time. Oils that reduce crystal dehydration across a range of viscosities include Santovac 5®, NVH, Silicon Oil, Al's Oil, Paratone® N, and Paraffin Oil (Pflugrath, Reference Pflugrath2015). The crystal is either transferred into the oil directly or the oil is layered on top of the crystallization drop (Fig. 2a). Forming an oil seal that removes all contact between ambient air and the mother liquor can increase the working time from seconds to hours. The next step then becomes transferring crystals through the liquid–liquid interface between mother liquor and oil. One successful method is to stir the liquid–liquid mixture to remove most of the external mother liquor from the crystal. To get rid of stubborn solvent droplets, stir vigorously, close to the crystal or dislodge remaining droplets with a microtool, e.g., a MicroChiselTM (MiTeGen). Note that crystals rarely physically disappear when they are transferred to the oil. Rather, the eye is misled by the similar refractive index of oil and protein, especially when the solvent layer is stripped off the surface (Warkentin and Thorne, Reference Warkentin and Thorne2009). A polarizing filter can often reveal the crystals that may have appeared to ‘dissolve’ or are hiding in the corners of the optically distorted drop (Fig. 2a). The final and equally important step is to remove excess oil from around the harvested crystal because the background created by any oil in the X-ray beam is comparable to that of an equal path through the protein crystal itself. An exception is oils containing heavier elements, such as silicon or fluorine, which scatter and absorb much more than a metal-free protein crystal. On the other hand, a layer of oil that is too thin can result in the aqueous phase poking through the oil. This promotes dehydration or surface tension, damaging the crystal lattice and causing poor diffraction. If crystal damage occurs despite the above measures, consider whether oil-soluble, volatile components of the mother liquor may evaporate and optimize conditions using different oils mentioned above. Getting the right amount of oil around the crystal is most easily achieved by touching the oil envelope to a clean surface or by using a paper wick (Hampton Research, Aliso Viejo, CA). If the crystal escapes the loop during the touch-off process it can simply be picked up again, taking advantage of the exceptionally long working time of oil-clad crystals. It is worth considering that anything other than the crystal in the beam dampens its diffraction: glass is the least transmissive, air is the most transmissive. Different plastics found in in situ trays, seals, loops, or sleeves differ in the magnitude and position of the ring of background that decreases the signal-to-noise ratio of specific resolution ranges. Consult the ‘shadow’ on the diffraction image, processing statistics, or a knowledgeable beamline scientist for insights.
One common myth is that thermal heating from the incident X-ray beam contributes to excess damage of the crystal by increasing reaction rates and evaporation. The contribution of hydrogen (H2) or carbon dioxide (CO2) gas has been discussed (Garman, Reference Garman2010). H2 gas forms when X-rays react with water and resulting H2 bubbles cause physical distress to the crystal, distort the crystal lattice, and induce disorder that leads to fading high-resolution information (Meents et al., Reference Meents, Gutmann, Wagner and Schulze-Briese2010). In practice, this would suggest that retaining some mother liquor around the crystal may be beneficial to compensate for the release of the gas bubble. On the other hand, the radiolysis of water leads to hydroxyl and peroxide radicals that modify amino acids in order of their reactivity (Maleknia et al., Reference Maleknia, Brenowitz and Chance1999). Others have discounted the causation of H2 gas-induced radiation damage at higher temperatures (Warkentin and Thorne, Reference Warkentin and Thorne2010).
Capillaries
Capillaries are an alternative method to prevent crystal dehydration. Traditional mounting of crystals in borosilicate glass or quartz capillaries is remarkably watertight but can be difficult to master (King, Reference King1954; Basavappa et al., Reference Basavappa, Petri and Tolbert2003). The mechanical stress of mounting a flat crystal onto the curved inner surface of a capillary is also not to be underestimated. Curvature incompatibilities were avoided in a contraption that resembles the ‘grandfather’ of the MiTeGen sleeve, which was used to study the stress-induced modulation of the soybean lipoxygenase L3 structure (Skrzypczak-Jankun et al., Reference Skrzypczak-Jankun, Bianchet, Mario Amzel and Funk1996). However, the biggest disadvantage of quartz and glass capillary mounts is absorption. Per unit volume, glass scatters and absorbs roughly 10× that of the protein crystal itself. Therefore, for a 100 μm crystal, a 10 μm glass window starts to dominate the noise in the experiment. MiTeGen has now largely supplanted this method with a handy polyester tubing (Kalinin et al., Reference Kalinin, Kmetko, Bartnik, Stewart, Gillilan, Lobkovsky and Thorne2005) (Fig. 2b). Polyester, and indeed most plastics, scatter and absorb about as much as the same volume of protein, so the trade-off in thickness is much more forgiving. To stabilize fragile crystals, approximately 10 μl of environment-stabilizing solution (mother liquor or well solution) is injected into the sealed end of the 25 μm transparent polyester tube by using a gel-loading tip (Fig. 3). In fact, vapor diffusion can be used favorably to equilibrate the humidity inside the tube by using a mix that is compatible with the protein, such as 80% mother liquor to 20% water. The tube can be cut to size with a razor blade (it does not shatter like 10 μm glass capillaries) while reducing background scatter by about 60%. The crystal is then harvested with a loop that matches its size (Fig. 3a). Excess liquid is removed and the polyester tubing is drawn over the pin that holds the crystal, either with a steady hand or with the help of the MicroRTTM Aligner (MiTeGen). The base can be additionally sealed with Dow Corning High-Vacuum Grease, which mitigates most evaporation except the approximately 80 nL h−1 that evaporates through the thin polyester tubing.
DURING – Considerations for collecting room temperature data. (a) At RT, a protein crystal is mounted in a size-matched loop and protected from dehydration by a sleeve filled with reservoir solution. To reduce radiation damage, data are collected with an attenuated beam and potentially from different parts of the crystal using a helical scan or stepwise increments; small-molecule scavengers may help protect the crystal from radicals formed during data collection. (b) The crystal volume doubles with each increase in crystal size indicated on the x-axis for a cubic crystal; e.g. a crystal of 101 × 101 × 101 μm has twice the volume of a crystal of 80 × 80 × 80 μm. Note that in practice such crystals are often visually indistinguishable.

Data collection on bare crystals without protective sleeve shielding may be facilitated by humidity-control devices such as the original Proteros Free Mounting System (Kiefersauer et al., Reference Kiefersauer, Than, Dobbek, Gremer, Melero, Strobl, Dias, Soulimane and Huber2000). To address the problem of dehydration, several European synchrotrons have formed a collaboration to implement a designated humidity-control device – the HC1 Dehydration Device (Sanchez-Weatherby et al., Reference Sanchez-Weatherby, Bowler, Huet, Gobbo, Felisaz, Lavault, Moya, Kadlec, Ravelli and Cipriani2009; Russi et al., Reference Russi, Juers, Sanchez-Weatherby, Pellegrini, Mossou, Forsyth, Huet, Gobbo, Felisaz, Moya, McSweeney, Cusack, Cipriani and Bowler2011). The commercial version HC-Lab Humidity Controller (Arinax) is used across many European synchrotrons and at the SSRL (Stanford, USA). Although initially used for controlled crystal dehydration, humidity control devices were adopted to replace the cryojet during RT data collection. Excess mother liquor around crystals that are harvested onto MicroMeshes (MiTeGen) can be wicked away from the other side of the mesh support, even when they are mounted in the humidity stream. At the bench, the humid-air and glue-coating method (Baba et al., Reference Baba, Shimada, Mizuno, Baba, Ago, Yamamoto and Kumasaka2019) and MiTeGen's commercial solution, WatershedTM, provide custom benchtop workstations to prevent drop dehydration during handling.
Avoiding cryoprotectants is another benefit of RTX data collection. Cryoprotectants often need to be optimized to obtain high-resolution data (Juers et al., Reference Juers, Farley, Saxby, Cotter, Cahn, Holton-Burke, Harrison and Wu2018). At high concentrations, fragment-sized cryoprotectants (like glycerol) are often found in protein structures. In a cautionary tale, Aggarwal et al. (Reference Aggarwal, Boone, Kondeti, Tu, Silverman and Mckenna2013) investigated the effect of cryoprotectants on carbonic anhydrase II. They found that, although neither protein thermostability nor the inhibitor binding are affected, glycerol does affect the kinetics of carbonic anhydrase II, presumably by displacing active-site solvent.
Reducing radiation damage
The other major crystal killer is radiation damage. At RT, radiation damage is time-dependent and mainly depends on flux density (Southworth-Davies et al., Reference Southworth-Davies, Medina, Carmichael and Garman2007; Warkentin et al., Reference Warkentin, Badeau, Hopkins and Thorne2011, Reference Warkentin, Hopkins, Badeau, Mulichak, Keefe and Thorne2013). Dark progression, i.e., the progression of damage to the crystal after the X-rays have been turned off (Blundell and Johnson, Reference Blundell and Johnson1976), was observed at temperatures above 180 K on timescales of 3–20 min (Warkentin et al., Reference Warkentin, Badeau, Hopkins and Thorne2011). The use of small-molecule radical scavengers, such as substituted benzoquinones [see (Allan et al., Reference Allan, Kander, Carmichael and Garman2013) for an extensive list], can mitigate radiation damage during data collection (De la Mora et al., Reference De la Mora, Carmichael and Garman2011) (Fig. 3). Unfortunately, none of these protective effects is very large. An improvement by a factor of two or more would be enough to overcome sample-to-sample variability and inspire a change in data collection strategy, but a reproducible demonstration of such a large radiation protection factor has yet to be reported. Exceptions to this rule are ultrafast X-ray pulses produced at XFELs where a diffraction pattern is produced before the structure can react to radiation exposure (Chapman, Reference Chapman2019). At RT the experimental limit of radiation damage is typically less than 400 kGy (Schubert et al., Reference Schubert, Kapis, Gicquel, Bourenkov, Schneider, Heymann, Betzel and Perbandt2016; De la Mora et al., Reference De la Mora, Coquelle, Bury, Rosenthal, Holton, Carmichael, Garman, Burghammer, Colletier and Weik2020), which is about one to two orders of magnitude lower than at cryo where the calculated Henderson limit is 20 MGy (Henderson, Reference Henderson1990; Nave and Garman, Reference Nave and Garman2005; Garman and Owen, Reference Garman and Owen2006) and the upper experimental limit is 30 MGy (Owen et al., Reference Owen, Rudiño-Piñera and Garman2006). In practice, values vary considerably depending on the diffraction limit and chemical composition of the sample and dose rate (Teng and Moffat, Reference Teng and Moffat2000; Liebschner et al., Reference Liebschner, Rosenbaum, Dauter and Dauter2015; Atakisi et al., Reference Atakisi, Conger, Moreau and Thorne2019; Ebrahim et al., Reference Ebrahim, Moreno-Chicano, Appleby, Chaplin, Beale, Sherrell, Duyvesteyn, Owada, Tono, Sugimoto, Strange, Worrall, Axford, Owen and Hough2019b). A more elaborate crystal lifetime estimator, RADDOSE-3D, that considers some of these factors are presented in the section ‘optimizing data collection parameters’. Considering a practical RT limit of 400 kGy provides a rough guideline for expected crystal lifetime, required beam attenuation during RT data collection, or whether data merging to improve data completeness may be advisable (see the section ‘collecting and merging data from multiple crystals’). Typically, R merge values of less than 10% indicate that damage-induced changes are significantly smaller than the modeling error represented by R work and R free (Fraser et al., Reference Fraser, Van Den Bedem, Samelson, Lang, Holton, Echols and Alber2011).
During: how to collect RTX data
Optimizing data collection parameters
During data collection, it is key to strike the balance between crystal lifetime and crystal diffraction. Intense beams produce more intense spots at high resolution but kill crystals faster. In turn, crystals survive much longer in attenuated beams but may not reach their full diffractive potential. An ideal data collection strategy maximizes diffraction to high resolution at high redundancy before the crystal suffers from radiation damage. In practice, the best way to approach this optimum is through trial and error, and focusing on a couple of parameters that increase the odds of squeezing the best data out of the crystal (Krojer et al., Reference Krojer, Pike and Von Delft2013). First, match the crystal to the beam size or vice versa (i.e., adjust the beam aperture) to optimize the signal-to-noise ratio. Generally, exposing a larger crystal volume to the same X-ray dose fares better because of the number of molecules exposed to the beam scales with volume – by the third power of its linear size (Fig. 3b). For example, the volume, and hence the number of useful photons, double for two visually indistinguishable crystals of 80 and 101 μm (Holton, Reference Holton2009).
Second, the beam can be attenuated by various means. The simplest way is to add an aluminum filter that attenuates the beam to a set percentage and extends crystal lifetime. By using attenuation, diffraction data can be collected at a slower rate for the same X-ray dose, which has the advantage of reducing the impact of time-dependent errors, such as beam flicker, shutter jitter, and the approximately 2 ms read-out gap between images of a PILATUS (Dectris) detector. It is important to familiarize oneself with the X-ray beam properties at each beamline. The beamline scientists should be able to provide information about the X-ray dose at different energies and beam sizes. Top-off mode of modern synchrotron sources, shutterless data collection with Pixel Array Detectors (PAD) and reduced dark time of faster PADs such as the EIGER or PILATUS (Dectris) enable faster data collection rates with good statistics (Rajendran et al., Reference Rajendran, Dworkowski, Wang and Schulze-Briese2011; Owen et al., Reference Owen, Paterson, Axford, Aishima, Schulze-Briese, Ren, Fry, Stuart and Evans2014). Fine-slicing data collection (Pflugrath, Reference Pflugrath1999; Krojer et al., Reference Krojer, Pike and Von Delft2013) reduces spot overlap and allows more precise truncation of data once datasets fall below an acceptable threshold for radiation damage and resolution. If needed, a beamline scientist can advise how to explore other methods of reducing flux density that can improve the beam characteristics and hence data quality. These include the following: lowering the divergence will make the spots on the detector smaller and sharper; lowering the dispersion or bandpass can improve high-angle spot shape; and de-focusing the beam will lower the dose profile across the crystal face and minimize lattice strain propagating to nearby areas. The RADDOSE-3D calculator can help to predict the lifetime of protein crystals (Zeldin et al., Reference Zeldin, Brockhauser, Bremridge, Holton and Garman2013a) and estimate the effective X-ray dose the crystal has endured during data collection (Zeldin et al., Reference Zeldin, Gerstel and Garman2013b; Bury et al., Reference Bury, Brooks-Bartlett, Walsh and Garman2018). Ideally, a ‘top hat’ beam profile enables homogeneous sample exposure and better assessment of the damage. Recently, the B Damage metric was introduced to identify potential sites of specific damage by comparing the atomic B-factors of atoms with a similar local packing density environment (Gerstel et al., Reference Gerstel, Deane and Garman2015). For guidance on radiation damage that informs the practicalities of data collection, consult Holton's review and references therein (Holton, Reference Holton2009).
Third, to counter fading peak intensities, consider collecting data from different parts of the crystal by translating (manually or automatically in segments) or helically scanning the crystal along the goniometer axis (Fig. 3). Grid scans on crystals have indicated that crystal quality is often heterogeneous (Thompson et al., Reference Thompson, Cascio and Yeates2018). Collecting data from multiple crystals is another option discussed below.
Collecting and merging data from multiple crystals
Another prevailing RTX myth is that many crystals are needed to collect one complete dataset at RT. However, we routinely collect single crystal RTX datasets without radiation damage impeding electron density map interpretation or resulting in a dramatic decay in resolution (Fischer et al., Reference Fischer, Shoichet and Fraser2015). For samples where crystal damage due to dehydration or radiation damage is unavoidable, combining partial data from multiple crystals is an option. To obtain a dataset with desirable redundancy and completeness, multiple ‘wedges’ of data collected from often random orientations of multiple isomorphous crystals need to be merged. Redundancy increases accuracy, whereas completeness is needed for reliable model building and refinement. Since all reflections contribute to the electron density map, incomplete data lead to poor map quality (Wlodawer et al., Reference Wlodawer, Minor, Dauter and Jaskolski2008). While spot indexing and integration usually work well if a sufficient number of spots with high signal-to-noise ratios are recorded, merging can be challenging. Luckily, RTX data are usually more isomorphous than cryogenic datasets (Giordano et al., Reference Giordano, Leal, Bourenkov, McSweeney and Popov2012), leading to better statistics and final models (Fischer et al., Reference Fischer, Shoichet and Fraser2015). Manual merging can be tedious as it requires human intervention by cycling between integrated and scaled data and monitoring the merging statistics to decide which data to include or exclude (Evans, Reference Evans2006). The BLEND algorithm uses clustering based on unit cell parameters to facilitate the selection of optimal groups of multi-crystal data for scaling to achieve high completeness (Foadi et al., Reference Foadi, Aller, Alguel, Cameron, Axford, Owen, Armour, Waterman, Iwata and Evans2013). When executed in ‘graphics mode’, annotated dendrograms with merging statistics can be displayed and inspected. Excluding the last recorded segments of the data that have suffered obvious radiation damage will help improve merging statistics and success. Conveniently, BLEND is also integrated into DIALS (Winter et al., Reference Winter, Waterman, Parkhurst, Brewster, Gildea, Gerstel, Fuentes-Montero, Vollmar, Michels-Clark, Young, Sauter and Evans2018; Beilsten-Edmands et al., Reference Beilsten-Edmands, Winter, Gildea, Parkhurst, Waterman and Evans2020), a collaborative software suite that provides a framework to automate processing diffraction images into MTZ files. Another program that uses hierarchical clustering from multi-crystal experiments is ccCluster, which also features an interactive graphical user interface for the analysis of dendrograms (Santoni et al., Reference Santoni, Zander, Mueller-Dieckmann, Leonard and Popov2017). Local scaling, dataset weighting, and merging data from multiple data files are also implemented in the phenix.scale_and_merge tool (Akey et al., Reference Akey, Terwilliger and Smith2016) within Phenix (Liebschner et al., Reference Liebschner, Afonine, Baker, Bunkóczi, Chen, Croll, Hintze, Hung, Jain, Mccoy, Moriarty, Oeffner, Poon, Prisant, Read, Richardson, Richardson, Sammito, Sobolev, Stockwell, Terwilliger, Urzhumtsev, Videau, Williams and Adams2019). Finally, it is worth noting that the nature of the intensity decay is different at cryo versus RT (De la Mora et al., Reference De la Mora, Coquelle, Bury, Rosenthal, Holton, Carmichael, Garman, Burghammer, Colletier and Weik2020). At cryo, high-resolution reflection intensities decay first as lattice strain increases. At RT all intensities appear to fade at once as the crystal lattice transitions to non-crystallinity, Wilson B-factors increase, and scattering power is lost (Leal et al., Reference Leal, Bourenkov, Russi and Popov2013). Specific and global radiation damage are less decoupled at RT than at cryo, where specific damage affects certain amino acids (Gotthard et al., Reference Gotthard, Aumonier, De Sanctis, Leonard, Von Stetten and Royant2019).
Sample delivery for serial crystallography
While this review focuses on collecting data on larger crystals, an emerging RTX trend is serial crystallography in which thousands of diffraction images are collected on microcrystals (Beale et al., Reference Beale, Bolton, Marshall, Beale, Carr, Ebrahim, Moreno-Chicano, Hough, Worrall, Tews and Owen2019). Exposing each crystal only once mitigates radiation damage. In addition to the benefit of an undistorted RT image, time-resolved crystallography (Moffat, Reference Moffat1989) allows dynamic insights into protein function. Using XFELs, ‘molecular movies’ can be recorded with femtosecond time resolution (Chapman et al., Reference Chapman, Fromme, Barty, White, Kirian, Aquila, Hunter, Schulz, Deponte, Weierstall, Doak, Maia, Martin, Schlichting, Lomb, Coppola, Shoeman, Epp, Hartmann, Rolles, Rudenko, Foucar, Kimmel, Weidenspointner, Holl, Liang, Barthelmess, Caleman, Boutet, Bogan, Krzywinski, Bostedt, Bajt, Gumprecht, Rudek, Erk, Schmidt, Hömke, Reich, Pietschner, Strüder, Hauser, Gorke, Ullrich, Herrmann, Schaller, Schopper, Soltau, Kühnel, Messerschmidt, Bozek, Hau-Riege, Frank, Hampton, Sierra, Starodub, Williams, Hajdu, Timneanu, Seibert, Andreasson, Rocker, Jönsson, Svenda, Stern, Nass, Andritschke, Schröter, Krasniqi, Bott, Schmidt, Wang, Grotjohann, Holton, Barends, Neutze, Marchesini, Fromme, Schorb, Rupp, Adolph, Gorkhover, Andersson, Hirsemann, Potdevin, Graafsma, Nilsson and Spence2011; Chapman, Reference Chapman2019). However, with limited XFEL beamtime available, following dynamics at synchrotrons remains a viable alternative, while other options like microcrystal electron diffraction have not reached mainstream maturity (Wolff et al., Reference Wolff, Young, Sierra, Brewster, Martynowycz, Nango, Sugahara, Nakane, Ito, Aquila, Bhowmick, Biel, Carbajo, Cohen, Cortez, Gonzalez, Hino, Im, Koralek, Kubo, Lazarou, Nomura, Owada, Samelson, Tanaka, Tanaka, Thompson, Van Den Bedem, Woldeyes, Yumoto, Zhao, Tono, Boutet, Iwata, Gonen, Sauter, Fraser and Thompson2020).
At synchrotron sources with monochromatic beams, the time resolution is currently limited to millisecond timescales (Stellato et al., Reference Stellato, Oberthür, Liang, Bean, Gati, Yefanov, Barty, Burkhardt, Fischer, Galli, Kirian, Meyer, Panneerselvam, Yoon, Chervinskii, Speller, White, Betzel, Meents and Chapman2014; Nogly et al., Reference Nogly, James, Wang, White, Zatsepin, Shilova, Nelson, Liu, Johansson, Heymann, Jaeger, Metz, Wickstrand, Wu, Båth, Berntsen, Oberthuer, Panneels, Cherezov, Chapman, Schertler, Neutze, Spence, Moraes, Burghammer, Standfuss and Weierstall2015; Jaeger et al., Reference Jaeger, Dworkowski, Nogly, Milne, Wang and Standfuss2016; Weinert et al., Reference Weinert, Olieric, Cheng, Brünle, James, Ozerov, Gashi, Vera, Marsh, Jaeger, Dworkowski, Panepucci, Basu, Skopintsev, Doré, Geng, Cooke, Liang, Prota, Panneels, Nogly, Ermler, Schertler, Hennig, Steinmetz, Wang and Standfuss2017). Synchrotrons with a polychromatic ‘pink’ beam offer increased photon flux and 100 ps X-ray pulse exposures (Meents et al., Reference Meents, Wiedorn, Srajer, Henning, Sarrou, Bergtholdt, Barthelmess, Reinke, Dierksmeyer, Tolstikova, Schaible, Messerschmidt, Ogata, Kissick, Taft, Manstein, Lieske, Oberthuer, Fischetti and Chapman2017; Martin-Garcia et al., Reference Martin-Garcia, Zhu, Mendez, Lee, Chun, Li, Hu, Subramanian, Kissick, Ogata, Henning, Ishchenko, Dobson, Zhang, Weierstall, Spence, Fromme, Zatsepin, Fischetti, Cherezov and Liu2019). The promise of the ‘pink’ beam to accelerate serial crystallography is offset by higher backgrounds and less straightforward data processing (Förster and Schulze-Briese, Reference Förster and Schulze-Briese2019). Creative ways to deposit microcrystals into the X-ray beam in random orientations are increasing steadily. While most of these were originally developed for XFEL beamlines, many are amenable to being adapted by microfocus synchrotron beamlines. These include high-viscosity injection (Botha et al., Reference Botha, Nass, Barends, Kabsch, Latz, Dworkowski, Foucar, Panepucci, Wang, Shoeman, Schlichting and Doak2015; Nogly et al., Reference Nogly, James, Wang, White, Zatsepin, Shilova, Nelson, Liu, Johansson, Heymann, Jaeger, Metz, Wickstrand, Wu, Båth, Berntsen, Oberthuer, Panneels, Cherezov, Chapman, Schertler, Neutze, Spence, Moraes, Burghammer, Standfuss and Weierstall2015; Kovácsová et al., Reference Kovácsová, Grünbein, Kloos, Barends, Schlesinger, Heberle, Kabsch, Shoeman, Doak and Schlichting2017; Martin-Garcia et al., Reference Martin-Garcia, Conrad, Nelson, Stander, Zatsepin, Zook, Zhu, Geiger, Chun, Kissick, Hilgart, Ogata, Ishchenko, Nagaratnam, Roy-Chowdhury, Coe, Subramanian, Schaffer, James, Ketwala, Venugopalan, Xu, Corcoran, Ferguson, Weierstall, Spence, Cherezov, Fromme, Fischetti and Liu2017), flowing crystals through quartz capillaries (Stellato et al., Reference Stellato, Oberthür, Liang, Bean, Gati, Yefanov, Barty, Burkhardt, Fischer, Galli, Kirian, Meyer, Panneerselvam, Yoon, Chervinskii, Speller, White, Betzel, Meents and Chapman2014), low sample consumption microfluidic flow-focusing (Pawate et al., Reference Pawate, Šrajer, Schieferstein, Guha, Henning, Kosheleva, Schmidt, Ren, Kenis and Perry2015; de Wijn et al., Reference De Wijn, Hennig, Roche, Engilberge, Rollet, Fernandez-Millan, Brillet, Betat, Mörl, Roussel, Girard, Mueller-Dieckmann, Fox, Olieric, Gavira, Lorber and Sauter2019; Monteiro et al., Reference Monteiro, Vakili, Harich, Sztucki, Meier, Horrell, Josts and Trebbin2019) using 3D printed devices (Monteiro et al., Reference Monteiro, Von Stetten, Stohrer, Sans, Pearson, Santoni, Van Der Linden and Trebbin2020) and stable ultrasonic acoustic levitation of microliter droplets (Tsujino and Tomizaki, Reference Tsujino and Tomizaki2016). Ongoing work addresses problems with clogging and flow-speed of microfluidics, bubble generation, viscous stream focusing, deposition of varied-sized crystals, and sample consumption to enable the routine, uninterrupted collection of serial crystallography data. Popular fixed-target approaches include in situ deposition of crystal-containing drops on a humidity-controlled hit-and-return chip (Baxter et al., Reference Baxter, Aguila, Alonso-Mori, Barnes, Bonagura, Brehmer, Brunger, Calero, Caradoc-Davies, Chatterjee, Degrado, Fraser, Ibrahim, Kern, Kobilka, Kruse, Larsson, Lemke, Lyubimov, Manglik, Mcphillips, Norgren, Pang, Soltis, Song, Thomaston, Tsai, Weis, Woldeyes, Yachandra, Yano, Zouni and Cohen2016; Mehrabi et al., Reference Mehrabi, Schulz, Dsouza, Müller-Werkmeister, Tellkamp, Miller and Pai2019b; Mehrabi et al., Reference Mehrabi, Müller-Werkmeister, Leimkohl, Schikora, Ninkovic, Krivokuca, Andriček, Epp, Sherrell, Owen, Pearson, Tellkamp, Schulz and Miller2020), sandwiched between mylar, kapton, or cyclic-olefin-copolymer foils (Schubert et al., Reference Schubert, Kapis, Gicquel, Bourenkov, Schneider, Heymann, Betzel and Perbandt2016; Broecker et al., Reference Broecker, Morizumi, Ou, Klingel, Kuo, Kissick, Ishchenko, Lee, Xu, Makarov, Cherezov, Ogata and Ernst2018; Doak et al., Reference Doak, Nass Kovacs, Gorel, Foucar, Barends, Grünbein, Hilpert, Kloos, Roome, Shoeman, Stricker, Tono, You, Ueda, Sherrell, Owen and Schlichting2018; Feiler et al., Reference Feiler, Wallacher and Weiss2019; Wierman et al., Reference Wierman, Paré-Labrosse, Sarracini, Besaw, Cook, Oghbaey, Daoud, Mehrabi, Kriksunov, Kuo, Schuller, Smith, Ernst, Szebenyi, Gruner, Miller and Finke2019), on micropatterned silicon chips (Mueller et al., Reference Mueller, Marx, Epp, Zhong, Kuo, Balo, Soman, Schotte, Lemke, Owen, Pai, Pearson, Olson, Anfinrud, Ernst and Dwayne Miller2015; Roedig et al., Reference Roedig, Duman, Sanchez-Weatherby, Vartiainen, Burkhardt, Warmer, David, Wagner and Meents2016; Meents et al., Reference Meents, Wiedorn, Srajer, Henning, Sarrou, Bergtholdt, Barthelmess, Reinke, Dierksmeyer, Tolstikova, Schaible, Messerschmidt, Ogata, Kissick, Taft, Manstein, Lieske, Oberthuer, Fischetti and Chapman2017; Owen et al., Reference Owen, Axford, Sherrell, Kuo, Ernst, Schulz, Miller and Mueller-Werkmeister2017; Ebrahim et al., Reference Ebrahim, Appleby, Axford, Beale, Moreno-Chicano, Sherrell, Strange, Hough and Owen2019a) or transported into the beam by a conveyor-belt like tape drive (Roessler et al., Reference Roessler, Kuczewski, Stearns, Ellson, Olechno, Orville, Allaire, Soares and Héroux2013; Beyerlein et al., Reference Beyerlein, Dierksmeyer, Mariani, Kuhn, Sarrou, Ottaviano, Awel, Knoska, Fuglerud, Jönsson, Stern, Wiedorn, Yefanov, Adriano, Bean, Burkhardt, Fischer, Heymann, Horke, Jungnickel, Kovaleva, Lorbeer, Metz, Meyer, Morgan, Pande, Panneerselvam, Seuring, Tolstikova, Lieske, Aplin, Roessle, White, Chapman, Meents and Oberthuer2017). Another option is to directly grow crystals on an in situ micropatterned silicon chip. This minimizes crystal handling, allows the manipulation of sensitive crystals, and enables ligand soaking for serial crystallography (Lieske et al., Reference Lieske, Cerv, Kreida, Komadina, Fischer, Barthelmess, Fischer, Pakendorf, Yefanov, Mariani, Seine, Ross, Crosas, Lorbeer, Burkhardt, Lane, Guenther, Bergtholdt, Schoen, Törnroth-Horsefield, Chapman and Meents2019). Predetermining crystal positions on the chip accelerates crystal alignment and improves hit rates under controlled humidity conditions (Oghbaey et al., Reference Oghbaey, Sarracini, Ginn, Pare-Labrosse, Kuo, Marx, Epp, Sherrell, Eger, Zhong, Loch, Mariani, Alonso-Mori, Nelson, Lemke, Owen, Pearson, Stuart, Ernst, Mueller-Werkmeister and Miller2016). For more detailed accounts on creative sample delivery systems refer to articles such as Martiel et al. (Reference Martiel, Müller-Werkmeister and Cohen2019), Grünbein and Nass Kovacs (Reference Grünbein and Nass Kovacs2019), Zhao et al. (Reference Zhao, Zhang, Yan, Sun, Wang, He and Yin2019), and references therein.
After: what to do with RTX data
One thing to note upon processing a RTX dataset is that the mosaicity is often less than that of comparable cryogenic datasets (Garman and Doublié, Reference Garman and Doublié2003; Moreau et al., Reference Moreau, Atakisi and Thorne2019). Reduced mosaicity maximizes the data quality and resolution limit (Mitchell and Garman, Reference Mitchell and Garman1994), thereby counteracting accelerated diffraction decay that decreases the resolution. Higher isomorphism among RTX datasets (Fischer et al., Reference Fischer, Shoichet and Fraser2015) also enables the better merging of data from multiple crystals (see the section ‘collecting and merging data from multiple crystals’). Provided that the data quality is high, resolutions of less than ~1.8 Å are best to model alternative conformations. At lower than 2.5 Å, modeling alternative conformations is limited but conserved water molecules are still captured, whereas, with lower resolution, fewer alternative features will be accessible. However, we remain confident that the observed conformations in RTX data are undistorted by idiosyncrasies of the flash-cooling protocol. When processing RTX data, it is of utmost importance to track signs of radiation damage and conservatively cut the data accordingly (see the section ‘reducing radiation damage’). Crystals with high symmetry reduce the amount of data that is needed to collect or increase redundancy. Accounting for radiation damage during and after data collection is crucial to ensure that the observed conformational variance is indeed caused by temperature and not by radiation damage (Russi et al., Reference Russi, Gonzalez, Kenner, Keedy, Fraser and Van Den Bedem2017).
Modeling heterogeneity
Resulting high-resolution RTX data have inspired the development of a set of new tools that assist refinement, modeling, and analysis of alternative conformations. Originally, in the context of collecting anomalous data, Diederichs et al. introduced a simple partial correction for intensity decay of reflections following radiation damage via a redundancy-based ‘zero dose extrapolation’ that leads to enhanced electron density maps (Diederichs et al., Reference Diederichs, McSweeney and Ravelli2003). On the refinement end, available tools include qFit and Phenix. The qFit algorithm uses an iterative procedure to represent discrete heterogeneity by fitting multi-conformers that are commonly ignored during manual model building into electron density maps (Fig. 4d). Since its initial implementation, qFit has expanded from side-chain rotamers (van den Bedem et al., Reference Van Den Bedem, Dhanik, Latombe and Deacon2009) to backbone heterogeneity (Keedy et al., Reference Keedy, Fraser and Van Den Bedem2015a) and to ligands (van Zundert et al., Reference Van Zundert, Hudson, De Oliveira, Keedy, Fonseca, Heliou, Suresh, Borrelli, Day, Fraser and Van Den Bedem2018). The new release of qFit 3 expands the work into single-particle cryoEM density maps (Riley et al., Reference Riley, Wankowicz, De Oliveira, Van Zundert, Hogan, Fraser, Keedy and Van Den Bedem2020). Phenix offers occupancy-refinement and ensemble-refinement strategies based on time averaging of simple molecular dynamics simulations to model X-ray data better than single structures (Burnley et al., Reference Burnley, Afonine, Adams and Gros2012). None of these automated methods is the panacea. They support rather than replace careful inspection of the electron density maps by an experienced crystallographer. Inspiration for modeling and analysis can also come from other helpful tools such as Ringer and CONTACT. Ringer is the quantitative, automated alternative to qualitative, manual inspection of electron density maps within Coot (Emsley et al., Reference Emsley, Lohkamp, Scott and Cowtan2010). Ringer samples electron density maps around dihedral angles of each protein residue (Lang et al., Reference Lang, Ng, Fraser, Corn, Echols, Sales, Holton and Alber2010). Statistical evidence supports modeling of alternative conformations below the traditional 1 sigma cutoff, even down to about 0.3 sigma (Fig. 4c). The result is more reflective of the polymorphic nature of proteins than a single structure (Fraser et al., Reference Fraser, Van Den Bedem, Samelson, Lang, Holton, Echols and Alber2011). For those interested in allostery, the CONTACT algorithm identifies networks of correlated motions of conformationally heterogeneous residues (van den Bedem et al., Reference Van Den Bedem, Bhabha, Yang, Wright and Fraser2013) (Fig. 4e–f). Sterically mutually exclusive placement of neighboring residues can form a functional network that links remote effector sites to the active site. The observation that such functional networks have been identified independently via co-evolving amino acids may present a framework to combine a phylogenetic with a dynamic view of protein evolvability (van den Bedem and Fraser, Reference Van Den Bedem and Fraser2015).
AFTER – Working with room temperature data; exemplified for two proteins, cytochrome C peroxidase gateless mutant (CCP; panels a–c) and dihydrofolate reductase (DHFR; panels d–f). (a) Crystallographic data of CCP (grey surface) bound to benzimidazole were collected from the same crystal at RT (4xv5, red) and cryogenic temperature (4nve, cyan). Green difference electron density shows that only at RT does His96 occupy an alternative ‘open’ conformation, revealing a transient secondary site that is occupied by benzimidazole, whereas water occupies the ‘closed’ site at cryo. (b) Overview of CCP with the ligand cavity in yellow and distal cryptic site is highlighted by a red dashed ellipsoid. (c) Ringer plot of CCP bound to another ligand, 2-amino-5-methylthiazole, shows an alternate conformation of Glu199 near the cavity site at RT (red line) [below the common threshold of 1 sigma (Fraser et al., Reference Fraser, Van Den Bedem, Samelson, Lang, Holton, Echols and Alber2011)] that is hidden at cryogenic temperature (blue line). (d) Multi-conformer model of DHFR built by qFit with alternate conformations B in magenta, C in cyan, and the NADP+ cofactor (NAP) and folate (FOL) in yellow sticks. (e) Nine CONTACT networks are mapped onto the DHFR structure (in the same orientation as in d). (f) The largest network identified by CONTACT contains 15 residues (sequence numbers given in nodes) and the NAP ligand. Edges connect nodes of clashing residues that are relieved by alternative conformations.

Looking back and moving forward – lessons learned
I will close with several case studies in which RTX has recently contributed dynamic, high-resolution insights into the biophysics and function of soluble proteins and membrane-bound proteins (Martin-Garcia et al., Reference Martin-Garcia, Conrad, Nelson, Stander, Zatsepin, Zook, Zhu, Geiger, Chun, Kissick, Hilgart, Ogata, Ishchenko, Nagaratnam, Roy-Chowdhury, Coe, Subramanian, Schaffer, James, Ketwala, Venugopalan, Xu, Corcoran, Ferguson, Weierstall, Spence, Cherezov, Fromme, Fischetti and Liu2017). These examples were selected as conceptual and experimental templates for the design of RT-inspired experiments, rather than to exhaustively review the depth and breadth of the available literature.
Integrated approaches
RTX studies have the most impact when they are used in combination with complementary methods to illuminate an unappreciated aspect of biological function. RTX studies of proline isomerase cyclophilin A (CypA) revealed hidden conformational states that are important for catalysis (Fraser et al., Reference Fraser, Clarkson, Degnan, Erion, Kern and Alber2009). To populate this conformation, a mutation was designed that inverted the conformational states observed at equilibrium and correlated with catalytic rates of the enzyme. In combination with nuclear magnetic resonance (NMR) analysis, this demonstrated the strength of RTX in accessing functional protein dynamics. Correlation between fluctuations detected by NMR in solution and RT electron density maps were also discovered for the oncogenic-signaling switch protein Ras (Scheidig et al., Reference Scheidig, Burmester and Goody1999; Fraser et al., Reference Fraser, Van Den Bedem, Samelson, Lang, Holton, Echols and Alber2011). Revealing the structural origin for this allosteric network provided insights into a catalytically competent conformation of Ras that aids mechanistic understanding of Ras inhibition (Lu et al., Reference Lu, Jang, Gu, Zhang and Nussinov2016). Another powerful combination of methods at RT is joint X-ray/neutron refinement. Intricacies of H-bonding were revealed for several different proteins. A cGMP-dependent protein kinase joint X-ray/neutron refinement of RT data suggests that the conformation of an arginine interacting with cGMP is more dynamic than previously appreciated and it is ‘frozen-out’ in the low-temperature structure (Huang et al., Reference Huang, Gerlits, Blakeley, Sankaran, Kovalevsky and Kim2014). The same group also discovered an unprecedented low-barrier H-bond in concanavalin A, a legume lectin with anticancer potential (Gerlits et al., Reference Gerlits, Coates, Woods and Kovalevsky2017b). Another study found that interactions between an HIV protease triple-mutant with the inhibitor amprenavir are not as significantly altered as proposed on the basis of a cryogenic structure (Gerlits et al., Reference Gerlits, Keen, Blakeley, Louis, Weber and Kovalevsky2017a). Most recently, RT neutron and X-ray data were collected on the main protease of SARS-CoV-2 (Kneller et al., Reference Kneller, Phillips, Kovalevsky and Coates2020a) for which RT X-ray studies have revealed novel backbone conformations in the P5 binding pocket (Kneller et al., Reference Kneller, Phillips, O'neill, Jedrzejczak, Stols, Langan, Joachimiak, Coates and Kovalevsky2020b).
The comparison of structural ensembles of CypA collected at synchrotron and XFEL sources confirms the agreement between both methods and motivates experiments that resolve the temperature- and time-coordinate of protein functional dynamics (Keedy et al., Reference Keedy, Kenner, Warkentin, Woldeyes, Hopkins, Thompson, Brewster, Van Benschoten, Baxter, Uervirojnangkoorn, Mcphillips, Song, Alonso-Mori, Holton, Weis, Brunger, Soltis, Lemke, Gonzalez, Sauter, Cohen, Van Den Bedem, Thorne and Fraser2015b). As this review focuses on synchrotron RTX, I refer to topical reviews that highlight the value of XFEL RT studies to investigate the important target class of membrane-associated proteins, such as Neutze et al. (Reference Neutze, Brändén and Schertler2015), Martin-Garcia et al. (Reference Martin-Garcia, Conrad, Coe, Roy-Chowdhury and Fromme2016), Mishin et al. (Reference Mishin, Gusach, Luginina, Marin, Borshchevskiy and Cherezov2019), Wickstrand et al. (Reference Wickstrand, Nogly, Nango, Iwata, Standfuss and Neutze2019).
Variable temperature crystallography
Variable temperature crystallography uses discrete temperature steps to sample the protein conformational landscape (Keedy, Reference Keedy2019). Given the experimental obstacles, there are only a few examples of ‘temperature titrations’ since the pioneering efforts mentioned above (Frauenfelder et al., Reference Frauenfelder, Petsko and Tsernoglou1979; Tilton et al., Reference Tilton, Dewan and Petsko1992). A further two decades later, variable temperature crystallography was used to study the complex evolution of conformational heterogeneity for CypA across a range of eight temperatures. The authors found that instead of a single concerted movement across the protein, different parts of the protein have different transition temperatures (Keedy et al., Reference Keedy, Kenner, Warkentin, Woldeyes, Hopkins, Thompson, Brewster, Van Benschoten, Baxter, Uervirojnangkoorn, Mcphillips, Song, Alonso-Mori, Holton, Weis, Brunger, Soltis, Lemke, Gonzalez, Sauter, Cohen, Van Den Bedem, Thorne and Fraser2015b). Temperature changes have also been used to analyze flavodoxin oxidation states (Watt et al., Reference Watt, Tulinsky, Swenson and Watenpaugh1991), and the in crystallo thermodynamics of conformational states of a redox quinone co-factor in bacterial copper amine oxidase during the catalytic reaction (Murakawa et al., Reference Murakawa, Baba, Kawano, Hayashi, Yano, Kumasaka, Yamamoto, Tanizawa and Okajima2019). Advances in collecting high-temperature datasets at 293–363 K promise future temperature explorations of the conformational landscape beyond proteinase K, thaumatin, and lysozyme (Doukov et al., Reference Doukov, Herschlag and Yabukarski2020).
Ligands
Conformational heterogeneity is present not only in protein structures but also in ligands. Ligands adopt a wide range of conformations upon binding to proteins. This is especially true for small-molecule fragments that bind with low affinity and high promiscuity. However, finding evidence for multiple binding modes within an averaged electron density map can be difficult. To address this shortcoming, qFit-ligand was developed to find often isoenergetic, unmodeled conformations of drug-like molecules within crystal structures (van Zundert et al., Reference Van Zundert, Hudson, De Oliveira, Keedy, Fonseca, Heliou, Suresh, Borrelli, Day, Fraser and Van Den Bedem2018). For PDB structures of cancer target BRD4, the method revealed that as much as 29% of the protein crystal structures showed evidence of unmodeled protein–ligand interactions that would have been informative to guide compound design (Raich et al., Reference Raich, Meier, Günther, Christ, Noé and Olsson2020). Generally, one rarely finds ligand sites 100% occupied, as they are typically modeled. Especially at RT, ligand binding is thermodynamically less favorable (Fischer et al., Reference Fischer, Shoichet and Fraser2015). Hence ligand complexes should be modeled as ensembles of bound and unbound states (Pearce et al., Reference Pearce, Krojer and Von Delft2017).
Computational ligand discovery struggles from weighting energy penalties of relevant conformational states when looking for ligands in large databases. In a study of model protein cytochrome C peroxidase, the RT structure of the apo state visualized three conformational states of the protein that could be used in docking (Fischer et al., Reference Fischer, Coleman, Fraser and Shoichet2014). Their relative occupancies were used to calculate Boltzmann-weighted energy penalties in docking. Using this approach, the authors identified ligands that stabilized specific conformational states that would not have been identified at cryo. Furthermore, comparisons of pairwise cryo–RT datasets of protein-ligand complexes provided insights into systematic structural differences (Fischer et al., Reference Fischer, Shoichet and Fraser2015). For instance, side chains near the canonical ligand-binding site were remodeled in response to temperature (Fig. 4c). If only the cryo dataset was considered, as is common in computational drug discovery, these changes may have been mistaken for genuine responses to ligand binding, rather than temperature artifacts. Strikingly, the remodeling of a distal residue exposed a remote cryptic site that was hidden in the cryogenic structure collected on the same crystal (Fig. 4a).
Allostery and mutations
Allostery is often mediated by correlated motions across the protein (Mehrabi et al., Reference Mehrabi, Schulz, Dsouza, Müller-Werkmeister, Tellkamp, Miller and Pai2019b). The CONTACT algorithm capitalizes on the exchange between conformational substates that can be revealed in RTX electron density maps (van den Bedem et al., Reference Van Den Bedem, Bhabha, Yang, Wright and Fraser2013). In a study of E. coli dihydrofolate reductase, CONTACT recapitulated the effect of an allosteric mutation seen by NMR chemical-shift perturbations. This demonstrated that altering optimized contact networks of coordinated motions can impair catalytic function. In an endeavor to discover new allosteric sites for the diabetes target protein tyrosine phosphatase 1B, the active-site WPD loop opening was revealed at elevated temperatures (Keedy et al., Reference Keedy, Hill, Biel, Kang, Rettenmaier, Brandão-Neto, Pearce, Von Delft, Wells and Fraser2018). However, loop occupancies did not increase linearly with temperature. A new sample delivery system for serial RTX helped track long-range interactions and higher-energy conformations that appear to be critical for substrate access to the active site of trans-acyltransferase (Mathews et al., Reference Mathews, Allison, Robbins, Lyubimov, Uervirojnangkoorn, Brunger, Khosla, Demirci, Mcphillips, Hollenbeck, Soltis and Cohen2017).
Like temperature and ligands, mutations represent another perturbation of protein structure. Such unintentional mutations may arise to confer resistance to anti-cancer, anti-bacterial, anti-viral, or anti-fungal treatment. Understanding the effect of mutation on protein structure is also key to intentionally inform protein engineering in the pursuit of guiding the design of new protein function. Laboratory evolution of protein function takes many rounds of optimization. During the initial directed evolution, using the increase in flexibility as a guide to escape local energy minima emerged as the most promising strategy to increase the binding affinity of redesigned ubiquitin variants to the deubiquitinase USP7 (Biel et al., Reference Biel, Thompson, Cunningham, Corn and Fraser2017). Other work on laboratory evolution of a designed Kemp eliminase used RTX to recapitulate shifts in the conformational ensemble towards catalytically-productive sub-states (Broom et al., Reference Broom, Rakotoharisoa, Thompson, Zarifi, Nguyen, Mukhametzhanov, Liu, Fraser and Chica2020). This suggests that RTX guided ensemble modeling can help inform directed evolution efforts. In a recent study, a combination of thermodynamic cycles and RTX was used to track perturbations in water networks. While delicate shifts in water positions are often ignored, introducing subtle changes in the protein and ligands demonstrated that water networks contribute substantially to the binding of congeneric sialic acid ligands to virulence protein SiaP (Darby et al., Reference Darby, Hopkins, Shimizu, Roberts, Brannigan, Turkenburg, Thomas, Hubbard and Fischer2019).
Conclusion and outlook
While the number of structures deposited in the PDB has increased exponentially over the past two decades, RT structures represent only a small fraction (~6%) of the more than 169 000 structures (as of October 2020). RTX has great potential to offer novel insights into protein structure and functional dynamics, complementary to cryogenic methods, which will undoubtedly persevere. By resolving several myths that deter most experimenters from conducting routine RTX data collection at synchrotrons, I want to facilitate the planning, collection, and interpretation of RTX data. Considering the method's merits, I hope to spark a renaissance in RTX methods, contrary to the trend observed in Fig. 1.
(Im)practicalities of RTX data collection include: Myth 1 – Preparing for RTX data collection is tedious. I laid out simple alternatives to preparing crystals for RTX data collection beyond tales of tedious capillary mounting. Myth 2 – It is not possible to collect a complete dataset before radiation damage or dehydration destroys the crystal. Using the experimental setup described above, we have on several occasions, and for unrelated proteins, successfully collected multiple consecutive datasets on a single protein crystal. Anecdotally, for cytochrome C peroxidase, we collected three complete consecutive datasets before the resolution fell below 2 Å and seven datasets before it was less than 3 Å (Fischer et al., Reference Fischer, Shoichet and Fraser2015). Reassuringly, with the right measures in place, protein conformational variation at RT is observed in spite of radiation damage and not as a result of it (Russi et al., Reference Russi, Gonzalez, Kenner, Keedy, Fraser and Van Den Bedem2017; Gotthard et al., Reference Gotthard, Aumonier, De Sanctis, Leonard, Von Stetten and Royant2019). Myth 3 – One cannot collect high-resolution data at RT. Remarkably, the distribution of resolutions of RT structures closely resembles that of all PDB structures (Fig. 1): about 50% of all RT structures are collected to less than 2 Å, and over 75% are collected to less than 2.5 Å resolution. Although one may argue a bias toward well-diffracting crystals, we find across diverse projects that sufficiently large (⩾100 μM), well-diffracting (<2 Å) crystals at cryogenic temperatures often achieve similar resolutions (±0.5 Å) at RT. For instance, we observed comparable average resolutions of 1.6 Å at RT and 1.4 Å at cryogenic temperature for six dataset pairs collected at both temperatures on the same crystal (Fischer et al., Reference Fischer, Shoichet and Fraser2015). Recent studies showed that RTX data collection is even amenable to ‘difficult’ crystals, like membrane proteins in the lipid cubic phase, which can diffract to <1.5 Å at RT as shown for the XFEL study on the influenza M2 proton channel (Thomaston et al., Reference Thomaston, Woldeyes, Nakane, Yamashita, Tanaka, Koiwai, Brewster, Barad, Chen, Lemmin, Uervirojnangkoorn, Arima, Kobayashi, Masuda, Suzuki, Sugahara, Sauter, Tanaka, Nureki, Tono, Joti, Nango, Iwata, Yumoto, Fraser and Degrado2017). Retrospectively, about twice as many cryo structures achieve resolutions <1.5 Å compared to those collected at RT (Fig. 1). However, we need not confuse precision with accuracy – despite increased chances for high resolution diffraction at cryo, residues may still be distorted or missed entirely as discussed above.
It is worth reiterating that despite the promise of dynamic insights gained, radiation damage can limit or mislead model interpretation, even at very low absorbed doses for radiation-sensitive proteins (Ebrahim et al., Reference Ebrahim, Moreno-Chicano, Appleby, Chaplin, Beale, Sherrell, Duyvesteyn, Owada, Tono, Sugimoto, Strange, Worrall, Axford, Owen and Hough2019b). Careful planning and execution of experiments is crucial to avoid general (Holton, Reference Holton2009) and specific (Garman and Weik, Reference Garman and Weik2017) radiation damage at any temperature, but cryogenic data are more forgiving by a couple orders of magnitude (see the section ‘reducing radiation damage’). Merging data from multiple isomorphous crystals allows discarding those segments of data from each crystal that are compromised by radiation damage and assemble data from several crystals into a complete, undamaged data set (see the section ‘collecting and merging data from multiple crystals’). Nonetheless, several examples demonstrate that structural models at RT provide new insights into protein dynamics underlying function (Fraser et al., Reference Fraser, Clarkson, Degnan, Erion, Kern and Alber2009), ligand binding and discovery (Fischer et al., Reference Fischer, Coleman, Fraser and Shoichet2014, Reference Fischer, Shoichet and Fraser2015), and water dynamics (Thomaston et al., Reference Thomaston, Woldeyes, Nakane, Yamashita, Tanaka, Koiwai, Brewster, Barad, Chen, Lemmin, Uervirojnangkoorn, Arima, Kobayashi, Masuda, Suzuki, Sugahara, Sauter, Tanaka, Nureki, Tono, Joti, Nango, Iwata, Yumoto, Fraser and Degrado2017; Darby et al., Reference Darby, Hopkins, Shimizu, Roberts, Brannigan, Turkenburg, Thomas, Hubbard and Fischer2019), with many opportunities to extend into other fields like protein engineering and design (Biel et al., Reference Biel, Thompson, Cunningham, Corn and Fraser2017; Broom et al., Reference Broom, Rakotoharisoa, Thompson, Zarifi, Nguyen, Mukhametzhanov, Liu, Fraser and Chica2020). Ongoing methodological advances will further bolster the ability to collect physiologically relevant data (Helliwell, Reference Helliwell2020) at synchrotrons and XFELs.
One can imagine changing other variables despite temperature to perturb the protein conformational landscape such as pH (Socher and Sticht, Reference Socher and Sticht2016), humidity (Sanchez-Weatherby et al., Reference Sanchez-Weatherby, Bowler, Huet, Gobbo, Felisaz, Lavault, Moya, Kadlec, Ravelli and Cipriani2009; Douangamath et al., Reference Douangamath, Aller, Lukacik, Sanchez-Weatherby, Moraes and Brandao-Neto2013), substrates (Schmidt, Reference Schmidt2013; Mehrabi et al., Reference Mehrabi, Schulz, Agthe, Horrell, Bourenkov, Von Stetten, Leimkohl, Schikora, Schneider, Pearson, Tellkamp and Miller2019a), pressure (Collins et al., Reference Collins, Kim and Gruner2011), electric field pulses (Hekstra et al., Reference Hekstra, White, Socolich, Henning, Šrajer and Ranganathan2016), time (Schulz et al., Reference Schulz, Mehrabi, Müller-Werkmeister, Tellkamp, Jha, Stuart, Persch, De Gasparo, Diederich, Pai and Miller2018), ionic strength, oxygen, co-factors etc. – either individually or in combination. The key will be to disentangle the range of induced changes and link them to functional consequences via the integration of complementary methods and development of new collection and analysis schemes.
In the process of leveraging the potential of RTX it is important to strike a fine balance: resist the temptation of hastily drawing functional conclusions but explore ways to pragmatically use and synergistically complement RTX dynamic information. For instance, while computational docking implementations routinely discard carefully modeled alternative states in ‘preparation’ for virtual library screens, RTX data have been useful to inform energy penalties in ligand discovery (Fischer et al., Reference Fischer, Coleman, Fraser and Shoichet2014). Likewise, computational methods on the other end of the speed-versus-accuracy continuum, such as free-energy-of-binding calculations, may benefit from RTX input. The most powerful implementation is an integrated approach, where RTX is combined with complementary dynamic methods such as NMR (Henzler-Wildman and Kern, Reference Henzler-Wildman and Kern2007; Fenwick et al., Reference Fenwick, Van Den Bedem, Fraser and Wright2014), single-molecule FRET microscopy (Juette et al., Reference Juette, Terry, Wasserman, Zhou, Altman, Zheng and Blanchard2014; Borgia et al., Reference Borgia, Borgia, Bugge, Kissling, Heidarsson, Fernandes, Sottini, Soranno, Buholzer, Nettels, Kragelund, Best and Schuler2018), molecular simulations (Bowman et al., Reference Bowman and Pande2014; Bottaro and Lindorff-Larsen, Reference Bottaro and Lindorff-Larsen2018), diffuse scattering (Wall et al., Reference Wall, Adams, Fraser and Sauter2014; Meisburger et al., Reference Meisburger, Thomas, Watkins and Ando2017), and hydrogen-deuterium exchange mass spectrometry (Oganesyan et al., Reference Oganesyan, Lento and Wilson2018; Masson et al., Reference Masson, Burke, Ahn, Anand, Borchers, Brier, Bou-Assaf, Engen, Englander, Faber, Garlish, Griffin, Gross, Guttman, Hamuro, Heck, Houde, Iacob, Jørgensen, Kaltashov, Klinman, Konermann, Man, Mayne, Pascal, Reichmann, Skehel, Snijder, Strutzenberg, Underbakke, Wagner, Wales, Walters, Weis, Wilson, Wintrode, Zhang, Zheng, Schriemer and Rand2019) to better characterize the protein conformational landscape of functionally relevant motions. Even for well-studied biomolecules, an integrative dynamic view of protein function will advance basic and biomedical research.
Acknowledgements
I thank Dr. AJ McArthur and CM Fischer for critical reading of the manuscript, and Drs. JS Fraser, JM Holton and RA Nicholls for insightful discussions. This work was supported by ALSAC, St. Jude Children's Research Hospital.
Conflict of interest
None to declare.


 Open access