

The Institute for Prehistory and Archaeological Science (IPAS) is currently investigating the reason behind the changes in cattle (Bos taurus) size observed between the Neolithic and the Middle Ages in Switzerland and other locations in Europe (e.g. Bökönyi 1988). The study combines classic archaeozoological research with molecular genetics (ancient DNA).
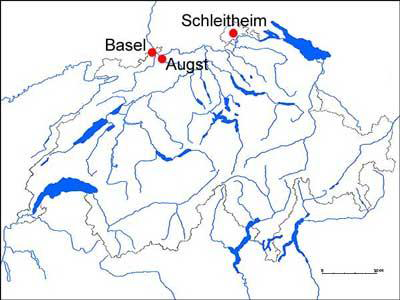
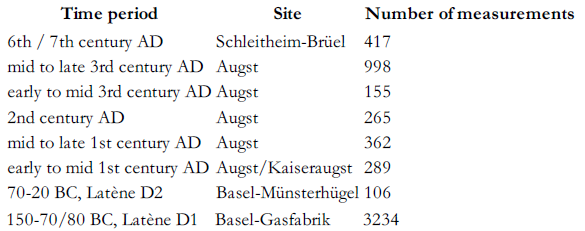
In Northern Switzerland large amounts of taurine bones were excavated at Basel, Augst/Kaiseraugst and at Schleitheim (Fig. 1) (Reference BreuerBreuer et al. 1999). The sites are of major importance in Switzerland and are dated between the Late Iron Age and the Early Middle Ages (c. 150 BC - 700 AD) (Table 1). 5826 bone measurements were analysed by calculating logarithmic size indices (LSI). The index combines breath and depth measurements and is a useful indicator for cattle size (Reference MeadowMeadow 1984).
Location of archaeological sites in Northern Switzerland from which bones were used in this project. Canton Basel: the excavations Gasfabrik and Münsterhügel, both Late Iron Age settlements, c. 150-20BC. Canton Baselland/Aargau: the Roman colonia Augusta Raurica/Augst 15BC-300AD. Canton Schaffhausen: the excavation Schleitheim-Brüel, dated to Early Medieval times 600-700AD.


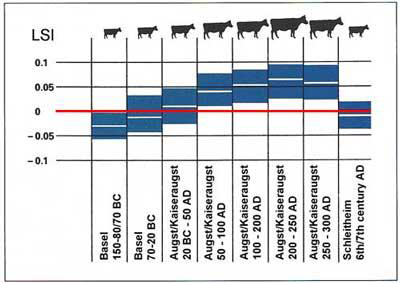
LSI increased simultaneously with the growing Roman influence during the 1st century BC until the 3rd century AD. Despite the overall increase in size, small animals were always present, even in the late Roman time where the highest values of LSI were determined. In the Early Medieval Period (c. 500-700 AD) LSI dropped to the pre-Roman level (Reference BreuerBreuer et al. 1999) (Fig. 2).
Changes in logarithmic size index (LSI) through time. Measurements are standardized using a Hinterwälder cow (red line; modified from (Reference FurgerFurger et al. 2001)).

What are the reasons behind those changes in cattle size? Changes in phenotype depend on either genetic constitution or management practices or a combination of both. The animals involved can be either indigenous or imported. The demand for bigger cattle in Roman times can be explained by the drastic changes in social structures and economy. Evidence for an initial import of large animals was reported for some Roman sites in the northern Alpine region (Reference PetersPeters 1998). However, in Switzerland the assemblage of cattle bones found does not allow an interpretation about the reasons using archaeozoological methods.
One possibility of tracing origins and movements is by analysing variations in DNA nucleotide sequences. They retain information about the ancestral history of populations or individuals. In cattle and other mammals, the female lineages are represented in the strictly maternally inherited mitochondrial DNA (mtDNA haplotype) (Reference HutchisonHutchison et al. 1974), whereas male history is reflected in the Y-chromosomal DNA. Both males and females can be traced through autosomal DNA (alleles). Molecular markers from these DNA sources have been succesfully used to study cattle domestication and migration e.g. (Reference BradleyBradley et al. 1996; Reference HanotteHanotte et al. 2000; Reference MacHughMacHugh et al. 1998; Reference MacHughMacHugh et al. 1997; Reference MirettiMiretti et al. 2002; Reference TroyTroy et al. 2001).
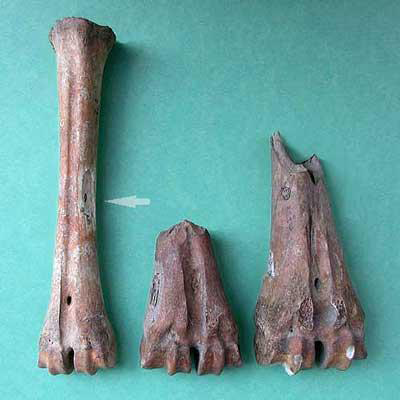
In this project we will analyse mitochondrial DNA and highly polymorphic autosomal and Y-chromosomal microsatellites from the archaeological bones used for the metrical analysis. The bones were selected according to the morphological classification into small, medium, large (Fig. 3) and the archaeological documentation e.g. exact dating. This enables us to correlate metric morphological and archaeological data with genetic data. The aim is to obtain sequence data from at least 50 bones representing 50 individuals for each time period. We will monitor the temporal distribution of haplotypes/alleles to explore statistically, if either the Romans imported new cattle into Switzerland or if indigenous cattle was better managed. Additionally it should be possible to trace sex biased influences by comparing mtDNA versus autosomal DNA or Y-chromosomal DNA.
Late Iron Age (left) metatarsus classified as small, and two Roman time metatarsi classified as medium (50-60 AD) and large (80-100AD). The arrow indicates where the bone surface was bleached and the uppermost layer of a small part was removed. Fine powder for DNA extraction was produced using a drill bit of the Dremel tool set.

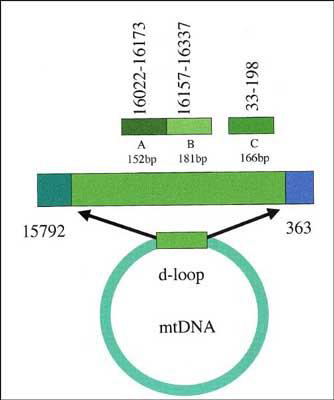
We started with the investigation of the hypervariable control region (displacement loop, d-loop, Fig. 4) of the mtDNA for following reasons: 1. more than thousand mitochondria are present in a single cattle cell and therefore a chance for DNA survival is higher, 2. the d-loop is highly variable (d-loop sequences show low geographic structuring and are not breed specific) and 3. large amounts of sequence information is already available in public databases to compare the data from archaelogical samples to. In modern European cattle one particular mitochondrial haplotype, T3 and its derivates are most abundant today (Reference TroyTroy et al. 2001)
Three PCR target regions within the d-loop of the mitochondrial DNA. The base pair positions are according to (Reference AndersonAnderson et al. 1982). Target A is the most variable region, target B is the region with the lowest variability.

Three target regions with different variability were amplified by PCR (polymerase chain reaction) which cover a length of 500bp (base pairs) of the 910bp of the d-loop (Fig. 4, 5a, 5b). PCR products were cloned and sequenced or directly sequenced (details will be published elsewhere).
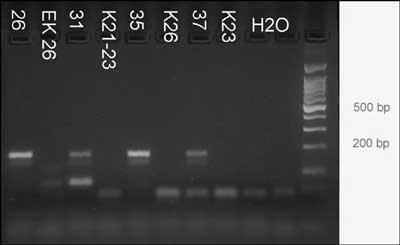
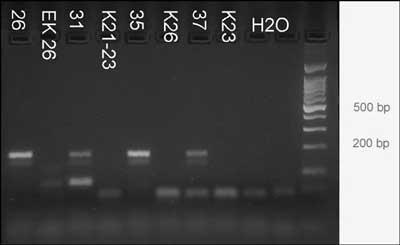
Example of 4 bones from Augusta Raurica. The bones are: 26: phalanx 1, medium size, dated to 30-40 AD; 31: tibia, large, dated 10-40AD; 35: humerus, large, dated to 80-100AD; 37: metatarsus, large, dated to 80-100AD.

DNA was extracted and target C was PCR amplified. The agarose gel shows bands of the expected size of 166bp after 70 cycles of amplification. No products are visible in the lanes of the negative controls Kn/EKn and H2O. Right lane = size marker 100bp DNA ladder, the postions of the 200bp and 500bp bands are indicated.

Preliminary experiments show that it is possible to PCR-amplify repeatedly all three target regions from a high percentage of Late Iron Age cattle bones from Basel-Gasfabrik and Roman cattle bones from Augusta Raurica. As expected, all sequences belong to the European main group, and bones with the T3 haplotype were identified (details will be published elsewhere).
In the future amplification of nuclear or male specific highly polymorphic microsatellites will be attempted to reveal male history and together with the mitochondrial data, a comprehensive view on ancient cattle populations.
Acknowledgements
This project is financed by Freiwillige Akademische Gesellschaft Basel, Römermuseum Augusta Raurica and Schweizerischer Nationalfonds zur Förderung der Wissenschaften.