





Introduction
A large body of research has shown that urban and rural inhabitants differ substantially in core political attitudes (e.g., del Horno, Rico, and Hernández Reference del Horno, Rico and Hernández2023; Kenny and Luca Reference Kenny and Luca2021; Luca, Terrero-Davila, Stein et al. Reference Luca, Terrero-Davila, Stein and Lee2023; Mitsch, Lee, and Ralph Morrow Reference Mitsch, Lee and Ralph Morrow2021), particularly, and increasingly so, on issues related to the transnational cleavage (Huijsmans, Harteveld, van der Brug et al. Reference Huijsmans, Harteveld, van der Brug and Lancee2021; Kenny and Luca Reference Kenny and Luca2021; Maxwell Reference Maxwell2019) – the growing political conflict around openness towards European integration and immigration (Bartolini Reference Bartolini2005; Hooghe and Marks Reference Hooghe and Marks2018; Kriesi, Grande, Lachat et al. Reference Kriesi, Grande, Lachat, Dolezal, Bornschier and Frey2006). While city dwellers tend to increasingly embrace European integration and immigration, the countryside is sceptical towards these transformations of their realm. Relatedly, support for Eurosceptic parties concentrates disproportionately outside large cities, especially in economically struggling regions across Europe (de Dominicis, Dijkstra, and Pontarollo Reference de Dominicis, Dijkstra and Pontarollo2022; Dijkstra, Poelman, and Rodríguez-Pose Reference Dijkstra, Poelman and Rodríguez-Pose2020; Essletzbichler, DIsslbacher, and Moser Reference Essletzbichler, DIsslbacher and Moser2018). This fits in a broader trend of increasingly different election outcomes – particularly for parties on opposite ends of the transnational cleavage – between urban and rural areas across many countries, including several European multiparty democracies (Huijsmans and Rodden Reference Huijsmans and Rodden2024; Rodden Reference Rodden2019; Taylor, Lucas, Armstrong et al. Reference Taylor, Lucas, Armstrong and Bakker2024).
While urban-rural residence is strongly linked to political conflict along the transnational cleavage, earlier literature has shown that educational attainment is the most consistent predictor of attitudes related to this cleavage: higher-educated citizens hold more positive attitudes towards immigration and European integration and are more likely to vote for parties that share these positions (Abou-Chadi and Hix Reference Abou-Chadi and Hix2021; Cavaille and Marshall Reference Cavaille and Marshall2019a; de Jong and Kamphorst Reference de Jong and Kamphorst2024; Hainmueller and Hiscox Reference Hainmueller and Hiscox2007; Hakhverdian, van Elsas, van der Brug et al. Reference Hakhverdian, van Elsas, van der Brug and Kuhn2013; Häusermann and Kriesi Reference Häusermann, Kriesi, Beramendi, Häusermann, Kitschelt and Kriesi2015; Lancee and Sarrasin Reference Lancee and Sarrasin2015; McNeil and Simon Reference McNeil and Simon2024). In turn, the far right is particularly popular among lower-educated voters (Golder Reference Golder2016; Hooghe, Marks, and Kamphorst Reference Hooghe, Marks and Kamphorst2024; Rydgren Reference Rydgren2013).
While scholars have extensively studied both the urban-rural and the educational patterns underlying the transnational cleavage separately, we do not understand how urban-rural and educational differences in voting along the transnational cleavage relate to each other. There are good reasons to expect that the urban-rural and educational differences in voting behaviour overlap, as the higher-educated more often move to (or stay in) cities than lower-educated citizens (Borjas, Bronars, and Trejo Reference Borjas, Bronars and Trejo1992; Ford and Jennings Reference Ford and Jennings2020; Storper Reference Storper2018), and because urban inhabitants are more likely to obtain higher education than people growing up in rural places (Zahl-Thanem and Rye Reference Zahl-Thanem and Rye2024). Therefore, attitudinal differences between urban and rural voters may be a ‘second-order manifestation of deeper demographic and cultural divides’ (Maxwell Reference Maxwell2019, p. 473). Increasing urban-rural divides may thus be largely confounded by increasing educational divides or by increasing residential sorting based on education. However, urban-rural differences might also have some independent origins.
Understanding whether urban-rural and educational differences are increasing and to what extent they overlap is important, because it has implications for social sorting and affective polarisation along the transnational cleavage: when urban-rural residence and education have independent explanatory value, these divides cut across each other, with some parties attracting higher-educated voters in both urban and rural areas and other parties attracting lower-educated voters across various places. By contrast, strong overlap implies pronounced social sorting, whereby some parties are primarily supported by higher-educated urban voters and other parties by lower-educated rural voters. Such strong social sorting is likely to intensify affective polarisation (Harteveld Reference Harteveld2021; Mason Reference Mason2016) and widen winner-loser gaps in political support (Janssen Reference Janssen2024).
In this paper, we address the following three questions: (1) can we observe urban-rural and educational differences in voting along the transnational cleavage? (2) Have these differences increased over time? (3) To what extent is there an overlap in urban-rural and educational differences in voting along the transnational cleavage?
To answer these questions, we analyse cross-national survey data from all 11 rounds of the European Social Survey. We study vote choice for parties on opposing ends of the transnational cleavage in Europe, so-called GAL and TAN parties. On the one end, ‘Green-Alternative-Liberal’ parties, or ‘GAL’ parties, are positive towards multiculturalism, are relatively welcoming towards immigrants, and, within EU countries, advocate for further European integration. These are often social-liberal, green, or other new-left parties. On the other end of the cleavage are parties that are nativist and Eurosceptic and advocate for highly restrictive immigration policies, often radical-right and nationalist parties that can be labelled ‘Traditional-Authoritarian-Nationalist’, or ‘TAN’, parties (Hooghe and Marks Reference Hooghe and Marks2018).
First, we analyse to what extent urban voters and higher-educated voters are over or underrepresented in GAL and TAN parties’ electorates and how this has developed over time, following the approach suggested by Marks et al. (Reference Marks, Attewell, Hooghe, Rovny and Steenbergen2022). With under/overrepresentation of urban voters in a party’s electorate, we mean the extent to which a party’s voters are urban, relative to the share of urban inhabitants in the population. We elaborate on the operationalisation later in the paper. Second, we turn to the level of individual voters to analyse to what extent urban-rural differences overlap with the well-known educational differences underlying the transnational cleavage. More specifically, we estimate the effect on GAL/TAN voting over time of either urban-rural residence or educational attainment with individual-level data while controlling for the other.
Our aim is to provide a general description of urban-rural and educational divides underlying GAL/TAN voting and their degree of overlap in Europe, which contributes to the existing literature in several important ways. First, while it is a commonly held assumption that urban-rural political differences have grown in importance over time, only a few studies have tested this claim empirically. While Huijsmans and Rodden (Reference Huijsmans and Rodden2024) showed increasing urban-rural electoral differences across several European countries using election outcome data, particularly for parties on the opposite ends of the transnational cleavage, they could not assess the overlap between urban-rural and educational divides. Moreover, the studies that analyse longitudinal individual-level survey data solely focus on attitudes rather than voting and find growing differences for some attitudes in some countries (Huijsmans, Harteveld, van der Brug et al. Reference Huijsmans, Harteveld, van der Brug and Lancee2021; Jennings and Stoker Reference Jennings and Stoker2016; Luca and Kenny Reference Luca and Kenny2024). We build upon these studies by analysing vote choice and therefore provide insights into the extent to which these attitudinal differences translate into urban-rural electoral divides, while systematically analysing potential confounding by educational attainment.
Second, existing work on (attitudinal) differences between urban and rural voters commonly controls for their educational attainment, among other socioeconomic and demographic background characteristics. However, there are no studies that systematically analyse how both urban-rural and educational differences in GAL-TAN voting have developed over time, so we do not know to what extent trends in urban-rural differences in voting are confounded by changing (effects of) educational attainment among urban and rural populations.
Third, existing cross-national studies have often focused on one type of party, usually on the ‘TAN’ side of the transnational cleavage (Eurosceptic or populist, for example) (Dvořák, Zouhar and Treib Reference Dvořák, Zouhar and Treib2022; Evans, Norman, Gould et al. Reference Evans, Norman, Gould, Hood, Ivaldi, Dutozia, Arzheimer, Berning, van der Brug and de Lange2019; Rodríguez-Pose Reference Rodríguez-Pose2018; Schmalz, Singe, and Hasenohr Reference Schmalz, Singe and Hasenohr2021). Whether increasing urban-rural differences are specific to populist radical right voting or reflect a broader trend of urban-rural electoral divergence along the transnational cleavage is therefore unclear, especially when educational attainment is taken into account. To get a more accurate and complete picture, we study urban-rural differences in support for both GAL and TAN parties simultaneously, and we compare these against urban-rural differences for other parties as well.
Our findings show that Europe’s growing urban-rural divide in voting along the transnational cleavage is not merely a reflection of underlying educational differences. Drawing on over 20 years of European Social Survey (ESS) data, we demonstrate that both urban-rural residence and educational attainment independently shape support for GAL and TAN parties. Increasing urban-rural divides persist even after accounting for education and other sociodemographic background variables. These findings suggest that ‘place’ matters in its own right in structuring political conflict across Europe, and they highlight the importance of incorporating geography into future research on the transnational cleavage.
Place, education, and political preferences
In numerous advanced industrial democracies, there is a difference in political attitudes and voting patterns between urban inhabitants and those living in less densely populated areas (Huijsmans, Harteveld, van der Brug et al. Reference Huijsmans, Harteveld, van der Brug and Lancee2021; Kenny and Luca Reference Kenny and Luca2021; Luca, Terrero-Davila, Stein et al. Reference Luca, Terrero-Davila, Stein and Lee2023; Maxwell Reference Maxwell2019, Reference Maxwell2020; Rodden Reference Rodden2010; Scala and Johnson Reference Scala and Johnson2017). This difference is particularly pronounced for attitudes related to the transnational cleavage, like attitudes towards multiculturalism and immigration (Kenny and Luca Reference Kenny and Luca2021; Maxwell Reference Maxwell2019, Reference Maxwell2020). In Europe, several studies document urban-rural differences in Eurosceptic attitudes (Schoene Reference Schoene2019; Surwillo, Henderson, and Lazaridis Reference Surwillo, Henderson and Lazaridis2010) and voting for Eurosceptic parties (de Dominicis, Dijkstra, and Pontarollo Reference de Dominicis, Dijkstra and Pontarollo2022).
Similarly, an even larger body of research has shown that level of education is related to attitudes and voting behaviour along the transnational cleavage (Abou-Chadi and Hix Reference Abou-Chadi and Hix2021; Cavaille and Marshall Reference Cavaille and Marshall2019a; de Jong and Kamphorst Reference de Jong and Kamphorst2024; Hainmueller and Hiscox Reference Hainmueller and Hiscox2007; Hakhverdian, van Elsas, van der Brug et al. Reference Hakhverdian, van Elsas, van der Brug and Kuhn2013; Hooghe, Marks, and Kamphorst Reference Hooghe, Marks and Kamphorst2024; Kuhn, Lancee, and Sarrasin Reference Kuhn, Lancee and Sarrasin2021; Kunst, Kuhn, and van de Werfhorst Reference Kunst, Kuhn and van de Werfhorst2020; Lancee and Sarrasin Reference Lancee and Sarrasin2015; McNeil and Simon Reference McNeil and Simon2024). People with higher levels of education have been found to be more open to immigration (Cavaille and Marshall Reference Cavaille and Marshall2019b; Lancee and Sarrasin Reference Lancee and Sarrasin2015) and European integration (Kuhn, Lancee, and Sarrasin Reference Kuhn, Lancee and Sarrasin2021; Kunst, Kuhn, and van de Werfhorst Reference Kunst, Kuhn and van de Werfhorst2020; Lubbers and Scheepers Reference Lubbers and Scheepers2010) and more supportive of liberal and cosmopolitan values (Surridge Reference Surridge2016). Consequently, they are overrepresented among GAL party voters and underrepresented among TAN party voters (Hooghe, Marks, and Kamphorst Reference Hooghe, Marks and Kamphorst2024).
In sum, the starting point of our theoretical argument is the following:
H1a: Higher-educated voters are overrepresented among GAL parties, whereas lower-educated voters are overrepresented among TAN parties.
H1b: Urban voters are overrepresented among GAL parties, whereas rural voters are overrepresented among TAN parties.
There are good reasons to expect that both the educational and the urban-rural differences in voting along the transnational cleavage have increased over time. One explanation for the increasing differences in voting behaviour along the transnational cleavage is that the issues related to this cleavage itself – like immigration and European integration – have gained salience in political debates in recent decades (Bonomi, Gennaioli, and Tabellini Reference Bonomi, Gennaioli and Tabellini2021; de Vries, Hakhverdian, and Lancee Reference de Vries, Hakhverdian and Lancee2013; Kriesi, Grande, Lachat et al. Reference Kriesi, Grande, Lachat, Dolezal, Bornschier and Frey2006). Since both urban-rural divides and educational divides in political attitudes are particularly pronounced on these issues, both divides in voting along this cleavage increase when these particular issues gain salience. Hence, the rising salience of immigration and European integration may partly explain why support for parties on the ‘GAL’ side of the transnational cleavage – like greens and social liberals – has increasingly concentrated in urban areas, whereas support for radical right parties increasingly concentrates in less-urbanised places (Huijsmans and Rodden Reference Huijsmans and Rodden2024) and why the higher-educated became increasingly aligned with ‘GAL’ parties, while the lower-educated became increasingly aligned with ‘TAN’ parties (Hooghe and Marks Reference Hooghe and Marks2025).
However, this explanation does not provide insights into the degree of overlap between those divides. Our specific interest is to distinguish between the arguments that imply a strong overlap between increasing urban-rural and educational divides in GAL/TAN voting and arguments that imply independent increases of both divides. To do so, we first discuss arguments that apply specifically to increases in educational divides in GAL/TAN voting. Then we discuss how the assumed increase of the educational divide in GAL/TAN voting may explain increasing urban-rural divides. These are arguments that imply strong overlap between increasing urban-rural and educational divides. Finally, we discuss arguments that apply specifically to urban-rural divides and thus imply an independent increase of urban-rural divides over time.
Increasing educational divides in GAL/TAN voting
Turning to the factors that are specific to increasing educational differences, the importance of formal education for labour market outcomes has grown over time (Autor Reference Autor2014; Goldin and Katz Reference Goldin and Katz2008). As a result of the increasing importance of education, people with lower levels of education are more likely to be in vulnerable positions today than some decades ago, while the higher-educated are nowadays particularly likely to profit from economic globalisation and the expansion of the knowledge economy (e.g., de Jong and Kamphorst Reference de Jong and Kamphorst2024).
Furthermore, there are powerful self-selection and socialisation processes at work that further increase existing educational differences. Children from families with higher levels of education – and more GAL mindset – self-select into higher education. In secondary school and university, they are surrounded by like-minded peers and further socialised into liberal and cosmopolitan values. This is in line with recent work by De Jong and Kamphorst (2024), who show that increased education levels in one’s social network are related to increasing cosmopolitan attitudes and voting behaviour. This combination of self-selection and socialisation further strengthens the existing educational differences over time (Kuhn, Lancee, and Sarrasin Reference Kuhn, Lancee and Sarrasin2021). Consequently, education does not only shape people’s economic outcomes but also increasingly affects their social and political life, and it shapes group membership and collective identities (Garritzmann Reference Garritzmann2025). Hence, the social lives of higher- and lower-educated citizens have grown further apart, allowing for more segregation of preferences along the transnational cleavage.
Political actors capitalise on this segregation by emphasising these educational conflicts more than some decades ago (Garritzman Reference Garritzmann2025). Together with the increased importance of education for life outcomes, this potentially makes the less educated more receptive to populist messages of TAN parties, who tend to portray themselves as the parties of the ‘small man’ and use labour migrants and asylum seekers as scapegoats (Savelkoul and Scheepers Reference Savelkoul and Scheepers2017). Contrastingly, it makes the higher-educated increasingly likely to vote for parties advocating for further economic globalisation and European integration (Baute and Tober Reference Baute and Tober2024).
In line with these arguments, empirical research supports the expectation that educational differences underlying the transnational cleavage are increasing. Hakhverdian et al. (Reference Hakhverdian, van Elsas, van der Brug and Kuhn2013) show that educational differences in Euroscepticism have increased, and Van der Brug and Rekker (Reference van der Brug and Rekker2021) and Schaefer and Steiner (Reference Schäfer and Steiner2025) find that educational differences in political outlooks are more pronounced among younger generations. Based on the above, we thus hypothesise:
H2a: Educational differences in the support for GAL and TAN parties in Europe have increased between 2002 and 2022.
Increasing urban-rural divides in GAL-TAN voting
Turning to increasing urban-rural divides in GAL/TAN voting, the most straightforward set of arguments relates to increasing compositional differences between urban and rural populations. One important characteristic on which urban and rural populations differ is their level of education: higher-educated individuals are more likely to live in cities, and lower-educated individuals are overrepresented in rural areas (American Community Survey 2015; Zahl-Thanem and Rye Reference Zahl-Thanem and Rye2024). This is because the higher educated may prefer living in cities for several reasons, among which are better economic returns to education in urban areas (Storper Reference Storper2018), but also because growing up in a city increases the likelihood of attaining a university degree (Zahl-Thanem and Rye Reference Zahl-Thanem and Rye2024). For reasons outlined above, educational differences in political attitudes and voting behaviour have increased over time, and because of the unequal distribution of higher-educated individuals over urban and rural areas, this may translate into increasing urban-rural differences in support for GAL and TAN parties.
The clustering of higher-educated individuals in urban areas has even increased over time, because jobs in the expanding knowledge economy – that attract higher-educated workers – tend to be primarily clustered in urban places (Gingrich Reference Gingrich2025). Because of the educational divide in political attitudes and voting behaviour, increased spatial clustering would translate into increasing urban-rural divides in voting along the transnational cleavage.
Therefore, with the increasing educational divide in GAL/TAN voting and the increasing spatial clustering of higher-educated voters in mind, we hypothesise the following:
H2b: Urban-rural differences in the support for GAL and TAN parties in Europe have increased between 2002 and 2022.
Are urban-rural differences independent or overlapping with educational differences?
The arguments above imply a strong overlap between increasing urban-rural divides and increasing educational divides in GAL/TAN voting. However, there are several theoretical arguments for why place would independently affect voting behaviour along the transnational cleavage.Footnote 1
The residential context may affect inhabitants’ political views net of their personal background characteristics and circumstances. Since the local context differs between urban and rural places on several aspects that are relevant to people’s political outlooks, these context effects may partly explain urban-rural differences in voting behaviour. Since urban areas have higher levels of ethnic diversity, living in these places may facilitate higher levels of interethnic tolerance and, more generally, a more cosmopolitan worldview (Huggins and Debies-Carl Reference Huggins and Debies-Carl2015; Janssen, Van Ham, Kleinepier et al. Reference Janssen, Van Ham, Kleinepier and Nieuwenhuis2019). Moreover, it has been argued that socioeconomic decline in rural areas leads to political disaffection and scepticism towards economic and cultural globalisation, while the growth of the knowledge economy that concentrates in urban agglomerations positively affects cosmopolitan orientations of individuals residing in these places, beyond only the higher educated who work in these sectors (Cremaschi, Rettl, Cappelluti et al. Reference Cremaschi, Rettl, Cappelluti and De Vries2024; de Dominicis, Dijkstra, and Pontarollo Reference de Dominicis, Dijkstra and Pontarollo2022; Lind Reference Lind2020; Mayne and Katsanidou Reference Mayne and Katsanidou2023; Salomo Reference Salomo2019). Increasing concentrated growth of the knowledge economy and accompanying increasing diversity in urban areas may therefore partly explain why political outlooks between inhabitants of urban ‘diverse knowledge economy hubs’ and rural ‘left-behind places’ diverged over time (Rodríguez-Pose Reference Rodríguez-Pose2018).
Recent studies have also paid attention to identity-based mechanisms underlying urban-rural political divides. People identify with categories like ‘urban’ or ‘rural’, and these place-based identities can have important implications for political attitudes and voting behaviour (Bornschier, Häusermann, Zollinger et al. Reference Bornschier, Häusermann, Zollinger and Colombo2021; Zollinger Reference Zollinger2024). Identifying with a place and local community makes people more likely to ascribe to local norms and values and to distance themselves from values associated with geographic outgroups (Diamond Reference Diamond2023; Lunz Trujillo Reference Lunz Trujillo2022; Lyons and Utych Reference Lyons and Utych2021). In combination with objective spatial inequalities mentioned above, these place-based identities can be accompanied by place-based resentment: the perception that one’s area and its inhabitants are disregarded by political elites, disadvantaged in the distribution of resources, and disrespected by inhabitants of other places (Claassen, Göbel, Lang et al. Reference Claassen, Göbel, Lang, Ackermann, Bankov, Brookes, Cappellina, Carman, Freitag, García, Horno, Hernández, Rico, Rossteutscher, Traunmüller, Webb, Zmerli and Zumbrunn2025; Cramer Reference Cramer2016; de Lange, van der Brug, and Harteveld Reference de Lange, van der Brug and Harteveld2022; Munis Reference Munis2022). Place-based resentment is higher among inhabitants of rural and peripheral areas than among urban inhabitants (Claassen, Göbel, Lang et al. Reference Claassen, Göbel, Lang, Ackermann, Bankov, Brookes, Cappellina, Carman, Freitag, García, Horno, Hernández, Rico, Rossteutscher, Traunmüller, Webb, Zmerli and Zumbrunn2025; de Lange, van der Brug, and Harteveld Reference de Lange, van der Brug and Harteveld2022; Munis Reference Munis2022). These place-based grievances have important implications for inhabitants’ political attitudes – like interethnic tolerance, nativism, immigration attitudes (Arzheimer and Bernemann Reference Arzheimer and Bernemann2023; Huijsmans Reference Huijsmans2022; Nelsen and Petsko Reference Nelsen and Petsko2022) and perceptions about climate change (Arndt, Halikiopoulou, and Vrakopoulos Reference Arndt, Halikiopoulou and Vrakopoulos2023; Diamond Reference Diamond2023; Vallvé and Anduiza Reference Vallvé and Anduiza2025) – and voting behaviour (Auerbach, Eidheim, and Fimreite Reference Auerbach, Eidheim and Fimreite2024; Hegewald and Schraff Reference Hegewald and Schraff2025; Huijsmans and van der Brug Reference Huijsmans and van der Brug2025; Jacobs and Munis Reference Jacobs and Munis2023; Jacobs and Shea Reference Jacobs and Shea2023). These associations are asymmetric for urban and rural inhabitants: while rural residents with higher place-based resentment tend to be more conservative, urban inhabitants with higher place-based resentment tend to be more progressive in their attitudes (Borwein and Lucas Reference Borwein and Lucas2023).
These identity-based explanations imply that urban-rural political divides can increase even when sociodemographic compositions or structural inequalities between places remain constant. This is partly due to supply-side effects. Namely, as some studies from both the US and Europe suggest, voters’ place-based identities and feelings of resentment are increasingly mobilised by political elites and become more salient to voters (Huijsmans and van der Brug Reference Huijsmans and van der Brug2025; Jacobs and Munis Reference Jacobs and Munis2019; Jacobs and Shea Reference Jacobs and Shea2023; Munis and Burke Reference Munis and Burke2023), making urban voters increasingly likely to vote for GAL parties and rural inhabitants increasingly likely to vote for TAN parties.
Altogether, there are several distinct arguments for why both the urban-rural divide and the educational divide in GAL/TAN voting may have increased independently. Therefore, we expect to still see increasing urban-rural differences in GAL/TAN voting after we consider differences in educational attainment between urban and rural voters. That is, we hypothesise:
H3: Increasing urban-rural differences in GAL-TAN voting remain after controlling for the educational background of urban and rural voters.
Data
To test our hypotheses, we use individual-level survey data from all available waves of the European Social Survey, covering the period between 2002 and 2022 for 25 countries. We choose this repeated cross-sectional and cross-national dataset over detailed country-specific panel-survey datasets, even though the latter often include more detailed (geocoded) information about place of residence and enable close inspection of explanatory mechanisms. Namely, the purpose of our study is to understand whether urban-rural and educational differences in voting along the transnational cleavage in Europe are increasing and to what extent they overlap, rather than to disentangle the causal effects of place of residence and educational attainment. For this purpose, we need individual-level survey data that covers many European countries and a long period of time.
For our analyses, we included data from all European democracies for which we have at least three waves of ESS data that we could link to information about political parties from the Chapel Hill Expert Survey (CHES) (Jolly, Bakker, Hooghe et al. Reference Jolly, Bakker, Hooghe, Marks, Polk, Rovny, Steenbergen and Vachudova2022). Together, these data provide us with information on the vote choice of respondents in the most recent national election, the type of place they live in, their highest obtained educational degree, and relevant sociodemographic background variables.
To make the links between ESS and CHES, we made use of the Political Parties Crosswalk dataset (Kołczyńska and Powałko Reference Kołczyńska and Powałko2022) and the PartyFacts dataset (Döring and Regel Reference Döring and Regel2019), which we manually updated for ESS rounds 10 and 11. The sample of analysis consists of more than 450,000 respondents divided over 11 ESS rounds and 25 countries, with information on about 200 political parties within each ESS survey wave.
Method
The analysis consists of two parts. First, we calculate measures for the social basis of political parties in each round of ESS data, employing a novel method proposed by Marks et al. (Reference Marks, Attewell, Hooghe, Rovny and Steenbergen2022). Using these party-level measures, we model the over/underrepresentation of urban and higher-educated voters in parties’ electorates. We do so by estimating a regression model that includes the type of party and dummy variables for survey waves, with robust standard errors and observations (= parties) weighted by their national vote share. We include country fixed effects in all our models to account for differences in electoral and party systems, geographic differences, different education systems, and all other country differences that are relevant to urban-rural and educational divides in voting along the transnational cleavage. This model serves as the baseline, after which we include an interaction term between the categorical party type dummies and the survey wave dummies to test whether the over/underrepresentation of urban voters and higher-educated voters in GAL and TAN parties’ electorates has changed over time.
Second, we turn to the individual-level data and model vote choice for different types of parties using linear probability modelsFootnote 2 with robust standard errors, using the post-stratification weight variables provided by ESS in all models. In a stepwise modelling procedure, we first estimate the effect of urban-rural residence (or education, respectively) over time, then add educational attainment (or urban-rural residence), and finally control for three other sociodemographic characteristics that are related to voting behaviour along the GAL/TAN dimension, namely migration background, gender (Harteveld and Ivarsflaten Reference Harteveld and Ivarsflaten2018; Van Ditmars Reference Van Ditmars2023) and age (Haffert and Mitteregger Reference Haffert and Mitteregger2023). This stepwise modelling procedure allows us to separately estimate trends in the effects of urbanisation and education over time and to disentangle urban-rural from educational differences.
Operationalisation
Over/underrepresentation measures
To calculate the overrepresentation of certain groups in parties’ electorates, we follow the approach suggested by Marks et al. (Reference Marks, Attewell, Hooghe, Rovny and Steenbergen2022). The overrepresentation of a social group is a function of the group’s share in the party’s support base and the group’s share in the total population. The social basis of a party i with respect to social group j can be defined as: $\rho _{i,j}^S = 100{\rm{\;}} \times {\rm{\;}}\left( {\pi _{j|i}^S - {\rm{\;}}\pi _{.j}^S} \right),$
where $\pi _{.j}^S$
is the share of a social group in the population, and
$\pi _{.j}^S$
is the share of a social group in the population, and $\pi _{j|i}^S$
is the share of that group in party i’s support base. We calculate
$\pi _{j|i}^S$
is the share of that group in party i’s support base. We calculate $\pi _{.j}^S$
as the weighted share of respondents that belong to group j in a given wave in a given country in the ESS data and
$\pi _{.j}^S$
as the weighted share of respondents that belong to group j in a given wave in a given country in the ESS data and $\pi _{j|i}^S$
as the weighted share of party i’s voters that belong to social group j.
$\pi _{j|i}^S$
as the weighted share of party i’s voters that belong to social group j. $\rho _{i,j}^S$
is the difference in percentage points between the share of social group j in the population and the share of social group j in the party’s electorate. A negative value indicates that group j is underrepresented in party i’s electorate; a positive value means that social group j is overrepresented. It describes to what extent a societal cleavage is translated into support for a particular party and is thus regarded as a Party Cleavage Index measure (Hooghe and Marks Reference Hooghe and Marks2025). We calculated these measures for urban voters and higher-educated voters.
$\rho _{i,j}^S$
is the difference in percentage points between the share of social group j in the population and the share of social group j in the party’s electorate. A negative value indicates that group j is underrepresented in party i’s electorate; a positive value means that social group j is overrepresented. It describes to what extent a societal cleavage is translated into support for a particular party and is thus regarded as a Party Cleavage Index measure (Hooghe and Marks Reference Hooghe and Marks2025). We calculated these measures for urban voters and higher-educated voters.
Higher-educated voters were defined as all respondents who obtained a post-secondary or tertiary education. Urban voters were defined as all respondents who indicated that they live in ‘A big city’ or ‘Suburbs or outskirts of a big city’. Respondents who indicated they live in ‘A town or a small city’, ‘A small village’, or ‘A farm or a house in the countryside’ were coded as non-urban.Footnote 3 Ideally, we would have an objective measure or even geocodes to classify who lives in an urban and who lives in a rural area, but we do not have geocoded data at a sufficiently low geographic level to do so. This is important because (at least in the US) a substantial share of survey respondents who self-report that they live in a rural area do not actually live in an area that would objectively be qualified as rural (Nemerever and Rogers Reference Nemerever and Rogers2021). People presumably have different perspectives of a rural area and take different reference points, especially across countries. Moreover, this self-reported measure is aimed at capturing the place of residence but may also partly capture (or be biased by) respondents’ place-based identities. We can, therefore, not be completely sure that we accurately classify respondents’ place of residence as urban or rural, which may be seen as a limitation of our study. On the other hand, as we argued earlier, urban-rural differences are partly explained by place-based identities that do not always align with an objective place of residence (Nemerever and Rogers Reference Nemerever and Rogers2021). It is therefore not necessarily the case that a self-reported measure captures a smaller share of urban-rural differences compared to an objective measure, but instead, it might capture a (partly) different share. Nevertheless, the potential limitations of our urban-rural measure should be considered when interpreting results and implications.
The group of higher-educated respondents and the group of urban respondents – according to our classifications described above – each consist of roughly one-third of our analytic sample. That both groups are roughly equal in size helps if one wants to compare the over and underrepresentation of these groups in parties’ support bases to each other in the figures that we present. However, these proportions vary between countries, with only roughly fewer than one in five respondents from Italy and Switzerland indicating that they live in a big city or in its suburbs or outskirts, whereas this applies to more than half of the respondents in Greece and Cyprus. Nevertheless, besides these outliers, in most countries, like Germany, France, Sweden, and the UK, roughly 30 percent of respondents are classified as ‘urban’. Describing trends in urban-rural divides in individual countries is beyond the scope of this study, but these kinds of differences may suggest different patterns and trends across countries.
In line with expectations about overlap between urban-rural and educational divides, the share of higher-educated respondents is higher among urban respondents (40 percent) than among rural respondents (28 percent).
Party type
We categorise parties as ‘GAL’ or ‘TAN’ based on the CHES (Jolly, Bakker, Hooghe et al. Reference Jolly, Bakker, Hooghe, Marks, Polk, Rovny, Steenbergen and Vachudova2022) that classifies political parties into party families and provides assessments of parties’ positions on a wide range of issue dimensions. To put urban-rural and educational differences in support for GAL and TAN parties in perspective, we also distinguish two additional groups: left parties and right parties that are wedged between GAL and TAN. We used the following criteria to assign parties to these four categories.
First, all parties that score below 2.5 on a 0-10 GAL-TAN scale in the CHES data were classified as GAL parties. Second, all parties that scored above 7.5 on the same scale were classified as TAN parties. This rather straightforward way of classifying parties as GAL or TAN has one clear disadvantage. Namely, GAL-TAN scale scores in the CHES data – which are based on judgements of country experts – may not be perfectly comparable between countries, as country experts may place a particular party on the 0–10 scale relative to other parties in that country. For example, consider the Dutch Party for Freedom (PVV), which is clearly a radical right party (Rooduijn, Pirro, Halikiopoulou et al. Reference Rooduijn, Pirro, Halikiopoulou, Froio, Van Kessel, De Lange, Mudde and Taggart2023) and would be regarded as a ‘TAN’ party by any expert. However, according to CHES, PVV scores around 7.1 on the GAL-TAN scale, which falls below the threshold of 7.5 that we used. This may be partly explained by the presence of a similar, and even more extreme, party to the right of PVV: Forum for Democracy (scoring +/− 8.6 on the GAL-TAN scale). To account for these ambiguities on both the GAL and the TAN side, we performed an additional step. We categorised all remaining parties that, according to CHES, belong to the radical right party family as ‘TAN’ and all remaining parties that belong to the green party family as ‘GAL’. Finally, we classified all remaining parties as either left or right, based on their score on the economic left-right scale in the CHES data. Remaining parties that score below 5.5 on the economic left-right scale were classified as left, and remaining parties that score above 5.5 were classified as right.
The online Appendix provides an overview by country and ESS round of how all the political parties were categorised and the number of observations in our data. This Appendix can be found at the Open Science FrameworkFootnote 4 page associated with this study. Figure 1 shows how respondents are distributed over the four party types in each ESS round. It shows how the share of respondents voting for TAN parties has increased over the last two decades, with only 9.4 percent of respondents indicating they voted for these parties in ESS round 1 (2002) and 21.8 percent in round 11 (2023–2024).
Distribution of respondents over party categories in percentages, by ESS round.

Figure 1. Long description
A stacked bar graph compares the distribution of respondents over party categories by ESS round. The horizontal axis represents the ESS rounds from 1 to 11. The vertical axis represents the percentage of respondents, ranging from 0 to 100 percent. The graph uses four colors to represent different party categories: GAL (light gray), Economically left (medium gray), Economically right (dark gray), and TAN (black). Each bar is divided into segments representing the percentage of respondents in each party category for that ESS round. Notable trends include an increase in the TAN category from round 1 to round 11, and fluctuations in the other categories across the rounds. Specific values for each segment within the bars are labeled directly on the graph.
All codes for replication of our analyses can also be found at the OSF page. This page also contains a party-level dataset that includes country, ESS round, party name, GAL/TAN classification, and the over and underrepresentation scores for the parties, among some other variables.
Results
Party level
To analyse the development of urban-rural differences and educational differences in party choice over time, we performed a series of regression models at the party level with the overrepresentation measures as the dependent variables and party type, ESS round dummies, and their interactions as predictors. Each party is weighted for its national vote share, and all models include country fixed effects. From these models, we can predict the trends in overrepresentation of urban voters and higher-educated voters in the electorate of each party type. Before we do so, the left-hand panel of Figure 2 shows the predicted values of the overrepresentation measures for each type of party without time trends, based on Models 1 and 2 in Table A1 (Appendix below).Footnote 5
Predicted over-/underrepresentation of urban and higher-educated voters by type of party.

The green coefficients in the left-hand panel in Figure 2 show the predicted overrepresentation of urban voters for all types of parties, based on Model 1 in Table A1. This model does not yet include the interaction terms between survey wave dummies and party type. It shows that urban voters are underrepresented in the electorates of TAN parties by 5 percentage points, while they are overrepresented in the electorate of GAL parties by 7 percentage points. Among the centre-right parties, urban voters are just slightly underrepresented by 0.7 percentage points, and among the centre-left parties, they are neither under nor overrepresented.
The red coefficients in the left-hand panel in Figure 2 show the overrepresentation of higher-educated voters for all types of parties, based on Model 2 in Table A1. First, over and underrepresentation of higher-educated voters in the electorates of GAL and TAN parties follows the same pattern as described above for urban voters: overrepresentation in the electorate of GAL parties and underrepresentation in the electorate of TAN parties. This is in line with the expectation that urban-rural and educational differences in GAL/TAN voting likely overlap. However, the overrepresentation of higher-educated voters in the electorate of GAL parties (18 percentage points) is substantially stronger than the overrepresentation of urban voters (7 percentage points). The underrepresentation of higher-educated voters in the electorate of TAN parties is comparable to that of urban voters (roughly 5 percentage points). Further, higher-educated voters are overrepresented in the electorates of centre-right parties by 9 percentage points, and just slightly overrepresented in the electorate of centre-left parties (1 percentage point). In sum, the findings show that both urban and higher-educated voters are underrepresented in the electorate of TAN parties and overrepresented in the electorate of GAL parties, supporting Hypotheses 1a and 1b.
Next, to test Hypotheses 2a and 2b, we analyse the trends in the urban-rural and educational differences in parties’ electorates. Models 3 and 4 in Table A1 include interaction terms between the ESS round dummies and the party type dummies. Based on these models, the right-hand panels in Figure 2 visualise the trends in urban-rural and educational differences for the four types of parties.
The right-hand panels in Figure 2 show an increasing underrepresentation of urban and higher-educated voters in the electorate of TAN parties. Both are similar in size and follow a similar trend. In earlier ESS waves, the underrepresentation of urban voters and higher-educated voters in TAN parties’ electorates was not significantly different from 0, but in later ESS waves we find that both groups are underrepresented roughly by 5 percentage points in TAN parties’ electorates. For GAL parties, we see a slight increase in the overrepresentation of urban voters, plus an even clearer increase in the overrepresentation of higher-educated voters. Altogether, this implies that both Hypothesis 2a and 2b are supported: urban-rural differences and educational differences in GAL/TAN voting have increased. However, these increases are relatively small, except for the clear increase in the overrepresentation of higher-educated voters in GAL parties’ electorates – from roughly 11 percentage points in the first ESS round (2002) to almost 20 percentage points in ESS round 11 (2023/2024).
Individual level
Next, we turn to the individual level to see the extent to which the urban-rural and educational differences in support for GAL and TAN parties overlap.
Models 5-10 in Tables A2 and A3 (See Appendix below) are linear probability models predicting individual support for GAL parties and TAN parties, respectively. For both types of parties, we estimate three models. We first predict voting for such a party by voters’ urban-rural residence and its interaction with the ESS round dummy variables. Second, we add educational attainment and its interactions with ESS round dummies. This shows the extent to which individual-level urban-rural and educational differences remain when they are considered simultaneously. As shown above, the urban-rural and educational differences seem to overlap and show similar trends, which suggests that urban-rural differences may largely disappear when education is controlled for. Third, we include gender, age, and migration background as additional sociodemographic controls. We use the post-stratification weight variables provided by ESS and robust standard errors for all models. Figure 3 visualises the trends in urban-rural and educational differences in support for GAL and TAN parties, based on the estimates of these regression models. Tables A4-A5 contain similar models for centre-left and centre-right parties for comparison.
Predicted urban-rural differences and educational differences at the individual level, with and without controlling for each other, and with and without controlling for age and gender.

Figure 3. Long description
The image contains four line graphs depicting predicted urban-rural and educational divides at the individual level. Panel A: Urban-rural divide for GAL parties. The x-axis represents ESS round from 1 to 11, and the y-axis represents dy/dx(urban) ranging from -0.1 to 0.1. The graph shows three lines: a green line for not controlled, a black dashed line for + education, and a black dotted line for + other controls. The green line shows an increasing trend, the black dashed line shows a moderate increase, and the black dotted line shows a slight increase. Panel B: Educational divide for GAL parties. The x-axis represents ESS round from 1 to 11, and the y-axis represents dy/dx(high-ed.) ranging from 0 to 0.1. The graph shows three lines: a red line for not controlled, a black dashed line for + urban, and a black dotted line for + other controls. The red line shows a fluctuating trend, the black dashed line shows a moderate fluctuation, and the black dotted line shows a slight fluctuation. Panel C: Urban-rural divide for TAN parties. The x-axis represents ESS round from 1 to 11, and the y-axis represents dy/dx(urban) ranging from -0.1 to 0.1. The graph shows three lines: a green line for not controlled, a black dashed line for + education, and a black dotted line for + other controls. The green line shows a decreasing trend, the black dashed line shows a moderate decrease, and the black dotted line shows a slight decrease. Panel D: Educational divide for TAN parties. The x-axis represents ESS round from 1 to 11, and the y-axis represents dy/dx(high-ed.) ranging from -0.1 to 0.1. The graph shows three lines: a red line for not controlled, a black dashed line for + urban, and a black dotted line for + other controls. The red line shows a decreasing trend, the black dashed line shows a moderate decrease, and the black dotted line shows a slight decrease.
We first discuss the models in which urbanisation and education were included separately, visualised by the green (urbanisation) and red (education) trend lines in Figure 3. The overarching conclusion from these models aligns with the conclusion from the party-level analysis presented earlier. An important difference with the party-level analysis is that we do not see an increase in the overrepresentation of higher-educated voters in GAL parties’ electorates over time in Figure 3. Therefore, there is no clear support for Hypothesis 2a when it comes to GAL parties. For TAN parties, results are again very similar to the party-level analysis: higher-educated voters are less likely to vote for TAN parties, and their underrepresentation in TAN parties’ electorates increased over time, in line with Hypothesis 2a. Further, urban voters have a higher probability of voting for GAL parties. Although the effect of urbanisation somewhat fluctuates, it clearly increases over the last few ESS rounds. Urban voters are less likely to vote for TAN parties, and this effect also increased over time (which means the negative coefficient becomes more negative). Together, this supports Hypothesis 2b.
Altogether, we see increasing urban-rural differences in GAL/TAN voting – particularly for GAL parties – while the increase in educational differences in voting along the transnational cleavage only applies to TAN parties. These educational differences are present in support for GAL parties too, but they have remained quite stable over time, according to the individual-level analysis.
Next, we look at the models in which both urbanisation and education were included simultaneously, visualised by the black dashed lines in Figure 3. First, we look at the urban-rural differences, testing Hypothesis 3. The upper left-hand graph in Figure 3 shows that additionally including the interactions between education and the ESS round dummies in the model explains only a minor part of the urban-rural differences in voting for GAL parties and does not explain the increase in urban-rural differences. Based on Model 5 (Table A2), urban respondents are 7.9 percentage points more likely to vote for GAL parties in the last wave (2023/2024), and this gap remains 6.8 percentage points when education is included in Model 6. After further controlling for gender, age, and migration background, the gap remains 6.5 percentage points.
Further, the lower left-hand graph in Figure 3 shows that urban inhabitants are 4.1 percentage points less likely to vote for TAN parties in ESS round 11 (2023/2024) based on Model 9 (Table A3), and this gap remains 2.8 percentage points after including the interactions between education and the ESS round dummies in Model 10. This means that accounting for educational attainment explains almost a third of the initial urban-rural gap in TAN party voting. Additionally, including gender, age, and migration background barely affects urban-rural differences in support for either GAL or TAN parties further. What remain are considerable gaps, given that the vote share for GAL parties is roughly 16 percent, and the vote share for TAN parties is roughly 22 percent, in our sample in wave 11 in 2023/2024 (see Figure 1).
The right-hand graphs in Figure 3 show the educational differences in GAL and TAN voting over time. First, the upper right-hand graph shows a large gap in voting for GAL parties of more than 8.5 percentage points. Additionally, including the urban-rural dummy and its interactions with the ESS round dummies barely explains any variance in voting for GAL parties between the higher and lower educated. The gap remains 7.7 percentage points. After further controlling for gender, age, and migration background, the gap decreases to 6.4 percentage points. Altogether, we see a sizeable educational gap in voting for GAL parties that is only to a minor extent explained by urban-rural differences or by gender, age, and migration background. Second, the lower right-hand graph shows a clearly growing educational gap in support for TAN parties. Higher-educated voters are 9.5 percentage points less likely to vote for TAN parties in ESS round 11 (2023/2024). This is also barely explained when additionally including the urban-rural dummy and its interactions with the ESS round dummies and when additionally including gender, age, and migration background in the model.
Altogether, in the individual-level analyses, we find general support for Hypothesis 2a and 2b: both urban-rural and educational differences in GAL/TAN voting have increased over the last two decades. However, the underlying patterns are somewhat different for both types of divides. Regarding urban-rural differences, the increase is most clearly pronounced for GAL party voting. The urban-rural gap in voting for TAN parties is considerably smaller, and the increase over time was also weaker. The educational gap is clearly present for both GAL and TAN parties and similar in size nowadays, but it was stable over time for GAL parties, whereas it clearly increased over time for TAN parties.
In line with Hypothesis 3, simultaneously modelling the urban-rural and educational differences at the individual level shows that increasing urban-rural differences in GAL-TAN voting remain after controlling for the educational background of urban and rural voters and the other way around. In other words, the urban-rural and educational differences underlying voting along the transnational cleavage overlap only for a small portion. Both the degree of urbanisation and educational attainment have their own explanatory value when it comes to voting for GAL and TAN parties. Notably, controlling for education does explain a larger share of the urban-rural divide – almost a third regarding voting for TAN parties – compared to the other way around.
Other potentially important cleavages like gender, age, and migration background do not explain the urban-rural nor the educational divide in GAL/TAN voting. When all variables are simultaneously included in the model, the educational gap and urban-rural gap in voting for GAL parties are similar in size in the last few waves of ESS due to the clear increase of the urban-rural divide over time. Regarding support for TAN parties, the educational gap is substantially larger than the urban-rural gap.
Additional analyses
We performed several additional analyses to test the robustness of our results to alternative specifications and to get better insights into our results. First, our method to calculate the over/or underrepresentation of urban voters – based on Marks et al. (Reference Marks, Attewell, Hooghe, Rovny and Steenbergen2022) – required that we draw sharp boundaries between urban and non-urban voters. We drew these boundaries based on pre-existing categories available in the ESS data: (1) ‘A big city’; (2) ‘Suburbs or outskirts of a big city’; (3) ‘Town or small city’; (4) ‘Country village’; (5) ‘Farm or home in the countryside’. In our main analyses, we grouped the first two categories together as urban. This dichotomy is arbitrary, and where we exactly draw the line between urban and rural can influence our results. In this section, we therefore take a closer look at support for GAL and TAN parties in the five distinct urbanisation categories as measured in the ESS and also in five distinct education categories.
Figure 4 below plots the predicted probabilities of support for GAL and TAN parties over time for five urbanisation categories and five education categories, based on a model where both categorical variables are included simultaneously, as well as their interactions with ESS round dummies. Support for GAL parties has been consistently high in the suburbs and outskirts of big cities and increasingly so in the cores of the big cities. Especially over the last few years, there has been a clear difference between these two types of places, on the one hand, and villages and the countryside on the other hand. Support for TAN parties is not so neatly divided between urban and rural areas. What stands out is that support is clearly lowest in the suburbs and outskirts of big cities. Moreover, especially in more recent ESS rounds, support for TAN parties is comparable in the cores of big cities, on the one hand, and small towns, villages, and the countryside, on the other hand. Overall, looking at the trends in the separate categories reveals increasing urban-rural differences in support for GAL parties but also reveals that there is no clear dichotomy in support for TAN parties, given the relatively high support in cores of big cities. Our initial operationalisation of urban residence makes sense for our analysis of GAL parties, as it includes the two types of places where support for GAL parties is highest – big cities and their suburbs and outskirts. However, it is more problematic for our analysis of TAN parties, given the non-linear pattern in support for TAN parties across urbanisation categories.
Predicted support for GAL and TAN parties over time for five distinct urbanisation and education categories, when both categorical variables and their interactions with time variables are simultaneously included in the model.

Regarding educational differences, support for GAL parties has been consistently the highest among university-educated voters. It is now clearly lower among voters with higher vocational, or upper-tier upper-secondary, education. Support has been lowest among voters with primary or lower-secondary education and low-tier upper-secondary education. Interestingly, it has been slightly decreasing among higher-vocational-educated voters. Based on this, our initial operationalisation of high education – both university and higher vocational education – may slightly underestimate educational differences in voting for GAL parties in recent ESS waves. Regarding TAN parties, support has increased over time among all educational groups over the last decade, but most clearly among the lowest three educational categories.
To check whether our overall conclusions are robust to different urban-rural dichotomies, we carried out two additional analyses in which we replicated models 7 (GAL parties) and 11 (TAN parties) from the individual-level analysis, which include the urban dummy and its interaction with ESS round dummies and the education dummy and its interaction with ESS round dummies simultaneously. First, we defined the group of urban inhabitants by additionally including inhabitants of towns and small cities. Second, we replicated these models with the group of urban inhabitants being restricted to only inhabitants of the big cities (not their suburbs and outskirts). In these models, we include the same operationalisation of higher educated as in the main analyses. Figure 5 summarises the results from these additional models. It shows that urban-rural differences in GAL support are smaller when urban additionally includes towns and small cities (r1) and slightly larger when urban is restricted to big cities only (r2). Time trends remain similar to the baseline model. Regarding TAN parties, results barely change when towns and small cities are included in the urban category (r1) or when we restrict urban to only big cities (r2). There is only one exception: in the latter specification, the urban-rural differences are considerably smaller in the ESS round 11 (2023/2024). How we exactly operationalise the urban-rural dichotomy does not affect the educational divide in GAL/TAN voting.
A comparison of urban-rural and educational differences in GAL/TAN voting between models with different operationalisations of the urban-rural dichotomy.

So far, we only considered whether urban-rural and educational differences overlap or have their own separate explanatory value for voting along the transnational cleavage. In our final additional analysis, we check whether urbanisation degree and educational attainment interact to explain voting along the transnational cleavage. Specifically, Figure A1 shows differences in GAL/TAN voting between urbanisation categories for higher- and lower-educated voters separately. This shows that the urban-rural differences in GAL voting are present among both higher- and lower-educated voters. And interpreted differently, it shows that the educational differences in support for GAL parties exist within all urbanisation categories. For TAN parties, there is again a difference between suburbs and outskirts of big cities and all other urbanisation categories among both higher- and lower-educated voters. However, these differences are more clearly pronounced among lower-educated voters. Finally, Figure A3 shows that our results are robust to including time-varying effects of our control variables.
Overall, our conclusions remain substantively similar after considering our additional analyses. That is, differences in GAL/TAN voting along the urban-rural continuum have increased over time, even when controlled for educational differences. Urbanisation of place of residence and educational attainment both have their own explanatory value for voting along the transnational cleavage. However, our additional analyses reveal an important nuance. On the one hand, there is a quite clear urban-rural difference in support for GAL parties – with high support in large cities and their outskirts and suburbs and lower support in towns, villages and the countryside. On the other hand, there is no clear urban-rural dichotomy in support for TAN parties: their support is highest in villages and the countryside, but only slightly lower in towns and large cities. The only category that stands out is the suburbs and outskirts of big cities, where support for TAN parties is clearly lowest. This implies that it matters a lot for results and interpretations how the urban-rural continuum is operationalised in analyses. Our dichotomous operationalisation fits our purpose of summarising the urban-rural and educational differences in GAL/TAN voting simultaneously but conceals important variation in support for TAN parties between large cities and their outskirts and suburbs.
Conclusion
We studied to what extent urban-rural residence and educational attainment overlap to explain voting along the transnational cleavage. Using data from 11 waves of the European Social Survey, following the approach developed by Marks et al. (Reference Marks, Attewell, Hooghe, Rovny and Steenbergen2022), we analysed to what extent urban and higher-educated voters are over or underrepresented in GAL and TAN parties’ electorates. We conclude that urban-rural divides in voting along the transnational cleavage have widened substantially, and this trend persists even after accounting for education. Our results contribute in at least two important ways to future research on the transnational cleavage in European politics.
Our first contribution is that urban-rural differences in GAL/TAN voting are only for a minor part explained by differences in educational attainment between urban and rural inhabitants. Both education and urbanisation have their own explanatory value in explaining voting behaviour along the transnational cleavage. Regarding support for TAN parties, the well-established educational divide (Cavaille and Marshall Reference Cavaille and Marshall2019a; de Jong and Kamphorst Reference de Jong and Kamphorst2024; Hainmueller and Hiscox Reference Hainmueller and Hiscox2007; Hakhverdian, van Elsas, van der Brug et al. Reference Hakhverdian, van Elsas, van der Brug and Kuhn2013; Hooghe, Marks, and Kamphorst Reference Hooghe, Marks and Kamphorst2024; Kuhn, Lancee, and Sarrasin Reference Kuhn, Lancee and Sarrasin2021; Kunst, Kuhn, van de Werfhorst et al. Reference Kunst, Kuhn and van de Werfhorst2020; McNeil and Simon Reference McNeil and Simon2024) has clearly increased over time (see also Hooghe and Marks Reference Hooghe and Marks2025) and is substantially larger than the urban-rural divide that only slightly increased. However, when it comes to support for GAL parties, we see a different pattern: urban-rural differences have clearly increased lately, to the point that they are similar in size to the educational divide in support for these parties that has been stable over the last two decades. Although both the urban-rural and the educational divides have increased over time, the former increase is most clearly visible when looking at GAL parties, whereas the latter appears most clearly when studying the TAN side of the transnational cleavage.
This adds to our understanding of structural differences underlying the transnational cleavage in European politics. It shows that (increasing) urban-rural differences in cosmopolitan-nationalist attitudes that were documented in several countries (Huijsmans, Harteveld, van der Brug et al. Reference Huijsmans, Harteveld, van der Brug and Lancee2021; Luca and Kenny Reference Luca and Kenny2024) translate into increasing urban-rural differences in GAL/TAN voting. It is also in line with previous studies noticing (increasingly) strong support for green and social-liberal parties in cities and for radical right parties outside booming cities (de Dominicis, Dijkstra, and Pontarollo Reference de Dominicis, Dijkstra and Pontarollo2022; Dvořák, Zouhar, and Treib Reference Dvořák, Zouhar and Treib2022; Huijsmans and Rodden Reference Huijsmans and Rodden2024; Rodríguez-Pose Reference Rodríguez-Pose2020; Schmalz, Singe, and Hasenohr Reference Schmalz, Singe and Hasenohr2021). However, our paper adds some nuance to these findings by showing that these geographic differences cannot be largely explained by inhabitants’ educational backgrounds. On the contrary, urban-rural differences in attitudes towards immigration are largely explained by differences in educational and occupational background between urban and rural inhabitants (Maxwell Reference Maxwell2019). To further our understanding of why both education and urbanisation seem separate explanations for voting along the transnational cleavage, future work should further dive into political attitudes underlying increasing urban-rural and educational differences in GAL/TAN voting. We assume that the increasing urban-rural difference in cosmopolitan-nationalist attitudes – combined with the increasing salience of these issues – is an important explanation, but attitudes towards, for example, gender and sexuality, climate change and agricultural policies may play an important role as well. Further, political actors may increasingly – implicitly or explicitly – mobilise place-based identities so that place and vote choice have become more aligned over time (Huijsmans and van der Brug Reference Huijsmans and van der Brug2025; Jacobs and Shea Reference Jacobs and Shea2023).
Our second contribution is that we show that urban-rural differences in GAL/TAN voting appear at both ends of the transnational cleavage, building on previous literature that has focused mostly on the ‘TAN’ side (Dvořák, Zouhar, and Treib Reference Dvořák, Zouhar and Treib2022; Evans, Norman, Gould et al. Reference Evans, Norman, Gould, Hood, Ivaldi, Dutozia, Arzheimer, Berning, van der Brug and de Lange2019; Rodríguez-Pose Reference Rodríguez-Pose2018; Schmalz, Singe, and Hasenohr Reference Schmalz, Singe and Hasenohr2021). However, the underlying pattern looks differently when focusing on GAL parties compared to TAN parties. There is a clear difference in support for GAL parties between large cities and their suburbs and outskirts on the one hand – where support is relatively high – and towns, villages and the countryside on the other hand. However, the pattern for TAN parties is non-linear, with support being clearly the lowest in the suburbs and outskirts of big cities, while support in the cores of these big cities is comparable to less-urbanised places. This may be partly explained by the fact that there is widespread variation in economic prosperity within and between cities, for example, between ‘booming knowledge economy hubs’ on the one hand and old industrialised cities on the other hand, implying that voters in many of these cities can feel ‘left behind’ by globalisation as well (Kühn Reference Kühn2015; Rodríguez-Pose Reference Rodríguez-Pose2018). To get better insight into the geography of support for TAN parties, it therefore does not suffice to distinguish between more- and less-urbanised places but requires a more fine-grained distinction between types of urban, suburban, and rural areas, for example, based on their economic context (Broz, Frieden, and Weymouth Reference Broz, Frieden and Weymouth2021).
That both urbanisation and education have their own explanatory value for voting along the transnational cleavage implies that there is a substantial degree of cross-cuttingness: GAL parties are supported relatively strongly by higher-educated voters from both urban and rural areas, and TAN parties by lower-educated voters from different types of places. Or formulated differently, support for GAL parties is relatively high in urban areas, among both lower- and higher-educated voters. This cross-cuttingness may help to dampen levels of affective polarisation along the transnational cleavage (Harteveld Reference Harteveld2021; Mason Reference Mason2016).
Importantly, our finding that urban-rural divides in GAL/TAN voting – and increases therein – remain after taking into account educational attainment does not prove that place of residence is causally related to vote choice. There are at least three ways in which future work can improve upon our study to really disentangle an effect of place from alternative explanations. First, we have not controlled for all potentially relevant sociodemographic characteristics that overlap with place of residence. Therefore, we do not know to what extent urban-rural differences are explained by well-known differences in voting behaviour based on religious or occupational backgrounds or social class (Marks, Attewell, Hooghe et al. Reference Marks, Attewell, Hooghe, Rovny and Steenbergen2022; Maxwell Reference Maxwell2019), for example, or by intersections of these characteristics. Future studies could build upon this one by systematically conducting time comparisons of a broader set of sociodemographic differences underlying GAL/TAN voting behaviour and by controlling for interactions between sociodemographic variables. Relatedly, there are numerous reasons for why people may selectively migrate to urban and rural places that are not well captured by socioeconomic and demographic variables. Therefore, to really disentangle the effects of place and education would require high-quality geocoded panel-survey data that allow control for selection mechanisms. Unfortunately, such data are not readily available for the large number of countries and extended period of time covered in this study, but future work could assess the validity of our findings in specific countries and time periods.
Second, we use subjective measures of urban and rural residence rather than objective measures (such as population density by zip code). This subjective measure may (partly) capture both objective location and place-based identification of respondents, and it is hard to determine which of these two parts of the urban-rural divide is captured most with this measure. If future studies aim to disentangle structural and identity-based mechanisms to explain our findings, it would be important to have geocoded data that gives insight into objective location at a reasonably low geographic level of aggregation (e.g., municipality or neighbourhood) and to supplement this with measures of place-based identification. Relatedly, with such data one could also analyse whether there are differences in GAL/TAN voting between inhabitants of different types of urban and rural areas (Scala and Johnson Reference Scala and Johnson2017), like there are differences between individuals with different fields of education (Hooghe, Marks and Kamphorst Reference Hooghe, Marks and Kamphorst2024). Fourth, we have pooled data from 25 different countries in our analysis, although previous studies have shown that urban-rural differences in political attitudes and voting behaviour can substantially differ between countries, even within Europe (Huijsmans and Rodden Reference Huijsmans and Rodden2024; Luca and Kenny Reference Luca and Kenny2024; Mitsch, Lee and Ralph Morrow Reference Mitsch, Lee and Ralph Morrow2021). Therefore, future studies could zoom in on country differences and analyse whether the explanatory value of urban-rural and educational differences for GAL/TAN voting varies between (types of) countries.
Notwithstanding these limitations, the important takeaway of our study is that urban-rural differences in voting along the transnational cleavage have increased over the last decades and that these differences are only to a minor extent explained by differences in educational attainment between urban and rural residents. These findings suggest that ‘place’ increasingly matters in its own right in structuring political conflict across Europe and highlight the importance of incorporating geography into future research on the transnational cleavage.
Data availability statement
All datasets used for this research are publicly available and referred to in the manuscript. Codes to match the separate datasets and replicate the analysis can be found at the Open Science Framework. A link to these replication files is included in the manuscript (https://osf.io/fapy8/overview).
Acknowledgements
We thank the participants of the workshop ‘Advances in Cleavage Research’, organised by Jonne Kamphorst, Liesbet Hooghe and Gary Marks at the European University Institute, Florence, on 3–4 June 2024, for their valuable comments, and the anonymous reviewers for their helpful comments and suggestions.
Competing interests
We hereby declare that we have NO affiliations with or involvement in any organisation or entity with any financial interest or non-financial interest in the subject matter discussed in this manuscript.
Ethical standards
The research meets all ethical guidelines, including adherence to the legal requirements of the country in which it was conducted. The analysis relied exclusively on publicly available, anonymised secondary data and therefore did not require ethical approval.
Appendix 1. Regression tables and additional graphs
Results of regression analysis on party-level measures, with country FE (N = 1,650)

Note: *p<0.05; country fixed effects included; observations (= parties) weighted for national vote share.
Results of individual-level regression models on voting for GAL parties
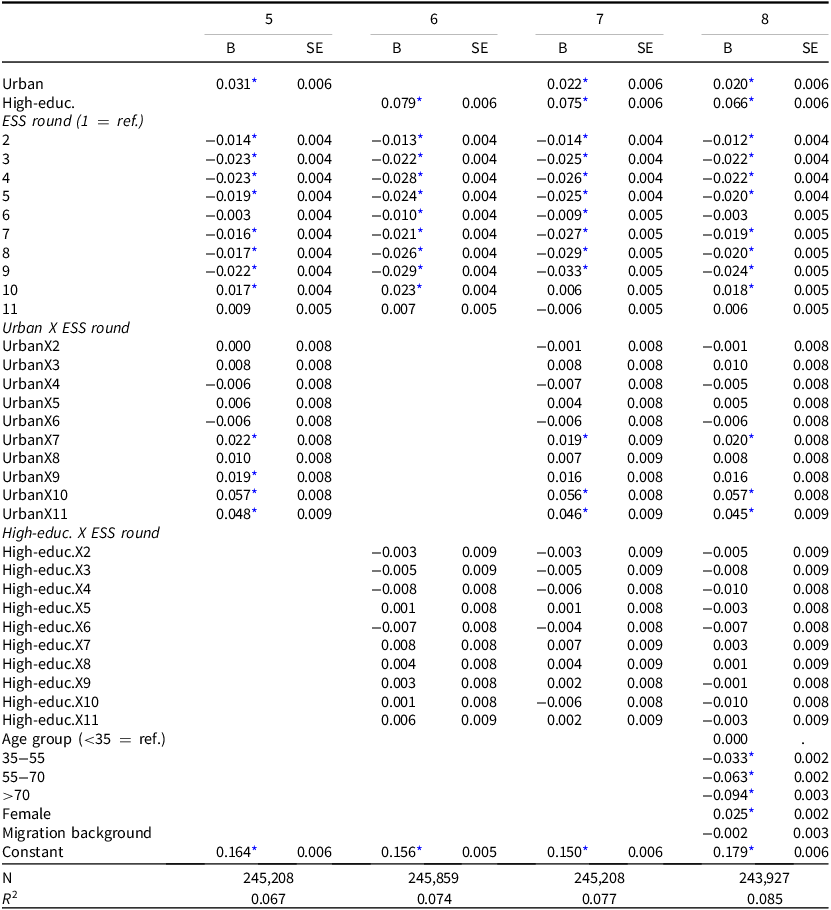
Table A2. Long description
The table presents results of individual-level regression models on voting for GAL parties. It includes columns for coefficients (B) and standard errors (SE) across models 5 to 8. The table has 45 rows and 16 columns. Column headers are 5 B, 5 SE, 6 B, 6 SE, 7 B, 7 SE, 8 B, and 8 SE. Row labels include Urban, High-educ., ESS round, Urban X ESS round, High-educ. X ESS round, Age group, Female, Migration background, Constant, N, and R2. Each row provides specific coefficients and standard errors for different variables and interactions. Notable trends include the impact of urban residence, high education, and various ESS rounds on voting preferences.
Note: *p < 0.05; country fixed effects were included.
Results of individual-level regression models on voting for TAN parties

Note: *p < 0.05; country fixed effects were included.
Results of individual-level regression models on voting for centre-left parties

Table A4. Long description
The table presents results of individual-level regression models on voting for centre-left parties. It has 16 columns labeled 13, 14, 15, and 16, each with B and SE values. The table includes rows for Urban, High-educ., ESS round, Urban X ESS round, High-educ. X ESS round, Age group, Female, Migration background, Constant, Observations, and R2. Each row contains B and SE values for the respective columns. Notable trends include varying B and SE values across different rounds and categories, with specific interactions noted for Urban and High-educ. categories.
Note: *p < 0.05; country fixed effects were included.
Results of individual-level regression models on voting for centre-right parties

Note: *p < 0.05; country fixed effects were included.
Differences in GAL/TAN voting along the urbanization continuum among higher- and lower-educated voters.

Figure A1. Long description
The image contains four line graphs showing urbanization differences in voting patterns for GAL and TAN parties among higher- and lower-educated voters. Panel A: Lower-educated voters for GAL parties. The x-axis represents ESS rounds from 1 to 11, and the y-axis represents predicted probability ranging from 0 to 0.4. Multiple colored lines show varying trends over the rounds. Panel B: Higher-educated voters for GAL parties. The x-axis represents ESS rounds from 1 to 11, and the y-axis represents predicted probability ranging from 0 to 0.4. Multiple colored lines show varying trends over the rounds. Panel C: Lower-educated voters for TAN parties. The x-axis represents ESS rounds from 1 to 11, and the y-axis represents predicted probability ranging from 0 to 0.4. Multiple colored lines show varying trends over the rounds. Panel D: Higher-educated voters for TAN parties. The x-axis represents ESS rounds from 1 to 11, and the y-axis represents predicted probability ranging from 0 to 0.4. Multiple colored lines show varying trends over the rounds.
Predicted urban-rural differences and educational differences at the individual level based on logistic regression models, with and without controlling for each other, and with and without controlling for age and gender.

Predicted urban-rural and educational divides based on models with and without interactions between ESS round dummies and sociodemographic control variables age, gender and migration background.

Figure A3. Long description
The image contains four line graphs depicting predicted urban-rural and educational divides across different ESS rounds for GAL and TAN parties. Panel A: The top left graph shows the predicted urban-rural divide for GAL parties. The x-axis represents ESS rounds from 1 to 11, and the y-axis represents the predicted effect (dydx) for urban areas. The graph includes lines for baseline, time-varying gender, time-varying age, and time-varying migration, with visible trends showing fluctuations and an overall increase in the predicted effect over time. Panel B: The top right graph shows the predicted urban-rural divide for TAN parties. The x-axis represents ESS rounds from 1 to 11, and the y-axis represents the predicted effect (dydx) for urban areas. The graph includes lines for baseline, time-varying gender, time-varying age, and time-varying migration, with visible trends showing fluctuations and an overall decrease in the predicted effect over time. Panel C: The bottom left graph shows the predicted educational divide for GAL parties. The x-axis represents ESS rounds from 1 to 11, and the y-axis represents the predicted effect (dydx) for high education. The graph includes lines for baseline, time-varying gender, time-varying age, and time-varying migration, with visible trends showing fluctuations and a relatively stable predicted effect over time. Panel D: The bottom right graph shows the predicted educational divide for TAN parties. The x-axis represents ESS rounds from 1 to 11, and the y-axis represents the predicted effect (dydx) for high education. The graph includes lines for baseline, time-varying gender, time-varying age, and time-varying migration, with visible trends showing fluctuations and an overall decrease in the predicted effect over time.

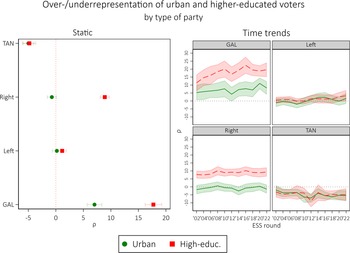
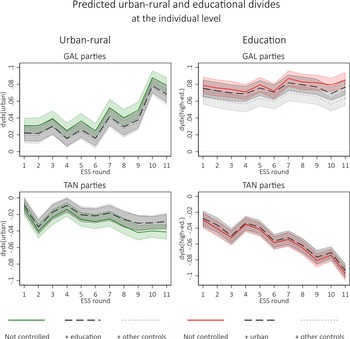


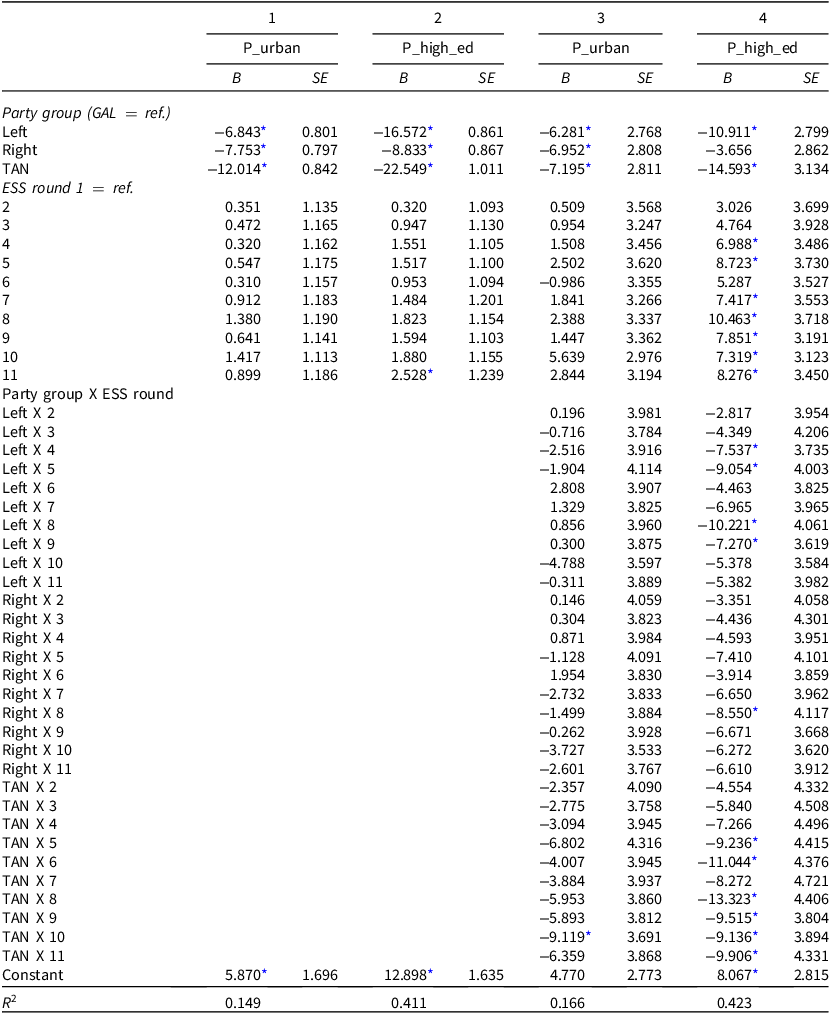
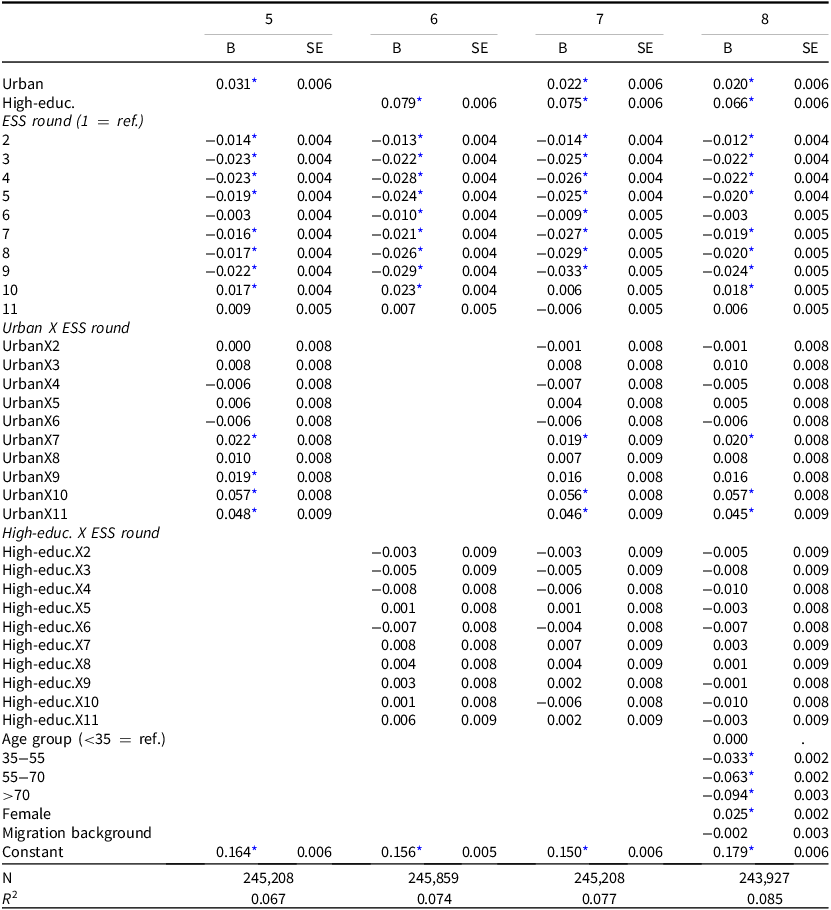
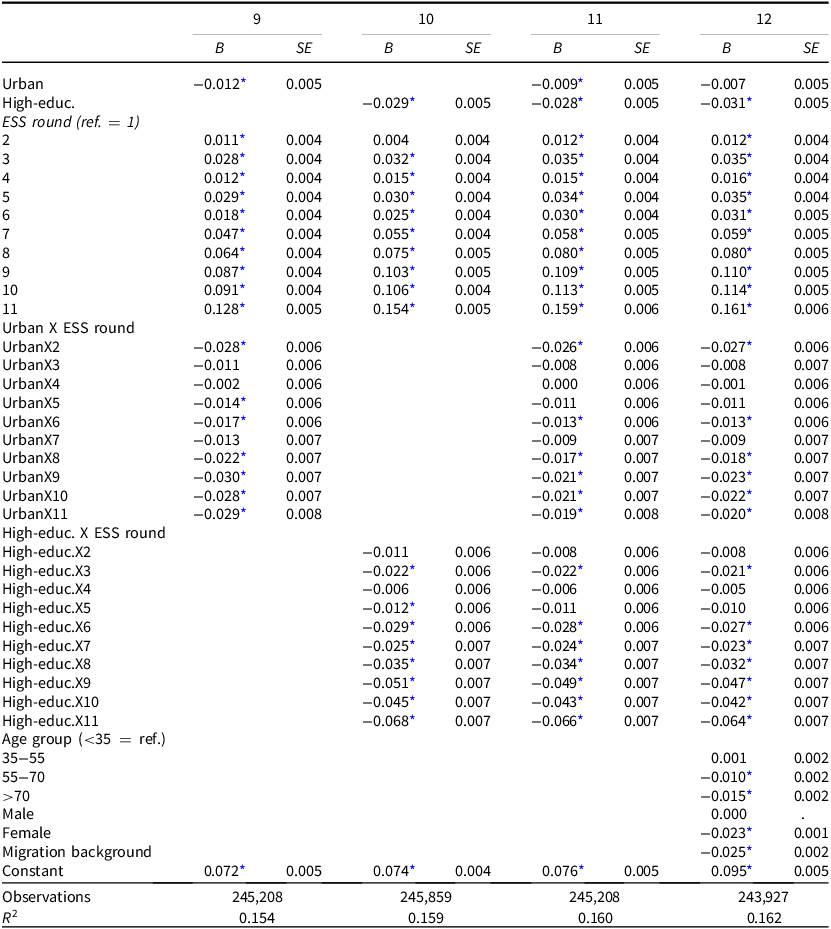
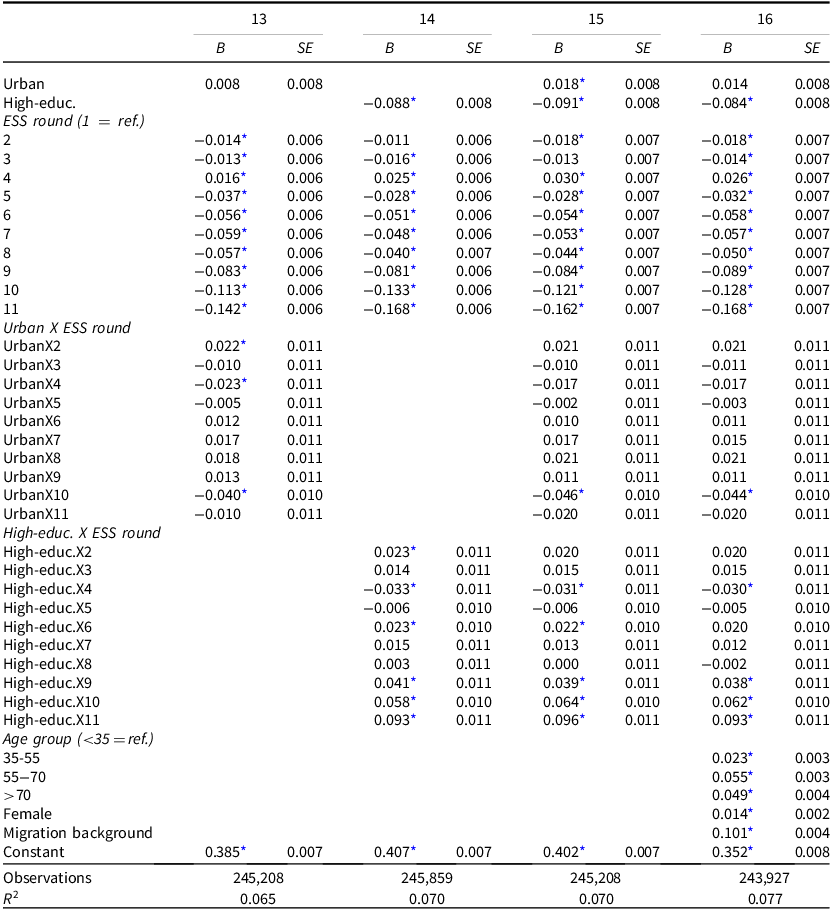
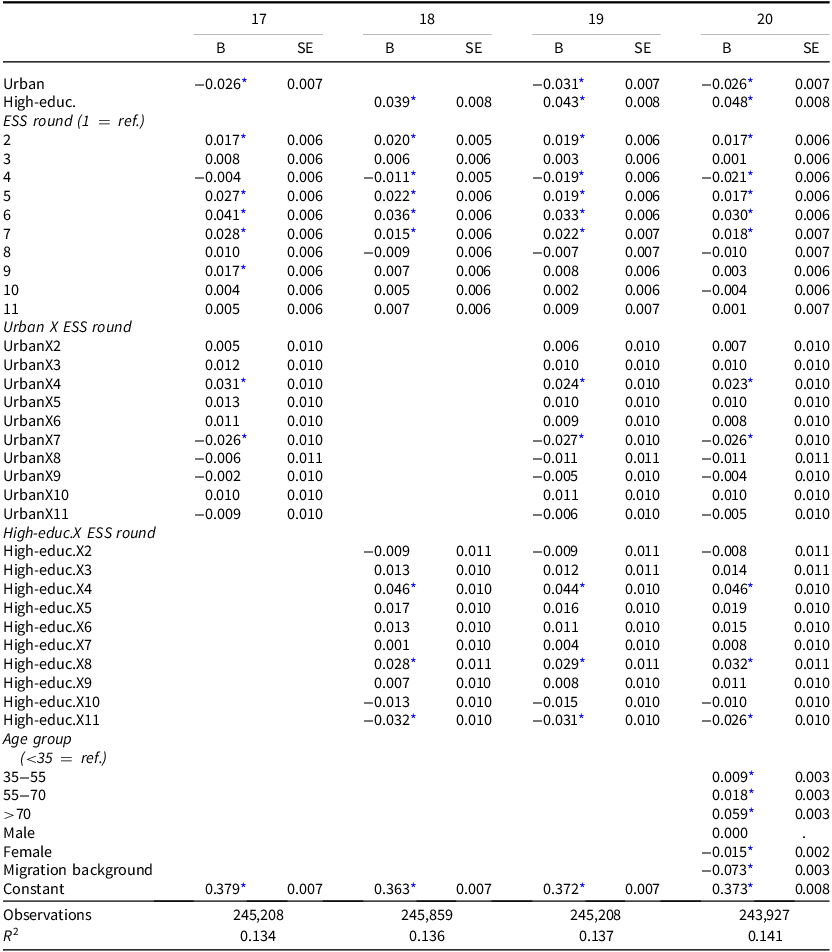


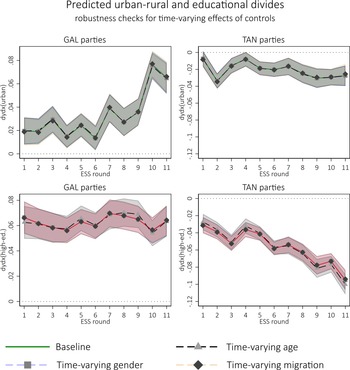

 Open access

