

1. Introduction
This study investigates whether shocks to the financial position of pension funds affect household saving behaviour. The structural trends regarding population ageing, low natural interest rates, and weak or stagnating economic growth have put the sustainability of the pension system under increasing pressure in many countries over the years. This has highlighted the need for reforms to provide adequate pension benefits and better prepare individuals for retirement by encouraging them to top up mandatory pensions with voluntary ones or private savings. At the same time, concerns about cyclical risks have also increased due to more frequent episodes of distress in financial markets, which can affect the investments of funded pension systems.
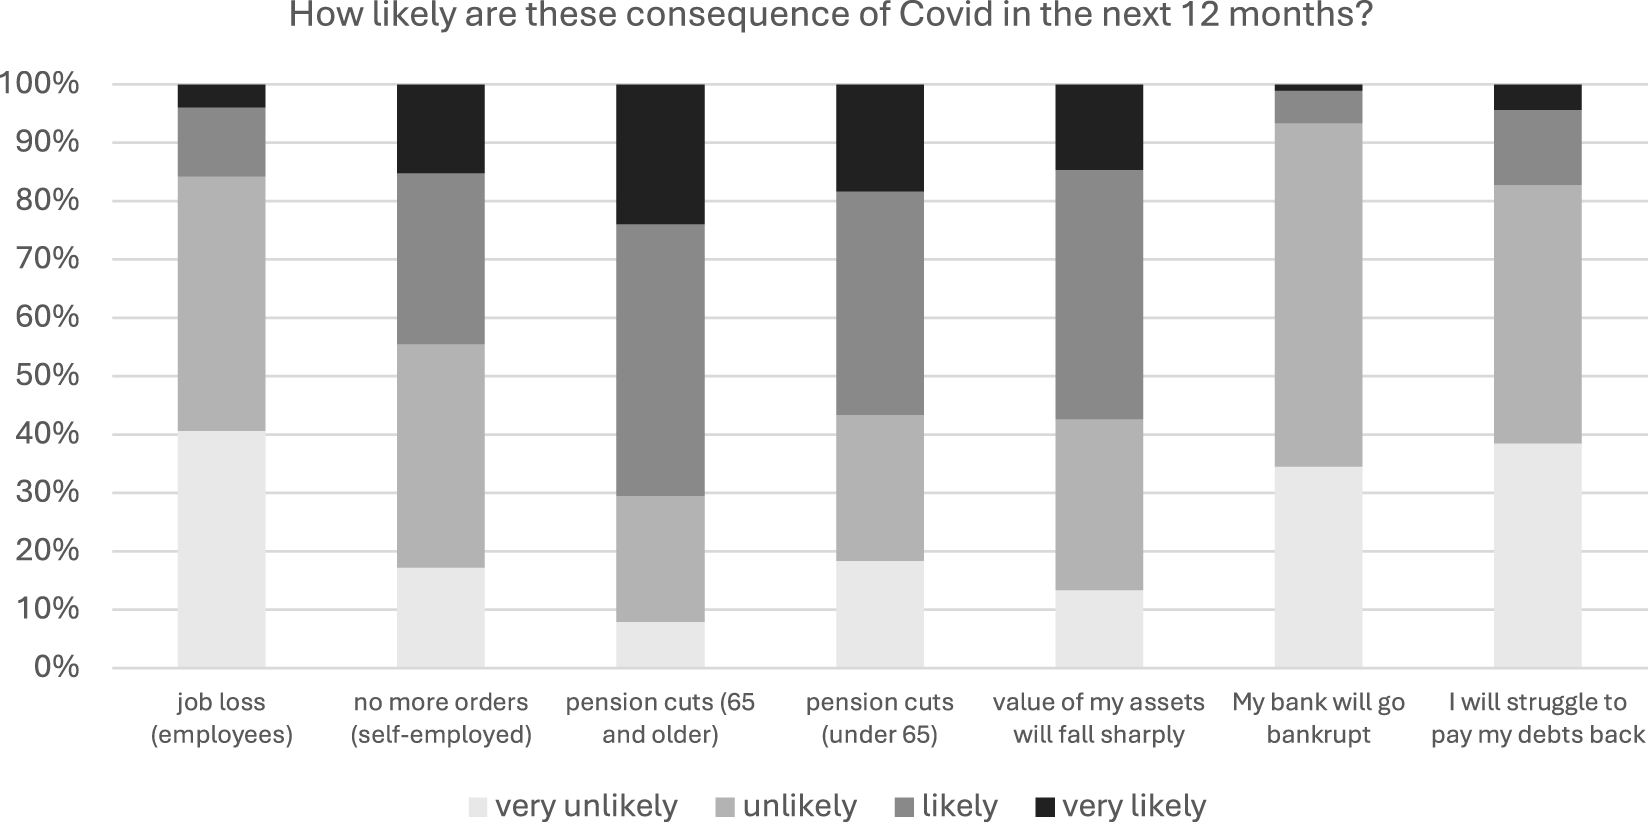
Our empirical analysis focuses on the Netherlands, a country with the world’s largest pension fund sector relative to the size of the economy, given by its GDP. In this context, shocks to the financial position of pension funds can exert substantial influence on both financial stability and the real economy. The discussion about the consequences of major instability in the pension fund sector has gained renewed momentum following the COVID-19 pandemic, when the Dutch pension fund sector witnessed a substantial decline with total asset value plummeting by almost 120 billion euros within a single quarter. The statutory funding ratio of the entire sector, that is, the ratio between the value of assets and liabilities, dropped by nearly 10 percentage points and went in a few cases below 90 percent.Footnote 1 This raised major concerns about the sustainability of the whole system. A funding ratio below 100 percent indicates that the current value of assets falls short of the present value of liabilities, which are accrued from the pension contributions of pension fund members, typically workers employed in a specific industry or company. Concerns regarding the financial position of pension funds were also common among households, as highlighted by the responses to a questionnaire designed by the Dutch National Bank (De Nederlandsche Bank, DNB) to track people’s expectations for the repercussions of the pandemic. These responses, reported in Figure A1 in the Appendix, show that more than half of all respondents to the survey reported that a pension curtailment was either likely or very likely. This led us to inquire whether individual savings decisions are influenced by concerns about the financial position of pension funds and, consequently, their personal pension wealth.
Recent theoretical work shows that funded systems incentivise savings but are also exposed to shocks (Tamai, Reference Tamai2023). The empirical literature on wealth effects has emphasised the importance of distinguishing between endogenous and exogenous wealth changes, that is, changes in wealth stemming from changes in asset allocations and asset prices. Examples include financial wealth (Paiella and Pistaferri, Reference Paiella and Pistaferri2017) and housing wealth (Caloia and Mastrogiacomo, Reference Caloia and Mastrogiacomo2022). For pension wealth, most of the literature focuses on the identification of the so-called displacement effect, that is, the substitutability between mandatory public savings and voluntary private savings effects. The displacement effect can be understood as the extent to which private savings and/or wealth shrinks (grows) when public mandatory pension wealth increases (decreases). Empirical estimations of the displacement effect usually depart from the 100 percent displacement effect suggested by a life-cycle model with no uncertainty or with certainty-equivalence, and this is usually attributed to the existence of liquidity constraints and various sources of uncertainty. In this literature, exogenous changes in pension wealth are derived using either pension reforms (Attanasio and Brugiavini, Reference Attanasio and Brugiavini2003; Attanasio and Rohwedder, Reference Attanasio and Rohwedder2003; Börsch-Supan et al., Reference Börsch-Supan, Reil-Held and Schunk2008; Bottazzi et al., Reference Bottazzi, Jappelli and Padula2011) or changes to policy variables in the pension realm (Hurd et al., Reference Hurd, Michaud and Rohwedder2012; Alessie et al., Reference Alessie, Angelini and Van Santen2013; Mastrogiacomo et al., Reference Mastrogiacomo, Dillingh and Li2023). The focus of this literature revolves around pension contributions, which represent the endogenous part of pension wealth accumulation. Causal effects are typically identified using regulatory changes affecting the amount of contributions. Contrary to most of this literature, this study focuses on changes in the financial position of pension funds resulting from changes in asset prices in financial markets, which are beyond the control of pension fund members. Changes in the financial position of pension funds can thus be seen as exogenous pension wealth shocks, that is, changes in pension wealth that are independent of one’s contributions.Footnote 2
To study the impact of these shocks on household savings, we link survey data on household income, wealth and financial behaviour to novel supervisory data about the equity, asset allocation and recovery measures of Dutch occupational pension funds. The novelty of the data lies in its ability to combine qualitative information regarding household risk attitude and financial behaviour with quantitative information on the balance sheet and asset allocation of their pension fund. Specifically, we use the DNB’s Household Survey (DHS) which collects information on the income, wealth, and financial behaviour of Dutch households. In this survey, respondents are asked to identify their pension fund, regardless of whether they are still active participants. By using the name of the fund provided by the respondent, we link supervisory data containing information on the asset value and allocation of individual pension funds. The resulting dataset consists of a panel dataset covering more than 2000 household members and 98 funds, for a period of twelve years. A unique feature of the data used in this study is that it covers a long time span encompassing three major economic crises (the global financial crisis (GFC), the sovereign debt crisis, and the COVID-19 crisis) that severely impacted pension funds’ equity, as well as a change in the regulatory framework.
Our identification strategy exploits the substantial cross-sectional and time variations of the funding ratios to uncover how individual savings respond to aggregate shocks to pension wealth. A key identifying condition is that changes in funding ratio are assumed to be exogenous to changes in pension wealth for the members as shocks to the financial position of pension funds largely result from asset allocations and asset price corrections over which they have no direct control. In fact, changes in funding ratios are acknowledged as plausible exogenous shocks to pension wealth, as indicated by prior research (Van Santen (Reference Van Santen2019), Salamanca et al. (Reference Salamanca, de Grip and Sleijpen2020).
The main contribution of this paper is to provide evidence of how shocks to the financial position of pension funds affect household saving behaviour. Unlike prior research, this study takes a broader perspective regarding the shocks to the financial position of pension funds by looking beyond the level and changes in the funding ratio, for instance at how individuals respond to their pension fund getting underfunded or to a stop to pension indexation and to pension curtailment. To the best of our knowledge, this is also the first study to investigate the empirical relationship over a long period encompassing three major economic crises that severely compromised the ability of the pension system to meet the promises about future pension benefits. Finally, we test the transmission channels involved and, in line with the existing literature, we provide consistent estimates of the displacement effect to unveil the implied substitutability between mandatory public savings and voluntary private savings underlying this effect.
Our findings offer valuable evidence of how fund members respond to shocks to the financial position of their occupational pension funds. Specifically, both lower levels and negative changes to the funding ratio are associated with higher voluntary active savings of fund participants, who also increase savings in the event of a severe funding deficit. The negative relationship between funding ratios and individual savings can be attributed to the lower expectations of future benefits following such shocks. The magnitude of this relationship suggests a displacement effect of about 40 percent. Furthermore, our results suggest that the increase in private savings due to shocks in the financial position of funds is primarily driven by members of pension funds with a history of lower returns on their investment portfolios. Notably, the estimates do not vary significantly across different age groups, levels of self-reported risk aversion, or household income.
Regarding the validity of our results, caution should be applied when generalizing the results to other countries or pension systems. On the one hand, similar results are expected to apply to an increasing number of countries, given that many are shifting towards funded pension systems (Bonenkamp et al., Reference Bonenkamp, Meijdam and Ponds2017). On the other hand, the Netherlands reflects a very specific case at both the macro and micro levels, as the size of the pension fund sector is extremely large when compared to the size of the economy, and occupational pensions have a major weight in the overall pension received by Dutch retirees.
The remainder of the study is as follows. Section 2 presents institutional details on the Dutch pension system. Sections 3 and 4 present the data and the descriptive and empirical evidence. Sections 5 and 6 present the heterogeneity analysis and the robustness checks. Section 7 concludes.
2. Institutional setting
2.1. Dutch pension system
The Dutch pension system consists of three pillars. The first one – known as AOW (Algemene Ouderdomswet) – operates as a state-funded old-age pension under a pay-as-you-go (PAYG) scheme and is financed by income-related taxes. The primary goal of this pillar is to prevent poverty among the elderly by providing a uniform pension benefit to all residents aged 65 and above.Footnote 3 The benefit is linked to the statutory minimum wage and depends on the length of legal residence in the Netherlands and cohabitation.
The second pillar involves occupational pensions managed by pension funds. This pillar serves as a supplement to the uniform public benefit, targeting workers who earn more than the minimum wage (Bovenberg and Nijman, Reference Bovenberg and Nijman2019). Occupational pension schemes are typically associated with a single employer (although there are several large industry pension funds). These funds are governed by boards whose members are appointed by or on behalf of employers, employees, and pensioners (Chen and Beetsma, Reference Chen and Beetsma2015). They are organised as defined benefit (DB) plans, where the benefit is determined according to the number of years worked and a reference wage (either final pay or an average of previous earnings). However, since the participants themselves bear the residual risk of any shortfall of pension funds, this system can also be considered a hybrid, having characteristics of both DB and defined contribution (DC) plans. While the accrued pension rights are specified as in a common DB plan, they are also partially DC since the yearly indexation is linked to the financial position of the pension funds, and therefore to investment returns (Ponds and van Riel, Reference Ponds and van Riel2009; Bikker et al., Reference Bikker, Broeders, Hollanders and Ponds2012). Participation is mandatory for almost all employees (coverage is 90%), but it excludes self-employed workers.
The third pillar consists of voluntary personal pension provisions such as complementary pensions, annuities, and life insurance policies. These voluntary savings are eligible for almost the same tax benefits (Exempted premiums with Exempted returns and Taxed annuity stream or EET) as those applicable to occupational pension contributions, albeit sharing similar limitations, such as reduced liquidity. As in many other countries, the third pillar is the least popular (Knoef et al., Reference Knoef, Been, Alessie, Caminada, Goudswaard and Kalwij2016). Only a small fraction of workers voluntarily tops up their mandatory pension wealth with additional voluntary pension schemes.
2.2. Supervisory framework
The Dutch supervisory framework (Financieel Toetsingskader, FTK in Dutch) for the second pillar of the occupational pension fund sector was introduced in 2007. Under the FTK, the financial position of a pension fund is determined by the funding ratio (dekkingsgraad) which represents the ratio between its assets and liabilities.Footnote 4 If this funding ratio falls below the minimum required threshold, it indicates that total assets are insufficient to cover expected future liabilities, including the pension benefits of the members of the pension plan. In such a scenario, the pension fund is required to submit a recovery plan to DNB, which serves as the regulatory body. This specific plan sets out the strategy that the fund will adopt to enhance its financial position, aiming to surpass the mandated funding ratio.
In 2015, the FTK was replaced by the new financial assessment framework (nFTK). In the FTK, liabilities were discounted using adjusted market rates, but in the nFTK this has been replaced by the ultimate forward rate (UFR). This is relevant to our analysis since the period that we investigate witnessed a persistent decline in interest rates, which contributed to reducing the funding ratio. In an environment with unfavourable interest rates, investment returns and funding ratios became closely linked to the interest hedging strategies employed by pension funds. The revised framework was introduced with the goal of avoiding widespread curtailments by pension funds, as well as excessively long recovery periods. Under nFTK, the recovery period has been shortened to ten years, and pension funds are obliged to apply pension curtailments if the funding ratio remains below the minimum required funding ratio (104.3% at the time) for five consecutive years. The nFTK introduced new reporting obligations for pension funds, enabling DNB to monitor their financial health and intervene with recovery plans if financial positions deteriorate, thereby mitigating underfunding issues.
3. Data and descriptive statistics
The data used in the empirical analysis consists of two sources.Footnote 5 The first source is the DHS. The DHS is a representative annual survey held in Dutch. It contains detailed information about the income and wealth of respondents and also several detailed questions about the psychological aspects of financial behaviour. The second source consists of DNB supervisory data. Since the introduction of the new financial assessment framework as part of the Pensions Act, Dutch pension funds are required to report detailed information about their asset allocation and financial position. In principle, this information can be made public, as is done by means of the yearly financial reports of pension funds. The benefit of using the data collected by DNB is their completeness and comparability. The two data sources are linked via the following questions in the DHS:
1. ‘Do/did you participate in a pension fund through your current/past employer?’
2. ‘In which of the following pension funds do/did you participate through your current/last employment?’
The second question also allows an open answer if the pension fund is not listed among the options. By asking respondents which pension fund they are or were a member of, the DHS allows us to link survey data for each individual respondent with supervisory data of their occupational pension fund via the reported name of the fund. In that way, it is possible to obtain comprehensive information on both the financial situation of household members (e.g., their income, wealth, savings, and investments) and on the financial situation of the pension fund (e.g., asset values and allocations). For the period between 2008 and 2020, we have retrieved more than 98 pension funds and 2,113 pension fund members, making up a dataset of about 12,687 observations.
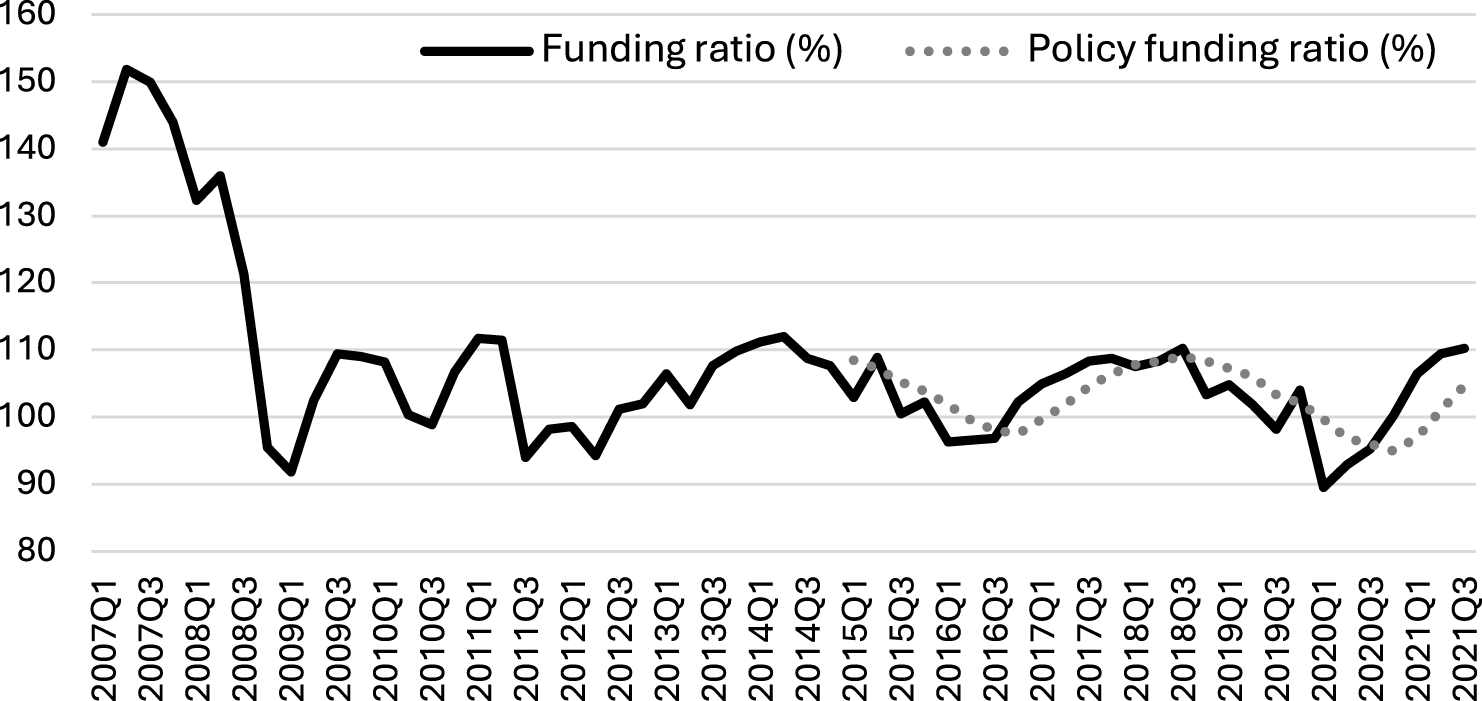
In addition, we use pension fund balance sheet data from DNB. The data encompass more than just the publicly available current funding ratio, as utilised in Van Santen’s (Reference Van Santen2019) work. It includes various pension fund characteristics like asset allocation, the rate of return for each asset class and reporting period, the number and type of pension fund members, pension fund size, costs, and any measure imposed by DNB as part of the recovery plan (pension adjustments, stops to conditional indexation, increased contributions). Figure 1 shows the development of the mean funding ratio in the occupational pension funds sector over the period 2007–2020, as it emerges from the supervisory data.
Funding ratios of pension funds.
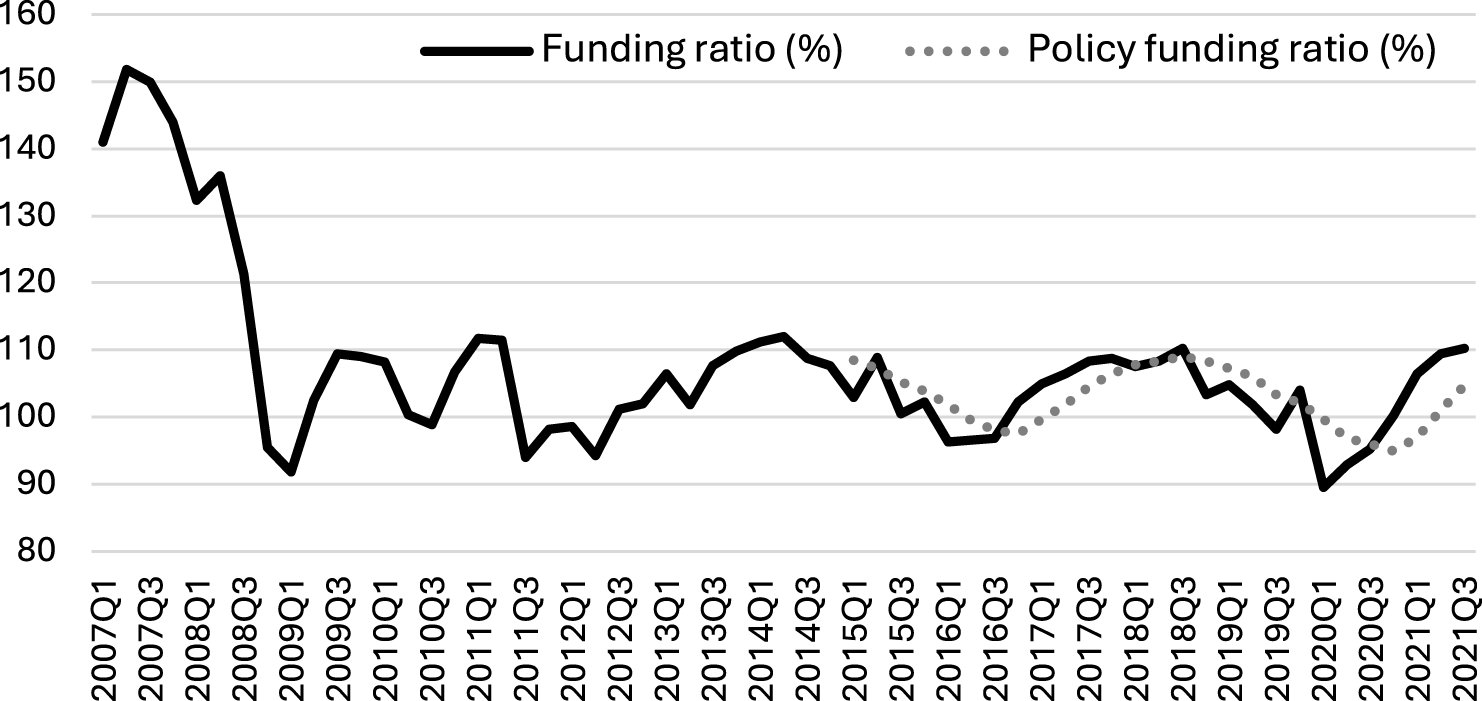
The figure shows the deterioration in the financial position of Dutch pension funds over this period: the GFC led to an unprecedented wipe-out in asset values, and the mean funding ratios fell from values near 140 percent to below 100 percent. Following this, despite a recovery of asset values after the GFC, funding ratios never recovered to pre-crisis values, due to the prolonged zero interest rate environment that characterised the monetary policy response to the GFC. Low interest rates are detrimental for investors such as pension funds, as they need to search for yields to guarantee pre-crisis levels of returns.
A higher risk profile of the investment strategy of pension funds is associated with larger asset price corrections during periods of crisis, such as during the sovereign debt crisis and the COVID-19 crisis, when sovereign bond and equity values were subject to strong price corrections. Following these episodes, the funding ratio of the pension fund sector did not come to exceed 110 percent, and in fact, dropped to values below 100 percent three more times, most recently during the COVID-19 pandemic. This means that pension funds could no longer use adjusted market rates (historically about 4%). The obligation to use the lower UFR, linked to current rates, has thus contributed to keeping funding ratios low.
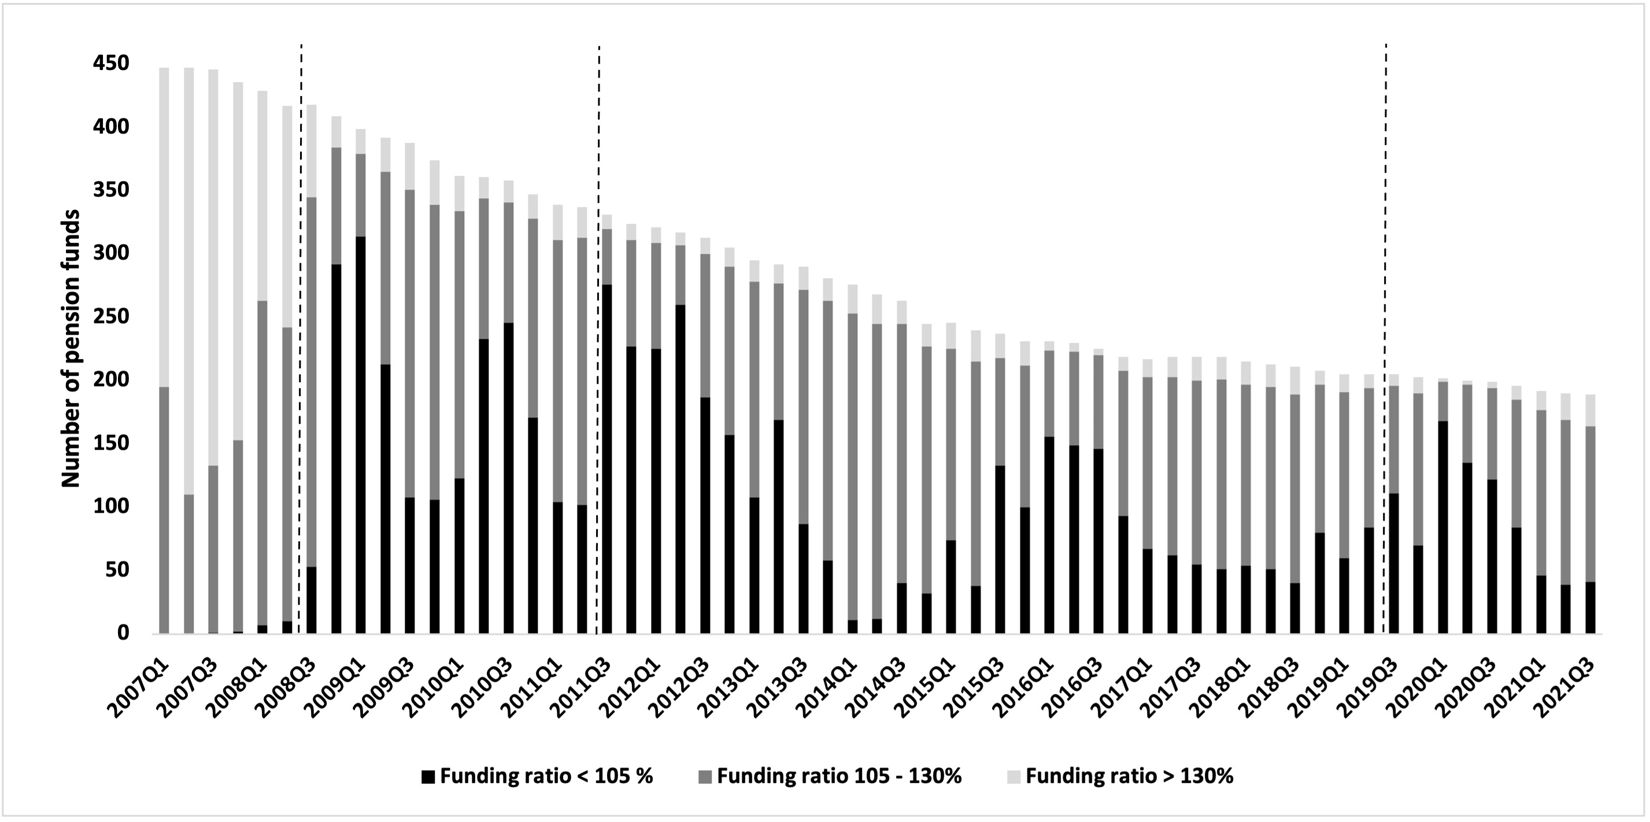
Figure 2 further documents the heterogeneity in pension fund financial positions by showing the breakdown of the number of pension funds by the level of their funding ratio. Before the GFC, no pension fund had a funding ratio below 105 percent. This means that the asset position of all pension funds was high enough to cover their liabilities. Less than a year later, about 80 percent of pension funds had funding ratios below 105 percent. Despite a temporary recovery following the crisis, the susceptibility of Dutch pension funds persisted. This was apparent from the significant count of pension funds having low funding ratios (below 105%) during years that were economically favourable for the Netherlands, spanning from the aftermath of the sovereign debt crisis to the onset of the COVID-19 pandemic (2014–2019).
Distribution of funding ratio of pension funds, in buckets, period 2007–2020.
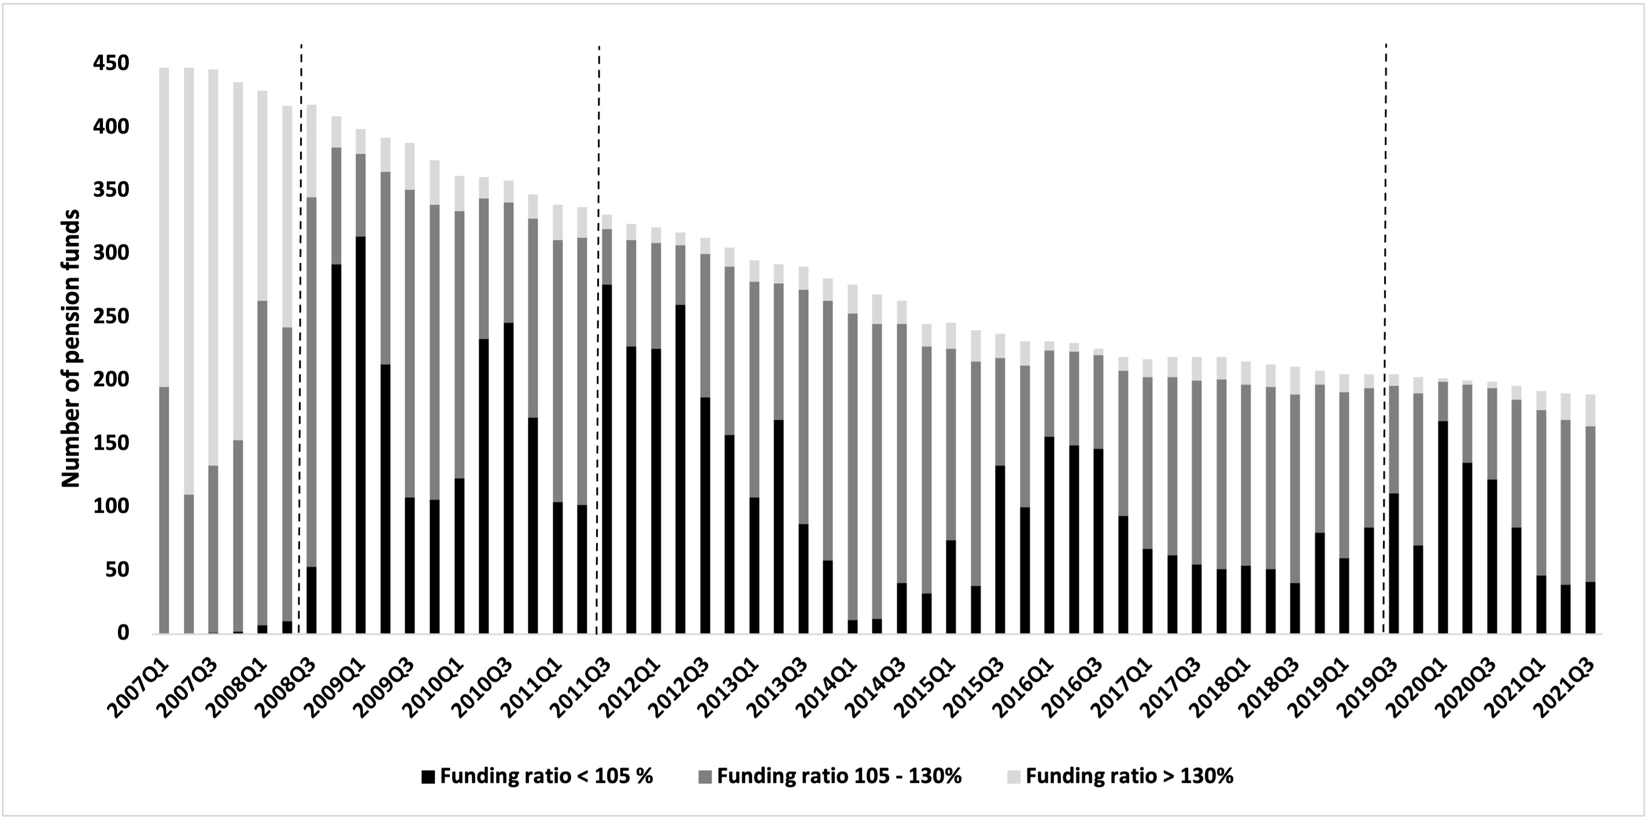
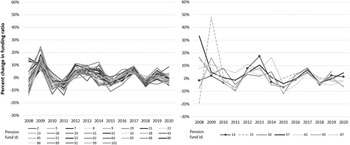
Figure 3 further shows the development of the funding ratio of the 38 pension funds (out of the 98 funds observed in total) that are observed throughout the entire sample period. The right panel shows that while the levels of the funding ratio can differ substantially across funds, the yearly changes in the funding ratios, shown in the left panel, seem to follow a common trend. The left panel shows that when looking in more detail at fewer pension funds, high heterogeneity emerges also with regards to the changes in the funding ratio.
Percentage change in funding ratio over time and cross-sectional variation.
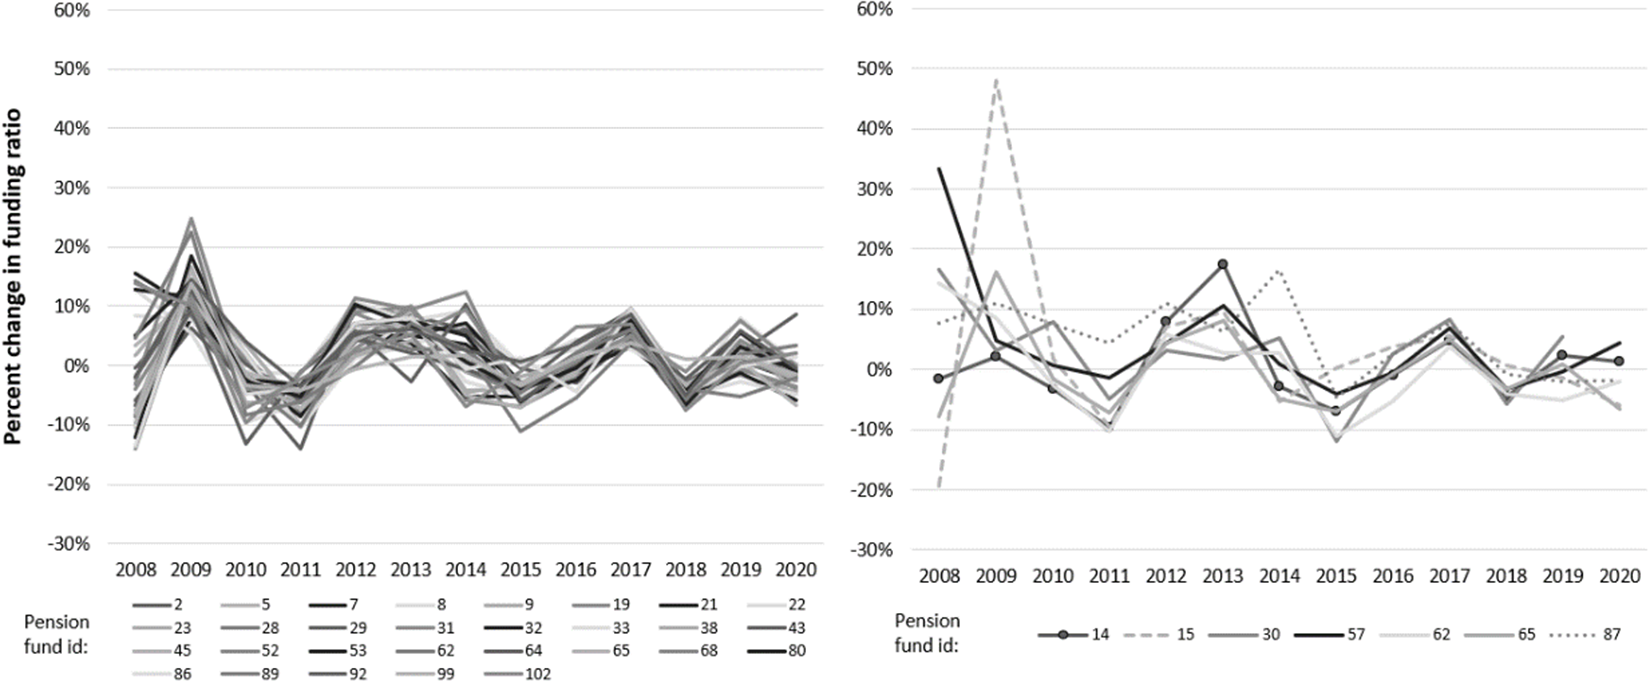
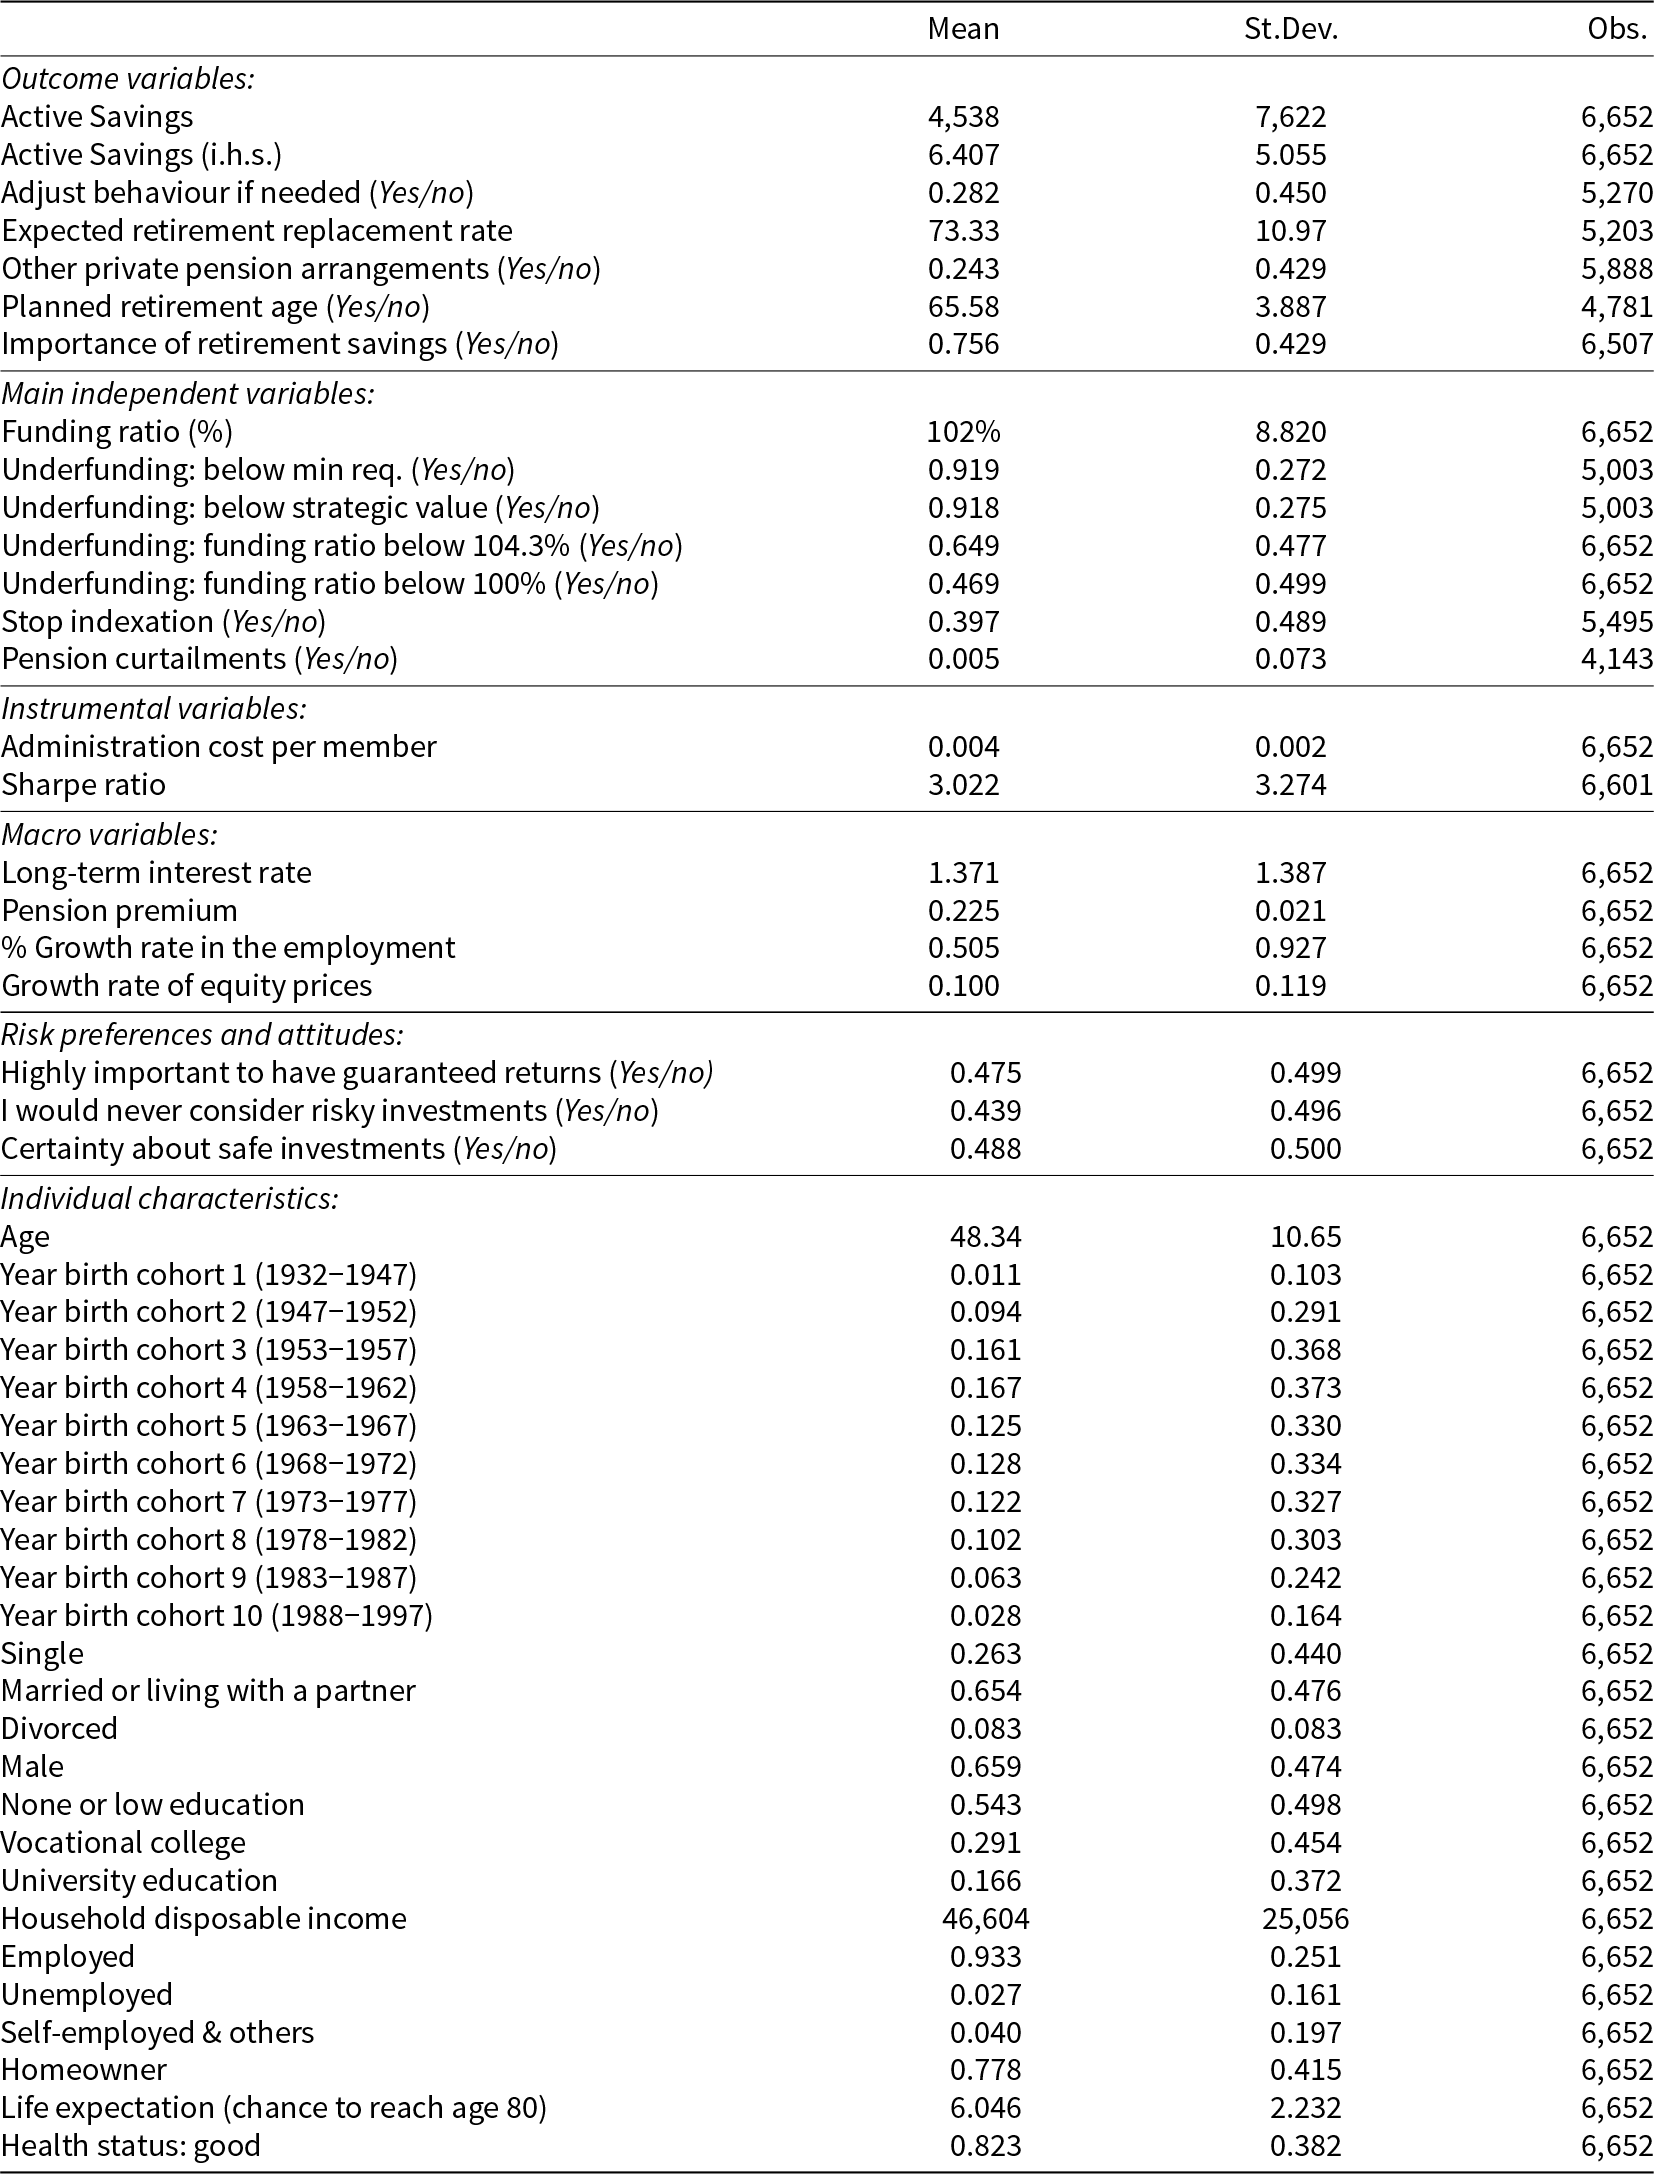
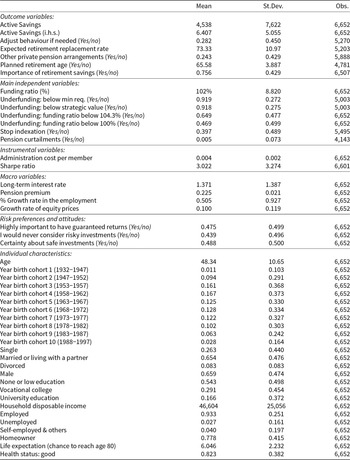
Table 1 presents the averages of the most relevant variables derived from the complete dataset used in the empirical analysis. The full list of variables and more detailed descriptive statistics are presented in Appendix, Table A1.
Means of selected descriptive statistics

Notes: The table reports descriptive statistics on the main variables used to investigate the financial position of pension funds (left panel) and the financial behaviour of pension fund members (right panel). The statistics in the left panel are at the level of the pension fund. The statistics in the right panel are at the level of the individual. The number of observations corresponds to the estimate of specification (b) of Table 2.
4. Empirical analysis
4.1. Pension funds’ funding ratios and household savings
This section investigates whether shocks to the financial position of occupational pension funds impact the individual saving decisions of pension fund members. To answer this question, the identification strategy exploits the cross-sectional and time variations in the financial position of pension funds, as well as the heterogeneity in the type and size of the shocks to their financial position. We estimate the following equation:
 \begin{equation}{s_{i,p,t}} = {\text{ }}{c_p} + {\beta _1}{\text{ }}shock{{\text{ }}_{p,t}} + \delta '{X_{i,t}} + {\text{ }}\gamma '{Z_t} + {\varepsilon _{i,p,t}}\end{equation}
 where  ${s_{i,p,t}}{\text{ }}$represents active savingsFootnote 6 of individual $i$, member of pension fund $p$, at time $t$. Active saving is a flow measured in EUR and represents a measure of savings that is not attributable to capital gains. This information is retrieved from the DHS, where respondents are asked how much money they had put aside in the last 12 months and whether they are able to make ends meet.Footnote 7 The main independent variable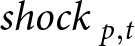 $shock{{\text{ }}_{p,t}}$ represents the shock to the financial position of pension fund $p$ at time $t$, proxied by the level and change of the funding ratio.
Equation (1) controls for a set of variables  ${X_{i,t}}$ potentially affecting individual saving rates. In particular, we include the net disposable income, a polynomial in age, marital status dummies, employment dummies, a gender dummy, a homeownership dummy, and health-related characteristics such as expected life-expectancy and self-assessed health condition. Moreover, we include the self-reported measures of risk-aversion and risk-attitude as binary indicators equal to 1 for respondents who ‘agree’ or ‘largely agree’ with the statements ‘it is important to have safe investments and guaranteed returns’, ‘I would never consider investments in shares because I find this too risky’ and ‘I want to be certain that my investments are safe’. Finally, ${c_p}{\text{ }}$represents a set of pension-fund fixed effects and ${Z_t}$ contains macroeconomic variables that jointly affect the development of funding ratios as well as individual savings, and ${\varepsilon _{i,p,t}}$ is the error term. The macroeconomic variables used are the long-term interest rate, the growth rate of equity prices and the percentage growth rate of employment in the population, all available from FRED .Footnote 8 The long-term interest rate determines the base market interest rate for long-term investors such as pension funds. The growth rate of equity prices, together with the long-term interest rate, explains a large fraction of the variation of the funding ratios (Kroon et al., Reference Kroon, Wouters and Leote de Carvalho2017) as pension funds invest heavily in equities and long-term government bonds given their long-term investment horizon. The percentage growth rate in employment of the population accounts for the fact that pension contributions – and thus pension funds liabilities – are not constant over the business cycle, but also depend on the number of active workers. The specification also controls for an index measuring the average pension contribution amount as a share of total wage, over time. This is used to account for potential feedback effects, that is, the impact of increasing pension contributions on the funding ratio and, indirectly, on household savings. This is because pension contributions have been increased over time (by about 40% over the 2007–2020 period) in an attempt to cope with the long-term effects of ageing population on pension sustainability.Footnote 9
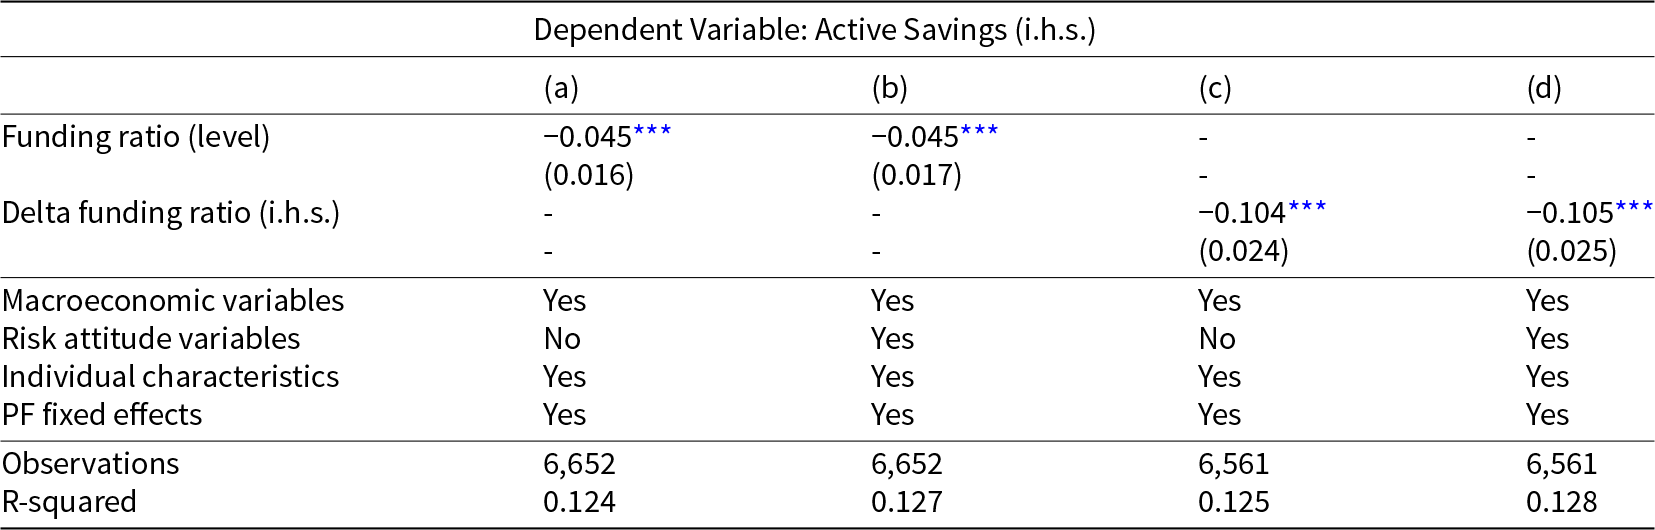
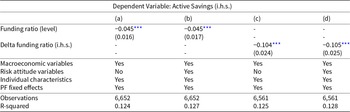
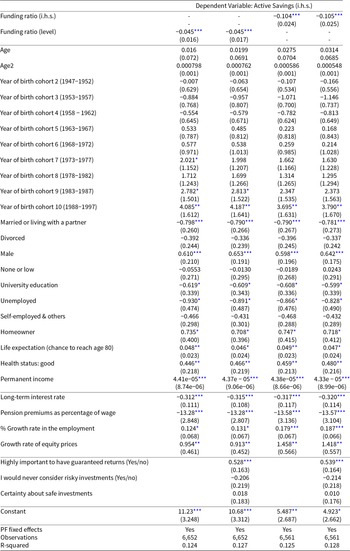
Results are displayed in Table 2 (see Table A2 in the Appendix for a detailed specification, including all control variables). Specification (a) controls for the set of macroeconomic variables. Specification (b) further controls for the self-reported measures of risk-aversion and risk-attitude. The advantage of controlling for the level of interest rate, inflation and employment growth is to account for time-specific effects that impact both the level of household saving and the funding ratio of pension funds. The advantage of controlling for these soft measures of risk and savings preference is to account for potential increases in saving rates explained by individual attitudes but correlated with drops in funding ratios: when uncertainty increases households typically increase their savings (precautionary saving) while financial markets usually feature asset price corrections, affecting the investment value of institutional investors such as pension funds and, thus, their funding ratio.
Main results
Notes: The dependent and main independent variables are transformed using the inverse hyperbolic sine (i.h.s.) All specifications are estimated via OLS. The control variables include net disposable income, a polynomial in age, year of birth cohort dummies, marital status dummies, employment dummies, a gender dummy, a homeownership dummy, and health-related characteristics such as expected life-expectancy and self-assessed health condition, the set of macroeconomic variables (pension premiums as percentage of wage, long-term interest rate, employment growth and growth rate of equity prices) and self-reported measures of risk-aversion and risk-attitude. Clustered standard errors by pension fund, in parentheses. Significance level:
*** p < .01, **p < .05, *p < .1.
Results show that when the funding ratio of a pension fund declines, savings increase among households that are members of that pension fund. The estimates suggest that a higher value of the funding ratio (one percentage point) translates, on average, into a 0.04 percent lower private active savings. Instead, a 1 percent decline in the funding ratio over time is associated with a 0.10 percent average increase in household savings. The main interpretation is that when the funding ratio declines, members of that pension fund anticipate a lower expected pension wealth. Lower pension wealth, for any levesl of pension contributions, should lead to an increase in private voluntary savings to maintain higher levels of consumption at the retirement age. In terms of size, the effect is stable across specifications. The first coefficient suggests that on average, a one percentage point decline in the funding ratio (from the average of 102% to 101%) increases mean active savings by 4.5 percent.Footnote 10 A back of the envelope calculation suggests that additional active savings amount to about 200 euros per year. The size of the effect is relatively large but suggests no full compensation, as a one percentage point shock in pension wealth (proxied by a 1 percentage point decrease in the funding ration) corresponds to about 1.500 euros, given that the average pension wealth in the Netherlands is 150.000 euros.
4.2. Funding deficits and household savings
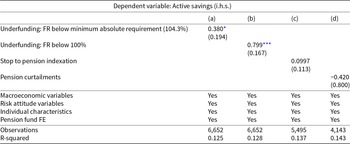
This section presents an in-depth analysis of the types of shocks affecting the financial position of pension funds and their impact on household savings. It explores the connection between a pension fund’s deficit and the saving behaviour of its members, as shown in Table 3.
Other type of shocks
Notes: The dependent variable is transformed using the inverse hyperbolic sine (i.h.s.) All specifications are estimated via OLS. The control variables include net disposable income, a polynomial in age, year of birth cohort dummies, marital status dummies, employment dummies, a gender dummy, a homeownership dummy, and health-related characteristics such as expected life-expectancy and self-assessed health condition, the set of macroeconomic variables (pension premiums as percentage of wage, long-term interest rate, employment growth and growth rate of equity prices) and self-reported measures of risk-aversion and risk-attitude. Clustered standard errors by pension fund, in parentheses. Reference number of observations, column (b) of Table 2. The drop of observations in columns (c) and (d) is due to missing values in the corresponding independent variables. Significance level:
*** p < .01, **p < .05, *p < .1.
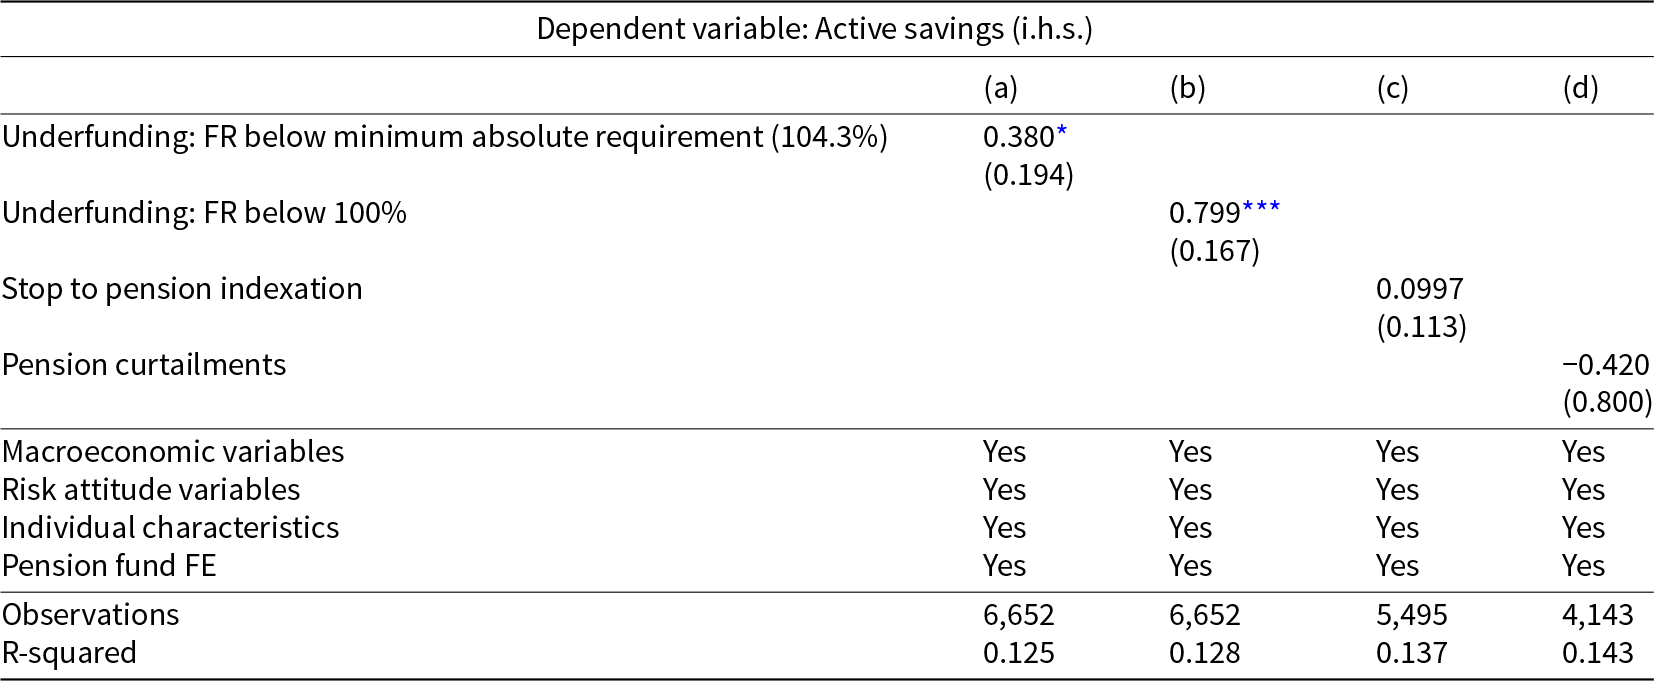
Pension funds are in a funding deficit when the level of the funding ratio goes below certain minimum thresholds. A first important boundary is the required coverage ratio. If the funding ratio drops below this boundary, pension funds must submit a recovery plan to DNB. This recovery plan sets out how a pension fund intends to ensure that the funding ratio returns to a level above the required funding ratio. Two types of minimum requirements exist: the so-called strategic and the current minimum requirement. The difference between the two is that the first is based on the strategic (or target) asset allocation, while a the second is based on the actual asset allocation at one particular moment in time. A second important boundary is the absolute minimum required coverage ratio, set as 104.3 percent. If the funding ratio drops below this level, the pension fund must take actions to improve its financial position. Possible actions include a stop to pension indexation (to inflation), increases in pension contributions, or, in extreme cases, pension curtailments. If the funding ratio goes below 100 percent, the value of current assets is lower than the value of current liabilities, so a fund will almost certainly have to reduce pensions in order to restore a sound financial position. Results are reported in Table 3. These are obtained by re-estimating eq. (1) using, as the main independent variable 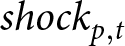 ${shock_{p,t}}$, a binary indicator equal to one for pension funds in a funding deficit, based on different values of the funding ratio and the recovery measures imposed on the pension fund. In detail, specifications (a) and (b) investigate the impact of pension funds going underfunded, using the current minimum requirement and the strategic thresholds, respectively. Specification (c) and (d) investigate the worst-case situations of a funding ratio going below the absolute minimum requirement and the 100 percent level, respectively. Finally, specification (e) and (f) investigate the impact on household savings of the follow-up actions imposed on the pension fund (stops to conditional indexation and pension curtailment, respectively) after a situation of underfunding has occurred and a recovery plan has been set out.
The evidence reported in Table 3 suggests that a household’s savings response to a situation of underfunding is statistically significant only when the financial position is compromised, and a follow-up action is more likely. Specifically, households do not increase their savings when the funding ratio of their pension fund goes below the minimum requirement (either strategic or actual), and the pension fund is asked to come up with a recovery plan. Instead, households increase their savings when the funding ratio reaches the absolute minimum requirement. This situation, unlike from the case where the funding ratio goes below the current or strategic minimum requirement, corresponds to a much more deteriorated financial position and implies the need for a follow-up action such as a stop to pensions indexation, an increase in pension contributions or a pension curtailment. Therefore, a funding ratio below these levels likely anticipates shocks to the pension wealth of their members. One important consideration is that, while not statistically significant, the point estimate of the impact of pension curtailments is negative, suggesting a decrease in savings, differently from all other shocks. The explanation of a negative effect likely relates to budget constraints effects. While shocks such as changes in funding ratio, stops to pension indexation or underfunding situations impact the expectation of future pension benefits, pension cuts lead to current budget constrain shocks and higher liquidity constraints on current pensioners,Footnote 11 which limit the extent to which they can save. Pension curtailments are a last resort solution in case of large financial imbalances and in fact have a low incidence in our sample, relative to the other shocks considered.
4.3. Transmission channels
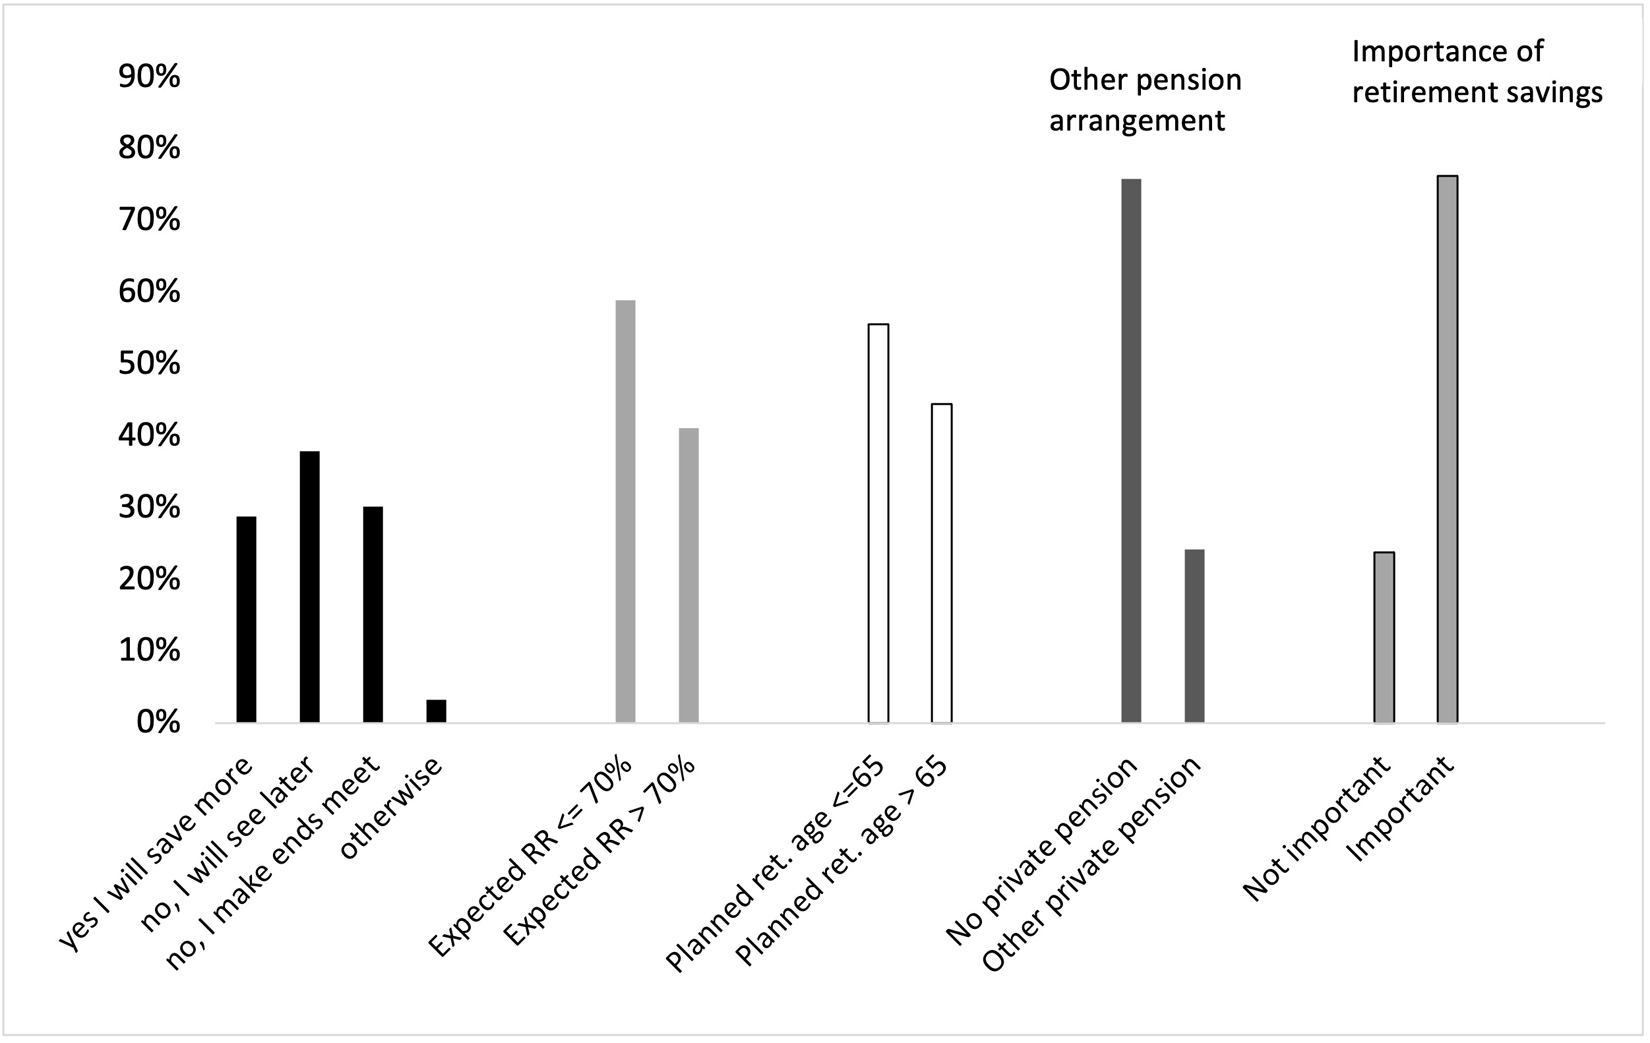
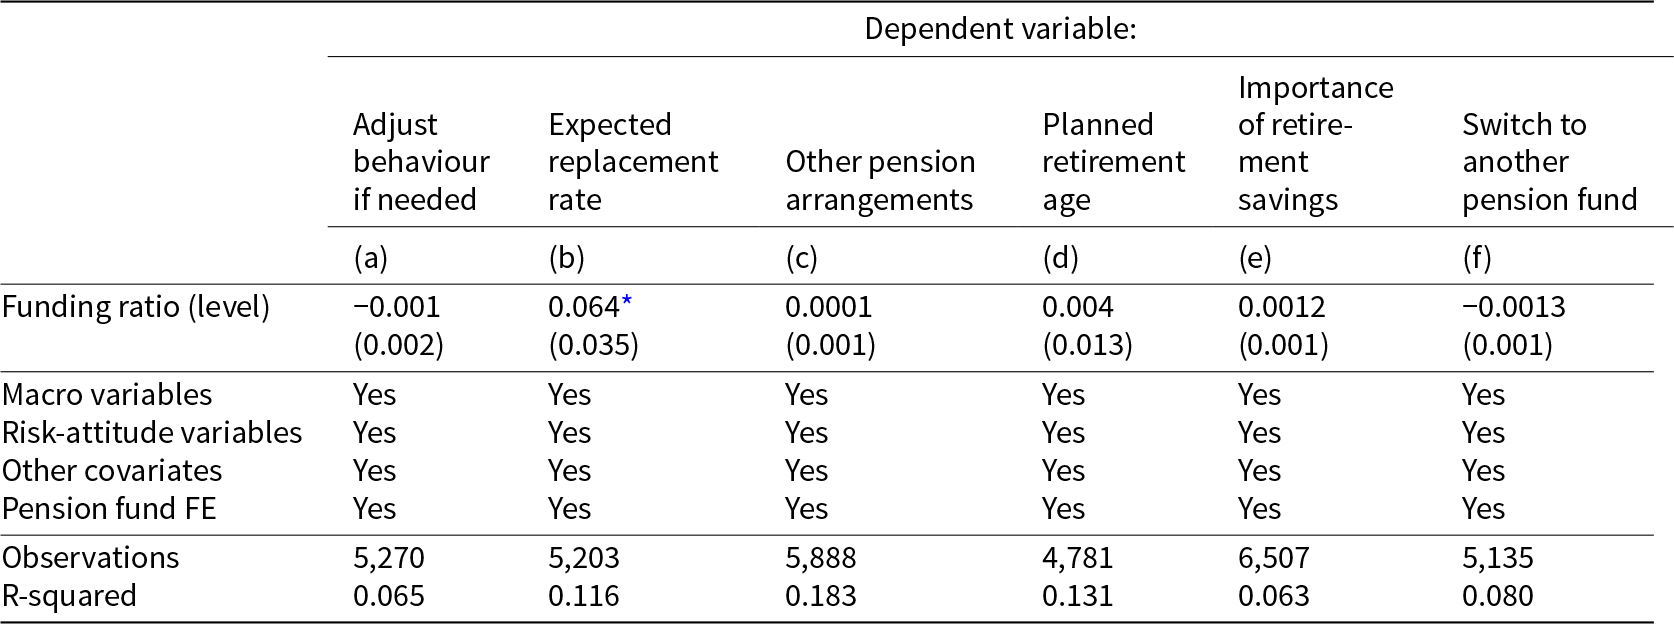
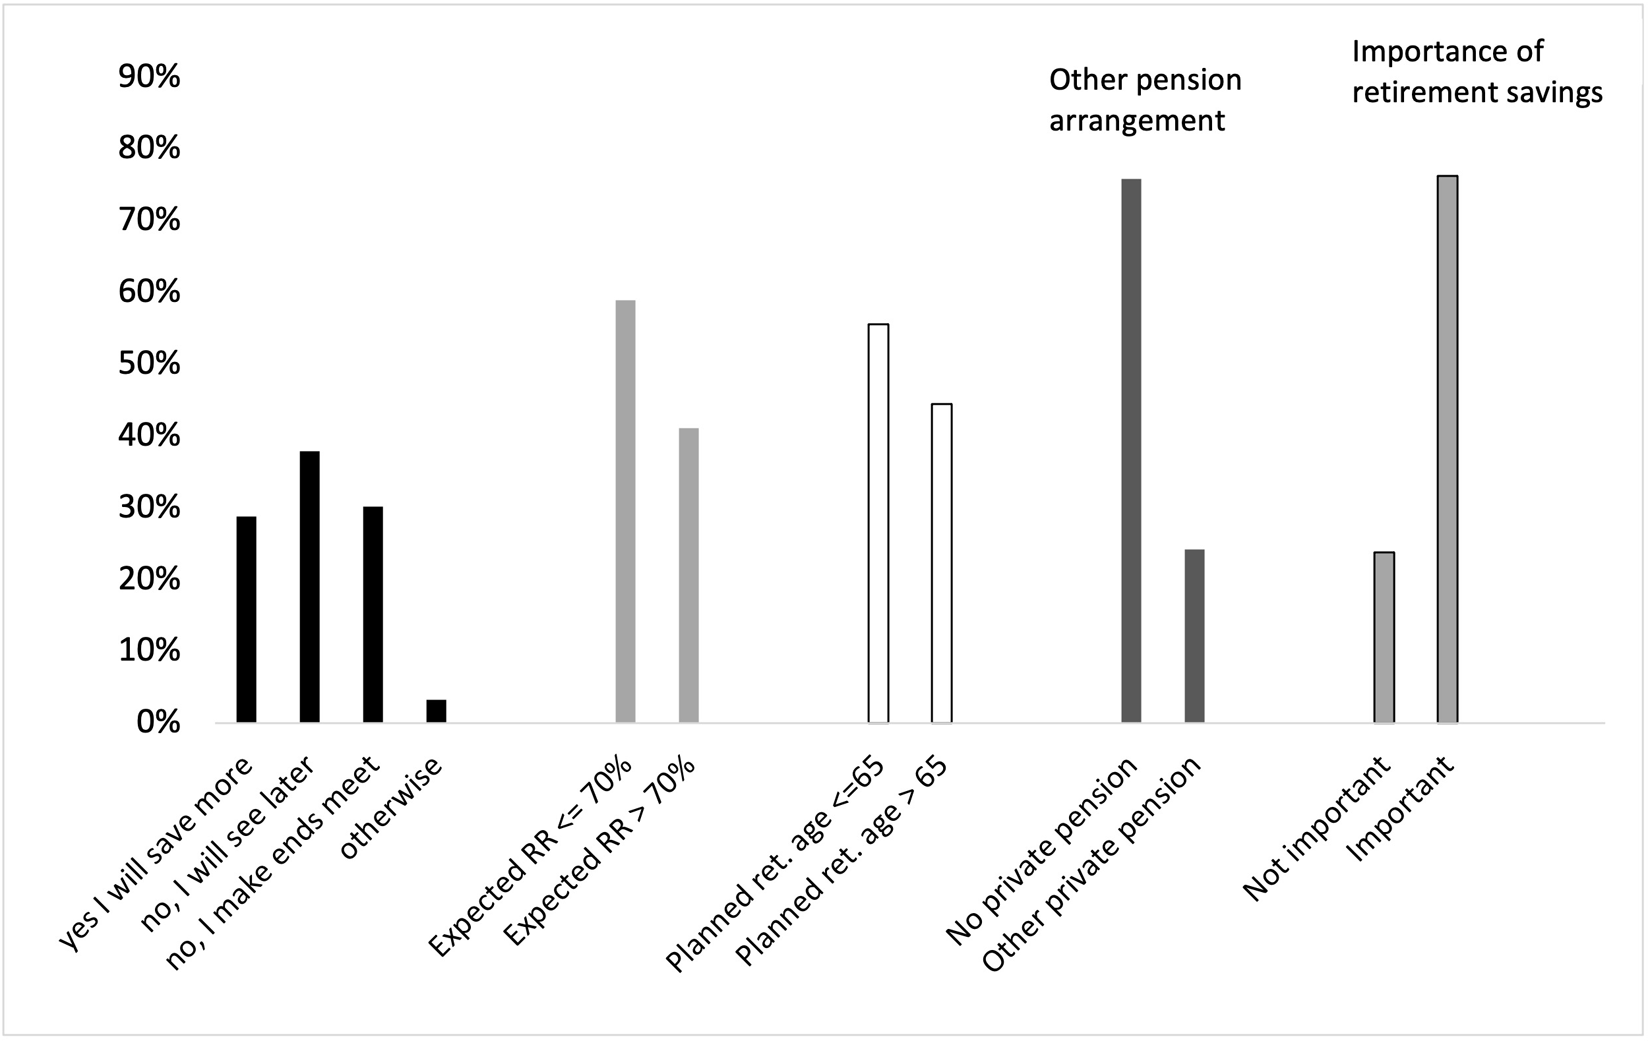
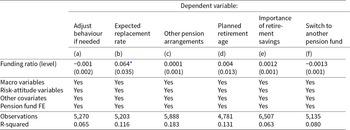
The previous sections document a robust relationship between household savings and shocks to the financial position of pension funds. This section builds upon the previous results by further investigating potential explanations and channels involved. We do this by re-estimating eq. (1) using a different set of dependent variables. Descriptive statistics on these variables are reported in Figure 4, while empirical results are provided in Table 4.
Description of variables representing potential transmission channels.
Transmission channels
Notes: All specifications are estimated via OLS. The control variables include net disposable income, a polynomial in age, year of birth cohort dummies, marital status dummies, employment dummies, a gender dummy, a homeownership dummy, and health-related characteristics such as expected life-expectancy and self-assessed health condition, the set of macroeconomic variables (pension premiums as percentage of wage, long-term interest rate, employment growth and growth rate of equity prices) and self-reported measures of risk-aversion and risk-attitude. Clustered standard errors by pension fund, in parentheses. Reference number of observations, column (b) of Table 2. The drop of observations is due to missing values in the new dependent variables. Significance level:
*** p < .01, **p < .05, *p < .1.
First, we investigate hypothetical behaviour if pensions were reduced (column ‘a’ in Table 4). For this, we use the elicited responses to a question in the DHS data, where respondents are asked: ‘Will you adjust your behaviour if pensions are reduced, for example through an adjustment on the indexation, postponement of the retirement age, or in case of a different pension system?’. Here, we distinguish the cases where the respondents reply ‘Yes, I will put more money aside for my pension’ from all other possible answers (‘No, I will see what I’ll do when it happens’; ‘No, I think I can make ends meet fairly easily with the pension I will have’ or ‘Otherwise’). Contrary to our main specification relating pension fund shocks to actual household behaviour, this specification tests whether there is any effect on household intentions. Results in column (a) of Table 4 indicate that changes in the funding ratio do not affect people’s responses regarding their intentions in case of a pension curtailment.
Second, we test whether shocks to the funding ratio affect the expectations of pension fund members regarding the amount of their pension wealth. To do this, we use the expected replacement rate as a dependent variable in a regression specification analogous to eq. (1). Results in column (b) of Table 4 confirm that higher funding ratios directly affect people’s expected replacement rates.Footnote 12 In particular, a one percentage point increase in the funding ratio is associated with an increase in the expected replacement rate by 0.06 percent, and the effect is statistically significant. The replacement rate is defined as the expected pension benefit, as a percentage of the final year’s net income. This result is in line with Van Santen (Reference Van Santen2019) for the 2009–2011 period.
Third, we test whether shocks to pension funds affect people’s willingness to top up their pension through other pension arrangements, such as annuities, life-insurance policies, or via extra pension rights acquired from the employer.Footnote 13 The results of Table 2 suggest that negative changes to the funding ratio are associated with higher voluntary savings by pension fund members, who may also want to put money aside to supplement their pension using retirement saving products. For instance, life insurance policies require holders to make periodic payments that respondents may use as commitment devices. Results in column (c) exclude this hypothesis, as lower funding ratios are not associated with higher willingness by respondents to top up their pension through other arrangements.
In addition, we test whether shocks to funding ratios affect people’s expectations regarding their retirement age. If people associate lower funding ratios with lower expected pension benefits, as shown in column (b) of Table 4, they might postpone the retirement age to maintain higher levels of pension benefits when retired. For instance, they might decide not to take advantage of early-retirement options. Results in column (d) also exclude this possibility, as we find no statistically significant association between the level of the funding ratio and the self-reported expectation about the retirement age.
Lastly, we examine respondents’ replies regarding their perceived importance of retirement savings depending on the financial position of their pension funds.Footnote 14 Results in column (e) suggest that a higher funding ratio is not associated with a higher perceived importance of savings for retirement. This suggests that workers with retirement savings preferences do not select into occupations and sectors covered by pension funds with higher levels of the funding ratio. This is also confirmed by the results of specification (f) which tests whether lower levels of the funding ratios lead respondents to shift to another pension fund the following year. This potential selection concern is further ruled out by the non-significant estimate in specification (f) of Table 4.
Overall, the results of this section suggest that lower funding ratios are mainly perceived as negative shocks to expected future wealth, given the evidence of lower expected replacement rates, which induce higher active savings. This is consistent with the fact that all respondents in the sample are currently active members of a pension fund, and report a current labour income, so lower funding ratios do not necessarily imply an immediate shock to their budget constraint and saving possibilities. With regards to their actual behaviour, the findings from Table 2 indicate higher active savings associated with lower funding ratios. Together with the evidence from Table 4, showing a non-statistically significant effect on the expected retirement age, the take-up of other pension arrangements and on the probability to switch fund, it suggests that workers mainly respond to a shock to their future wealth via voluntary private savings. They do so without changing their plans about retirement, (mandatory) retirement saving, or even employment (changing occupation allows worker to shift the already-accumulated pension wealth to other occupational funds). This in turn suggests a consumption-smoothing motive of households, as lower future wealth is replaced by higher current savings. This also suggests a shift away from the three-pillar pension system, as workers accumulate additional private voluntary savings held in current accounts or other financial assets, but do not take-up pension savings product such as annuity insurances, tax-efficient blocked savings accounts or complementary pension plans. Regarding households’ perceptions and hypothetical behaviour, the lack of correlation between the level of the funding ratios and the importance of retirement savings or need to deal with possible pension curtailments suggests that results are not driven by selection, whereby individuals with stronger preferences for retirement savings select into pension funds with higher funding ratios.
4.4. Displacement effect
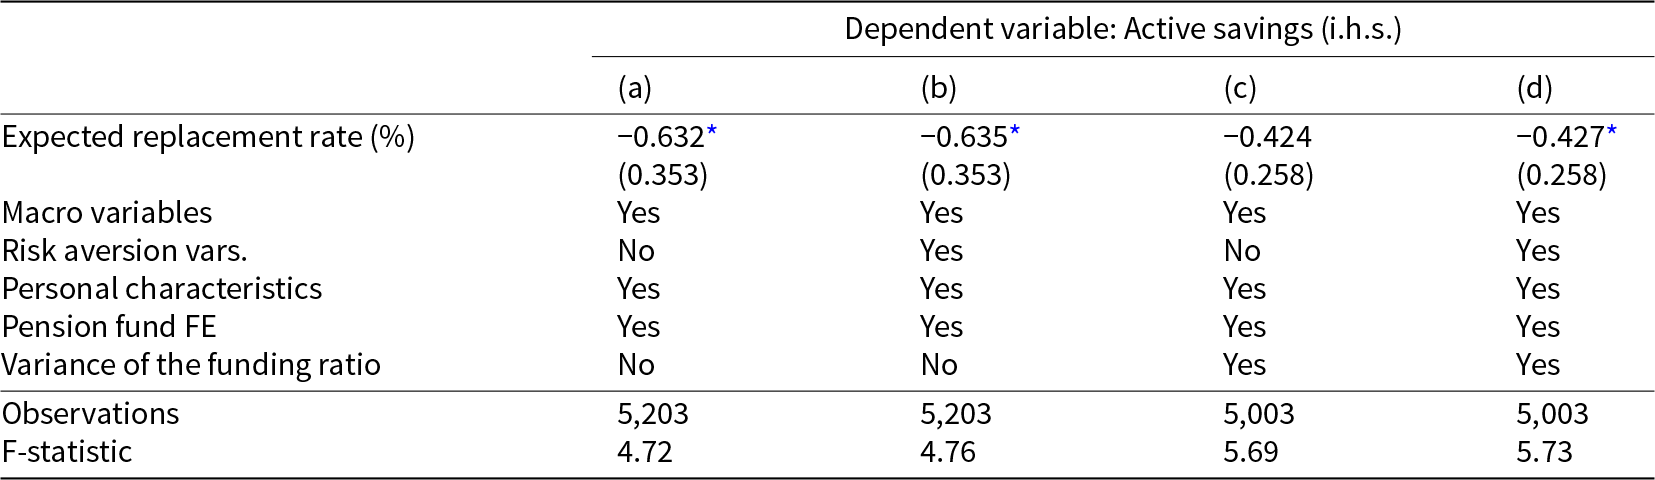
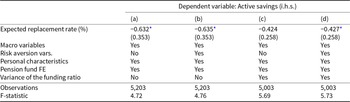
Section 4.1 provides evidence that the relation between pension fund funding ratios and individual active savings can be explained by the impact of the financial position of pension funds on the expected pension wealth of their members. This section builds further on this result by providing a direct estimate of the displacement effect implied by the negative relation between funding ratios. In fact, the result of Table 2 cannot be interpreted as an estimate of the displacement effect directly, as there is no clear correspondence between changes in funding ratios and changes in individual pension wealth. To do this, we estimate a specification similar to Van Santen (Reference Van Santen2019). In particular, we regress active savings on the expected replacement rate elicited by the respondents in the DHS, and we use the pension fund funding ratio as an instrument for this measure. In other words, we use specification (b) in Table 4 as a first-stage regression of a 2SLS estimate of the displacement effect. Results are provided in Table 5. Specifications (a) and (b) show the baseline estimates of the displacement effect. Specifications (c) and (d) further account for the variance of the funding ratio as part of the regressors to account for the role of uncertainty. The variance of the replacement rate, here proxied by the variance of individual funding ratios, has been found to be negatively correlated with the level of the funding ratio in Van Santen (Reference Van Santen2019), thus potentially causing a downward bias in the estimate of the displacement effect.
Displacement effect
Notes: The dependent variable is transformed using the inverse hyperbolic sine (i.h.s.) All specifications are estimated via 2SLS. The control variables include net disposable income, a polynomial in age, year of birth cohort dummies, marital status dummies, employment dummies, a gender dummy, a homeownership dummy, and health-related characteristics such as expected life-expectancy and self-assessed health condition, the set of macroeconomic variables (pension premiums as percentage of wage, long-term interest rate, employment growth and growth rate of equity prices) and self-reported measures of risk-aversion and risk-attitude. Robust standard errors between parentheses. Reference number of observations, column (b) of Table 2. The drop of observations is due to missing values in the independent variables. Significance level:
*** p < .01, **p < .05, *p < .1.
The results of Table 5 suggest a displacement effect of up to 63 percent or, when the variance of the funding ratio is accounted for, up to 42 percent. This suggests that a one percentage point increase in the expected pension benefit (as proxied by the replacement rate) is associated with a decrease in private voluntary savings of 0.42–0.63 percentage points. The complete specifications that include individual risk-aversion variables (specifications b and d) suggest estimates that are mildly significant, with a 90 percent confidence interval. The finding of a lower point estimate of the displacement effect in the specifications that include the variance of the funding ratio (specifications c and d) suggest evidence of a downward bias in the baseline estimates. It should be noted that, unlike in Van Santen (Reference Van Santen2019), the estimates obtained from the same specification but on a larger sample period covering three major financial crises suggest a potential weak instrument issue when using the funding ratio as instrument for the expected replacement rate. This is suggested by the first-stage F-statistic falling below the rule-of-thumb threshold of 10 (Stock and Yogo, Reference Stock and Yogo2005) despite the significant relationship between the funding ratio and the replacement rate found in Table 4. Additionally, the size of this estimate is higher than in Van Santen (Reference Van Santen2019), which identified a 32 percent displacement effect for the 2009–2011 period and, more broadly, it is well aligned with the range of estimates found in the literature in the Dutch (Alessie et al. (Reference Alessie, Angelini and Van Santen2013), Mastrogiacomo et al. (Reference Mastrogiacomo, Dillingh and Li2023)) and the international context (Attanasio and Rohwedder (Reference Attanasio and Rohwedder2003), Attanasio and Brugiavini (Reference Attanasio and Brugiavini2003), Hurd et al. (Reference Hurd, Michaud and Rohwedder2012), Chetty et al. (Reference Chetty, Friedman, Leth-Petersen, Heien Nielsen and Olsen2014), Börsch-Supan et al. (Reference Börsch-Supan, Reil-Held and Schunk2008), and Bottazzi et al., Reference Bottazzi, Jappelli and Padula2011).
5. Heterogeneity analysis
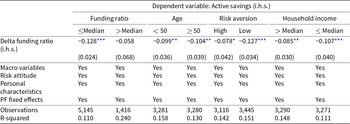
This section presents the heterogeneity analysis of the results in Section 4.1. The aim of this analysis is to test whether the estimated effect of shocks to the funding ratio is more pronounced among specific pockets of pension funds and pension fund members. Four main dimensions are considered. On the side of pension funds, we divide funds into two groups (over- and under-performing) based on their historical rate of return on the whole sample. If pension funds ‘alphas’ are significant, that is, if certain pension funds consistently realize returns either in excess or deficit relative to the benchmark or the average, then individuals may have the incentive to adjust their private savings accordingly, based on the expectation of a higher or lower pension benefit conditional on a similar pension contribution profile. On the side of pension fund members, we categorize them in subgroups based on age, self-reported risk aversion, and household income.
We investigate these dimensions because age is typically found to be a key factor in explaining pension contributions, while risk aversion likely plays a significant role, as more risk-averse individuals may respond to an uncertainty shock about their future pension benefits with higher voluntary savings, compared to more risk-neutral individuals. Additionally, household income is crucial to consider, as it directly impacts the possibility of for voluntary savings and may influence how individuals respond to potential risks or changes in their pension expectations.
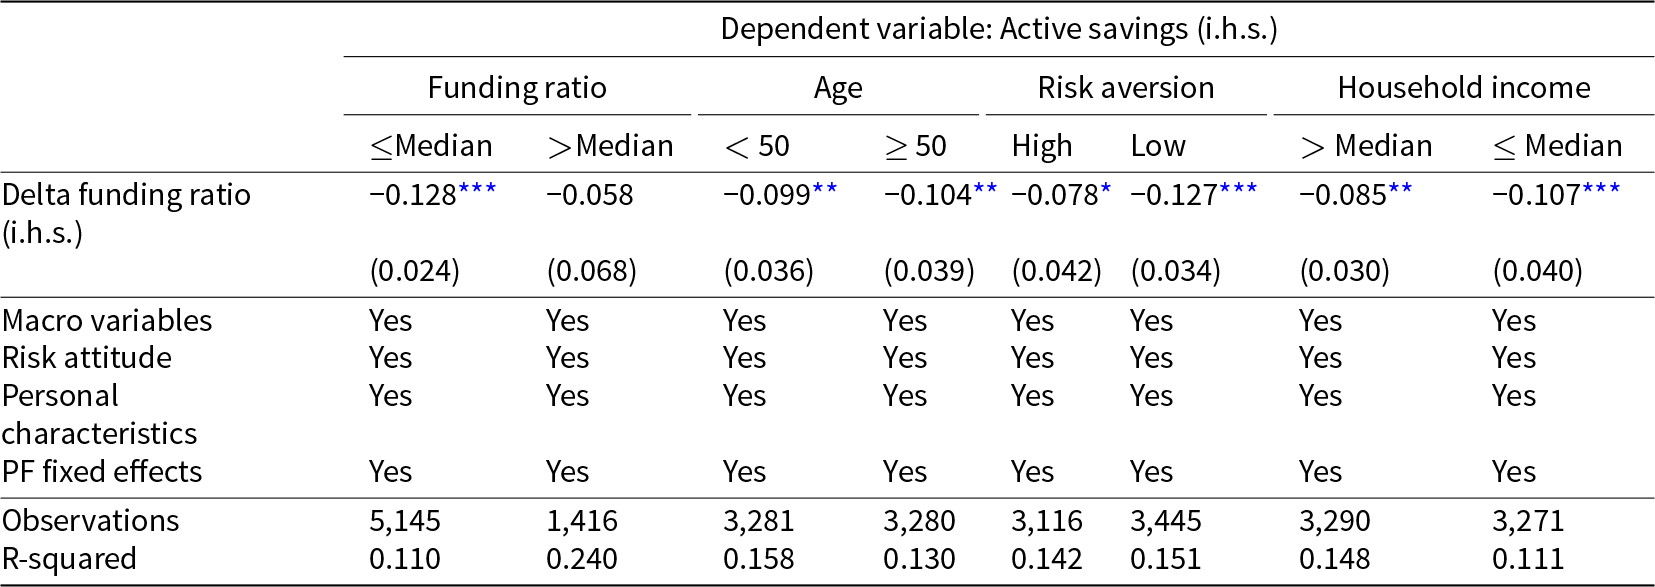
Regarding the pension fund characteristics, the results of Table 6 show that the saving response to a shock to the equity of pension funds is more pronounced among members of funds with a history of below-median returns. This is consistent with the idea that a reduction in funding ratio is more likely to lead to a pension curtailment or to lower benefits for members of the under-performing pension funds. Instead, pension funds with high rates of return (and thus higher funding ratios) typically have more buffers to absorb adverse changes in asset prices and in the funding ratio.
Heterogeneity analysis
Notes: The dependent and independent variables are transformed using the inverse hyperbolic sine (i.h.s.) All specifications are estimated via OLS. The control variables include net disposable income, a polynomial in age, year of birth cohort dummies, marital status dummies, employment dummies, a gender dummy, a homeownership dummy, and health-related characteristics such as expected life-expectancy and self-assessed health condition, the set of macroeconomic variables (pension premiums as percentage of wage, long-term interest rate, employment growth and growth rate of equity prices) and self-reported measures of risk-aversion and risk-attitude. Clustered standard errors by pension fund, in parentheses. Reference number of observations, column (b) of Table 2. The drop of observations is due to missing values in the independent variables.
*** p < .01, **p < .05, *p < .1.
Regarding the pension fund members’ characteristics, the results suggest that the impact of pension fund performance is significant across all subgroups, though the estimates do not vary significantly between them. In other words, the differences we observe are tied to fund performance rather than to subgroup characteristics. It is important to investigate the differential effect with respect to age and other age-related factors such as income and risk aversion. There is an ongoing debate about how individuals perceive the performance of pension funds as they age and approach retirement. For instance, Van Dalen and Henkens (Reference Van Dalen and Henkens2023) found that confidence in pension funds increases with age, while Mangan et al. (Reference Mangan, Mastrogiacomo, Hochguertel and Goedkoop2024) attribute this to cohort effects, emphasizing the role of business cycles across all cohorts. Our findings also support the idea that the effect of pension fund performance varies depending on the business cycle.
6. Robustness checks
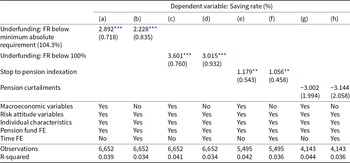
Tables 7 and 8 show robustness checks of the main results of the paper, that is, the direct impact of pension fund solvency shocks on household savings in Tables 2 and 3. These checks show how results change when using alternative dependent variables and/or time fixed effects, to provide additional evidence that the estimated effect of pension fund solvency shocks on household savings are not driven by the use of log-like transformations of the dependent variable and/or influenced by the role of unobserved common shocks.
Replication of Table 2 (main results) with an alternative dependent variable and time fixed effects
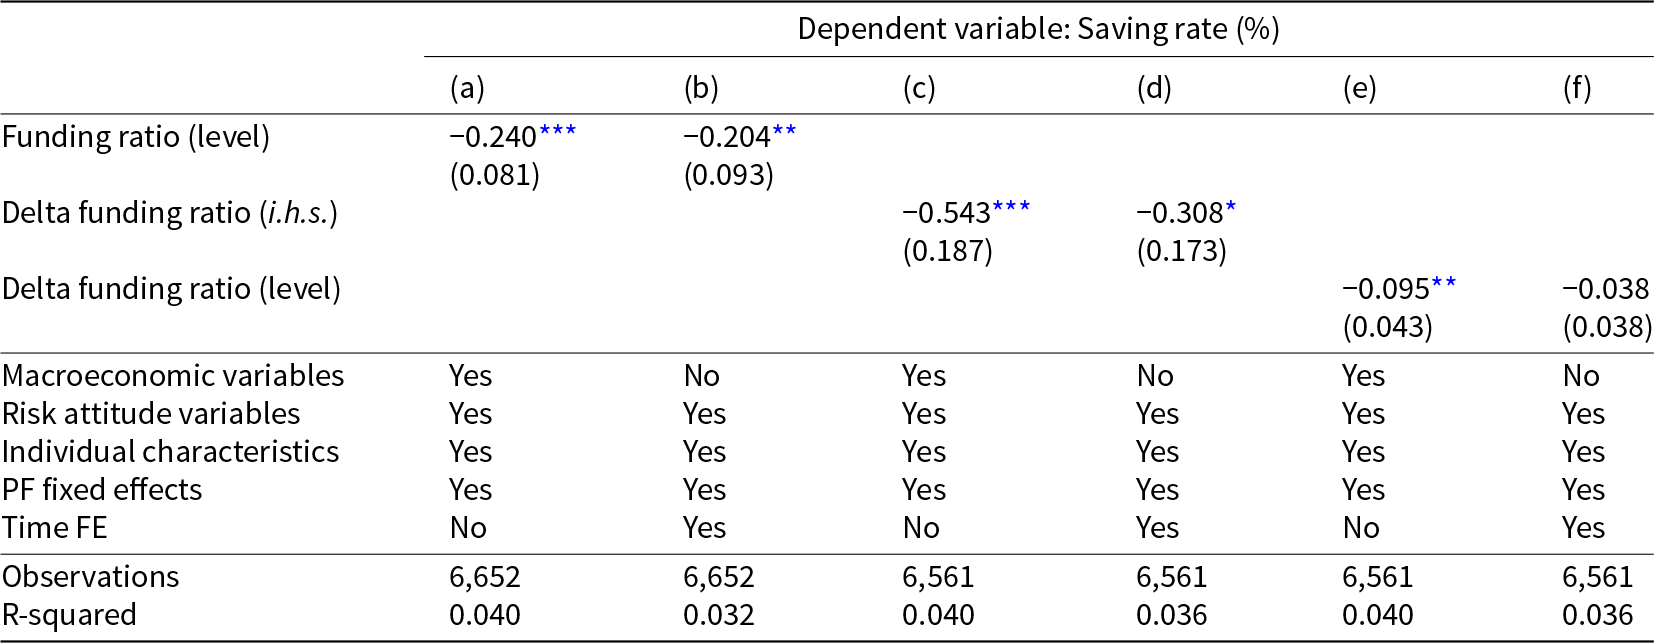
Notes: Estimates equivalent to Table 2, except for the use of the saving rate (in %) as dependent variable and for the use of the first difference in the funding ratio in specification (e) and (f) instead of its inverse hyperbolic sine transformation. All specifications are estimated via OLS. Unless otherwise specified, the control variables include a polynomial in age, year of birth cohort dummies, marital status dummies, employment dummies, a gender dummy, a homeownership dummy, and health-related characteristics such as expected life-expectancy and self-assessed health condition, the set of macroeconomic variables (pension premiums as percentage of wage, long-term interest rate, employment growth and growth rate of equity prices) and self-reported measures of risk-aversion and risk-attitude. We exclude year of birth cohort dummies when including time fixed effects, that is, columns (b), (d) and (f). Clustered standard errors by pension fund, in parentheses.
*** p < .01, **p < .05, *p < .1.
Replication of Table 3 (other type of shocks) with an alternative dependent variable and time fixed effects
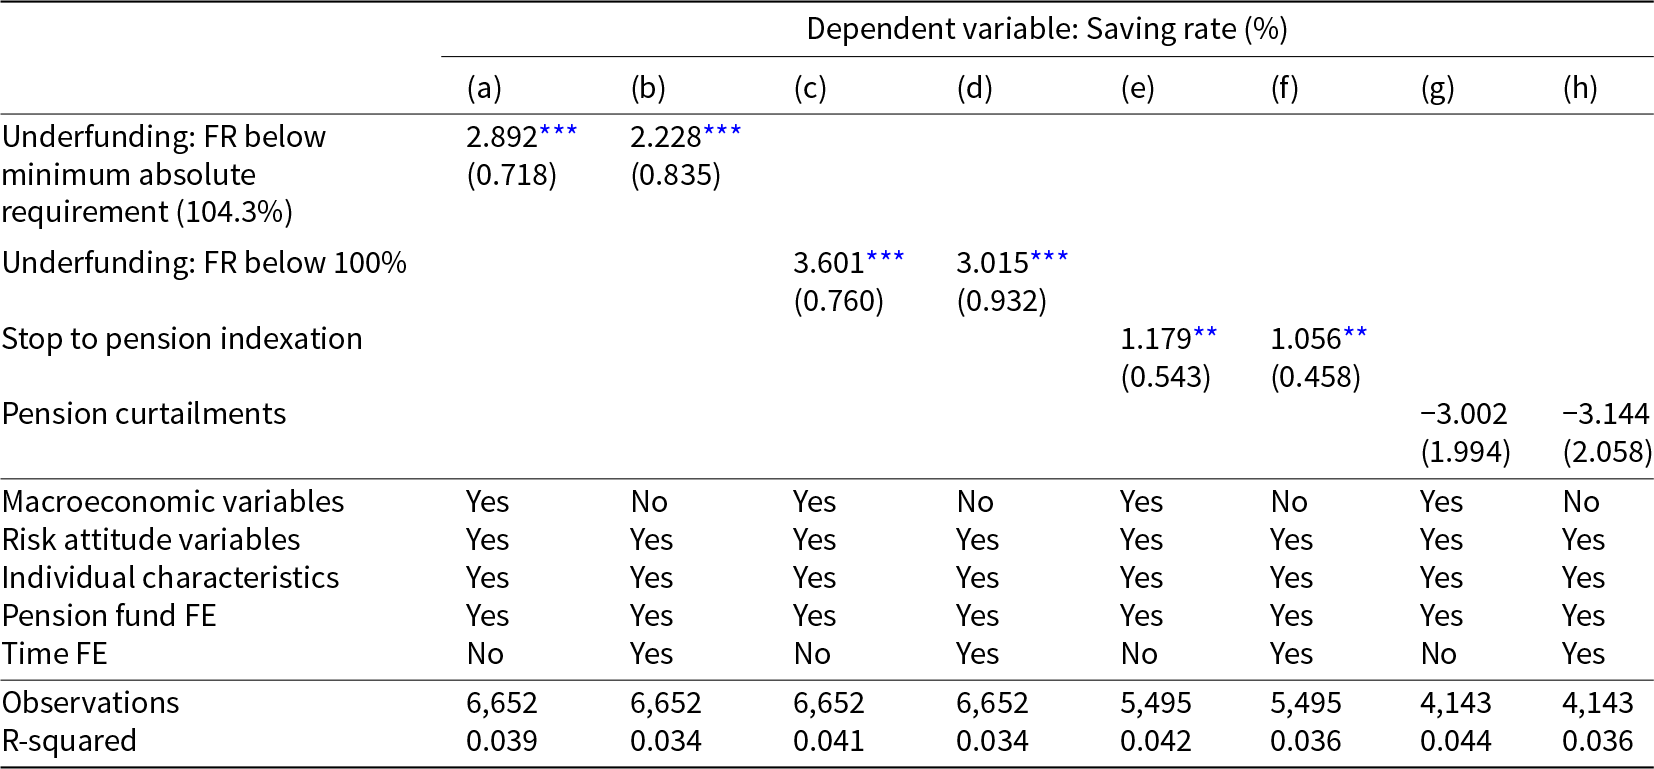
Notes: Estimates equivalent to Table 3, except for the use of the saving rate (in %) as dependent variable. All specifications are estimated via OLS. Unless otherwise specified, the control variables include a polynomial in age, year of birth cohort dummies, marital status dummies, employment dummies, a gender dummy, a homeownership dummy, and health-related characteristics such as expected life-expectancy and self-assessed health condition, the set of macroeconomic variables (pension premiums as percentage of wage, long-term interest rate, employment growth, and growth rate of equity prices) and self-reported measures of risk-aversion and risk-attitude. We exclude year of birth cohort dummies when including time fixed effects, that is, columns (b), (d), and (f). Clustered standard errors by pension fund, in parentheses. Significance level:
*** p < .01, **p < .05, *p < .1.
First, the specifications in Tables 2 and 3 use active savings as main dependent variable. Differently from other measures, active savings capture the actual saving behaviour of the respondent by accounting for the money put aside in a certain period, without considering passive forms of savings such as capital gains on financial assets or other extraordinary cash-flows that may distort broader definitions of savings and/or measures based on imputations. Active savings also allow for negative values of the dependent variable to account for dissavings; this is why the inverse hyperbolic sine transformation is used, as this log-like transformation deals with zero- or negative-values of the dependent variable. Recently, the inverse hyperbolic sine has been scrutinized, and research shows that the estimated treatment effects are sensitive to a possible rescaling of the variable (Mullahy and Norton, Reference Mullahy and Norton2024; Chen and Roth, Reference Chen and Roth2024). Therefore, specifications (a), (c), (e), and (g) of Tables 7 and 8 show how the main results of the paper change when using the saving rate as the dependent variable. The saving rate is the ratio between the amount of active savings and the amount of household disposable income. This allows maintaining an estimate of the marginal effect which can be expressed as percentage (as in a log-log specification, but relative to income) without using a log-like transformation of the dependent variable such as the inverse hyperbolic sine that may yield marginal effects that are sensitive to the scaling of the dependent variable. In terms of sign and statistical significance of the effects, the results confirm the findings of Tables 2 and 3. In terms of magnitude the effects are instead different as the savings rate differs from active savings as it accounts for passive savings, does not allow for dissaving and expresses total savings as a share of disposable income.
Second, Tables 2 and 3 account for a set of macroeconomic variables that account for common shocks that would impact both the funding ratio of pension funds and the savings of the households. Still, the fact that in the data we observe similar developments of the funding ratio across pension funds may suggest that results could be influenced by unobserved common shocks, probably driven by developments in financial markets and the real economy, beyond the ones already considered. In this case, the use of a two-way fixed effects (TWFE) specification with time-specific effects helps us ensuring that the estimated effect of the impact of shocks to pension funds are robust, and not the result of residual macroeconomic shock not captured in the regressions. Specification (b), (d), (f), and (g) of Tables 7 and 8 repeat the estimates of the main results just discussed, now including the time fixed effects instead of the macroeconomic variables. Results across specifications (with and without time fixed effects) show virtually equivalent results in terms of sign, significance and magnitude of the effects, with the only exception of specification (f) of Table 7, showing a non-significant effect with a size equal to about one-third the corresponding coefficient of specification (e). All other results do not appear statistically different than those in (a), (c), (e), and (g) of Tables 7 and 8. Relative to Tables 2 and 3, the results also confirm the significance and sign of all effects, while the size again differs due to the use of the saving rate instead of (the i.h.s. of) active savings. One exception is the stop to the pension indexation, which now appears to have a positive and significant effect on savings, suggesting households need to and do save more to compensate lower future pension benefits due to lack of indexation. All in all, the results of Tables 7 and 8 confirms the robustness of the evidence of significant direct effects of pension fund solvency shocks on household savings found in Tables 2 and 3, as these are not the result of the use of specific transformations of the dependent and independent variables and unobserved common variation due to residual macroeconomic shocks not captured in the regressions.
7. Conclusions
This study provides evidence of the effect on private household savings resulting from shocks to the financial position of pension funds. Results show that changes in funding ratios – by affecting individual expectations regarding the pension wealth and future benefits of the members of the pension fund – lead to opposite changes in household savings, with displacement effects up to 42 percent. In other words, members of pension funds with weak financial positions (low funding ratios) or subject to stronger asset price corrections (negative changes of the funding ratio) tend to exhibit stronger saving responses compared to similar individuals in other circumstances. In cases of significant funding deficits within their fund (funding ratios below the minimum absolute requirement), participants also increase their personal savings. This action is driven by the anticipation of subsequent impacts on their pension wealth, which could involve increased mandatory contributions, cessation of pension indexation or, in the worst-case scenario, reduced pension benefits (curtailment). The displacement effect between pension wealth and voluntary private savings is driven by individuals with higher degrees of risk-aversion, younger ages, and is more concentrated among pension fund members with a history of lower rates of return on their investment portfolios.
Our results indirectly tie in with policy discussions on the reform of the Dutch pension system. We show that shocks to pension funds have significant effects on the economic and financial behaviour of fund members. The introduction of a new pension system could potentially introduce actual or expected shocks to the pension wealth of certain members, as entitlements will be translated into the pension wealth of specific groups. These shocks can have macroeconomic consequences for consumption. If the chosen translation method grants pension funds a significant degree of discretion, these shocks could vary across sectors, occupations and companies. However, if pension funds adopt strategies to mitigate unexpected wealth transfers across different groups, this approach could help minimize the overall macroeconomic impact associated with the introduction of the new pension system.
Acknowledgements
We are grateful to Gonzalo Paz Pardo, Rob Alessie, and participants at the 36th Annual Conference of the European Society for Population Economics 2023 in Belgrade, the NETSPAR International Pension Workshop 2023 in Leiden, the European Association of Labour Economists (EALE) Conference 2023 in Prague, the Nederlandse Economendag 2023 in The Hague. The authors acknowledge Netspar for funding support.
Appendix
Responses to DNB questionnaire on the consequences of the pandemic.

Descriptive statistics
Detailed specification of Table 2
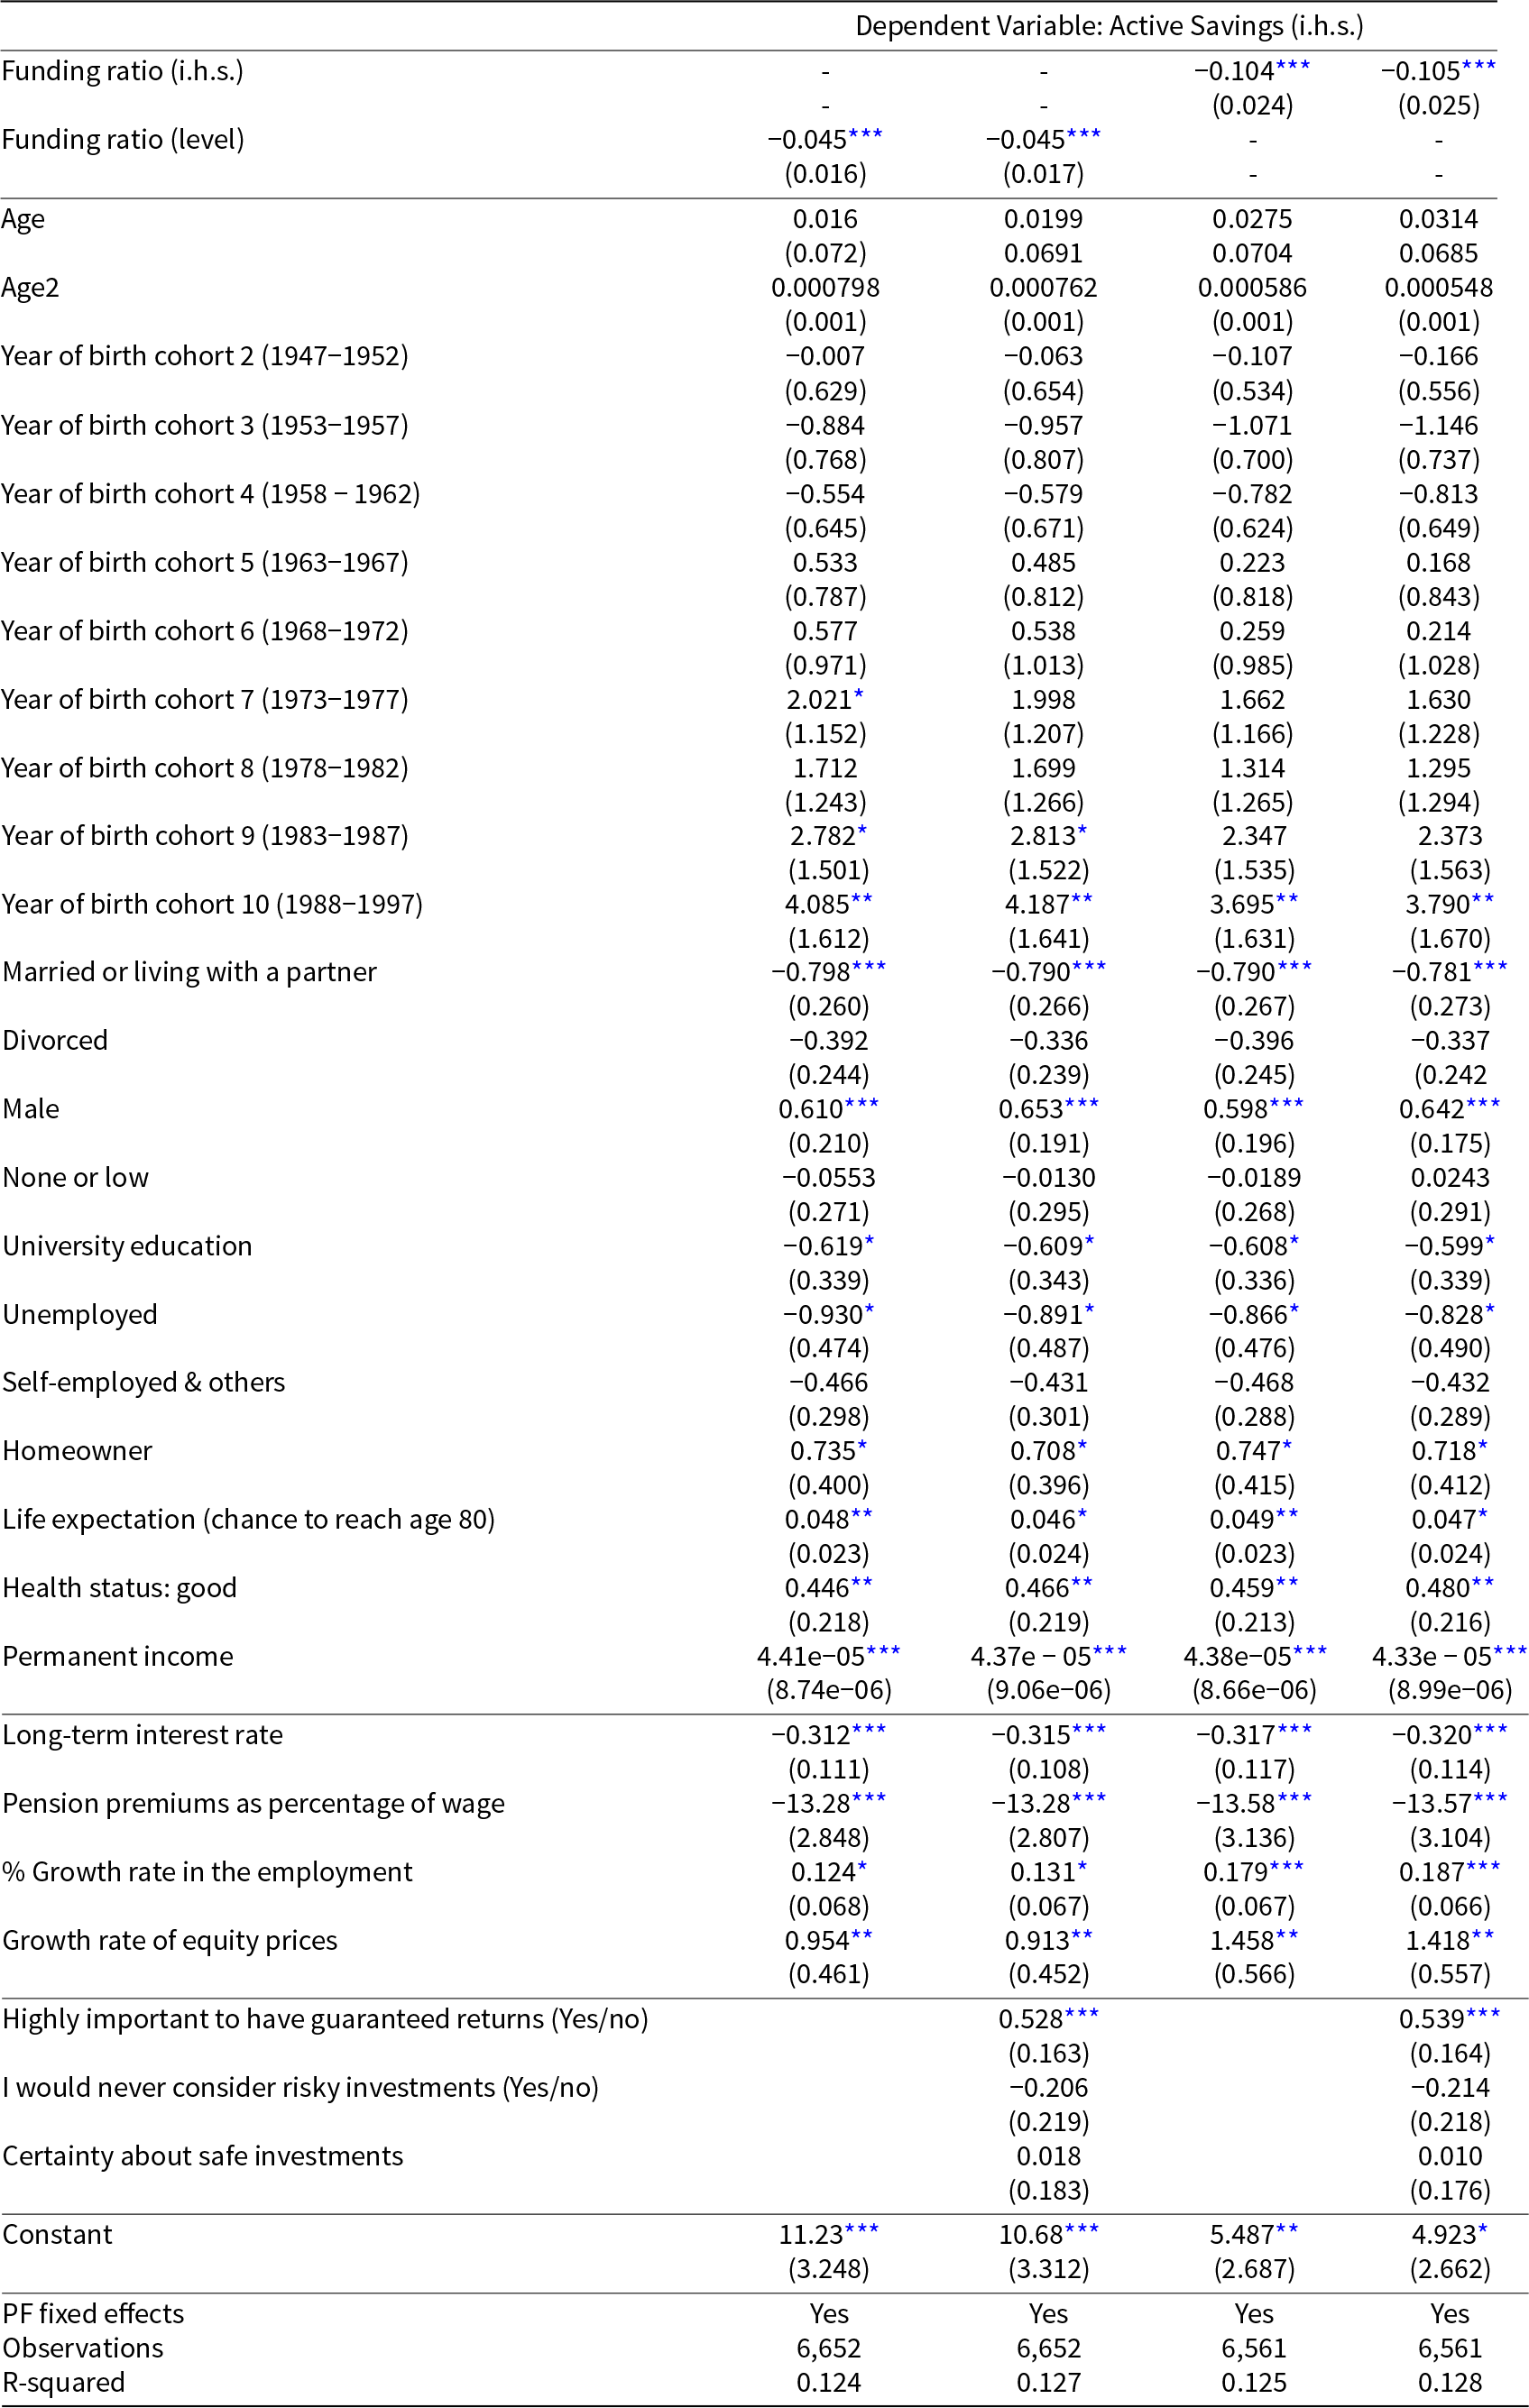
Notes: The dependent and main independent variables are transformed using the inverse hyperbolic sine (i.h.s.) All specifications are estimated via OLS. The control variables include net disposable income, a polynomial in age, year of birth cohort dummies, marital status dummies, employment dummies, a gender dummy, a homeownership dummy, and health-related characteristics such as expected life-expectancy and self-assessed health condition, the set of macroeconomic variables (pension premiums as percentage of wage, long-term interest rate, employment growth, and growth rate of equity prices) and self-reported measures of risk-aversion and risk-attitude. Clustered standard errors by pension fund, in parentheses.
*** p < .01, **p < .05, *p < .1.




 Open access

