

Introduction
Narcolepsy type 1 (NT1) is a chronic neurological disorder primarily characterized by excessive daytime sleepiness (EDS), cataplexy, fragmented nighttime sleep, sleep paralysis, and vivid hypnagogic or hypnopompic hallucinations [Reference Liblau, Latorre, Kornum, Dauvilliers and Mignot1,Reference Pérez-Carbonell, Mignot, Leschziner and Dauvilliers2]. Nearly all individuals with NT1 experience cataplexy, exhibit significantly reduced hypocretin-1 (orexin-A) levels in cerebrospinal fluid (CSF), and frequently carry the HLA-DQB1*06:02 allele, indicating a strong genetic predisposition [Reference Barateau, Pizza, Plazzi and Dauvilliers3]. Familial clustering of narcolepsy has been documented, with up to 11% of first-degree relatives of NT1 patients exhibiting similar symptoms [Reference Reith, LeibundGut-Landmann and Waldburger4]. In recent years, significant advances in understanding NT1 genetics have been achieved through genome-wide association studies (GWAS), which have identified numerous single-nucleotide polymorphisms (SNPs) and novel risk genes beyond established HLA-related loci. However, interactions and regulatory networks among these NT1-associated genes remain largely unexplored. A comprehensive analysis of gene interactions and the associated molecular pathways is essential to fully elucidate the complex NT1 pathogenesis, potentially revealing novel biomarkers and therapeutic targets.
Recently, high-throughput technologies such as gene expression microarrays have greatly enhanced our capacity to investigate disease-associated genetic changes on a genome-wide scale [Reference Liang, Wu, Wang, Wu, Chen and Jiang5]. By enabling the concurrent analysis of thousands of genes, microarrays offer valuable insights into molecular mechanisms underlying disease progression, these approaches have been particularly valuable in narcolepsy research. Bioinformatics analyses of microarray data have illuminated genetic underpinnings and suggested autoimmune components in narcolepsy. For instance, one study underscored T-cell autoimmunity and infectious triggers as factors influencing NT1 onset, thereby broadening our understanding of disease development [Reference Liblau, Latorre, Kornum, Dauvilliers and Mignot1]. Moreover, genetic studies highlight the role of the DQB1 locus in determining susceptibility to and protection against narcolepsy, with common variants in this locus being well-characterized in Caucasian populations with narcolepsy accompanied by cataplexy [Reference Barateau, Pizza, Plazzi and Dauvilliers3,Reference Powers and Walter6]. Despite significant advancements in identifying individual risk factors, there remains a critical gap in understanding the integrative molecular networks and specific hub genes driving NT1 pathogenesis. Addressing this knowledge gap is crucial for translating genetic insights into actionable clinical strategies.
In the present study, we aimed to identify and experimentally validate key hub genes implicated in NT1 using an integrated bioinformatics approach. In this study, hub genes were defined as genes with the highest connectivity degrees in the protein–protein interaction (PPI) network, as they are considered to play central roles in regulating molecular interactions and biological processes. Initially, we analyzed NT1 gene expression profiles using datasets retrieved from the Gene Expression Omnibus (GEO) database to identify robust differentially expressed genes (DEGs). We then performed functional and pathway enrichment analyses to characterize the roles and interactions of these DEGs. Next, we uploaded the DEGs to the STRING database to construct a protein–protein interaction (PPI) network and pinpoint hub genes potentially pivotal in NT1 pathophysiology. Finally, we conducted quantitative real-time polymerase chain reaction (qRT-PCR) to validate differential expression of selected hub genes using clinical samples from NT1 patients attending the neurology clinic and sleep disorder center of our institution. Through this integrative approach, we aimed to uncover potential molecular biomarkers and therapeutic targets to inform future NT1 research and clinical management.
Methods
Data sources
Gene expression profiles of peripheral whole blood were obtained from the National Center for Biotechnology Information Gene Expression Omnibus public database (GEO, https://www.ncbi.nlm.nih.gov/geo/). We searched the GEO database using the keywords “narcolepsy,” “blood,” and “expression profile” restricted to Homo sapiens and “Expression profiling by array.” Among all retrieved datasets, GSE21592 was the only study containing peripheral whole-blood transcriptomic data from well-characterized NT1 patients and matched healthy controls, with complete clinical and experimental information. Other datasets were excluded because they involved animal models, non-blood samples, or incomplete metadata. We used the GSE21592 dataset from a large cross-European NT1 biomarker study and the EU-funded AddNeuroMed Cohort, which contained RNA samples from peripheral blood. The cohort comprised 10 narcolepsy with cataplexy (NT1) patients and 10 healthy controls. The reported mean and median ages were both 50 years; however, one participant was aged 12 years, indicating a predominantly adult but not exclusively adult cohort. Detailed age ranges were not provided in the public dataset. Serial numbers are as follows:

Identification of differentially expressed genes
DEGs between NT1 patients and healthy controls (HCs) were identified using GEO2R online tool. Differential gene expression between NT1 and HC was assessed using linear modeling with multiple-testing correction. For each gene, we estimated log2 fold-changes (log2 FC) and corresponding p values and controlled the false discovery rate (FDR) using the Benjamini–Hochberg procedure. Unless otherwise specified, DEGs were defined primarily by FDR <0.05. We did not impose an additional fixed minimum fold-change cutoff (e.g., |log2FC| ≥ 1); the reported |log2 FC| values are used to indicate the direction and magnitude of change rather than as a hard selection threshold. This choice reflects the expectation that effect sizes in blood-based transcriptomic studies of NT1 are modest and that overly stringent fold-change filters may discard biologically relevant but quantitatively small differences. Downstream prioritization of candidate hub genes was based on integrative network analysis and independent qRT-PCR validation rather than on fold-change magnitude alone [Reference Wang, Han and Gao7,Reference Zou, Huang and Zhang8]. A heatmap of the 16 upregulated and 132 downregulated genes from GSE21592 was created using the “Pheatmap” tool in the R statistical software.
Functional and pathway enrichment analyses
Gene Ontology (GO) analysis is an essential bioinformatics approach for systematically categorizing gene functions across diverse species. In this study, GO and Kyoto Encyclopedia of Genes and Genomes (KEGG) pathway enrichment analyses of DEGs were conducted using the Database for Annotation, Visualization, and Integrated Discovery (DAVID) online tool (https://david.ncifcrf.gov/tools.jsp). Enriched terms were identified with significance thresholds of p-value <0.01 and (FDR <0.05. Results were visualized using R software.
PPI network construction and hub gene identification
PPI networks for DEGs were constructed using STRING (version 12.0) with an interaction score threshold >0.4. The interaction data were imported into Cytoscape (version 3.10.3), and hub genes were identified using the degree algorithm within Cytoscape. Module clustering analysis was performed using the MCODE [Reference Bader and Hogue9] and cytoHubba plugins in Cytoscape software [Reference Li, Li and Zhang10].
Research objects for clinical validation
Ten patients diagnosed with Narcolepsy Type I (NT1) at the Departments of Neurology, The First Affiliated Hospital of Tsinghua University, and The Second Affiliated Hospital of Harbin Medical University between November 2021 and September 2024 were included in this study. The cohort comprised Han Chinese individuals from northern China (5 females, 50%, mean age 35.19 ± 23.08 years), including two pediatric patients (12–18 years). NT1 diagnoses adhered to the third edition of the International Classification of Sleep Disorders (ICSD-3) criteria [11], requiring: (1) EDS (≥ 3months); (2) mean sleep latency ≤8 minutes on Multiple Sleep Latency Test with ≥ 2 sleep-onset REM periods; and (3) either typical cataplexy or CSF hypocretin-1 (ORX-A) <110 pg/mL. All patients were positive for HLA-DQB1 * 06:02. Clinical assessments included body mass index categorization (adults: normal [<25 kg/m2], overweight [25–30 kg/m2], and obese [≥ 30 kg/m2]; children growth curve-adjusted), disease onset and duration, and medication status at enrollment. Patients with significant psychiatric or medical comorbidities were excluded. Ten HCs (6 females, 60%; mean age 35.28 ± 13.52 years; 2 children 12–18 years) were recruited. The study was conducted in accordance with the principles expressed in the Declaration of Helsinki, and informed consent was obtained from all participants. The protocol and consent procedures were reviewed and approved by the Ethics Committee of the First Hospital of Tsinghua University and the Second Affiliated Hospital of Harbin Medical University.
Sample collection and total RNA extraction
All participants fasted for 10 hours prior to blood collection. Peripheral blood (4 mL) was collected into ethylenediamine tetraacetic acid anticoagulant tubes (Sanli, Liuyang, China) during morning hours. Total RNA was extracted using TRIzol reagent (Thermo Fisher Scientific, Waltham, MA, USA) following the manufacturer’s instructions, with genomic DNA removed using DNase I (TaKaRa, Otsu, Shiga, Japan). RNA purity and concentration were assessed using NanoDrop 2000 (Thermo Fisher), and RNA quality and integrity were evaluated with an Agilent 2100 Bioanalyzer (Agilent Technologies, Santa Clara, CA, USA). RNA samples were stored at -80°C until analysis.
Quantitative polymerase chain reaction
Total RNA was reverse transcribed into complementary DNA using the TranScript All-in-One First-Strand Complementary DNA Synthesis SuperMix for quantitative polymerase chain reaction (qPCR) Kit (TransGen Biotech, Beijing, China). qPCR was performed on the StepOnePlus System (Thermo Fisher) using PerfectStart® Green qPCR SuperMix (TransGen Biotech). Reaction conditions were as follows: 94 °C for 30 s, followed by 40 cycles of 94 °C for 5 s and 60 °C for 34 s. Glyceraldehyde-3-phosphate dehydrogenase (GAPDH) mRNA served as the internal control, with three independent experimental replicates. Relative gene expression was calculated using the 2-ΔΔCT method (cycle threshold). Primers were synthesized by Sangon Biotech (Shanghai, China); target gene sequences are listed below:

Receiver operating characteristic curve analysis
The receiver operating characteristic (ROC) curve visualizes the discriminatory power of a predictive model by plotting the true positive rate against the false positive rate across different classification thresholds, enabling assessment of classification validity. We evaluated the diagnostic value of hub genes using ROC analysis, performed internal validation via bootstrap resampling, and generated a calibration plot to visualize model performance. To mitigate overfitting in this small sample, we performed bootstrap internal validation with 1,000 resamples. In each bootstrap sample, participants were drawn with replacement, the model was refitted, and the AUC was recalculated. The optimism-corrected AUC was obtained by averaging the optimism (bootstrap AUC minus apparent AUC) across resamples and subtracting this from the original AUC. Bootstrap 95% confidence intervals (CIs) were derived from the empirical distribution of AUC values.
Statistical analysis
Data are expressed as mean ± SEM from at least three independent experiments. Statistical analyses were performed using GraphPad Prism, version 9.5. For comparisons between two groups, unpaired Student’s t-test (two-tailed) was used; for comparisons among ≥ 3 groups, one-way analysis of variance with Bonferroni correction was applied. Statistical significance was defined as p < 0.05. For qRT-PCR validation, we modeled ΔCt (or relative expression) using linear regression with group (NT1 vs control) as the main factor and age as a covariate. As a sensitivity analysis, we repeated the comparison after excluding pediatric participants to assess robustness to age structure. Results are summarized in Supplementary Table S1.
Results
Identification of DEGs in NT1 patients
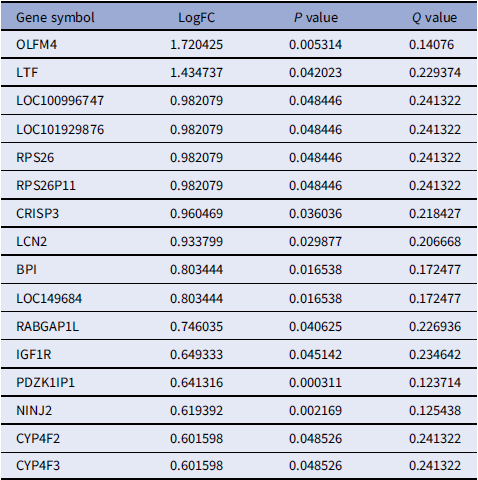
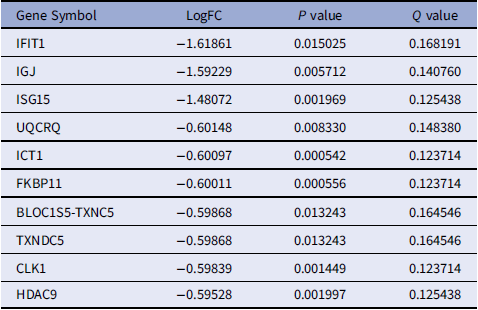
To identify DEGs associated with NT1, we analyzed GSE21592 dataset using the R package ”limma“ with thresholds of adjusted p-value < 0.05 and absolute log2 fold-change (|log2FC|) > 0. A total of 148 DEGs were identified in dataset GSE21592, comprising 16 upregulated and 132 downregulated genes. A heatmap sorted by log2 FC values visualizes expression patterns differentiating NT1 patients from healthy controls (Figure 1). Comprehensive DEG lists are provided in Tables 1 (upregulated) and 2 (downregulated).
Differential expression analysis of NT1. Heatmap illustrating DEGs in GSE21592 dataset between NT1 and healthy control groups. DEGs, differentially expressed genes; NT1, narcolepsy type 1.

Upregulated differentially expressed genes [Reference Ouyang, Zhou, Zheng and Zhang16]

Top 10 downregulated DEGs identified in patients with NT1 compared with controls. (The full list of downregulated DEGs is provided in Supplementary Table S2)

GO biological process and KEGG pathway enrichment analyses
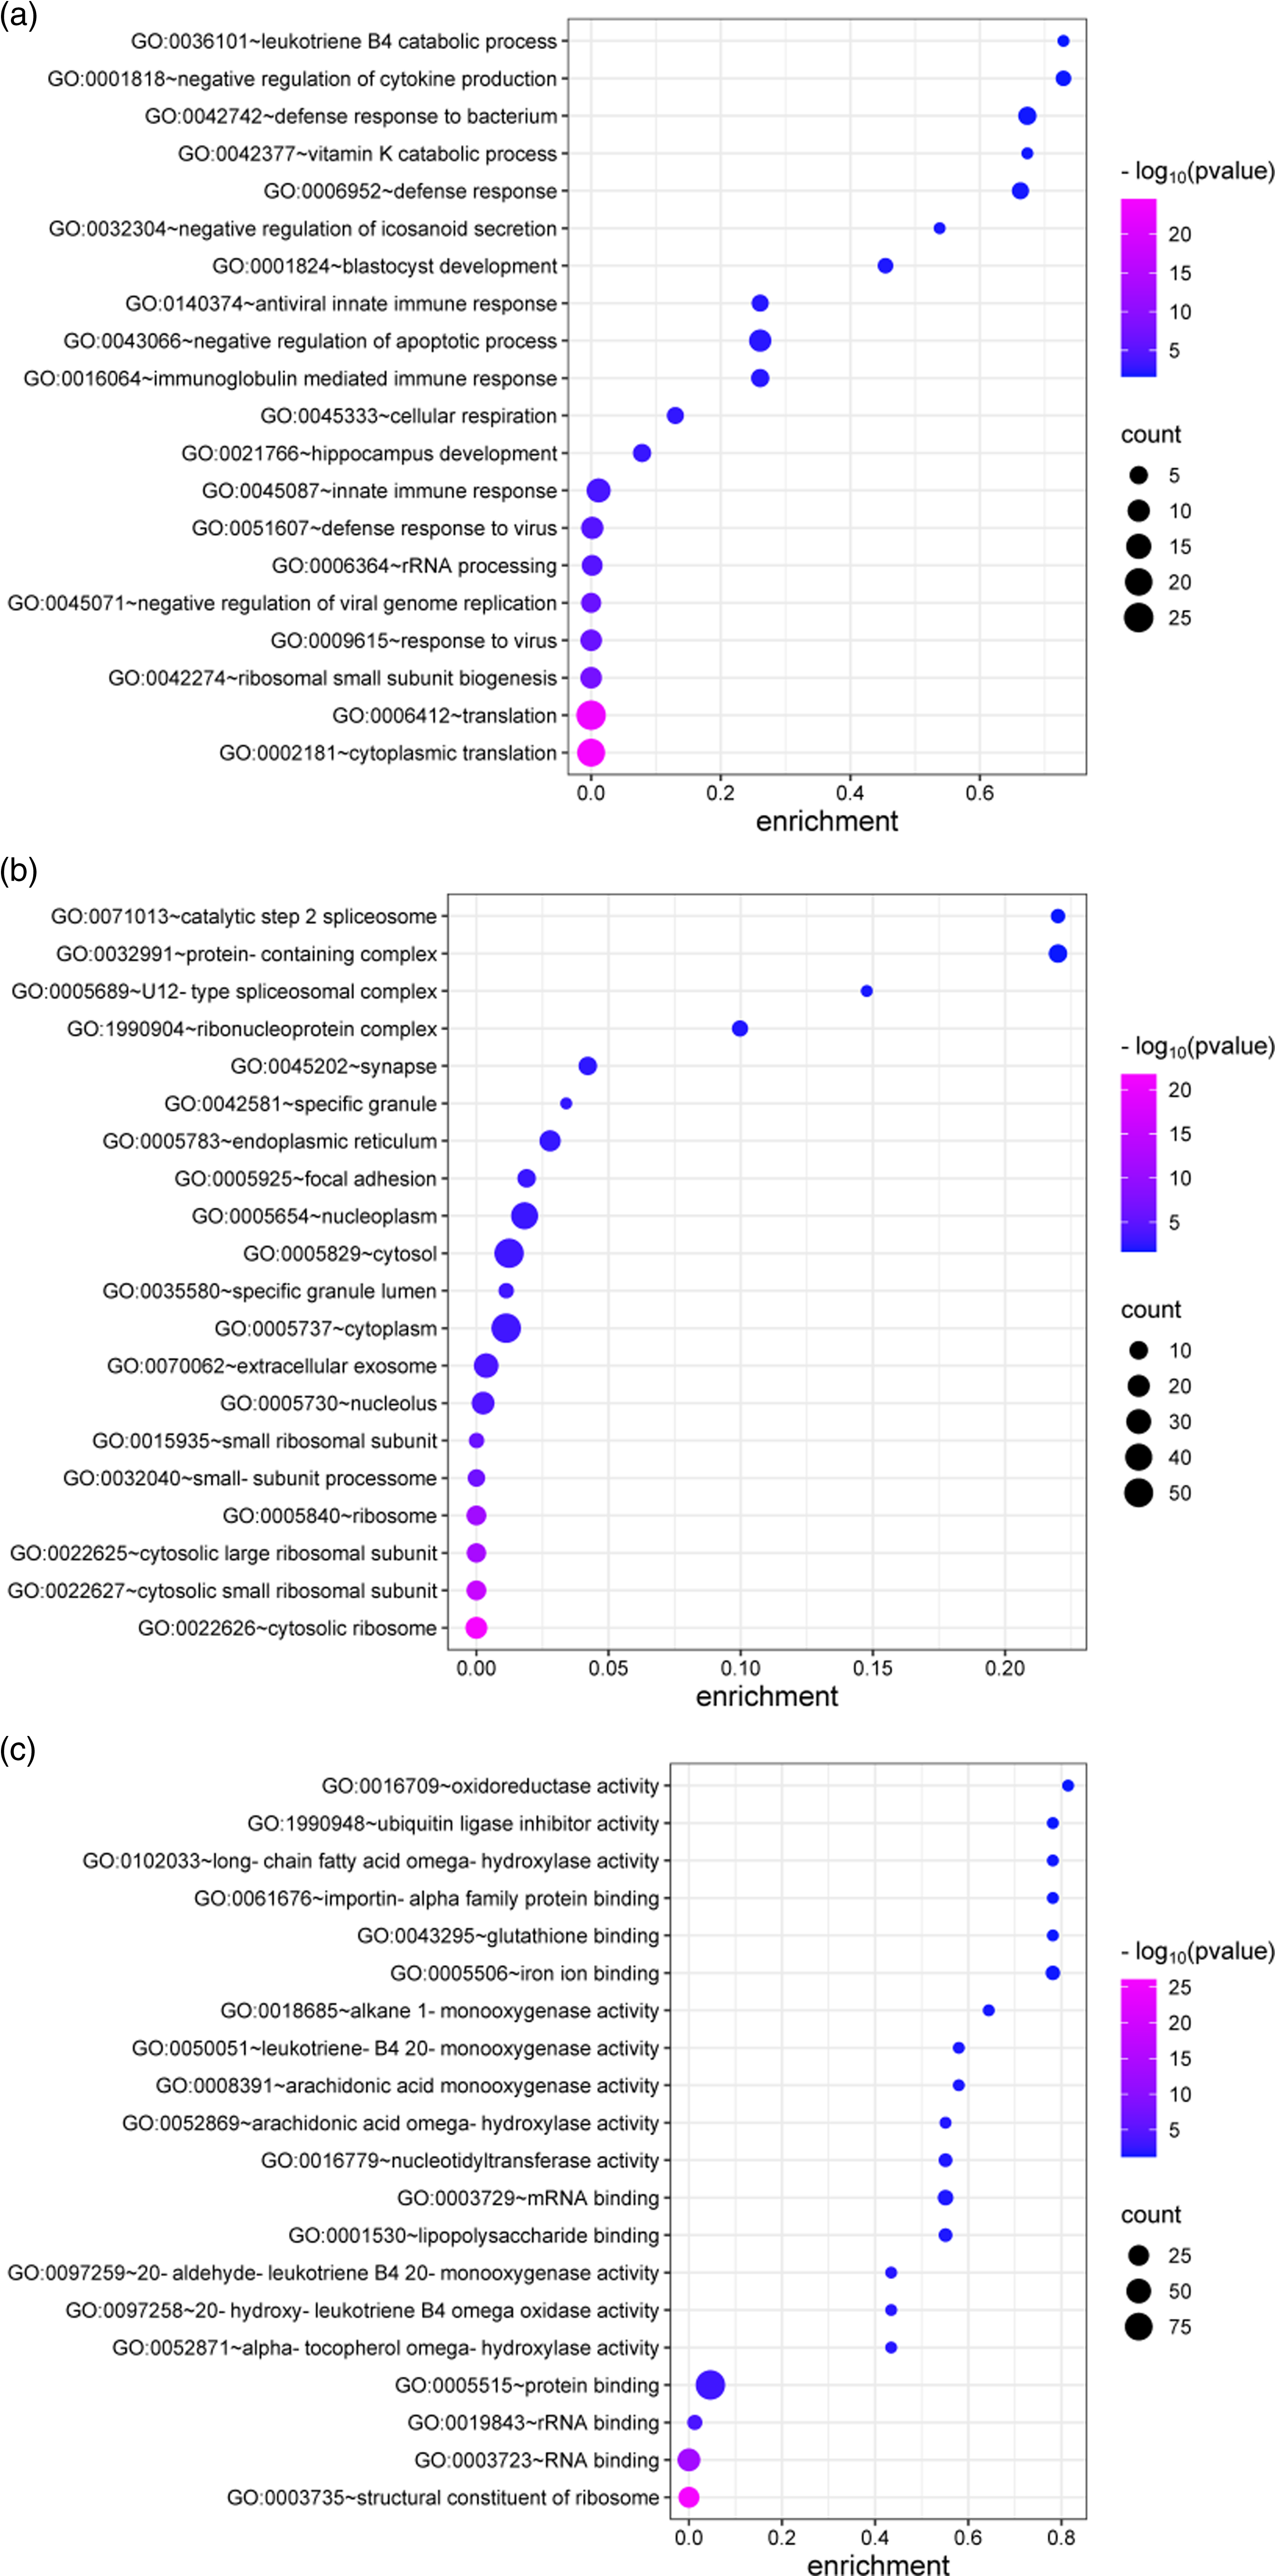
To explore biological significance and functional pathways, we conducted GO enrichment analysis across three categories: biological processes, cellular components, and molecular functions. Within the biological process category, DEGs were enriched in leukotriene B4 catabolic processes, negative regulation of cytokine production, and defense response to oxidative stress. Cellular component analysis highlighted enrichment in catalytic step 2 spliceosome, protein-containing complexes, and spliceosomal complexes. Molecular function analysis identified oxidoreductase activity, ubiquitin ligase inhibitor activity, and long-chain fatty acid omega-hydroxylase activity as substantially enriched (Figure 2).
Functional enrichment analysis based on screened DEGs. GO (cellular component, biological process, and molecular function) enrichment analyses of genes commonly upregulated and downregulated in NT1 group.

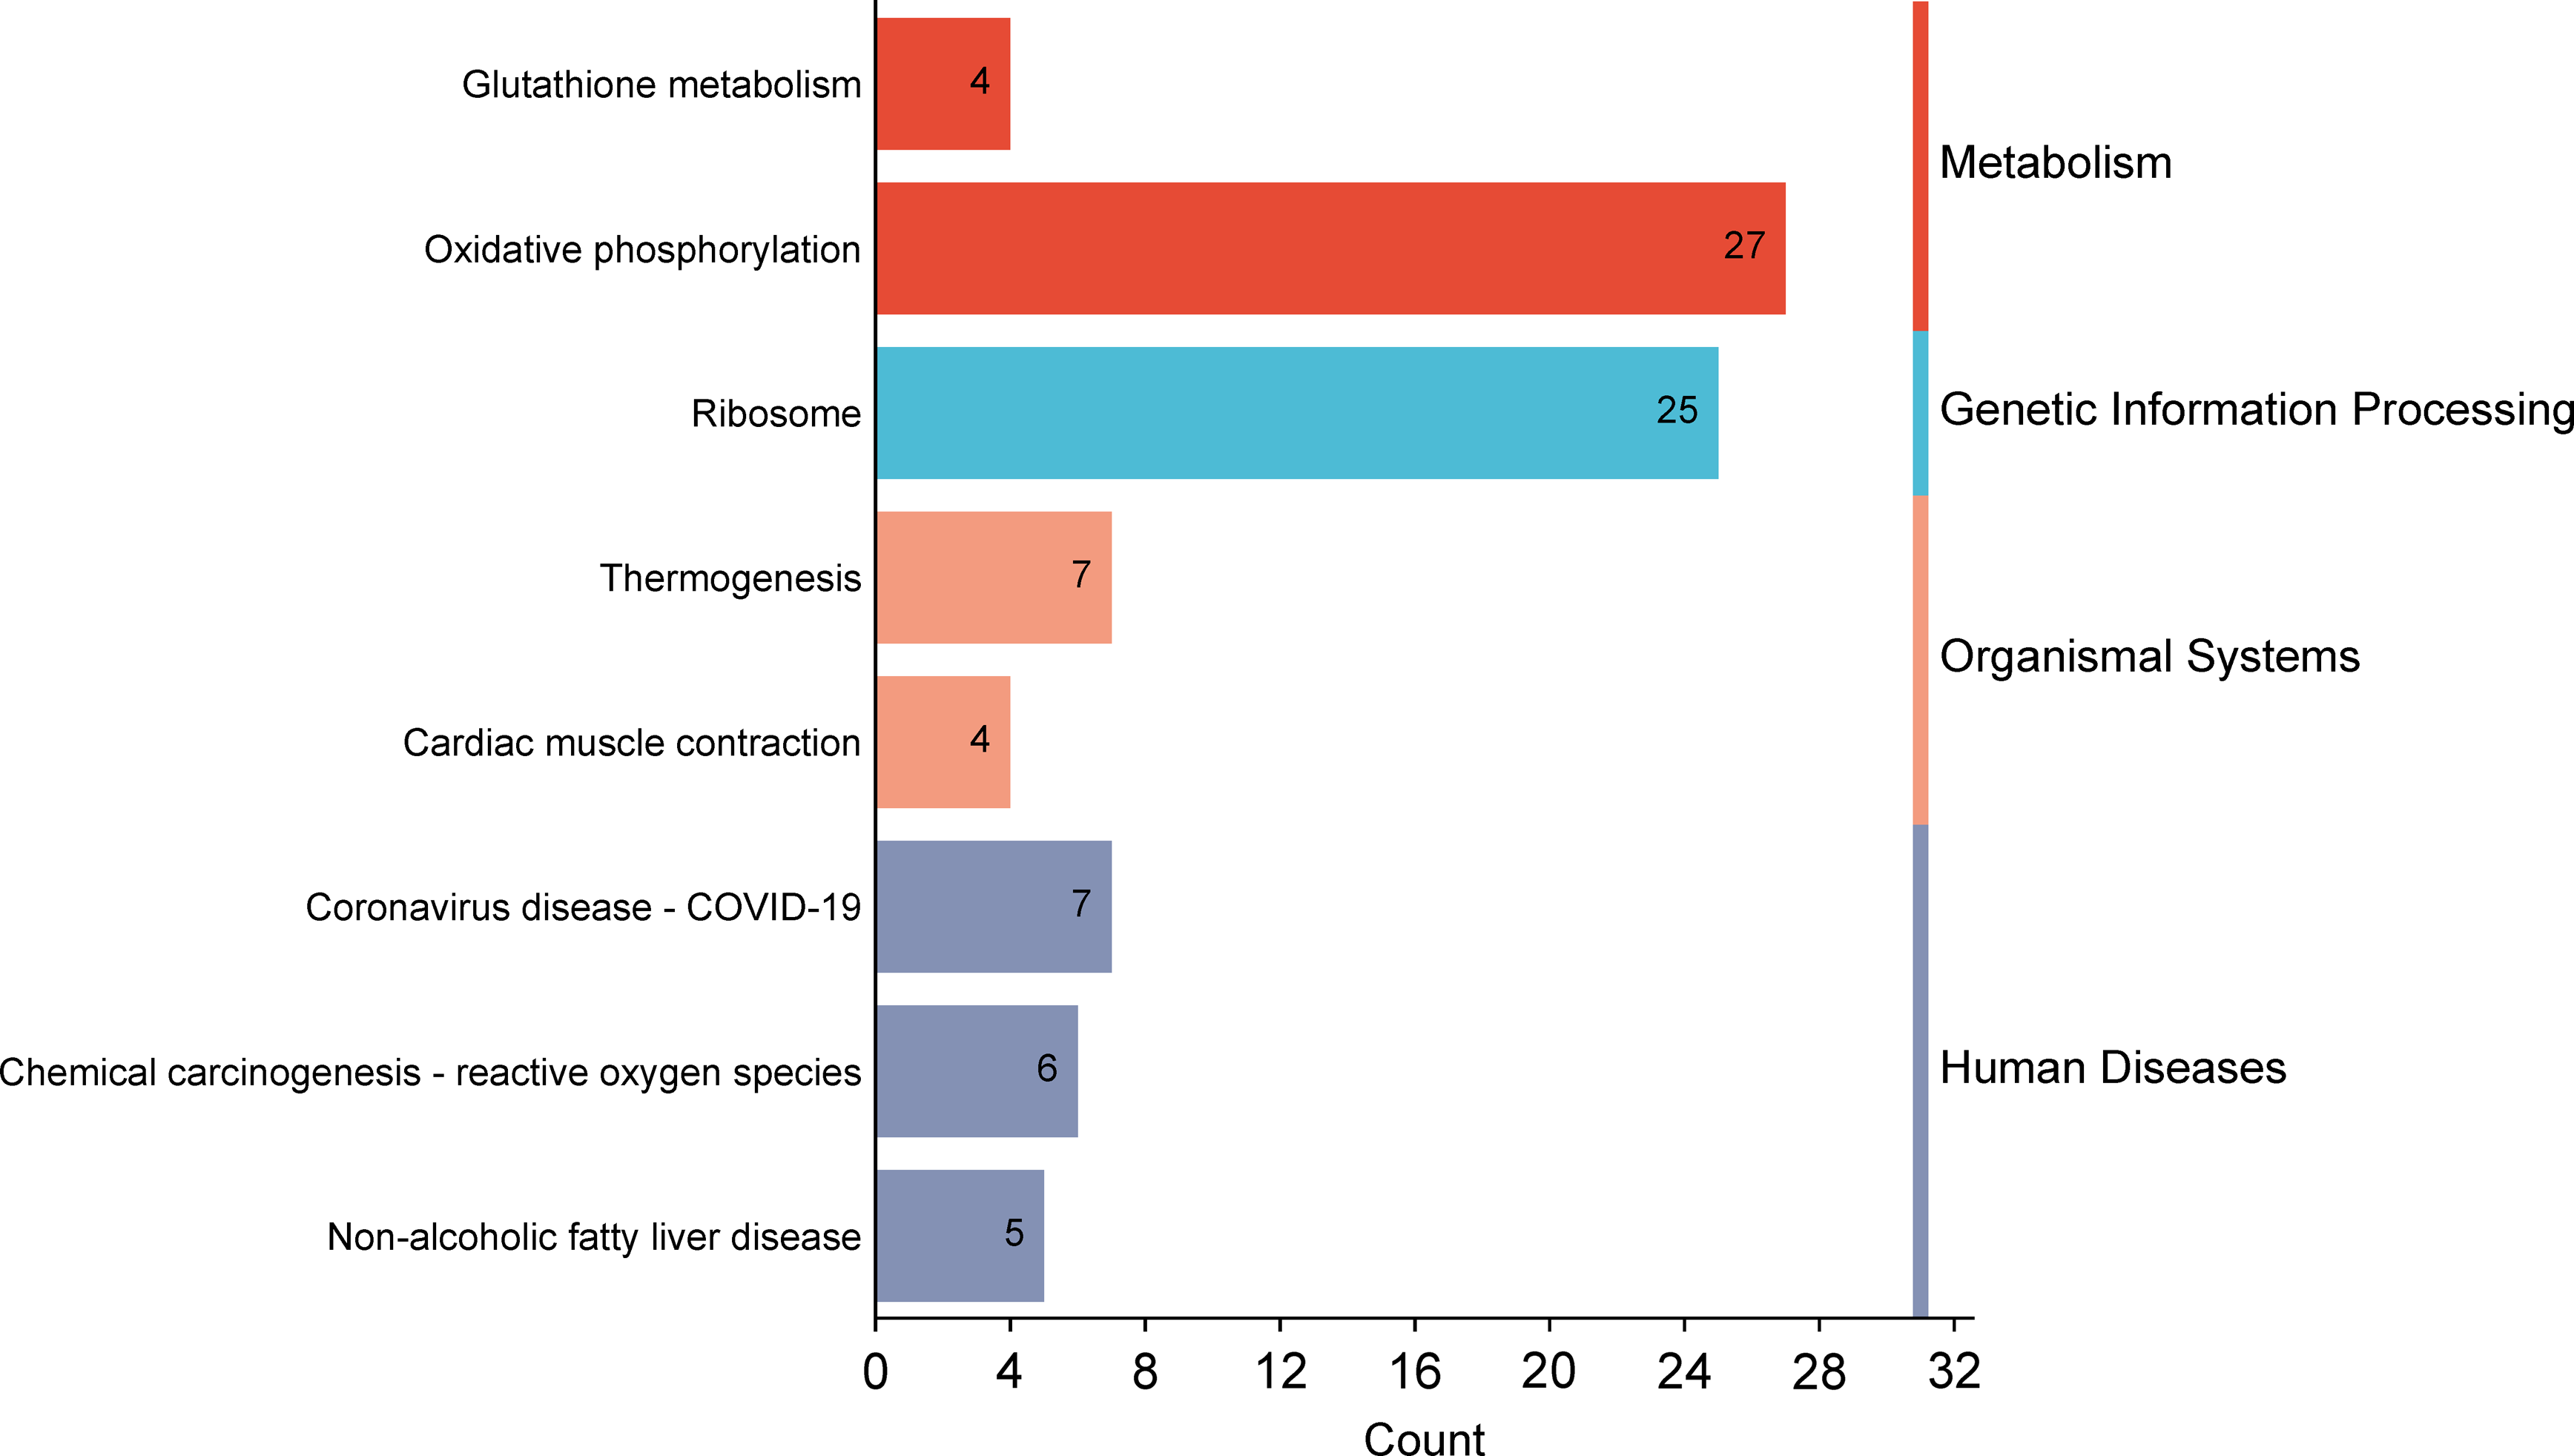
KEGG pathway analysis highlighted key NT1-associated pathways, including oxidative phosphorylation, ribosome, and thermogenesis, possibly reflecting metabolic dysregulation in NT1 (Figure 3).
Machine learning in screening candidate diagnostic biomarkers. The top functional pathways associated with genes in KEGG enrichment analysis of common DEGs from GSE21592.

PPI network and hub gene identification
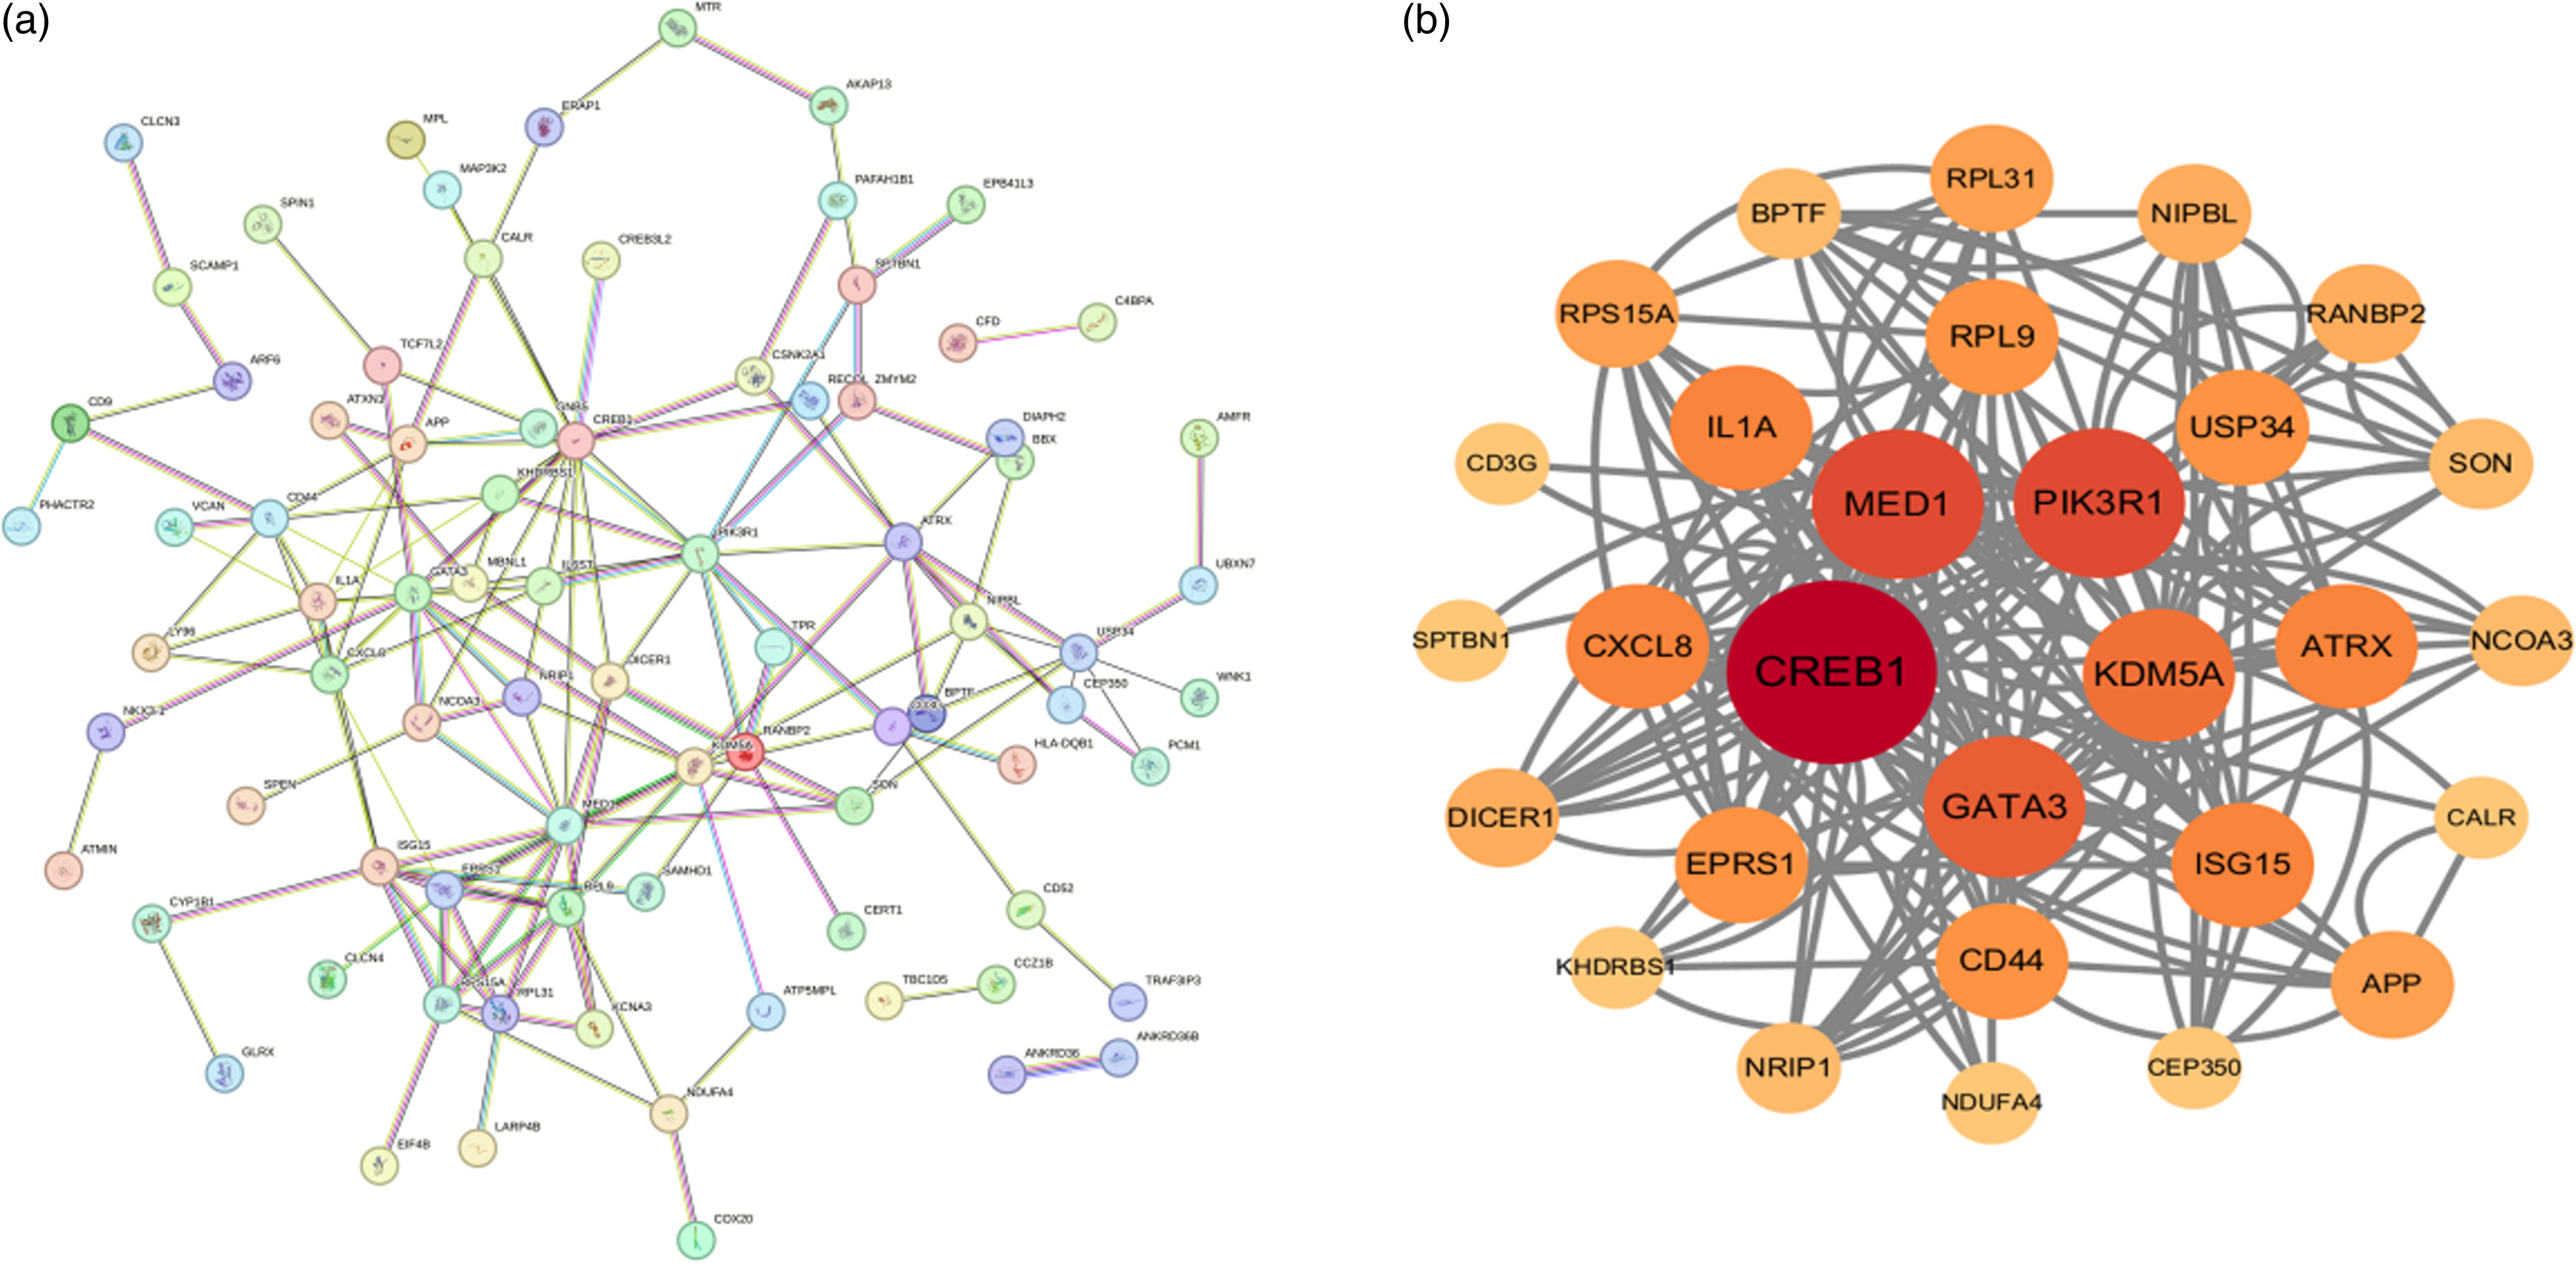
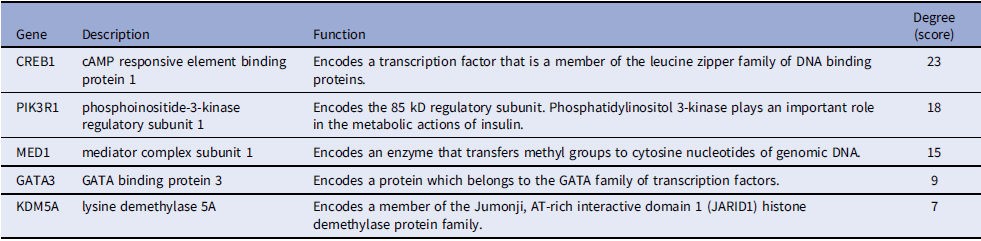
To identify central regulatory genes, we constructed a PPI network using the STRING database and visualized/analyzed it with Cytoscape. Hub genes – critical nodes with high network connectivity – were identified using the cytoHubba plugin, which ranks genes by degree centrality. The top five hub genes among DEGs were CREB1, PIK3R1, MED1, GATA3, and KDM5A (Figure 4). Table 3 provides detailed information on these hub genes.
Protein–protein interaction (PPI) networks of DEGs. (a) PPI network constructed with the DEGs without further processing. (b) The top-scoring module was identified from the PPI network using the MCODE method.

Central hub genes identified in PPI network

PPI: Protein–protein interaction
Clinical validation of hub genes
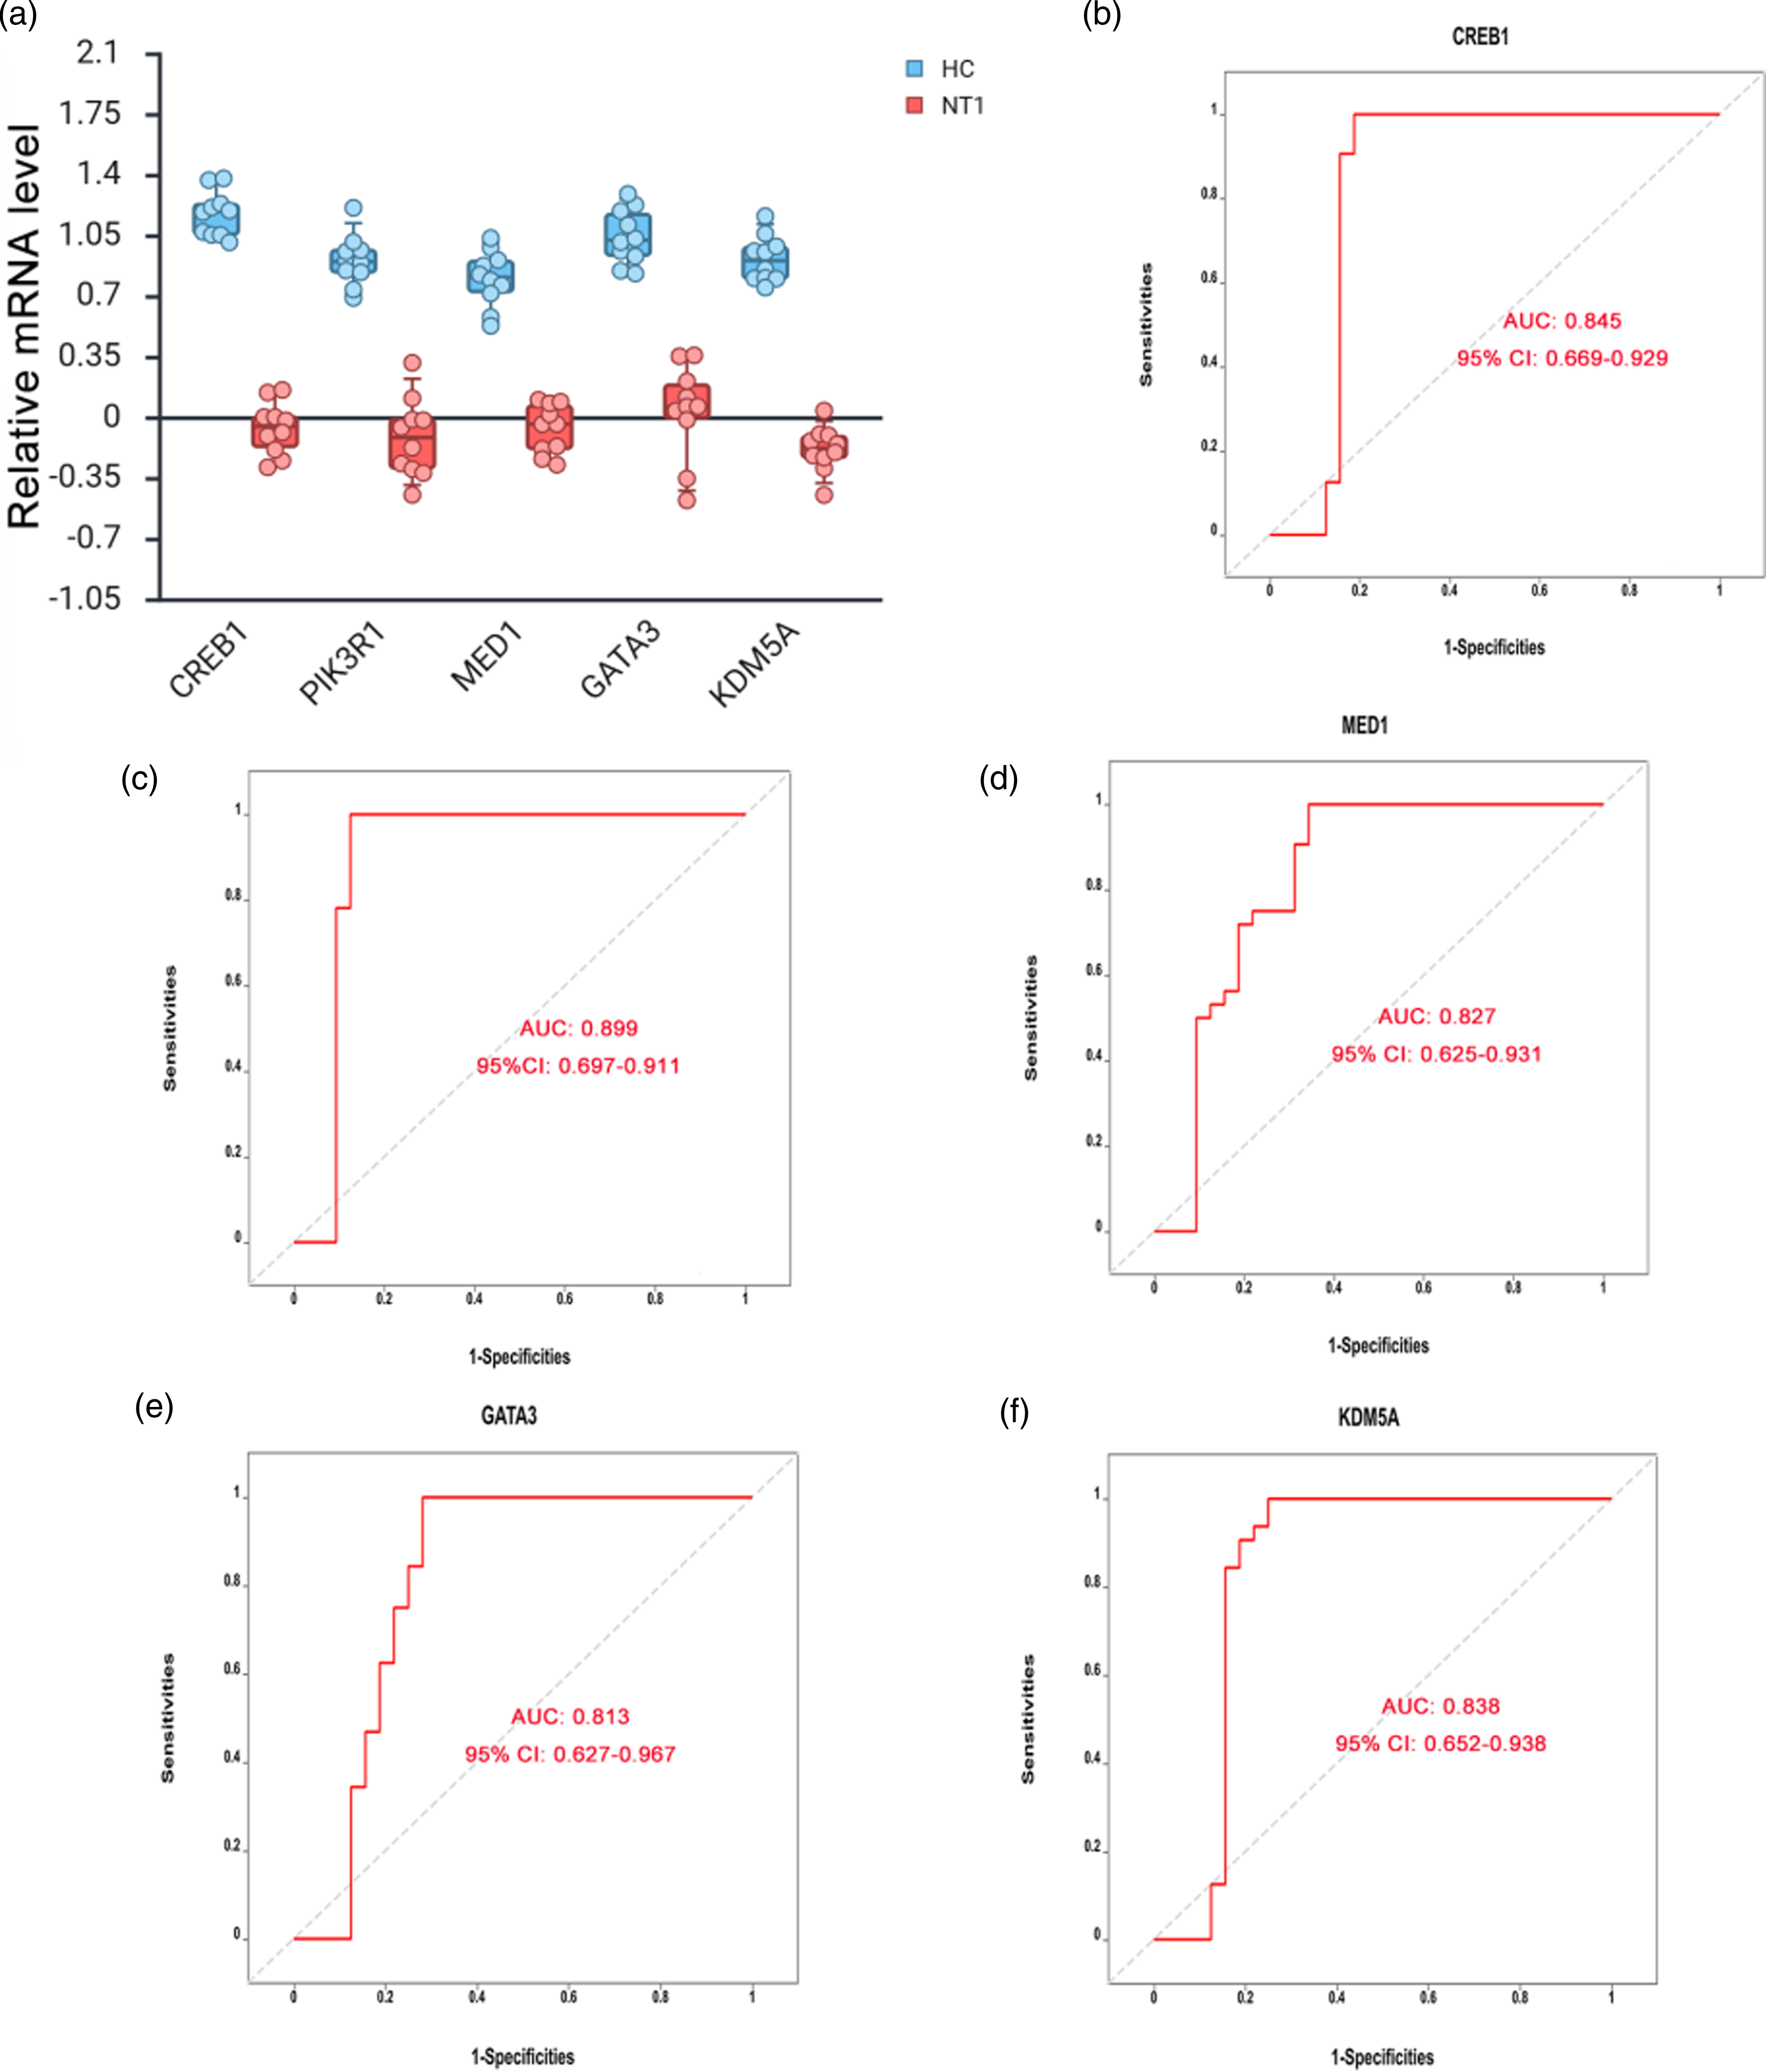
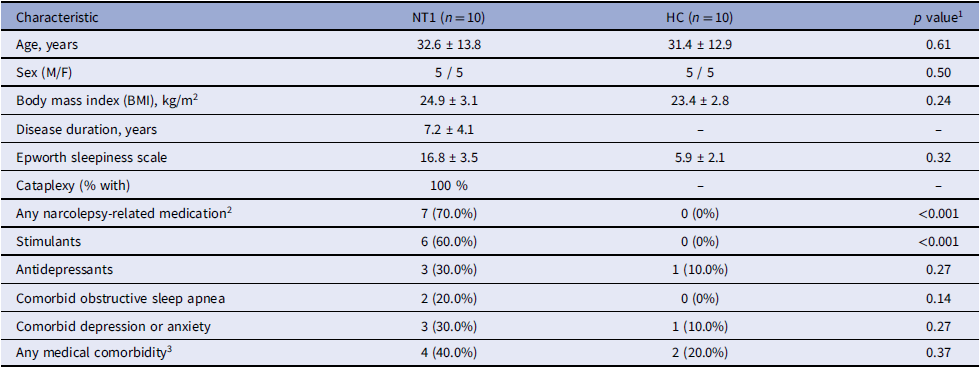
To confirm the clinical relevance of the identified hub genes, qRT-PCR was performed on peripheral blood samples collected from 10 NT1 patients and 10 HC. Demographic and clinical features of the NT1 and HC groups are summarized in Table 4. Results demonstrated significantly lower expression of CREB1, PIK3R1, MED1, GATA3, and KDM5A in NT1 patients compared to controls (all p < 0.01; Figure 5a). ROC curve analysis revealed substantial diagnostic potential for these hub genes in NT1. The area under the curve (AUC) values were as follows: 0.845 (95% CI: 0.669–0.929) for CREB1, 0.899 (95% CI: 0.697–0.911) for PIK3R1, 0.827 (95% CI: 0.625–0.931) for MED1, 0.813 (95% CI: 0.627–0.967) for GATA3, and 0.838 (95% CI: 0.652–0.938) for KDM5A (Figure 5b–f). After adjusting for age, the between-group differences for the validated hub genes remained directionally consistent. Sensitivity analyses excluding pediatric participants yielded qualitatively similar results (Supplementary Table S1). These findings support their potential roles as NT1 diagnostic biomarkers and provide insights for mechanistic studies.
Validation of hub genes in peripheral blood from the HC and NT1 groups. a. Boxplots with jittered individual data points show relative mRNA expression for CREB1, PIK3R1, MED1, GATA3, and KDM5A in peripheral blood from healthy controls (HC, n = 10) and narcolepsy type 1 (NT1, n = 10). Each dot represents one participant. Boxes indicate the median and interquartile range (IQR); whiskers extend to 1.5×IQR. b–f. ROC curve analysis of CREB1 (b), PIK3R1 (c), MED1 (d), GATA3 (e), and KDM5A (f) based on expression levels in NT1 patients. AUC: area under the ROC curve; CI: confidence interval; ROC: receiver operating characteristic; HC: healthy control; NT1: narcolepsy type 1.

Demographic and clinical characteristics of narcolepsy type 1 (NT1) patients and healthy controls (HC)

1 Continuous variables are presented as mean ± standard deviation (SD) and compared using independent-samples t tests; categorical variables are shown as n (%) and compared using χ 2 tests as appropriate.
2 Narcolepsy-related medications include wake-promoting agents and anticataplectic drugs.
3 Includes hypertension, diabetes, and other clinically relevant chronic medical conditions.
Discussion
Narcolepsy type 1 (NT1), characterized by cataplexy, results primarily from hypothalamic orexin neuropeptide deficiency; however, its precise etiology remains incompletely understood. Current consensus indicates NT1 arises from a complex interplay between genetic predispositions and environmental triggers [Reference Zhao, Ye, Huang, Pan, Su and Chen12,Reference Bassetti, Adamantidis and Burdakov13]. Recent advances in biotechnology – notably microarray technology, high-throughput sequencing, and bioinformatics – offer unprecedented opportunities to unravel the molecular underpinnings and pathophysiological mechanisms associated with NT1.
In the present study, we analyzed mRNA expression profiles from the GSE21592 dataset using bioinformatics approaches, identifying 148 differentially expressed genes (DEGs), comprising 16 upregulated and 132 downregulated genes. Functional annotation through GO and KEGG enrichment analyses revealed key biological insights. GO biological process analysis indicated significant enrichment in leukotriene B4 catabolism, negative regulation of cytokine production, and defense response to oxidative stress. These findings align with molecular function annotations, highlighting oxidoreductase activity, ubiquitin ligase inhibitor activity, and long-chain fatty acid omega-hydroxylase activity as notably enriched functions.
The significant enrichment of oxidoreductase activity among DEGs underscores the critical role of cellular redox homeostasis in NT1 pathogenesis. Oxidoreductases maintain oxidative balance, energy metabolism, and cellular survival, indicating that oxidative stress may contribute to the neural dysfunction in NT1 [Reference Liao, Liu and He14,Reference Szanto15]. Similarly, enriched cytokine regulation pathways implicate immune-inflammatory mechanisms in disease onset or progression, potentially involving autoimmune or neuroinflammatory processes [Reference Ouyang, Zhou, Zheng and Zhang16]. KEGG analysis further highlighted oxidative phosphorylation and ribosomal pathways. Oxidative phosphorylation – essential for cellular energy production – may impair neuronal function when disrupted, contributing to the neurodegenerative aspects observed in NT1. Ribosome pathways, integral for protein synthesis and stress responses, suggest impaired proteostasis and cellular adaptation in NT1 pathophysiology [Reference Liao, Liu and He14,Reference Ali Pour, Hosseinian and Kheradvar17,Reference Peng and Zhou18].
Moreover, we constructed a protein-protein interaction (PPI) network and identified five central hub genes: CREB1, PIK3R1, MED1, GATA3, and KDM5A. The central position of CREB1 within this network particularly highlights its potential significance. This gene encodes cyclic AMP-responsive element-binding protein 1, a transcription factor critical for neuronal survival, neuroplasticity, and circadian rhythm regulation via cAMP signaling pathways [Reference Ahn, Kim and Kim19,Reference Ismael, Robinette and Huric20]. CREB1 dysregulation – observed in neuropsychiatric and neurodegenerative disorders like depression and Parkinson’s disease – suggests its involvement in NT1 pathogenesis, warranting exploration as a therapeutic target or prognostic biomarker [Reference Chaipunko, Sookkua, Nopparat and Chutabhakdikul21,Reference Sochal, Ditmer and Tarasiuk-Zawadzka22].
PIK3R1, another key hub gene, exhibits neuroprotective and anti-apoptotic properties, extensively documented in Alzheimer’s disease and other neurodegenerative disorders [Reference Kang, Lim and Bateman23,Reference Dauvilliers, Lehmann, Jaussent and Gabelle24]. Given that β-amyloid metabolism is modulated by sleep and hypocretin dynamics [Reference Muench, Teichmann and Spille25,Reference Ramanan, Risacher and Nho26], the intersection between sleep disturbances and neurodegeneration positions PIK3R1 as a compelling candidate for further NT1-related investigations. MED1, a mediator complex component, regulates gene expression by interacting with transcription factors like NF–κB, which are pivotal for neuronal maturation and synaptogenesis – processes disrupted in NT1 [Reference Wan, Rasheed and Li27]. GATA3 influences ribosomal protein synthesis and cellular viability, suggesting impaired adaptive mechanisms in NT1 [Reference Borralleras, Sahun, Pérez-Jurado and Campuzano28]. Similarly, KDM5A modulates gene expression through histone demethylation and participates in immune regulation and neurodevelopment [Reference Kapadia, Viswakarma and Parsa29], aligning with the autoimmune and neuroimmune dysregulation hypothesis of NT1 pathogenesis.
Our RT-qPCR validation in peripheral blood samples substantiated the bioinformatics findings, demonstrating significantly decreased expression of CREB1, PIK3R1, MED1, GATA3, and KDM5A in NT1 patients compared to HCls. Beyond their network centrality, the identified hub genes have functions that are biologically plausible in the context of NT1. MED1 is a key subunit of the Mediator complex that bridges transcription factors and RNA polymerase II, integrating signals from nuclear receptors and other regulators to shape broad gene-expression programs in immune and neural cells [Reference Stumpf, Waskow and Krötschel30]. GATA3 is a master transcription factor for T helper 2 (Th2) differentiation and cytokine production [Reference Zhu, Yamane, Cote-Sierra, Guo and Paul31], and KDM5A encodes a histone H3K4 demethylase involved in chromatin remodeling and epigenetic control of transcription [Reference Shen, Shulha, Weng and Akbarian32]. Together, these molecules sit at critical regulatory layers controlling how environmental and immune signals are translated into stable changes in gene expression.These roles are highly relevant to current models of NT1, which emphasize immune dysregulation and autoimmune destruction of hypocretin/orexin neurons, as well as potential epigenetic modulation of sleep–wake circuitry. Reduced expression of MED1 may reflect a dampened capacity of immune cells to mount coordinated transcriptional responses, while lower GATA3 expression is compatible with disturbed CD4+ T-cell differentiation and altered Th-cell balance in NT1. Decreased KDM5A may indicate impaired epigenetic tuning of immune or neuronal gene networks, influencing susceptibility to orexin neuron injury or chronic changes in sleep–wake regulation. Although our data are observational and cannot prove causality, these functional links suggest that MED1, GATA3, and KDM5A are biologically plausible regulators within the disturbed immune–epigenetic landscape of NT1, and they provide concrete hypotheses for future mechanistic studies in disease-relevant cell types. Despite these promising findings, limitations warrant consideration. We acknowledge the limited sample size and the mixed adult–pediatric composition of the validation cohort. To mitigate potential age confounding, we adjusted for age and performed sensitivity analyses excluding pediatric participants. The overall direction and magnitude of effects remained consistent, supporting the robustness of our findings; nevertheless, validation in larger, age-stratified cohorts will be essential for future studies.
A potential concern is that our DEG definition relied on FDR control without enforcing a large fold-change threshold (e.g., |log2FC| ≥ 1). This was a deliberate choice. In peripheral blood transcriptomic studies of neuropsychiatric and sleep disorders, including NT1, effect sizes are typically modest because disease-related signals are diluted across heterogeneous cell populations. Under these conditions, applying a stringent fold-change cutoff can be overly conservative and may exclude biologically meaningful genes that show small but consistent differences. We therefore primarily relied on FDR <0.05 to control false positives and treated log2 fold-change as a quantitative descriptor of effect size rather than a hard filter. Importantly, our downstream interpretation did not depend on the sheer number of DEGs; instead, we focused on network-defined hub genes and demonstrated that the five candidates (CREB1, PIK3R1, MED1, GATA3, and KDM5A) showed significantly lower expression in NT1 in an independent qRT-PCR cohort, supporting their biological relevance despite moderate FCs at the transcriptomic level.
Conclusion
Through an integrated bioinformatic and statistical analysis of GEO datasets, our study identified critical genes and pathways associated with NT1. DEGs in NT1 participate in biological processes including metabolic regulation, humoral immune responses, and neutrophil activation. These genes were also substantially enriched in ribosome, thermogenesis, and oxidative phosphorylation pathways. Notably, key DEGs – CREB1, PIK3R1, MED1, GATA3, and KDM5A – may play pivotal roles in NT1 pathogenesis. These findings offer new insights into the molecular mechanisms underlying NT1 and present promising directions for improved diagnostics and therapeutic strategies.
Supplementary material
The supplementary material for this article can be found at https://doi.org/10.1017/cts.2025.10223.
Author contributions
Di Wang: Data curation, formal analysis, funding acquisition, investigation, and writing – original draft; Yangyue Cao: investigation and methodology; Haiyan Gou: data curation, investigation, and mMethodology; Yu Zhang: methodology and software; Juan Li: methodology and software; Yulan Zhu: project administration, supervision, and visualization; Yujuan Jiao: conceptualization, project administration and writing – review & editing.
Funding statement
This study was funded by China International Medical Foundation (NO. Z-2016-20-2101), The First Hospital of Tsinghua University Navigation Fund (NO. 2024-LH-12).
Competing interests
The authors have no conflicts of interest to declare.
Ethical statement
The study was conducted in accordance with the principles expressed in the Declaration of Helsinki. Written informed consent was obtained from all participants, and the study protocol was reviewed and approved by the Ethics Committee of the First Hospital of Tsinghua University and the Second Affiliated Hospital of Harbin Medical University (No. 0003098721/No. 012679007).


 Open access