


Impact Statement
This study reveals how a drop splashes on a surface by a newly proposed explainable artificial intelligence (XAI) method, which provides an alternative to the conventional investigation methods. In this method, an XAI is first trained to classify videos of splashing and non-splashing drops, then the classification process is analysed and interpreted by finding out which frame of the video has the most influence on the classification of the XAI. The findings of the study showed the fundamental aspects of drop impact, which can be leveraged to enable devices and systems that benefit humankind with various applications such as aeronautics, biology, chemical and mechanical engineering, materials, acoustics, and combustion.
1. Introduction
The impact of a liquid drop on a solid surface is a high-speed phenomenon that is encountered in a variety of contexts, such as spray cooling (Reference Breitenbach, Roisman and TropeaBreitenbach, Roisman & Tropea 2018) and aircraft icing (Reference Zhang and LiuZhang & Liu 2016; Reference Lavoie, Radenac, Blanchard, Laurendeau and VilledieuLavoie et al. 2022). Under certain impact conditions, splashing can occur, i.e. the impacting drop breaks up and ejects secondary droplets (Reference Gordillo and RibouxGordillo & Riboux 2019; Reference Hatakenaka, Breitenbach, Roisman, Tropea and TagawaHatakenaka et al. 2019; Reference Yokoyama, Tanaka and TagawaYokoyama, Tanaka & Tagawa 2022) instead of just spreading over the surface until it reaches its maximum radius (Reference Clanet, Béguin, Richard and QuéréClanet et al. 2004; Reference Gordillo, Riboux and QuinteroGordillo, Riboux & Quintero 2019). Splashing has various consequences, such as soil erosion (Reference Fernández-Raga, Palencia, Keesstra, Jordán, Fraile, Angulo-Martínez and CerdàFernández-Raga et al. 2017), propagation of contaminants (Reference Gilet and BourouibaGilet & Bourouiba 2015; Reference Waite, Whitelaw-Weckert and TorleyWaite, Whitelaw-Weckert & Torley 2015), and visible decreases in printing and painting quality (Reference LohseLohse 2022). Therefore, it is necessary to understand the dynamics of a splashing drop from the morphological evolution that occurs during the impact process. Owing to the multiphase nature of this phenomenon, which involves the liquid drop, the solid surface and the ambient air, many physical parameters strongly influence the occurrence of splashing (Reference Rioboo, Tropea and MarengoRioboo, Tropea & Marengo 2001; Reference YarinYarin 2006; Reference Josserand and ThoroddsenJosserand & Thoroddsen 2016). For instance, a given parameter can either promote or suppress splashing, depending on other parameters (Reference Usawa, Fujita, Tagawa, Riboux and GordilloUsawa et al. 2021; Reference Zhang, Zhang, Yi, He, Niu and HaoZhang et al. 2021, Reference Zhang, Zhang, Yi, Du, He, Niu and Hao2022). Furthermore, the spreading dynamics of a splashing drop are very complex, because the ejected secondary droplets add more morphological features, such as their ejection angle (Reference Burzynski, Roisman and BansmerBurzynski, Roisman & Bansmer 2020), ejection velocity (Reference Mundo, Sommerfeld and TropeaMundo, Sommerfeld & Tropea 1995; Reference Thoroddsen, Takehara and EtohThoroddsen, Takehara & Etoh 2012), number (Reference Lin, Wang, Wu, Yao, Xue and WuLin et al. 2022) and size (Reference Juarez, Gastopoulos, Zhang, Siegel and ArratiaJuarez et al. 2012; Reference Riboux and GordilloRiboux & Gordillo 2015; Reference Wang and BourouibaWang & Bourouiba 2018).
To aid observations of splashing drops, attention has turned to artificial intelligence (AI), which has been widely adopted and has proved effective in carrying out tasks in different fields, such as image and video processing (Reference Krizhevsky, Sutskever and HintonKrizhevsky, Sutskever & Hinton 2012; Reference He, Zhang, Ren and SunHe et al. 2016; Reference Voulodimos, Doulamis, Doulamis and ProtopapadakisVoulodimos et al. 2018), aeronautical and aerospace engineering (Reference Hou, Darakananda and EldredgeHou, Darakananda & Eldredge 2019; Reference Li, Zhang, Martins and ShuLi et al. 2020; Reference BruntonBrunton et al. 2021), and fluid mechanics (Reference Colvert, Alsalman and KansoColvert, Alsalman & Kanso 2018; Reference Brunton, Noack and KoumoutsakosBrunton, Noack & Koumoutsakos 2020; Reference Erichson, Mathelin, Yao, Brunton, Mahoney and KutzErichson et al. 2020; Reference Igarashi, Yee, Yokoyama, Kusuno and TagawaIgarashi et al. 2024). Although the underlying reasoning that leads AI to a specific decision is often unknown or not correctly understood (Reference Adadi and BerradaAdadi & Berrada 2018; Reference ArrietaArrieta et al. 2020), by solving the problems of explainability and interpretability, AI can become a powerful tool for advancing knowledge of physical phenomena. In particular, in studies of turbulence, AI has been widely used for the reconstruction of turbulence fields (Reference Fukami, Fukagata and TairaFukami, Fukagata & Taira 2019; Reference Kim, Kim, Won and LeeKim et al. 2021), for inflow turbulence generation in numerical simulations (Reference Kim and LeeKim & Lee 2020a; Reference Yousif, Zhang, Yu, Vinuesa and LimYousif et al. 2023) and to gain physical insight from data (Reference Kim and LeeKim & Lee 2020b; Reference Lu, Kim and SoljačićLu, Kim & Soljačić 2020; Reference Kim, Kim and LeeKim, Kim & Lee 2023). However, the application of AI to the investigation of multiphase flows is relatively recent. With regards to drop impact, several AI-based studies have been published since 2021 on the prediction of post-impact drop morphology (Reference Yee, Igarashi, Miyatake and TagawaYee et al. 2023), impact force (Reference Dickerson, Alam, Buckelew, Boyum and TurgutDickerson et al. 2022), maximum spreading (Reference Tembely, Vadillo, Dolatabadi and SoucemarianadinTembely et al. 2022; Reference Yancheshme, Enayati, Kashcooli, Jafari, Ezzaidi and MomenYancheshme et al. 2022; Reference Yoon, Chergui, Juric and ShinYoon et al. 2022) and splashing threshold (Reference Pierzyna, Burzynski, Bansmer and SemaanPierzyna et al. 2021). Notably, by image feature extraction using explainable artificial intelligence (XAI), Reference Yee, Yamanaka and TagawaYee, Yamanaka & Tagawa (2022) observed that the contour of a splashing drop's main body is higher than that of a non-splashing drop. Although Reference Yee, Yamanaka and TagawaYee et al. (2022) established a foundation for feature extraction methodology using XAI, the relationship between morphological features and physical parameters has not been discovered. This is because the classification was conducted solely on a single snapshot at a specific impact time, which does not enable comparison of morphological evolution between splashing and non-splashing drops. However, because the temporal evolution of the morphology is related to the acceleration of the drop, it contains important information about physical parameters, such as the impact force.
In the present study, a classification of videos or image sequences is proposed, based on which the morphological evolution of splashing drops can be compared with that of non-splashing drops. Although recurrent neural networks (RNNs) and long short-term memory (LSTM) networks are the two types of AI that are most widely used to process sequential data such as audio and video data (Reference Güera and DelpGüera & Delp 2018; Reference Ma, Chen, Kira and AlRegibMa et al. 2019; Reference SherstinskySherstinsky 2020), their complex architectures cause difficulties when attempts are made to analyse their decision-making processes. Instead, a feedforward neural network (FNN) model has been developed as an XAI video classifier, comprising a single fully connected layer. Classification is performed on image sequences processed from high-speed videos of splashing and non-splashing drops recorded during an experiment. The methodology of this study, including descriptions of the dataset and the implementation of the FNN, is explained in § 2. After high accuracy has been attained in the classification of image sequences of splashing and non-splashing drops, an analysis of the FNN's classification process is performed to extract the features of the splashing and non-splashing drops. An importance index is introduced to quantify the contributions of the extracted features to the classification of the FNN model. These results and a discussion of the morphological features of a drop impact are presented in § 3. The conclusions of this study are presented in § 4
2. Methodology
In this section, the dataset of image sequences showing the temporal evolution of drop morphology during impact (§ 2.1) and the implementation of the FNN developed for image-sequence classification (§ 2.2) are explained.
2.1 Experiment set-up and image processing
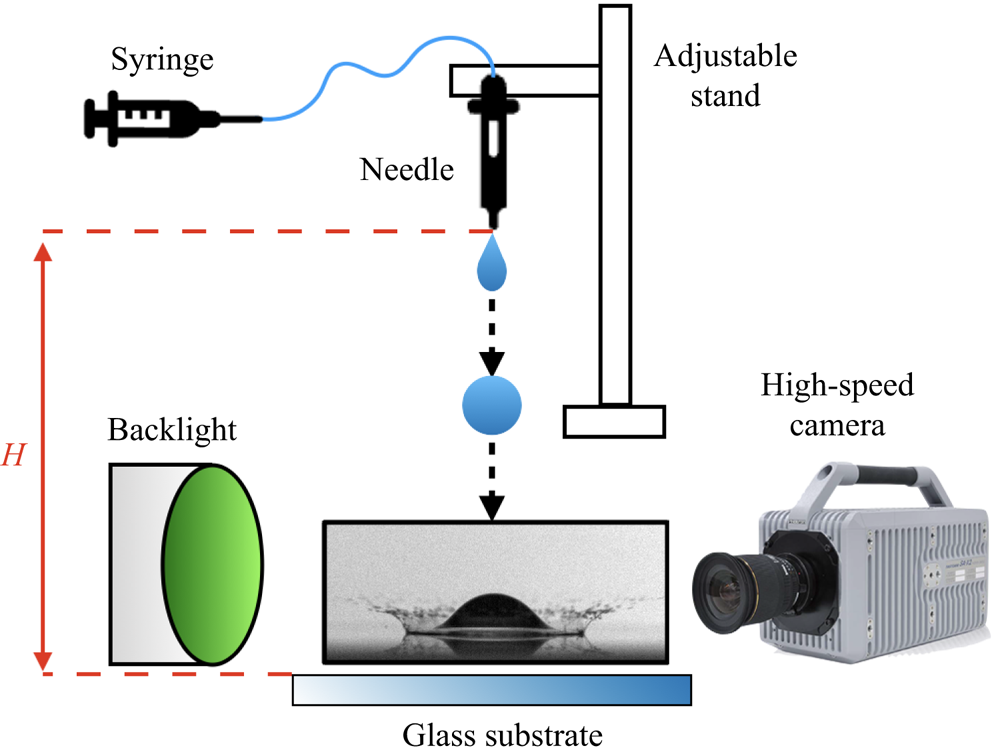
With the experimental set-up shown in figure 1, videos of drop impact were collected using a high-speed camera (Photron, FASTCAM SA-X) at a rate of  $45\,000\,\mathrm {s}^{-1}$, a spatial resolution of $(1.46 \pm 0.02) \times 10^{-5}\,\mathrm {m}\,\mathrm {px}^{-1}$ and a shutter speed of 1/48 539 s. Each of the videos shows an ethanol drop (Hayashi Pure Chemical Ind., Ltd; density $\rho = 789\,\mathrm {kg}\,\mathrm {m}^{-3}$, surface tension $\gamma = 2.2 \times 10^{-2}\,\mathrm {N}\,\mathrm {m}^{-1}$ and dynamic viscosity $\mu = 1.0 \times 10^{-3}$ Pa s) impacting on the surface of a hydrophilic glass substrate (Muto Pure Chemicals Co., Ltd, star frost slide glass 511611) after free-falling from a height $H$ ranging from $0.04$ to $0.60$ m. The resulting contact angles is approximately 2.02 $^{\circ }$. The area-equivalent diameter of the drop, which was measured before impact, was $D_{0} = (2.59 \pm 0.10) \times 10^{-3}$ m. Note that instead of volume-equivalent diameter, the more direct measurement method in area-equivalent diameter was adopted because drop diameter is not a manipulating variable in this study. The impact velocity $U_0$ and Weber number $We$ ( $= \rho U_{0}^2 D_{0}/\gamma$) ranged between 0.82 and $3.18\,\mathrm {m}\,\mathrm {s}^{-1}$, and between $63$ and $947$, respectively. The splashing thresholds in terms of impact height and Weber number were $H = 0.20$ m and $We = 348$, respectively. Note that some impacting drops with $H$ or $We$ equal to or greater than the splashing threshold did not splash. The $H$ and $We$ of the non-splashing drop with the highest values of $H$ and $We$ were $H = 0.22$ m and $We = 386$, respectively. Thus, there was a splashing transition at $0.20\,\mathrm {m} \leq H \leq 0.22$ m or $348 \leq We \leq 386$. After a frame-by-frame inspection for the presence of secondary droplets by human eyes, each of the videos was labelled according to the outcome: splashing or non-splashing. In other words, if secondary droplets are present in one of the frames of the video, it is labelled splashing. However, if secondary droplets did not present in any of the frames of the video, it is labelled non-splashing. There are a total of 249 videos: 141 of splashing drops and 108 of non-splashing drops.
From each video, seven frames, showing the temporal evolution of the drop morphology from the start of the impact until before the drop collapsed into a pancake-like morphology, were extracted to form the image sequences for classification. The seven frames were extracted when the normalized drop apex  $z_0/D_0 = 0.875$, 0.750, 0.625, 0.500, 0.375, 0.250 and 0.125, respectively. The definition of the drop apex $z_0$ is illustrated in figure 2. Therefore, $z_0/D_0$ can be understood as the portion of the drop that has yet to impact the surface. For example, when $z_0/D_0 = 0.250$, the remaining one-quarter of the drop has yet to impact the surface. Here, $z_0/D_0$ is plotted against the normalized impact time $tU_0/D_0$, which was averaged among all collected data of ethanol drops in figure 3. The error bars show the standard deviation of all 249 video data points. The black and red dashed lines show the pressure impact and self-similar inertial regimes proposed by Reference Lagubeau, Fontelos, Josserand, Maurel, Pagneux and PetitjeansLagubeau et al. (2012), which are plotted using
 $$\begin{gather} z_0/D_0 = 1 - tU_0/D_0, \end{gather}$$
 $$\begin{gather}z_0/D_0 = A_1 / (tU_0/D_0 + A_2)^2, \end{gather}$$
respectively, where  $A_1$ and $A_2$ are fitting parameters, which are 0.492 and 0.429, respectively, according to the fitting results by Reference Lagubeau, Fontelos, Josserand, Maurel, Pagneux and PetitjeansLagubeau et al. (2012). As shown in the figure, $z_0/D_0 = 0.875$, 0.750 and 0.625 cover the pressure impact regime; $z_0/D_0 = 0.500$ lies on the transition between the pressure impact and self-similar inertial regimes; and $z_0/D_0 = 0.375$, 0.250 and 0.125 cover the self-similar inertial regimes.
Schematic of experimental set-up used to collect high-speed videos of drop impact.
Apex of an impacting drop: (a) at the start of the impact when  $z_0/D_0 = 1.000$; (b) during the impact when $z_0/D_0 = 0.500$.

Normalized drop apex versus normalized impact time averaged among all collected data of ethanol drops.

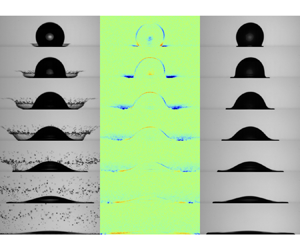
An in-house MATLAB code was used to extract these seven frames and to trim the background so that the impacting drop was located at the centre of each frame. Several examples of the image sequences of ethanol drops, including a non-splashing drop with  $H = 0.08$ m and $ We = 149$, a non-splashing drop at the splashing threshold with $H = 0.20$ m and $ We = 348$, a splashing drop at the splashing threshold with $H = 0.20$ m and $ We = 348$, and a splashing drop with $H = 0.60$ m and $ We = 919$, are shown in figures 4 and 5. Note that all images of the drops presented in this paper have their backgrounds trimmed using the in-house MATLAB code.
Examples of image sequences of non-splashing ethanol drops combined from seven frames at different normalized impact times.

Examples of image sequences of splashing ethanol drops combined from seven frames at different normalized impact times.

Fivefold cross-validation was performed to ensure the generalizability of the trained FNN. For this, the image sequences of each  $H$ were segmented into five combinations of training–validation and testing data in a ratio of 80:20 to ensure that the data of each $H$ were included in both training–validation and testing, and were distributed evenly among the data combinations. This is reflected in the similar numbers of splashing and non-splashing data for training–validation or testing among all data combinations, as shown in table 1.
Numbers of splashing and non-splashing data for training–validation and testing in each data combination of ethanol drops.

2.2 Feedforward neural network
Figure 6 illustrates the training and architecture of the FNN developed for the extraction of the critical impact time and the morphological features through the classification of splashing and non-splashing drops based on the image sequences showing the temporal evolution of the drop morphology. The FNN was implemented in the Python programming language on Jupyter Notebook (Reference Kluyver, Loizides and SchmidtKluyver et al. 2016) using the libraries of TensorFlow (Reference AbadiAbadi et al. 2016). The code is available at GitHub (https://github.com/yeejingzuTUAT/ImageAndImageSequenceClassificationForSplashingAndNonsplashingDrops).
Training and architecture of the FNN that was used to extract the morphological features of splashing and non-splashing drops.

In the input layer, the input image sequence is flattened into a one-dimensional column vector  $\boldsymbol {s}_{in} \in \mathbb {R}^{M}$ for $M = N_{img} h_{img} w_{img}$, where $N_{img}$ is the total number of frames in an image sequence, $h_{img}$ is the height of an image in pixels and $w_{img}$ is the width of an image in pixels. In this study, the values of $h_{img}$ and $w_{img}$ are 200 and 640, respectively.
Each element of  $\boldsymbol {s}_{in}$ in the input layer (red circles in figure 6) is fully connected to each element of $\boldsymbol {q}_{out}$ in the output layer (blue circles) by a linear function:
 \begin{equation} \boldsymbol{q}_{out} = \boldsymbol{W}\boldsymbol{s}_{in} + \boldsymbol{b}, \end{equation}
where  $\boldsymbol {q}_{out} \in \mathbb {R}^{C}$ is the output vector, which can be interpreted as a vector containing the prediction values, $\boldsymbol {W} \in \mathbb {R}^{C \times M}$ is the weight matrix and $\boldsymbol {b} \in \mathbb {R}^{C}$ is the bias vector. Note that bold italic symbols like $\boldsymbol {s}$ indicate vectors and bold sloping sans serif symbols like $\boldsymbol {W}$ indicate matrices. Here, $C$ is the total number of classes for classification, which are splashing and non-splashing in this case, and so $C=2$. The value of each element in $\boldsymbol {W}$ and $\boldsymbol {b}$, which is initialized using the Glorot uniform initializer (Reference Glorot and BengioGlorot & Bengio 2010), is determined through the training.
In the output layer, each element of  $\boldsymbol {q}_{out}$ is activated by a sigmoid function, which saturates negative values at 0 and positive values at 1, as follows:
 \begin{equation} y_{{pred},i} = \frac{1}{1 + \exp({-q_{{out},i}})} \end{equation}
for  $i = 1,\ldots,C$, where the activated value ${y}_{{pred},i}$ is an element of $\boldsymbol {y}_{pred} \in \mathbb {R}^{C}\boldsymbol {\cdot }\boldsymbol {y}_{pred} = [y_{{pred},1}, y_{{pred},2}]$ and can be interpreted as a vector containing the probabilities $y_{{pred},1}$ and $y_{{pred},2}$ of an input image sequence to be classified as a non-splashing drop and as a splashing drop, respectively. Throughout this paper, the subscripts ‘ ${nonspl}$’ and ‘ ${spl}$’ are used instead of the subscripts ‘ $1$’ and ‘ $2$’, respectively. Thus, $\boldsymbol {y}_{pred} = [y_{{pred},1}, y_{{pred},2}] = [y_{{pred,nonspl}}, y_{{pred,spl}}]$. For training, $\boldsymbol {y}_{pred}$ is computed for all training image sequences and compared with the respective true labels $\boldsymbol {y}_{true}\in \mathbb {R}^{C}$. The true labels for the image sequences of a splashing drop and a non-splashing drop are $\boldsymbol {y}_{true} = [0,1]$ and $[1,0]$, respectively.
Note that although it is a binary classification: splashing or non-splashing, two different values are stored to compensate the possibility of an image sequence not belonging to splashing or non-splashing, such as an empty image sequence does not contain any drop. Having mentioned that, the classification of storing only one value was also performed. However, when only one value was stored, the computation did not work well, where the training loss did not reduce at all.
A binary cross-entropy loss function is used for the comparison between  $\boldsymbol {y}_{pred}$ and $\boldsymbol {y}_{true}$ as follows:
 \begin{equation} l(\boldsymbol{y}_{true},\boldsymbol{y}_{pred}) = \sum_{i = 1}^{C}[-{y}_{{true},i}\ln({y}_{{pred},i})-(1-{y}_{{true},i})\ln(1-{y}_{{pred},i})]\end{equation}
for  $i = 1, \ldots, C$, where $l$ is the computed loss. From this equation, the value of $l$ approaches 0 as $\boldsymbol {y}_{pred}$ approaches $\boldsymbol {y}_{true}$ and increases significantly as $\boldsymbol {y}_{pred}$ varies away from $\boldsymbol {y}_{true}$. Additionally, $l$ is computed during training and validation, but not during testing.
Through a backpropagation algorithm (Reference Rumelhart, Hinton and WilliamsRumelhart, Hinton & Williams 1986), the gradient of  $l$ with respect to each element of $\boldsymbol {W}$ and $\boldsymbol {b}$ of the FNN is computed. The computed gradient determines whether the value of an element should be increased or decreased and the amount by which this should be done, when $\boldsymbol {W}$ and $\boldsymbol {b}$ are updated using the mini-batch gradient descent algorithm (Reference Li, Zhang, Chen and SmolaLi et al. 2014). Regularization of early stopping (Reference PrecheltPrechelt 1998) is applied to determine when to stop updating $\boldsymbol {W}$ and $\boldsymbol {b}$.
The percentage accuracy of the trained FNN is also evaluated as follows:
 \begin{equation} \text{accuracy} = \frac{\text{number of correct predictions}}{\text{total number of predictions}} \times 100. \end{equation}
The number of correct predictions is determined by the classification threshold. The trained FNN classifies an image sequence based on the element of  $\boldsymbol {y}_{pred}$ that has a value equal to or greater than that of the classification threshold. In this study, the classification threshold is fixed at $0.5$. For example, if the prediction of an image sequence by the trained FNN is $\boldsymbol {y}_{pred} = [0.25,0.75]$, then the image sequence will be classified as an image sequence of a splashing drop. Accuracy is computed during training, validation and testing. The training–validation of the FNN for image-sequence classification was evaluated from the plots of losses and accuracies averaged among every 50 epochs, which are shown in figure 7. Here, the number of epochs indicates how many times all training–validation image sequences were fed through the FNN for training. As the number of epochs increases, losses decrease and approach 0, while accuracies increase and approach 1. Early stopping prevents overfitting by stopping the updating of $\boldsymbol {W}$ and $\boldsymbol {b}$ when the losses reach their minimum values. These trends confirm that the training and validation have been carried out properly and the trained FNN has achieved the desired classification performance. The trained FNN is then used to classify test image sequences to check their generalizability.
Training and validation of the FNN for image-sequence classification of ethanol drops: (a) losses and (b) accuracies, averaged among every 50 epochs. Comb., combination; train., training; val. validation.

3. Results and discussion
In § 3.1, the testing of the trained FNN is explained. In § 3.2, the process for extracting the features used by the FNN to classify splashing and non-splashing drops is elaborated. In § 3.3, the importance index for quantifying the contributions of the extracted features in each frame of an image sequence is introduced and discussed. The same analysis was performed using liquid drops of different viscosities: silicone oil of 1 and 5 cSt. The analyses are discussed in §§ 3.4 and 3.5, respectively.
3.1 Testing of feedforward neural network
Testing is the evaluation of the ability of a trained FNN to classify image sequences that were not used to train the FNN. The results for all data combinations of ethanol drops are shown in table 2. Among all combinations, the test accuracy in classifying image sequences of splashing and non-splashing drops is higher than  $96\,\%$. The confidence of the classifications performed by the trained FNN can be analysed from the plot of the splashing probability $y_{{pred,spl}}$ computed by the trained FNN for the test image sequences. Since similar results were obtained for all data combinations of ethanol drops, only the plot for combination 1 is shown in figure 8(a). For most image sequences of splashing and non-splashing drops, the values of $y_{{pred,spl}}$ computed by the trained FNN are $\geq$0.8 and $\leq$0.2, respectively. In other words, most of the computed $y_{{pred,spl}}$ differ by at least 0.3 from the classification threshold, which is fixed at 0.5, indicating relatively high confidence of the classifications performed by the trained FNN. An analysis on the wrongly classified data of ethanol drops can be found in Appendix A.
Test accuracy of FNN trained with different data combinations in classifying image sequences of splashing and non-splashing ethanol drops.

(a) Splashing probability  $y_{{pred,spl}}$ and (b) splashing prediction value $q_{{out,spl}}$ versus Weber number $ We $ for test image sequences of combination 1 of ethanol drops.

The high accuracy and confidence in image-sequence classification by the simple but highly explainable FNN architecture is possible because of the high similarity of the image sequences. As mentioned in § 2, the drop size and the spatial resolution of the frames in each image sequence were kept constant, with a low standard deviation. Moreover, the background of the image data was trimmed to ensure that the impacting drop was positioned at the centre of each frame. As can be seen in figures 4 and 5, regardless of  $H$,
$H$,  $ We $ and the outcome of the impact, the image sequences are very similar but still retain the important distinguishing characteristics of splashing and non-splashing drops. The classification process of the well-trained FNN can now be visualized and analysed.
The splashing probability  $y_{{pred,spl}}$ is calculated from the splashing prediction value $q_{{out,spl}}$ using a sigmoid function (see (2.4)), where $y_{{pred,spl}} = 0.5$ when $q_{{out,spl}} = 0$. In other words, the trained FNN classifies an image sequence based on $q_{{out,spl}} = 0$, where an image sequence is classified as a splashing drop if $q_{{out,spl}} \geq 0$ and as a non-splashing drop if $q_{{out,spl}} < 0$. Since $q_{{out,spl}}$ is not saturated to between 0 and 1 like $y_{{pred,spl}}$, it has a linear relationship with $ We $, as shown in figure 8(b). Such a linear relationship indicates the potential for measuring physical quantities from the image sequence using the FNN.
3.2 Extraction of morphological features
In this subsection, the extraction of the features of the morphological evolution of splashing and non-splashing drops is explained. As mentioned in § 3.1, the trained FNN classifies an image sequence based on  $q_{{out,spl}} = 0$, where an image sequence is classified as a splashing drop if $q_{{out,spl}} \geq 0$ and as a non-splashing drop if $q_{{out,spl}} < 0$. The analysis of the classification process (see Appendix B) shows that $q_{{out,spl}} \approx \boldsymbol {w}_{spl} \boldsymbol {\cdot } \boldsymbol {s}_{in} = \sum {\boldsymbol {w}_{{spl},z_0/D_0} \boldsymbol {\cdot } \boldsymbol {s}_{{in},z_0/D_0}}$, where $\boldsymbol {w}_{spl} \in \mathbb {R}^{M}$ is the row vector of the weight matrix $\boldsymbol {W}$ that corresponds to $q_{{out,spl}}$, $\boldsymbol {w}_{{spl},z_0/D_0} \in \mathbb {R}^{m}$ is the vector that contains the elements of the splashing weight vector $\boldsymbol {w}_{spl}$ that corresponds to a frame, $\boldsymbol {s}_{{in},z_0/D_0} \in \mathbb {R}^{m}$ is a frame flattened into a vector and $m$
$m$  $(= h_{img}w_{img})$ is the total number of pixels in a frame. Thus, the value of $\boldsymbol {w}_{{spl},z_0/D_0} \boldsymbol {\cdot } \boldsymbol {s}_{{in},z_0/D_0}$ of each frame has to be as high as possible for a splashing drop to have $q_{{out,spl}} \geq 0$. However, the value of $\boldsymbol {w}_{{spl},z_0/D_0}\boldsymbol {\cdot }\boldsymbol {s}_{{in},z_0/D_0}$ of each frame has to be as low as possible for a non-splashing drop to have $q_{{out,spl}} < 0$.
For the analysis of  $\boldsymbol {w}_{{spl},z_0/D_0}\boldsymbol {\cdot } \boldsymbol {s}_{{in},z_0/D_0}$, the $\boldsymbol {w}_{{spl},z_0/D_0}$ vector of each frame is reshaped in row-major order into a two-dimensional $h_{img} \times w_{img}$ matrix $\boldsymbol {w}_{{spl},z_0/D_0}$, which is the shape of a frame: $\boldsymbol {w}_{{spl},z_0/D_0} \in \mathbb {R}^{m} \to \boldsymbol {w}_{{spl},z_0/D_0} \in \mathbb {R}^{h_{img} \times w_{img}}$. The reshaped matrices $\boldsymbol {w}_{{spl},z_0/D_0}$ are visualized as colour maps. For explanation, the colour maps of the reshaped matrices of $\boldsymbol {w}_{{spl},z_0/D_0}$ of the FNN trained with combination 1 of ethanol drops are presented in figure 9. The values of the elements in ${\boldsymbol w}_{{spl},z_0/D_0}$ are normalized by the maximum absolute values in ${\boldsymbol w}_{spl}$, and thus the blue–green–red (BGR) scale is from $-1.0$ to 1.0. Note that only the colour maps of combination 1 are shown, because those for the other combinations are similar.
Colour maps of the reshaped matrices of  ${\boldsymbol w}_{{spl},z_0/D_0}$ of the FNN when trained with combination 1 of ethanol drops. The distributions were similar for the FNN when it was trained with other combinations of ethanol drops.

In the colour maps, the distributions of the extreme values, i.e. values with large magnitudes, show the important features that the FNN identifies to classify splashing and non-splashing drops. The extreme negative values shown in blue are the features of splashing drops, and the extreme positive values shown in red are the features of non-splashing drops. This is because the high-speed videos were captured using shadowgraphy, where the normalized intensity value of a pixel occupied by the drop is zero ( $s_{{in},z_0/D_0,i} = 0$), while the normalized intensity value of a pixel not occupied by the drop but capturing the backlight is near to one ( $s_{{in},z_0/D_0,i} \to 1$). Hence, the FNN assigned negative values to those pixel positions occupied by a splashing drop but not by a non-splashing drop, and so those negative values would be cancelled out by a splashing drop ( $w_{{in},z_0/D_0,i}s_{{in},z_0/D_0,i} = 0$) to increase the value of $\boldsymbol {w}_{{spl},z_0/D_0} \boldsymbol {\cdot } \boldsymbol {s}_{{in},z_0/D_0}$. However, for a non-splashing drop, those negative values would not be cancelled out and would remain ( $w_{{in},z_0/D_0,i}s_{{in},z_0/D_0,i} \to w_{{in},z_0/D_0,i}$), thereby reducing the value of $\boldsymbol {w}_{{spl},z_0/D_0} \boldsymbol {\cdot } \boldsymbol {s}_{{in},z_0/D_0}$. Instead, the FNN assigned positive values to those pixel positions occupied by a non-splashing drop but not by a splashing drop, and so those positive values would be cancelled out by a non-splashing drop ( $w_{{in},z_0/D_0,i}s_{{in},z_0/D_0,i} = 0$), reducing the value of $\boldsymbol {w}_{{spl},z_0/D_0} \boldsymbol {\cdot } \boldsymbol {s}_{{in},z_0/D_0}$. However, for a splashing drop, those positive values would not be cancelled out and would remain ( $w_{{in},z_0/D_0,i}s_{{in},z_0/D_0,i} \to w_{{in},z_0/D_0,i}$), thereby increasing the value of $\boldsymbol {w}_{{spl},z_0/D_0} \boldsymbol {\cdot } \boldsymbol {s}_{{in},z_0/D_0}$.
By comparing the distribution of the extreme values in the colour maps of the reshaped matrices of  ${\boldsymbol w}_{{spl},z_0/D_0}$ with the image sequences of typical splashing and non-splashing drops (see figures 4 and 5), it is found that the distribution of the values of large magnitudes, i.e. the splashing and non-splashing features, resembles the morphology of an impacting drop. The distributions of the splashing and non-splashing features indicate that the main morphological differences are the lamella, the contour of the main body and the ejected secondary droplets.
In terms of the lamella, that of a splashing drop is ejected faster before lifting and breaking into secondary droplets, while that of a non-splashing drop is ejected more slowly before developing into a thicker film. The differences in the ejection velocity can be seen from the reshaped matrix of  ${\boldsymbol w}_{{spl},z_0/D_0 = 0.875}$, where the splashing features are distributed around the ejected lamella while the non-splashing features are distributed around the contact line. Reference Riboux and GordilloRiboux & Gordillo (2017) found that in the limit of Ohnesorge number $Oh$ ( $= \mu /\sqrt {\rho \gamma D_0}$) much smaller than one, the ejection time of the lamella scales with Weber number as $ We ^{-2/3}$. In this study, $Oh$ is of the order of $10^{-3}$, which is small enough for the scaling found by Reference Riboux and GordilloRiboux & Gordillo (2017) to be valid. Therefore, owing to the higher $ We $ of a splashing drop, the ejection time of the lamella is shorter than in the case of a non-splashing drop. Furthermore, Reference Philippi, Lagrée and AntkowiakPhilippi, Lagrée & Antkowiak (2016) reported that the pressure peak is near the contact line, causing a bypass motion of the flow. As a result of a slower ejection of the lamella of a non-splashing drop, more of the volume of the drop is concentrated near the contact line.
From the distribution of the splashing features in  ${\boldsymbol w}_{{spl},z_0/D_0}$ of $0.625 \leq z_0/D_0 \leq 0.875$, we can see that the lamella of a splashing drop is lifted higher. A lifted lamella has been identified as being characteristic of a splashing drop by Reference Riboux and GordilloRiboux & Gordillo (2014), who noted that splashing occurs as a result of the vertical lift force imparted by the air on the lamella. As $z_0/D_0$ reduces to $z_0/D_0 \leq 0.500$, the lamella of a splashing drop descends and the ejected secondary droplets are too scattered to be captured easily by the FNN.
The distributions of the non-splashing features in  ${\boldsymbol w}_{{spl},z_0/D_0}$ for $0.125 \leq z_0/D_0 \leq 0.375$ show that the lamella of a non-splashing drop develops into a film thicker than that of a splashing drop. This can be explained using the studies by Reference Lagubeau, Fontelos, Josserand, Maurel, Pagneux and PetitjeansLagubeau et al. (2012) and Reference Eggers, Fontelos, Josserand and ZaleskiEggers et al. (2010), who reported that in the viscous plateau regime, the asymptotic film thickness scales with $Re^{-2/5}D_0$. Here, $Re= \rho U_0 D_0/\mu$ is the Reynolds number. In this study, $D_0$ and $\mu$ are the same for all splashing and non-splashing drops, and thus the non-splashing drops have a thicker film owing to the lower $U_0$.
Splashing features can also be found around the contour of the main body, even when  $z_0/D_0 = 0.875$. This indicates that once the impact has commenced, the contour of the main body of a splashing drop is already higher than that of a non-splashing drop. Most previous studies approximated that during the pressure impact regime, the upper free surface of the drop kept moving towards the solid surface at the impact velocity $U_0$, together with the drop apex, while retaining its original shape (Reference Eggers, Fontelos, Josserand and ZaleskiEggers et al. 2010; Reference Gordillo, Sun and ChengGordillo, Sun & Cheng 2018; Reference Mitchell, Klewicki, Korkolis and KinseyMitchell et al. 2019). Nevertheless, such small differences in the contour of the main body between splashing and non-splashing drops could be captured using the FNN and were first reported by Reference Yee, Yamanaka and TagawaYee et al. (2022), who classified images of splashing and non-splashing drops using an FNN.
It is important to mention that as  $z_0/D_0$ reduces to $z_0/D_0 \leq 0.500$, the distribution of the splashing features around the contour of the main body becomes less obvious. This is different from the reshaped weight vectors trained using image classification in the study by Reference Yee, Yamanaka and TagawaYee et al. (2022). In their study, they trained three different FNNs to classify splashing and non-splashing ethanol drops using images extracted when $z_0/D_0 = 0.750$, 0.500 and 0.250, respectively. As shown in figure 10, the distributions of the splashing and non-splashing features in the reshaped weight vectors trained by Reference Yee, Yamanaka and TagawaYee et al. (2022) are found at similar pixel positions to those in the current study. Note that in this study, each of the seven frames in the image sequences was cropped to $200\,{\rm px} \times 640\,{\rm px}$ and thus the weight vector has 896 000 elements, whereas Reference Yee, Yamanaka and TagawaYee et al. (2022) cropped their images to $160\,{\rm px} \times 640\,{\rm px}$ and thus each of the weight vectors has only 102 400 elements. However, the distributions are much more obvious for the reshaped vectors trained using only images of $z_0/D_0 = 0.250$ than for ${\boldsymbol w}_{{spl},z_0/D_0 = 0.250}$ trained using image sequences. This is because the FNN image classifier can only extract information from a single image, whereas the FNN image-sequence classifier of this study can extract information from seven frames in an image sequence. In other words, the FNN image-sequence classifier can pick and choose the frame from which it wants to extract the information. As a result, the test accuracy of the FNN image-sequence classifier ( $\leq$96 %) is higher than that of the FNN image classifiers ( $\leq$92 % for $z_0/D_0 = 0.750$; $\leq$94 % for $z_0/D_0 = 0.500$; and $\leq$90 % for $z_0/D_0 = 0.250$). Although it could possibly miss important morphological features of splashing and non-splashing drops, quantification of the contribution of each frame and the extracted features to the classification by the FNN image-sequence classifier could provide deeper insights into the morphological evolution of splashing and non-splashing drops, which is discussed in the next section.
Comparison of the colour maps of the reshaped weight vectors trained using image-sequence classification of ethanol drops in the current study and image classification of ethanol drops in the study by Reference Yee, Yamanaka and TagawaYee et al. (2022).

3.3 Importance index of the extracted features
The importance index for quantifying the contributions of the extracted features in each frame of an image sequence to the classification of the FNN is introduced and discussed in this subsection. The analysis of the classification process (see Appendix B) shows that the value of  $\boldsymbol {w}_{{spl},z_0/D_0} \boldsymbol {\cdot } \boldsymbol {s}_{{in},z_0/D_0}$ for each frame shows the respective contribution to the computation of $q_{{out,spl}}$. Denoted by $q_{{out,spl},z_0/D_0}$, the values of $\boldsymbol {w}_{{spl},z_0/D_0} \boldsymbol {\cdot } \boldsymbol {s}_{{in},z_0/D_0}$ for each value of $z_0/D_0$ are plotted against $q_{{out,spl}}$. In figure 11(a), only the plot for combination 1 of ethanol drops is shown, because similar results were obtained for the other data combinations of ethanol drops. The black dashed line shows $q_{{out,spl}} = 0$, which corresponds to the classification threshold $y_{{pred,spl}} = 0.5$. To the left of this line where $q_{{out,spl}} \geq 0$, an image sequence is classified as that of a splashing drop, while to the right of this line where $q_{{out,spl}} < 0$, an image sequence is classified as that of a non-splashing drop. To identify the importance of each $z_0/D_0$ for the classification of the FNN, least squares fitting is performed for each $z_0/D_0$ and shown in figure 11(a) by the dotted lines with the same colours as the respective markers. Along with the values of $q_{{out,spl}}$, the values of $q_{{out,spl},z_0/D_0}$ of all $z_0/D_0$ exhibit an increasing trend, where the slopes of all the fitted lines are positive. Here, we argue that the $z_0/D_0$ with the slope of the highest value has the most influence on the classification of the FNN. This is because if the slope has a low value, then the value of $q_{{out,spl},z_0/D_0}$ remains constant regardless of the value of $q_{{out,spl}}$. In other words, $q_{{out,spl},z_0/D_0}$ is similar regardless of whether the classification is splashing or non-splashing. In contrast, if the slope has a high value, the change in the value of $q_{{out,spl},z_0/D_0}$ contributes significantly to the change in the value of $q_{{out,spl}}$. Thus, the classification of an image sequence as that of a splashing or a non-splashing drop is highly dependent on the value of $q_{{out,spl},z_0/D_0}$.
(a)  $q_{{out,spl},z_0/D_0}$ versus $q_{{out,spl}}$ of test image sequences of combination 1 of ethanol drops. (b) Slopes of fitted lines $\beta _{z_0/D_0}$ versus normalized impact time $tU_0/D_0$ of all data combinations of ethanol drops.

Here, the slope of a fitted line is introduced as the importance index for quantifying the contribution of each frame in an image sequence to the classification of the FNN. Denoted by  $\beta _{z_0/D_0}$, the slopes of the fitted lines are plotted against $tU_0/D_0$ for the respective $z_0/D_0$ for all data combinations of ethanol drops in figure 11(b). As can be seen, all data combinations have peak values at $tU_0/D_0 = 0.24$ and 0.38, corresponding to $z_0/D_0 = 0.750$ and 0.625. These peak values, which range between 0.25 and 0.30, are more than approximately double the values at other $tU_0/D_0$, which are less than 0.15. This indicates that the two frames at $tU_0/D_0 = 0.24$ and 0.38 have significantly more influence on the classification by the FNN than the frames at other $tU_0/D_0$. This is also why the distributions of the splashing and non-splashing features are most obvious in the reshaped matrices of $\boldsymbol {w}_{{spl},z_0/D_0}$ at $tU_0/D_0 = 0.24$ and 0.38, as shown in figure 9. Therefore, the morphological differences between splashing and non-splashing drops are most pronounced at $tU_0/D_0 = 0.24$ and 0.38, rather than at the earlier impact time. These findings are interesting because, for human eyes, splashing drops might look more different from non-splashing drops at later impact times.
After reaching peak values at  $tU_0/D_0 = 0.238$ and 0.375, $\beta _{z_0/D_0}$ decreases until $tU_0/D_0 = 0.971$. However, $\beta _{z_0/D_0}$ slightly increases at $tU_0/D_0 = 1.473$. A possible reason for this is the lamella of a non-splashing drop, which emerges later than that of a splashing drop and develops into a film thicker than that of a splashing drop, as mentioned in § 3.2. In particular, at $tU_0/D_0 = 1.473$, when $z_0/D_0$ decreases to 0.125, this difference in terms of the lamella is the most obvious and thus could easily be picked up by the FNN. This reasoning was discussed by analysing the contributions of splashing and non-splashing features to the computation of $q_{{out,spl},z_0/D_0}$. The explanation of the contribution of the splashing and non-splashing features can be found in Appendix C.
The results and discussion presented in this section are not affected by the number of frames and the choice of  $z_0/D_0$. This is validated by additional analysis performed on image sequences with more frames, specifically twenty-two frames extracted when $z_0/D_0 = 0.120$–0.960 at an interval of 0.040. The results and discussion of the analysis are presented in Appendix D.
3.4 Analysis using silicone oil of 1 cSt
The same analysis was performed using liquid drops of silicone oil of 1 cSt. The area-equivalent diameter of the drop of 1 cSt silicone oil (Shin-Etsu Chemical Co., Ltd.; density  $\rho = 816\,\mathrm {kg}\,\mathrm {m}^{-3}$, surface tension $\gamma = 1.7 \times 10^{-2}\,\mathrm {N}\,\mathrm {m}^{-1}$ and dynamic viscosity $\mu = 0.82 \times 10^{-3}$ Pa s) was $D_{0} = 2.16 \times 10^{-3}$ m. The resulting contact angle on the surface of the same type of hydrophilic glass substrate used for ethanol is approximately 2.98 $^{\circ }$. The splashing thresholds in terms of impact height and Weber number were $H = 0.20$ m and $ We = 335$, respectively. Thus, there was a splashing transition at $0.20\,\mathrm {m} \leq H \leq 0.22$ m or $335 \leq We \leq 411$. There are a total of 234 videos: 94 of splashing drops and 140 of non-splashing drops.
The colour maps of the reshaped matrices of  $\boldsymbol {w}_{{spl},z_0/D_0}$ of the FNN trained with combination 1 of 1 cSt silicone oil are presented in figure 12(a). The values of the elements in ${\boldsymbol w}_{{spl},z_0/D_0}$ are normalized by the maximum absolute values in ${\boldsymbol w}_{spl}$, and thus the BGR scale is from $-1.0$ to 1.0. Note that only the colour maps of combination 1 are shown, because those for the other combinations are similar. The morphological features shown in the figure are similar to those of the ${\boldsymbol w}_{{spl},z_0/D_0}$ trained using ethanol.
(a) Colour maps of the reshaped matrices of  ${\boldsymbol w}_{{spl},z_0/D_0}$ of the FNN when trained with combination 1 of 1 cSt silicone oil. The distributions were similar for the FNN when it was trained with other combinations. (b) Importance index $\beta _{z_0/D_0}$ versus normalized impact time $tU_0/D_0$ of all data combinations of 1 cSt silicone oil.

Denoted by  $\beta _{z_0/D_0}$, the importance index is plotted against $tU_0/D_0$ for the respective $z_0/D_0$ for all data combinations in figure 12(b). As can be seen, all data combinations have peak values at $tU_0/D_0 = 0.253$ and 0.392, corresponding to $z_0/D_0 = 0.750$ and 0.625. Upon reaching the peak, $\beta _{z_0/D_0}$ decreases until $tU_0/D_0 = 0.375$, corresponding to $z_0/D_0 = 0.375$. After that, $\beta _{z_0/D_0}$ increases until $tU_0/D_0 = 1.495$, corresponding to $z_0/D_0 = 0.125$, when it reaches a value as high as the peak values at $tU_0/D_0 = 0.253$ and 0.392. Such an increase is much higher than that shown in the analysis using an ethanol drop. A possible explanation for this is that 1 cSt silicone oil is less viscous, and thus has a lower $Re $ than ethanol. Although 1 cSt silicone oil ejects more secondary droplets than ethanol (Reference Thoroddsen, Takehara and EtohThoroddsen et al. 2012), the secondary droplets have higher velocity and smaller diameter than those by ethanol (Reference Riboux and GordilloRiboux & Gordillo 2015), making them more scattered and more difficult to be captured by the FNN. Thus, the FNN relies more on the lamella with asymptotic thickness to classify splashing and non-splashing drops of 1 cSt silicone oil.
3.5 Analysis using silicone oil of 5 cSt
The same analysis was performed using liquid drops of silicone oil of 5 cSt. The area-equivalent diameter of the drop of 5 cSt silicone oil (Shin-Etsu Chemical Co., Ltd.; density  $\rho = 912\,\mathrm {kg}\,\mathrm {m}^{-3}$, surface tension $\gamma = 2.0 \times 10^{-2}\,\mathrm {N}\,\mathrm {m}^{-1}$ and dynamic viscosity $\mu = 9.12 \times 10^{-3}$ Pa s) was $D_{0} = 2.22 \times 10^{-3}$ m. The resulting contact angle on the surface of the same type of hydrophilic glass substrate used for ethanol is approximately 3.13 $^{\circ }$. The splashing thresholds in terms of impact height and Weber number were $H = 0.16$ m and $ We = 300$, respectively. Note that all impacting drops with $H$ or $ We $ equal to or greater than the splashing threshold splash. Thus, there was no splashing transition for 5 cSt silicone oil. There are a total of 326 videos: 154 of splashing drops and 172 of non-splashing drops.
The colour maps of the reshaped matrices of  $\boldsymbol {w}_{{spl},z_0/D_0}$ of the FNN trained with combination 1 of 5 cSt silicone oil are presented in figure 13(a). The values of the elements in ${\boldsymbol w}_{{spl},z_0/D_0}$ are normalized by the maximum absolute values in ${\boldsymbol w}_{spl}$, and thus the BGR scale is from $-1.0$ to 1.0. Note that only the colour maps of combination 1 are shown, because those for the other combinations are similar. The morphological features of 5 cSt silicone oil show some similarities and some significant differences compared with those of the ${\boldsymbol w}_{{spl},z_0/D_0}$ trained using ethanol and 1 cSt silicone oil. They are similar in terms of the splashing features around the main body and the non-splashing features around the contact line and the lamella, but significantly different in terms of the splashing features around the lifted lamella and the ejected secondary droplets. For the splashing features distributed around the contour of the main body, they can be observed as early as $tU_0/D_0 = 0.111$, corresponding to $z_0/D_0 = 0.875$. These features can be observed until $tU_0/D_0 = 0.747$, corresponding to $z_0/D_0 = 0.375$, before they fade away. Such observation confirms that the high contour of the main body as a feature of a splashing drop is not limited to ethanol, but is also valid for 1 and 5 cSt silicone oils. For the non-splashing features around the contact line, they can be observed as early as $tU_0/D_0 = 0.111$. Similar to those of ethanol and 1 cSt silicone, they slowly develop into a lamella with asymptotic thickness at $tU_0/D_0 = 1.790$ corresponding to $z_0/D_0 = 0.125$. In terms of the splashing features around the lamella and the ejected secondary droplets, 5 cSt silicone oil is significantly different from ethanol and 1 cSt silicone oil. The splashing features around the lifted lamella of 5 cSt silicone oil only start to appear when $z_0/D_0 = 0.750$. This is later than those of ethanol and 1 cSt silicone oil, which start to appear when $z_0/D_0 = 0.875$. As time goes by, instead of becoming less obvious, like what happens in the case of ethanol and 1 cSt silicone oil, the splashing features around the lamella of 5 cSt silicone oil become more obvious with $tU_0/D_0$. Also, the splashing features of the ejected secondary droplets did not appear in the case of 5 cSt silicone oil. This can be explained by the higher viscosity of 5 cSt silicone oil, which leads to a smaller range of $Re $. Due to the smaller $Re $, the ejection time of the lamella of a splashing drop of 5 cSt silicone oil is later than that of the other two liquids (Reference Riboux and GordilloRiboux & Gordillo 2017), thus is not captured by the FNN when $z_0/D_0 = 0.875$. Also, the lamella has a thicker asymptotic film thickness (Reference Eggers, Fontelos, Josserand and ZaleskiEggers et al. 2010; Reference Lagubeau, Fontelos, Josserand, Maurel, Pagneux and PetitjeansLagubeau et al. 2012) and a smaller vertical velocity (Reference Riboux and GordilloRiboux & Gordillo 2015), thus the splashing features around the lamella of 5 cSt silicone oil become more obvious with $tU_0/D_0$ and accumulate near the solid surface. In terms of the ejected secondary droplets of 5 cSt silicone oil, although they have larger diameters than those of ethanol and 1 cSt silicone oil, the number of ejected droplets is less than the other two liquids (Reference Thoroddsen, Takehara and EtohThoroddsen et al. 2012). Consequently, the frame-by-frame inspection for the presence of secondary droplets in the videos of 5 cSt silicone oil by human eyes, in the opinion of the authors, is more difficult than the case of the other two liquids. Interestingly, the test accuracy of the FNN in classifying splashing and non-splashing drops of 5 cSt silicone oil is the highest: 100 % for all data combinations. This is because the FNN could easily classify the image sequences based on the splashing and non-splashing features around the lamella, while it is difficult for human eyes to intuitively perform classification based on the length of the lamella. This is why the morphological difference between the splashing and non-splashing drops of 5 cSt silicone is more obvious at a later $tU_0/D_0$.
(a) Colour maps of the reshaped matrices of  ${\boldsymbol w}_{{spl},z_0/D_0}$ of the FNN when trained with combination 1 of 5 cSt silicone oil. The distributions were similar for the FNN when it was trained with other combinations. (b) Importance index $\beta _{z_0/D_0}$ versus normalized impact time $tU_0/D_0$ of all data combinations of 5 cSt silicone oil.

Denoted by  $\beta _{z_0/D_0}$, the importance index is plotted against $tU_0/D_0$ for the respective $z_0/D_0$ for all data combinations in figure 13(b). As can be seen, the value of $\beta _{z_0/D_0}$ is lowest at $tU_0/D_0 = 0.111$ and increases with $tU_0/D_0$ until $tU_0/D_0 = 1.790$.
4. Conclusions and outlook
The morphological evolution of splashing and non-splashing drops during impact has been compared using an XAI. An FNN model has been developed as the XAI, comprising a single fully connected layer. After high classification accuracy had been attained, an analysis of the FNN's classification process was performed. Feature extraction revealed that the XAI distinguished splashing drops on the basis of a lifted lamella and a higher contour of the main body, while it identified non-splashing drops by a higher asymptotic film thickness of the lamella. An importance index has been introduced to quantify the contribution of the extracted splashing and non-splashing features to the classification of the XAI model. The results of this study show that for ethanol and 1 cSt silicone oil, the morphological differences between splashing and non-splashing drops are most pronounced when the impacting drop's apex decreases to 0.750 and 0.625 of the area-equivalent diameter. This shows that for ethanol and 1 cSt silicone oil, the splashing features are most pronounced at early impact times, rather than at later impact times, when they appear most pronounced to human eyes. However, the extracted features of 5 cSt silicone oil are more obvious at a later time when the lamella is more developed. This study has provided an example that clarifies the relationship between the complex morphological evolution of a splashing drop and physical parameters by interpreting the classification of an XAI video classifier.
Acknowledgements
The authors would like to thank Dr M. Kameda (Professor, Tokyo University of Agriculture and Technology) and Dr Y. Kurashina (Associate Professor, Tokyo University of Agriculture and Technology) for their valuable discussions and suggestions during the lab seminars. Also, J.Y. would like to express his gratitude to the Epson International Scholarship Foundation and the Rotary Yoneyama Memorial Foundation for their financial support during his PhD study when most of the work was performed.
Funding statement
This work was funded by the Japan Society for the Promotion of Science (Grant Nos. 20H00222, 20H00223, 20K20972, and 24H00289) and the Japan Science and Technology Agency PRESTO (Grant No. PRESTO JPMJPR21O5 SBIR JPMJST2355).
Declaration of interests
The authors declare no conflict of interest.
Author contributions
Conceptualization, J.Y., A.Y., and Y.T.; Data curation, J.Y., S.K., and Y.T.; Formal analysis, J.Y., S.K., and D.I.; Funding acquisition, Y.T.; Investigation, J.Y. and S.K.; Methodology, all authors; Project administration, J.Y.; Resources, Y.T.; Software, J.Y. and D.I.; Supervision, A.Y. and Y.T.; Validation, P., A.Y., and Y.T.; Visualization, J.Y.; Writing – original draft, J.Y.; Writing – review and editing, all authors.
Data availability
The data that support the findings of this study are available from the corresponding author, Y.T., upon reasonable request.
Appendix A. Wrongly classified data
The wrongly classified data are analysed. In figure 7, the test data of splashing drop of  $We = 382$ from combination 1 of ethanol drops are wrongly classified as non-splashing data. The image sequence of the wrongly classified test data and the colour map that shows the pixel-by-pixel multiplication of the image sequence and the weight matrix are shown in figure 14. Although the ejected secondary droplets of the drop in the image sequence can be easily detected and clearly identified as a splashing drop using the human eye, the ejected secondary droplets are too little and the contour of the drop is not high enough. As a result, many elements of the weight matrix with negative values are not cancelled out, and thus the value of $\boldsymbol {w}_{spl} \boldsymbol {\cdot } \boldsymbol {s}_{in}$ becomes smaller, $q_{{out, spl}}$ becomes less than zero and $y_{{pred, spl}}$ less than 0.5. Eventually, the FNN wrongly classifies it as a non-splashing drop.
(a) Image sequence of the test data of splashing drop of  $We = 382$ from combination 1 of ethanol drops. (b) Colour map that shows the pixel-by-pixel multiplication of the image sequence and the weight matrix.

Appendix B. Analysis of the classification process
To extract the features of the morphological evolution of splashing and non-splashing drops during the impact, and the importance index of the extracted features, it is necessary to analyse the classification process of the FNN. In (2.3), the two elements of the prediction values vector  $\boldsymbol {q}_{out}$ are the splashing prediction value $q_{{out, spl}}$ and the non-splashing prediction value $q_{\mathrm {out, nonspl}}$. Also, the weight matrix $\boldsymbol {W}$ can be decomposed into two row vectors $\boldsymbol {w}_{spl} \in \mathbb {R}^{M}$ and $\boldsymbol {w}_{nonspl} \in \mathbb {R}^{M}$, while the bias vector $\boldsymbol {b}$ can be decomposed into two elements $b_{spl}$ and $b_{nonspl}$. Hence, the elaborated form of (2.3) can be expressed as
 \begin{equation} \boldsymbol{q}_{out} = \begin{bmatrix} q_{{out, nonspl}}\\ q_{{out, spl}} \end{bmatrix} = \begin{bmatrix} \boldsymbol{w}_{nonspl} \boldsymbol{\cdot} \boldsymbol{s}_{in}\\ \boldsymbol{w}_{spl} \boldsymbol{\cdot} \boldsymbol{s}_{in} \end{bmatrix} + \begin{bmatrix} b_{nonspl}\\ b_{spl} \end{bmatrix}\approx \begin{bmatrix} \boldsymbol{w}_{nonspl} \boldsymbol{\cdot} \boldsymbol{s}_{in}\\ \boldsymbol{w}_{spl} \boldsymbol{\cdot} \boldsymbol{s}_{in} \end{bmatrix},\end{equation}
where  $\boldsymbol {s}_{in}$ is an image sequence flattened into a vector. The products $\boldsymbol {w}_{spl} \boldsymbol {\cdot } \boldsymbol {s}_{in}$ and $\boldsymbol {w}_{nonspl} \boldsymbol {\cdot } \boldsymbol {s}_{in}$ are given by
 $$\begin{gather} \boldsymbol{w}_{spl} \boldsymbol{\cdot} \boldsymbol{s}_{in} = w_{{spl},1}s_{{in},1} + w_{{spl},2}s_{{in},2} + \cdots + w_{{spl},M}s_{{in},M} = \sum_{i = 1}^{M} w_{{spl},i}s_{{in},i}, \end{gather}$$
 $$\begin{gather}\boldsymbol{w}_{nonspl} \boldsymbol{\cdot} \boldsymbol{s}_{in} = w_{{nonspl},1}s_{{in},1} + w_{{nonspl},2}s_{{in},2} + \cdots + w_{{nonspl},M}s_{{in},M} = \sum_{i = 1}^{M} w_{{nonspl},i}s_{{in},i}, \end{gather}$$
respectively, for  $M = N_{img} h_{img} w_{img}$. Here, $\boldsymbol {q}_{out} \approx \boldsymbol {W}\boldsymbol {s}_{in}$, because the elements of the trained $\boldsymbol {b}$ are negligible. Among the test image sequences of all data combinations of ethanol drops, the element of $\boldsymbol {q}_{out}$ with the smallest absolute value computed by the trained FNN is 0.0327. However, the elements of $\boldsymbol {b}$ are of the order of $10^{-4}$, which is much smaller than the element of $\boldsymbol {q}_{out}$ with the smallest absolute value.
Despite  $\boldsymbol {q}_{out}$ having two elements, an analysis based on either element is sufficient, because the absolute values of the two elements are approximately equal. In binary classification, the probabilities of both output classes should sum to one, which in this case means that $y_{{pred, spl}} + y_{{pred, nonspl}} \approx 1$, where the approximately equals sign is used to compensate for the truncation error. Owing to the use of the sigmoid function (see (2.4)), when $y_{{pred, spl}} + y_{\mathrm {pred, nonspl}} \approx 1$, the values of the two elements of $\boldsymbol {q}_{out}$ are approximately equal: $q_{{out, spl}} \approx - q_{{out, nonspl}}$.
For the analysis of  $q_{{out, spl}}$, the elements $w_{{spl},i}s_{{in},i}$ in (B.2) are grouped according to each frame:
 \begin{align} \boldsymbol{w}_{{spl},z_0/D_0} \boldsymbol{\cdot} \boldsymbol{s}_{{in},z_0/D_0} & = w_{{spl},z_0/D_0,1}s_{{in},z_0/D_0,1} + \cdots + w_{{spl},z_0/D_0,m}s_{{in},z_0/D_0,m} \nonumber\\ & = \sum_{i = 1}^{m} w_{{spl},z_0/D_0,i}s_{{in},z_0/D_0,i} , \end{align}
where  $\boldsymbol {s}_{{in},z_0/D_0} \in \mathbb {R}^{m}$ is a frame flattened into a vector, $\boldsymbol {w}_{{spl},z_0/D_0} \in \mathbb {R}^{m}$ is the vector that contains the elements of the splashing weight vector $\boldsymbol {w}_{spl}$ that corresponds to a frame and $m$
$m$  $(= h_{img}w_{img})$ is the total number of pixels in a frame. Thus, (B.2) can be expressed as
 \begin{align} \boldsymbol{w}_{spl} \boldsymbol{\cdot} \boldsymbol{s}_{in} & = \boldsymbol{w}_{{spl},z_0/D_0 = 0.875} \boldsymbol{\cdot} \boldsymbol{s}_{{in},z_0/D_0 = 0.875} + \cdots + \boldsymbol{w}_{{spl},z_0/D_0 = 0.125} \boldsymbol{\cdot} \boldsymbol{s}_{{in},z_0/D_0 = 0125} \nonumber\\ & = \sum_{i = 1}^{N_{img}}{\boldsymbol{w}_{{spl},z_0/D_0} \boldsymbol{\cdot} \boldsymbol{s}_{{in},z_0/D_0}} . \end{align}
Since  $q_{{out, spl}}\approx \boldsymbol {w}_{spl} \boldsymbol {\cdot } \boldsymbol {s}_{in}$, the value of $\boldsymbol {w}_{{spl},z_0/D_0} \boldsymbol {\cdot } \boldsymbol {s}_{{in},z_0/D_0}$ for each frame shows the respective contribution to the computation of $q_{{out,spl}}$. The morphological features and the importance index can be extracted using $\boldsymbol {w}_{{spl},z_0/D_0}$ and $\boldsymbol {w}_{{spl},z_0/D_0} \boldsymbol {\cdot } \boldsymbol {s}_{{in},z_0/D_0}$, respectively.
Appendix C. Contribution of splashing and non-splashing features
As mentioned in § 3.3, after reaching peak values at  $tU_0/D_0 = 0.238$ and 0.375, $\beta _{z_0/D_0}$ decreases until $tU_0/D_0 = 0.971$. However, $\beta _{z_0/D_0}$ slightly increases at $tU_0/D_0 = 1.473$, because the lamella of a non-splashing drop develops into a film thicker than that of a splashing drop, as mentioned in § 3.2. In particular, at $tU_0/D_0 = 1.473$, when $z_0/D_0$ decreases to 0.125, this difference in terms of the lamella is the most obvious and thus could easily be picked up by the FNN. To check this reasoning, the contributions of splashing and non-splashing features to the computation of $q_{{out,spl},z_0/D_0}$ were analysed. Since the negative values in a $\boldsymbol {w}_{{spl},z_0/D_0}$ vector correspond to the features of a splashing drop, the contribution of the splashing features can be computed by summing the products of the elements of $\boldsymbol {w}_{{spl},z_0/D_0}$ that have negative values with the corresponding pixel positions in an image. Similarly, the contribution of the non-splashing features can be computed by summing the products of the elements of $\boldsymbol {w}_{{spl},z_0/D_0}$ that have positive values with the corresponding pixel positions in an image. Thus, let $q_{{out,spl},z_0/D_0,{neg}}$ and $q_{{out,spl},z_0/D_0,{pos}}$ be the contributions of the splashing and non-splashing features, respectively, to $q_{{out,spl},z_0/D_0}$:
 \begin{equation} q_{{out,spl},z_0/D_0} = q_{{out,spl},z_0/D_0,{neg}} + q_{{out,spl},z_0/D_0,{pos}} . \end{equation}
 The values of the contribution of the splashing features  $q_{{out,spl},z_0/D_0,{neg}}$ are plotted against $q_{{out,spl}}$ of test image sequences of combination 1 of ethanol drops in figure 15(a). Only the plots for combination 1 are shown, because similar results were obtained for the other data combinations of ethanol drops. Similar to figure 11(a), least squares fitting is performed for each $z_0/D_0$ and shown by the dotted lines with the same colours as the respective markers. Denoted by $\beta _{neg}$, the slopes of the fitted lines are plotted against $tU_0/D_0$ for the respective $z_0/D_0$ for all data combinations of ethanol drops in figure 15(b). As can be seen, $\beta _{z_0/D_0}$ does not increase at $tU_0/D_0 = 1.473$.
(a) Contribution of the splashing features to  $q_{{out,spl},z_0/D_0}$ versus $q_{{out,spl}}$ of the test image sequences of combination 1 of ethanol drops. (b) Slopes of fitted lines $\beta _{neg}$ versus normalized impact time $tU_0/D_0$ of all data combination of ethanol drops.

The values of the contribution of non-splashing features  $q_{{out,spl},z_0/D_0,{pos}}$, which are obtained from (C.1), are plotted against $q_{{out,spl}}$ from test image sequences of combination 1 of ethanol drops in figure 16(a). Only the plots for combination 1 are shown, because similar results were obtained for the other data combinations of ethanol drops. Similar to figure 11(a), least squares fitting is performed for each $z_0/D_0$ and shown by the dotted lines with the same colours as the respective markers. Denoted by $\beta _{pos}$, the slopes of the fitted lines are plotted against $tU_0/D_0$ for the respective $z_0/D_0$ for all data combinations of ethanol drops in figure 16(b). As can be seen, the values have much smaller magnitudes than $\beta _{neg}$ and are negative except for $tU_0/D_0 = 1.473$. This indicates that the non-splashing features have less influence on the classification of the FNN than the splashing features. In addition, the values should not be negative, because this would reduce the classification accuracy.
(a) Contribution of the non-splashing features to  $q_{{out,spl},z_0/D_0}$ versus $q_{{out,spl}}$ from the test image sequences of combination 1 of ethanol drops. (b) Slopes of fitted lines $\beta _{pos}$ versus normalized impact time $tU_0/D_0$ of all data combinations of ethanol drops.

To explain this, the data markers in figure 16(a) are reproduced in figure 17(a), but this time with two separate least squares fits: one in the splashing regime where  $q_{{out,spl},z_0/D_0} \geq 0$ and the other in the non-splashing regime where $q_{{out,spl},z_0/D_0} < 0$. As can be seen from figure 17(a), in the non-splashing regime, along with the values of $q_{{out,spl}}$, the values of $q_{{out,spl},z_0/D_0}$ for all $z_0/D_0$ exhibit an increasing trend, where the slopes of all the fitted lines are positive. The values of the slopes $\beta _{{pos},{nonspl}}$ are plotted in figure 17(b), from which it can be seen that $\beta _{{pos},{nonspl}}$ exhibits an increasing trend along with $tU_0/D_0$ until reaching its maximum value at $tU_0/D_0 = 1.473$. This indicates that although they have less influence on the classification of the FNN than the splashing features, the influence of the non-splashing features increases with $tU_0/D_0$. As described in § 3.2, the main non-splashing feature is the evolution of the lamella of a non-splashing drop from a pre-ejected lamella at the contact line when $tU_0/D_0 = 0.110$ to a film with an asymptotic thickness when $tU_0/D_0 = 0.110$ (see figure 9). The findings here support the argument that the difference between splashing and non-splashing drops in terms of the lamella is greatest at $tU_0/D_0 = 1.473$, and thus could easily be picked up by the FNN. In fact, Reference Lagubeau, Fontelos, Josserand, Maurel, Pagneux and PetitjeansLagubeau et al. (2012) and Reference Eggers, Fontelos, Josserand and ZaleskiEggers et al. (2010) reported that the asymptotic film thickness scales with $Re ^{-2/5}D_0$, and thus the evolution of the lamella of a non-splashing drop is dominated by the viscous force acting on the drop, owing to its low impact velocity $U_0$. We argue that the value of the viscous force increases with $tU_0/D_0$ as the drop spreads over the surface. Since there are no data available to support our argument at the moment, we believe that it is important for future work to measure the viscous force that acts on a drop during impact.
(a) Contribution of the non-splashing features to  $q_{{out,spl},z_0/D_0}$ versus $q_{{out,spl}}$ from test image sequences of combination 1 of ethanol drops, plotted with two sets of fitted lines: one in the splashing regime where $q_{{out,spl},z_0/D_0} > 0$ and the other in the non-splashing regime where $q_{{out,spl},z_0/D_0} < 0$. (b) Slopes of the fitted lines in the non-splashing regime.

Note that the non-splashing and splashing regimes show different trends in figure 17(a). In the non-splashing regime, when a drop has a higher value of  $Re $, the asymptotic film thickness is small, as a consequence of which the drop exhibits fewer non-splashing features (i.e. there are fewer elements of $\boldsymbol {w}_{{spl},z_0/D_0}$ with positive values that would be cancelled out), which increases the value of $q_{{out,spl},z_0/D_0}$. However, in the splashing regime, along with the values of $q_{{out,spl}}$, the values of $q_{{out,spl},z_0/D_0}$ for all $z_0/D_0$ exhibit a decreasing trend, with the slopes of all the fitted lines being negative. This is because, in the splashing regime, the projected area of a splashing drop is larger owing to the ejected secondary droplets and the higher contour of the main body. Some of this increased area overlaps with the non-splashing features, and thus causes the values of $q_{{out,spl},z_0/D_0}$ to decrease.
Appendix D. Analysis using image sequences of ethanol drops with 22 frames
The results and discussion presented in § 3.3 are not affected by the number of frames and the choice of  $z_0/D_0$. This is validated by additional analysis performed on image sequences of ethanol drops with more frames, specifically 22 frames extracted when $z_0/D_0 = 0.120$–0.960 at an interval of 0.040.
The colour maps of the reshaped matrices of  $\boldsymbol {w}_{{spl},z_0/D_0}$ of the FNN trained with combination 1 of these image sequences of ethanol drops are presented in figure 18(a). The values of the elements in ${\boldsymbol w}_{{spl},z_0/D_0}$ are normalized by the maximum absolute values in ${\boldsymbol w}_{spl}$, and thus the BGR scale is from $-1.0$ to 1.0. Note that only the colour maps of combination 1 are shown, because those for the other combinations are similar. The morphological features shown in the figure are similar to those of the ${\boldsymbol w}_{{spl},z_0/D_0}$ trained using image sequences of seven frames.
(a) Colour maps of the reshaped matrices of  ${\boldsymbol w}_{{spl},z_0/D_0}$ of the FNN when trained with combination 1 of image sequences of ethanol drops of 22 frames. The distributions were similar for the FNN when trained with other combinations. (b) Importance index $\beta _{z_0/D_0}$ versus normalized impact time $tU_0/D_0$ of all data combinations of image sequences of ethanol drops of 22 frames.

The importance index for quantifying the contribution of each frame in an image sequence to the classification of the FNN, which is denoted by  $\beta _{z_0/D_0}$ is plotted against $tU_0/D_0$ for the respective $z_0/D_0$ for all data combinations in figure 18(b). As can be seen, all data combinations have peak values at $tU_0/D_0 = 0.306$, corresponding to $z_0/D_0 = 0.680$. Upon reaching the peak, $\beta _{z_0/D_0}$ decreases until $tU_0/D_0 = 0.996$ and 1.118, corresponding to $z_0/D_0 = 0.240$ and 0.200. After that, $\beta _{z_0/D_0}$ slightly increases until $tU_0/D_0 = 1.120$, corresponding to $z_0/D_0 = 0.120$. These results show the same trend as the analysis using the image sequences of ethanol drops of seven frames, and thus confirms that the analysis is not affected by the number of frames and the choice of $z_0/D_0$.


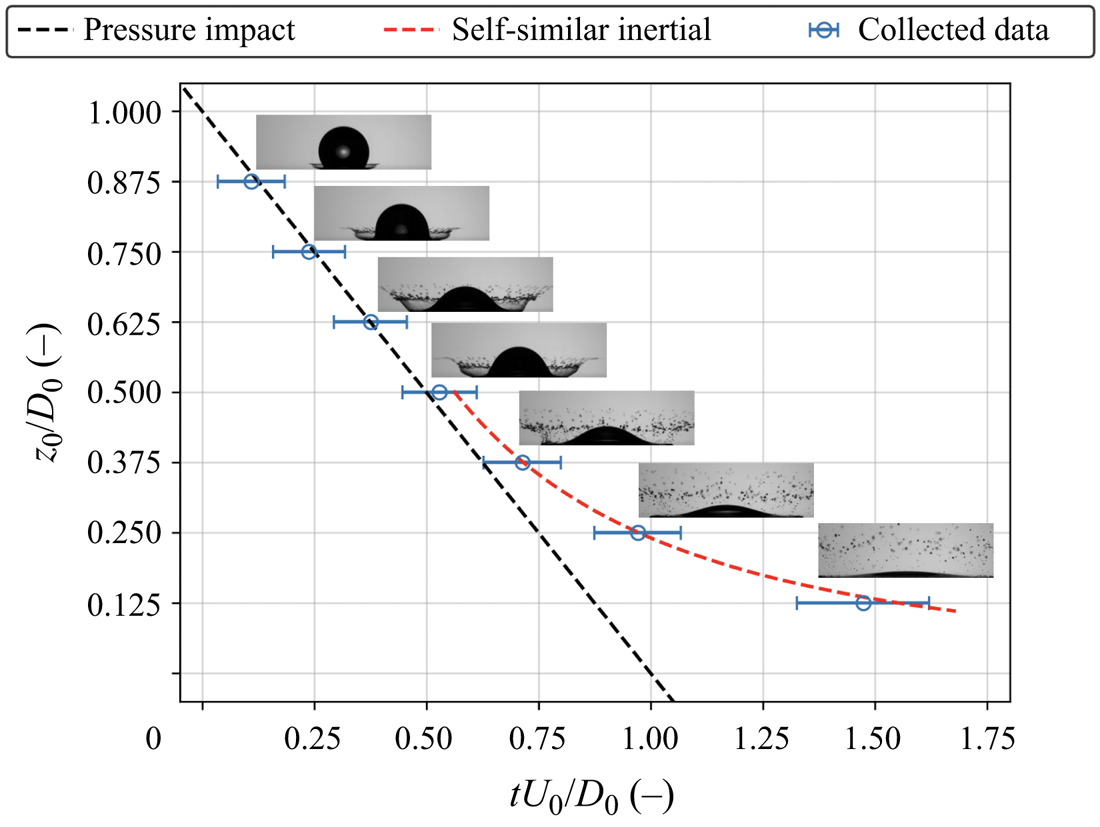


 Open access