

1. INTRODUCTION
Ice sheets are drained by rapidly-flowing ice streams with tributaries of intermediate velocity that extend up to hundreds of km into their interiors (Bamber and others, Reference Bamber, Vaughan and Joughin2000; Rignot and others, Reference Rignot, Mouginot and Scheuchl2011). Towards the margins of an ice sheet, ice streams can become channelled within fjords and are referred to as ‘outlet glaciers’ (cf. Bentley, Reference Bentley1987). The large size (approximately one to tens of km wide; ten to hundreds of km long) and high-surface velocity (greater than hundreds of metres per year) of ice streams means they are an important mechanism through which ice sheets lose mass and contribute to sea level, and much work has been focussed on elucidating the mechanisms that facilitate their rapid flow (reviews by Bentley, Reference Bentley1987; Clarke, Reference Clarke1987; Bennett, Reference Bennett2003). An equally important and related question is: what slows them down? Part of the answer to this question, may lie with the recent discovery of a hitherto unrecognised but regular pattern of basal shear stress beneath modern ice streams (Sergienko and Hindmarsh, Reference Sergienko and Hindmarsh2013; Sergienko and others, Reference Sergienko, Creyts and Hindmarsh2014). In this paper, we revisit some enigmatic bedforms on the now-exposed beds of palaeo-ice streams, which might be related to these phenomena and with the potential to provide additional insights regarding their formation.
Factors that increase basal shear stress are critically important because they can slow or even stop ice stream flow (Alley and others, Reference Alley, Anandakrishnan, Bentley and Lord1994; Clark and Stokes, Reference Clark and Stokes2001; Bougamont and others, Reference Bougamont, Tulaczyk and Joughin2003a, Reference Bougamont, Tulaczyk and Joughinb; Christoffersen and Tulaczyk, Reference Christoffersen and Tulaczyk2003a, Reference Christoffersen and Tulaczykb, Reference Christoffersen and Tulaczykc; Stokes and others, Reference Stokes, Clark, Lian and Tulaczyk2007). However, the distribution of basal shear stresses and how they evolve through space and time is difficult to elucidate. Alley (Reference Alley1993) pointed out that the resistance offered by the bed is unlikely to be uniform, and discussed several lines of evidence from West Antarctic ice streams that were suggestive of localised areas of higher basal shear stress, which he termed ‘sticky spots’. This evidence included ice surface rumples and crevassing (Vornberger and Whillans, Reference Vornberger and Whillans1986), spatially variable till thickness (e.g. Rooney and others, Reference Rooney, Blankenship, Alley and Bentley1987) and inversions of basal drag calculated from ice velocity, elevation and thickness data (e.g. MacAyeal, Reference MacAyeal1992). Alley (Reference Alley1993) argued that sticky spots might be caused by a number of factors, such as bedrock bumps penetrating a layer of till and protruding into the base of an ice stream (MacAyeal, Reference MacAyeal1992; MacAyeal and others, Reference MacAyeal, Bindschadler and Scambos1995), discontinuities in the subglacial till layer (Rooney and others, Reference Rooney, Blankenship, Alley and Bentley1987; Atre and Bentley, Reference Atre and Bentley1993; Smith, Reference Smith1997) and raised regions of an ice stream's surface, which influence subglacial water flow (Bindschadler and others, Reference Bindschadler, Stephenson, MacAyeal and Shabtaie1987). Indeed, areas of well drained till can act as sticky spots (Anandakrishnan and Alley, Reference Anandakrishnan and Alley1994; Ashmore and others, Reference Ashmore, Bingham, Hindmarsh, Corr and Joughin2014) and may be caused by diversion of subglacial water (Anandakrishnan and Alley, Reference Anandakrishnan and Alley1997) or by basal freeze-on (Bougamont and others, Reference Bougamont, Tulaczyk and Joughin2003a, Reference Bougamont, Tulaczyk and Joughinb; Christoffersen and Tulaczyk, Reference Christoffersen and Tulaczyk2003a, Reference Christoffersen and Tulaczykb). Several of these types of sticky spots have also been inferred from palaeo-ice stream beds (Clark and Stokes, Reference Clark and Stokes2001; Knight, Reference Knight2002; Christoffersen and Tulaczyk, Reference Christoffersen and Tulaczyk2003c; Piotrowski and others, Reference Piotrowski, Larsen and Junge2004; Stokes and others, Reference Stokes, Clark, Lian and Tulaczyk2007, Reference Stokes, Lian, Tulaczyk and Clark2008; Graham and others, Reference Graham2009; Trommelen and Ross, Reference Trommelen and Ross2014; Trommelen and others, Reference Trommelen, Ross and Ismail2014) but, in general, there is a paucity of data on their distribution and evolution under both modern and palaeo-ice streams (review by Stokes and others, Reference Stokes, Clark, Lian and Tulaczyk2007).
Recently, two papers highlight previously-unrecognised regular patterns of high basal shear stress (sticky spots) beneath a number of Antarctic and Greenlandic ice streams (Sergienko and Hindmarsh, Reference Sergienko and Hindmarsh2013; Sergienko and others, Reference Sergienko, Creyts and Hindmarsh2014). These studies utilised new high-resolution data on ice velocity, elevation and thickness to calculate basal shear stresses using standard inverse techniques based on control methods (MacAyeal, Reference MacAyeal1992). Although similar methods had shown alternating patches of a strong and weak bed beneath tributaries of the Siple Coast ice streams in West Antarctica (Joughin and others, Reference Joughin, MacAyeal and Tulaczyk2004), the increased resolution of these inversions, compared with previous efforts, clearly revealed the presence of regular ‘rib-like’ patterns of very high basal shear stress (typically ~200–300 kPa; Fig. 1) embedded within much larger areas of near-zero basal shear stress in regions, where ice was assumed to be sliding across the bed. Importantly, the rib-like patterns have a clear surface expression and are seen in the calculations of the driving dress, which is independent of the inversion technique, spatial resolution or its regularisation method.
(a) Inverted basal shear stress for Thwaites Glacier, West Antarctica (kPa), with ice flowing approximately right to left and x- and y-axis (km). (b) Observed ice surface speed (m a−1) with black patches showing rib-like patterns of basal shear stress >100 kPa and velocity vectors as grey arrows. Modified from Sergienko and Hindmarsh (Reference Sergienko and Hindmarsh2013).

Given the enigmatic nature of the features, they were informally referred to as ‘traction ribs’ by Sergienko and Hindmarsh (Reference Sergienko and Hindmarsh2013). They varied in size from several kilometres to tens of kilometres in length and a few kilometres wide, with the long axes aligned approximately transverse to ice flow, but often deviating by ~30°–60° from the ice flow direction (Sergienko and Hindmarsh, Reference Sergienko and Hindmarsh2013) (Fig. 1). Geometrical descriptions depend on the rib location, but these inversions of basal stresses show arcuate, generally transverse rib-like features, which are sometimes sinuous and show variations in width (b-axis: typically parallel to ice flow direction) along their length (a-axis: typically perpendicular (transverse) to ice flow direction). The basal patterns are thinner than, and oblique to, the broadly corresponding expressions on the ice-sheet surface. They were found to be widespread throughout areas of slow and fast flow, but they were most pronounced in arcuate patterns within the onset zone of ice streams (Sergienko and others, Reference Sergienko, Creyts and Hindmarsh2014).
It is not clear what causes these regular patterns in basal shear stress, but Sergienko and Hindmarsh (Reference Sergienko and Hindmarsh2013) noted the correspondence between the traction ribs and areas of high hydraulic gradient, and suggested that subglacial water may play a role in rib formation. They suggested that the ribs are likely to be regions of variable effective pressure that cause localised strengthening along the base. Subglacial water flow between the overlying ice and underlying bed allows water to transfer between strong and weak bedded areas. However, the poor resolution of geophysical data over large areas of the bed is unable to reveal whether the ribs have a topographic expression at the bed, and/or whether they are related to an underlying geological control, such as bedrock bumps or ridges (also Joughin and others, Reference Joughin, MacAyeal and Tulaczyk2004). Sergienko and Hindmarsh (Reference Sergienko and Hindmarsh2013) noted that their pattern, if not their dimensions, resembled subglacial bedforms observed on palaeo-ice sheet beds, such as the recently-discovered ‘mega-ribs’ (Fig. 2) reported by Greenwood and Kleman (Reference Greenwood and Kleman2010), and the far more ubiquitous ‘ribbed moraines’ (Fig. 3), which have a longer history of investigation (reviews by Hättestrand, Reference Hättestrand1997; Hättestrand and Kleman, Reference Hättestrand and Kleman1999; Dunlop and Clark, Reference Dunlop and Clark2006a). Despite their similarity in pattern, however, Sergienko and others noted that both ribbed moraines and mega-ribs occur at different scales to the traction ribs. Here we report observations of rib-like bedforms from previously-identified palaeo-ice stream beds in western Canada (Evans and others, Reference Evans, Lemmen and Rea1999, Reference Evans, Clark and Rea2008, Reference Evans2012, Reference Evans, Young and Ó Cofaigh2014; Evans, Reference Evans2000; Ross and other, Reference Ross, Campbell, Parent and Adams2009; Ó Cofaigh and others, Reference Ó Cofaigh, Evans and Smith2010) that appear to match both the pattern and dimension of the traction ribs and may therefore offer additional insights into their characteristics and formation.
Oblique view of Landsat image of mega-ribs discovered by Greenwood and Kleman (Reference Greenwood and Kleman2010) north of Dubawnt Lake, Nunavut Territory, Canada (location marked as a small circle on Fig. 4a). These ribs form a repetitive sequence (dashed outlines) of large, but low amplitude (5–10 m) ridges that are superimposed with smaller drumlins and mega-scale glacial lineations formed by the late-glacial Dubawnt Lake palaeo-ice stream (Stokes and Clark, Reference Stokes and Clark2003). Ice flow direction bottom right to top left. Reproduced from Greenwood and Kleman (Reference Greenwood and Kleman2010).

Ribbed moraines in the Lac Naococane region, central Quebec, Canada (location marked as a small square on Fig. 4a). Ice flow direction from top to bottom. Figure modified from Dunlop and Clark (Reference Dunlop and Clark2006b).

(a) The location of the study area (black rectangle) in relation to the extent of the North American Ice Sheet Complex at 21.4 ka (blue curve) and 10.2 ka (purple curve). The location of the features in Figure 2 (black circle) and Figure 3 (black square) are also shown. (b) Close-up of the study area showing previously-reported palaeo-ice stream tracks at the western and south-western margin of the Laurentide ice sheet drawn in blue (after Margold and others, Reference Margold, Stokes, Clark and Kleman2015a). The location of Figures 5, 7–12 are marked. Note that the palaeo-ice streams did not operate at the same time, which explains their cross-cutting relationship (e.g. see Ross and others, Reference Ross, Campbell, Parent and Adams2009; Ó Cofaigh and others, Reference Ó Cofaigh, Evans and Smith2010; and reviewed in Margold and others, Reference Margold, Stokes and Clark2015b). The dashed red curve in (b) is the boundary of the Canadian Shield.

Example of a cluster of low amplitude rib-like ridges generally aligned transverse to the ice stream flow direction (black arrow) on the Buffalo Ice Stream corridor (Ross and others, Reference Ross, Campbell, Parent and Adams2009), Saskatchewan (see also Fig. 7). These ridges are similar in scale and pattern to the traction ribs (Fig. 1) identified by Sergienko and Hindmarsh (Reference Sergienko and Hindmarsh2013) and Sergienko and others (Reference Sergienko, Creyts and Hindmarsh2014).
2. STUDY AREA AND PREVIOUS WORK
As part of a larger project to identify the location of palaeo-ice streams in the North American Laurentide ice sheet (Margold and others, Reference Margold, Stokes, Clark and Kleman2015a, Reference Margold, Stokes and Clarkb; Stokes and others, Reference Stokes, Margold, Clark and Tarasov2016), we reviewed the evidence for all previously hypothesised palaeo-ice streams, and searched for new ones by systematically inspecting a variety of satellite imagery and DEMs from both onshore and offshore areas. During this mapping, we found that several previously-identified ice stream beds in western Canada (Evans and others, Reference Evans, Lemmen and Rea1999, Reference Evans, Clark and Rea2008, Reference Evans, Young and Ó Cofaigh2014; Evans, Reference Evans2000; Ross and other, Reference Ross, Campbell, Parent and Adams2009; Ó Cofaigh and others, Reference Ó Cofaigh, Evans and Smith2010; Fig. 4) appear to be characterised by a topographic expression that bears close resemblance to the traction ribs reported by Sergienko and others. This topography is characterised by generally low-amplitude rib-like landforms that are generally aligned transverse to the ice stream flow direction (Fig. 5), but sometimes with obvious deviation.
This topographic expression has been noted in previous work and is usually described as a series of ‘large transverse ridges’ (Evans and others, Reference Evans, Lemmen and Rea1999, Reference Evans, Clark and Rea2008), ‘transverse bedforms’ (Beaney and Shaw, Reference Beaney and Shaw2000) or ‘ripple interference patterns’ (Ross and others, Reference Ross, Campbell, Parent and Adams2009). Given that ‘pristine’ thrust-block moraines are common throughout the study area in more distal locations on the ice stream tracks (i.e. as ice marginal landform assemblages), the features are most commonly interpreted to reflect overridden thrust-block moraines within the main ice stream trunks (Evans and others, Reference Evans, Lemmen and Rea1999, Reference Evans, Clark and Rea2008, Reference Evans, Young and Ó Cofaigh2014; Evans, Reference Evans2000). However, Beaney and Shaw (Reference Beaney and Shaw2000) invoked a more radical interpretation that they might represent giant ripples formed by standing waves in large subglacial meltwater flows. Furthermore, one unusual example from Manitoba, where the rib-like landforms are aligned much more parallel to ice flow direction, has been postulated to represent ‘glacial curvileations’ formed by longitudinal vortices in meltwater flow (Lesemann and others, Reference Lesemann, Piotrowski and Wysota2010).
Field evidence for glaciotectonic disturbance within the ridges, including folding of both sediment packages and bedrock, has been reported in a number of studies (Evans and others, Reference Evans, Lemmen and Rea1999, Reference Evans, Clark and Rea2008, Reference Evans, Young and Ó Cofaigh2014; Evans, Reference Evans2000). Evans and others (Reference Evans, Clark and Rea2008, Reference Evans, Young and Ó Cofaigh2014) also noted their preferential occurrence on the down-ice side of preglacial or buried valleys (i.e. on stoss slopes), which could also have induced glaciotectonism through compressive ice flow in these locations. Indeed, the low yield strength and high pore-water pressures of the weak Cretaceous bedrock that underlies much of the southern Interior Plains would have been particularly conducive to glaciotectonism (Evans and others, Reference Evans, Clark and Rea2008, Reference Evans, Young and Ó Cofaigh2014). Moreover, they tend to occur in areas classified as a blanket of glacial sediments, and most commonly occur in sediment thicknesses ranging from 0 to 50 m, but sometimes up to 200 m (Fig. 6). Evans and others (Reference Evans, Clark and Rea2008) also noted that glacial lineations (mega-flutings) can be seen emanating from the streamlined transverse ridges in several locations, providing further evidence for over-riding by fast-flowing ice.
Correspondence between the broad-scale location of mapped ribbed bedforms and (a) surficial geology, (b) bedrock geology and (c) till thickness. (a) Surficial geology from Geological Survey of Canada (2014). (b) Bedrock geology adapted from Garrity and Soller (Reference Garrity and Soller2009). (c) Drift thickness (m) adapted from Fenton and others (Reference Fenton, Schreiner, Nielsen, Pawlowicz, Mossop and Shetsen1994). Reconstructed ice stream tracks (after Margold and others, Reference Margold, Stokes, Clark and Kleman2015a) are drawn in white (locations on Fig. 4b) and the sites with mapped ribbed features are depicted in red ovals. The boundary of the Canadian Shield is marked by a dark red curve on the eastern edge of the figure in (c).

Despite previous work noting their occurrence, there has been limited systematic mapping of the landforms across the Interior Plains that might allow quantitative comparisons with ‘traction ribs’ under modern ice masses. Thus, we revisited sites where they had been previously reported (Evans and others, Reference Evans, Lemmen and Rea1999, Reference Evans, Clark and Rea2008, Reference Evans2012, Reference Evans, Young and Ó Cofaigh2014; Evans, Reference Evans2000; Ross and others, Reference Ross, Campbell, Parent and Adams2009; Ó Cofaigh and others, Reference Ó Cofaigh, Evans and Smith2010; Atkinson and others, Reference Atkinson, Utting and Pawley2014) and then surveyed the entire region of the southern Interior Plains (Fig. 4) to map their plan form and measure the morphology of the ridges.
3. METHODS
We searched a large area (Fig. 1b), but only identified rib-like bedforms on four different ice stream beds (Fig. 4b): (1) the Buffalo Ice Stream; (2) the Central Alberta Ice Stream, (3) the James Lobe and (4) the Red River Lobe. We used the Shuttle Radar Topography Mission (SRTM) Digital Elevation Data (SRTM, 2015) to identify and map the rib-like landforms. The DEM has a spatial resolution of one arc second and permitted the identification and mapping of the ridges with greater accuracy than other DEMs that we tested (including freely-available Canadian Digital Elevation Data and the ASTER GDEM). SRTM data tiles were displayed in ArcGIS and individual ridges (‘ribs’) were digitised as polygons around their break-of slope. We extracted the length (a-axis) of each ridge automatically using the ‘Minimum Bounding Geometry’ tool in ArcGIS and then used topographic profiles to measure their width, wavelength and amplitude at two sites where the ridges appear to be best-preserved and most closely resembling the scale and pattern of traction ribs from modern ice masses. We also measured the deviation of the long-axis of each ridge from the predominant ice flow direction, which is inferred from independent evidence such as nearby glacial lineations (drumlins and mega-scale glacial lineations) and lateral shear margin moraines. Indeed, in all cases, the ice streams appear to have formed distinct corridors characterised by smoothed terrain with sharp transitions to the adjacent landscape unaffected by fast ice flow, and this gives a good indication of the ice flow direction along the central axis of each ice stream (often with glacial lineations aligned parallel to the trough margins: cf. Evans and others, Reference Evans, Lemmen and Rea1999, Reference Evans, Clark and Rea2008, Reference Evans, Young and Ó Cofaigh2014; Evans, Reference Evans2000; Ross and other, Reference Ross, Campbell, Parent and Adams2009; Ó Cofaigh and others, Reference Ó Cofaigh, Evans and Smith2010; Margold and others, Reference Margold, Stokes, Clark and Kleman2015a). However, local variations in ice stream flow commonly occur within modern-day ice streams (i.e. convergence and divergence; Ng, Reference Ng2015) and these might, in places, introduce uncertainty in our estimates of how much the rib-like ridges deviate from ice flow direction. In addition, we acknowledge uncertainty due to the possibility of lateral migrations of the ice stream margins and changing ice flow configurations through time (Ross and others, Reference Ross, Campbell, Parent and Adams2009).
Using the GTOPO30 DEM, we also carried out a slope and aspect analysis of the sites where the ribbed landforms were mapped. This DEM has a spatial resolution of 30 arcsec (~1 km) and is thus more suitable for a broad-scale terrain analysis, filtering out higher topographic detail such as the ribs themselves. Analysis of slope and aspect were undertaken using in-built functions in ArcMap software. Note that these analyses did not take isostatic depression into account, but it is likely to have had a regional effect of overdeepening the study area (Fig. 4b) and causing steeper slopes towards the ice sheet's interior (towards the NW), rather than a localised effect on different ice stream beds.
We also obtained data on surficial geology (Geological Survey of Canada, 2014), drift thickness (Fenton and others, Reference Fenton, Schreiner, Nielsen, Pawlowicz, Mossop and Shetsen1994) and bedrock geology (Garrity and Soller, Reference Garrity and Soller2009), which we compared with the distribution of ridges (see Fig. 6).
4. RESULTS
In total, we mapped 1478 individual ridges (‘ribs’) in nine locations on four different ice stream beds. We now briefly describe the characteristics of the ridges in each setting and Tables 1, 2 detail their morphometric data. These rib-like landforms tend to be approximately transverse to the general direction of ice flow, but can show marked deviations. Their closed form ranges from nearly circular to elongate and some show a higher degree of sinuosity. Generally, they are longer than wide and their appearance resembles rib-like patterns. Thus, below, we use the non-genetic term ‘rib-like’ ridges to describe these features. This is also consistent with Sergienko and Hindmarsh (Reference Sergienko and Hindmarsh2013) and Sergienko and others (Reference Sergienko, Creyts and Hindmarsh2014)
Data on the measured length (a-axis) and the a-axis deviation from ice flow direction for the mapped ridges


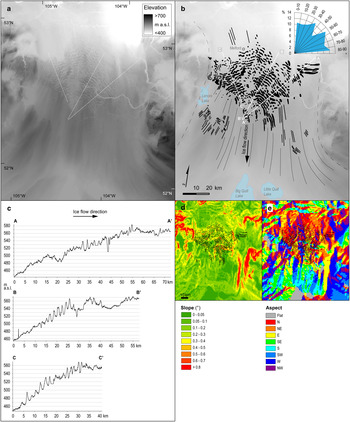
Some of the best-developed rib-like ridges (Figs 5, 7) occur in the upstream (northern) portion of the Buffalo Ice Stream (Ross and others, Reference Ross, Campbell, Parent and Adams2009; Margold and others, Reference Margold, Stokes, Clark and Kleman2015a, Reference Margold, Stokes and Clarkb). The ice stream track is characterised by a much smoother terrain than the surrounding landscape and the ridges are mostly clustered on an adverse slope (i.e. where the ice stream flowed uphill over relatively low slopes; Fig. 7d). In places, flow-aligned glacial lineations are seen upstream and downstream of the traction ribs and may exist beneath them, albeit with more uncertainty. In general, the ridges are aligned oblique to ice flow direction along the central axis of the ice stream, but can be seen to almost align with the ice flow direction and merge with the orientation of glacial lineations in some regions. Their mean length is 3134 m (n = 340) and their mean deviation from the general ice flow direction is 46°. Topographic transects across the ridges (Figs 7b, c) indicate a mean width of 1052 m, a mean wavelength (crest–crest spacing) of 1914 m and a mean height of 18 m.
(a) SRTM DEM of the upstream portion of the Buffalo Ice Stream corridor (ice stream flow from north to south: location shown on Fig. 4). (b) Mapped ridges (black polygons) and selected glacial lineations (black curves) showing ice stream flow direction, with dashed curves showing approximate location of ice stream lateral margins. The distribution of the ridge a-axis deviation from ice flow direction is also plotted. (c) Topographic profiles across the mapped ridges (location shown on (b)). Note that the profiles are not all draw along-flow, but are aligned to extract the b-axis (width) of each of the ridges. (d), (e) Ribbed features overlain on a slope and aspect map, respectively.
In the eastern branch of the Buffalo Ice Stream, a further set of ribbed landforms occurs in an identical topographic setting to the one described above: the ribs occur on an adverse slope, forming a pattern with a-axes oriented oblique to the ice flow direction (Figs 8a–d). At this site, the mean length of the ridges is 1837 m and their mean deviation from the ice flow direction is 28°. Further south on the Buffalo Ice Stream, a smaller number of ridges occur that are clustered on the stoss side of some slightly higher elevation areas (Figs 8e, f). Their mean length is 2089 m and their mean deviation from ice flow direction is 59°.
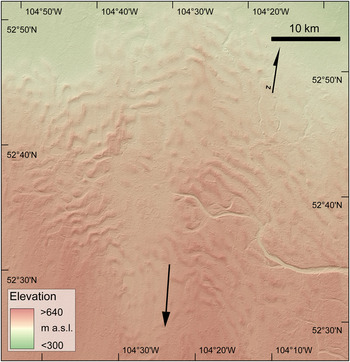
(a) SRTM DEM of the eastern branch of portion of the Buffalo Ice Stream corridor (ice stream flow from north to south: location shown on Fig. 4). (b) Mapped ribbed features (black shapes) and the deviation of ridge a-axis orientations from the ice flow direction. (c) SRTM DEM of the southern portion of the Buffalo Ice Stream corridor (ice stream flow from north-west to south-east; location shown on Fig. 4). (d) Mapped ribbed features (black shapes) and the deviation of ridge a-axis orientations from the ice flow direction. Note that the timing of incision of the large channels that cut across the area is not known (they host an under-sized modern stream), but they likely originate from the period of deglaciation and formed after the formation of the ridges. The location of the ribbed features in relation to slope and aspect are shown in (e-h).

Three zones of ridges are also mapped on the Central Alberta Ice Stream track (Evans, Reference Evans2000; Evans and others, Reference Evans, Clark and Rea2008, Reference Evans2012, Reference Evans, Young and Ó Cofaigh2014; Ross and others, Reference Ross, Campbell, Parent and Adams2009). Similar to the Buffalo Ice Stream corridor, a cluster of features is associated with the stoss side of an area of elevated terrain where the ice stream was forced to flow uphill (Figs 9a, b). There are fewer ridges in this region, but their lengths (mean = 2154 m) are comparable with the Buffalo Ice Stream, and they also deviate from ice stream flow to a similar extent (mean = 48°).
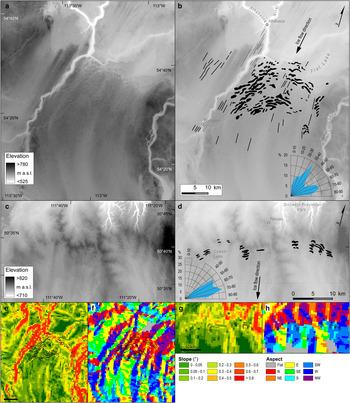
(a) SRTM DEM of the upstream portion of the Central Alberta Ice Stream (ice flow from north-east and then bends towards the south; location shown on Fig. 4). (b) Mapped ribbed features (black shapes) and selected glacial lineations (black lines), along with the distribution of traction ribs a-axis deviation from ice flow direction. (c) SRTM DEM of the downstream portion of the Central Alberta Ice Stream (ice flow from north to south; location shown on Fig. 4). (d) Mapped ribbed features (black shapes), along with the distribution of ridge a-axis deviation from ice flow direction. The location of the ribbed features in relation to slope and aspect are shown in (e–h).
Further downstream, 36 ridges are mapped. These are slightly shorter (mean: 1302 m) and aligned approximately perpendicular to ice stream flow direction (mean deviation: 67°) (Figs 9c, d). At the southernmost limit of the ice stream (Evans and others, Reference Evans, Clark and Rea2008), we map another series of ridges (n = 187) in the Milk River area (Fig. 10), close to the US-Canadian border (Fig. 4b). This location is not on a previously-hypothesised ice stream trunk, but is located directly downstream of the distal end of the Central Alberta Ice Stream and is likely to have been subjected to a period of fast ice flow during the maximum extent of the ice sheet in this region (Evans and others, Reference Evans, Clark and Rea2008). The ridges in this location are very similar to those elsewhere in the study area, with a mean length of 1960 and with a deviation of 61° from the ice stream flow direction. The data on width, wavelength and height averaged from three transects drawn approximately parallel to the ice flow direction and aligned with the b-axis of the landforms in this locality (means of 417, 920, and 11 m, respectively; Fig. 10c), indicate that the ribbed landforms here are generally smaller than the ribbed landforms measured in the upper portion of the Buffalo Ice Stream. As in other areas, the Milk River site displays a clear association between the ridges and an elevated area of the ice stream bed (Beaney and Shaw, Reference Beaney and Shaw2000), although they are not necessarily more prevalent on the stoss side in this location.
(a) SRTM DEM of the distal portions of the Central Alberta Ice Stream (Evans and others, Reference Evans, Clark and Rea2008) near the Milk River close to the US-Canadian border (ice flow from north-west to south-east: location shown on Fig. 4). (b) Mapped ribbed features (black shapes), along with the distribution of ridge a-axis deviation from ice flow direction. (c) Topographic profiles across the mapped pattern of ridges (location shown on (b)). (d), (e) Ribbed features overlain on a slope and aspect map, respectively. (f) Close-up of the ridges shown in (a).

The upstream portion of the James Lobe (Clayton and others, Reference Clayton, Teller and Attig1985; Clark, Reference Clark1992; Patterson, Reference Patterson1997; Ross and others, Reference Ross, Campbell, Parent and Adams2009) also contains a series of ridges (n = 96) on the stoss side of higher ground that crosses the ice stream track (Fig. 11), with a mean length of 2311 m, and a mean deviation from ice stream flow of 56°.
(a) SRTM DEM of the upstream portion of the James Lobe (ice flow approximately from north to south-east; location shown on Fig. 4). (b) Mapped ribbed features (black polygons) and selected glacial lineations (black lines), along with the distribution of ridge a-axis deviation from ice flow direction. Note that the glacial lineations in this case show that there may have been some subtle (up to 10°–20°) shift in flow direction. (c), (d) Ribbed features overlain on a slope and aspect map, respectively.

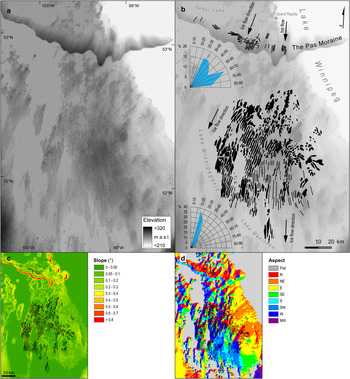
Finally, we map two clusters of rather different ridges in the Red River Lobe (Fig. 12). On the overridden Pas Moraine (Dyke and Dredge, Reference Dyke, Dredge and Fulton1989) are a small number (n = 38) of ridges that have a mean length of 3080 m and a mean deviation from ice stream flow of 52°. To the south lies a much larger cluster of longer ridges covering 6800 km2, with a mean length of 4764 m. Interestingly, these ridges (the longest we report) appear to be more closely aligned with the ice flow direction (although still oblique), with a mean deviation of only 20°. They have also been described as ‘glacial curvilineations’ (Lesemann and others, Reference Lesemann, Piotrowski and Wysota2010) and, while the general appearance resembles the features that we map elsewhere, their orientation with respect to ice flow direction is different in being much nearer to parallel. While this example is perhaps not as clear as the other examples, it is impossible to completely eliminate it without more detailed, site-specific information (e.g. field data). Furthermore, we note that ribs of a similar orientation are seen in the inversion from modern ice masses (e.g. see Bindschadler Ice Stream, West Antarctica: Fig. 2 in Sergienko and others, Reference Sergienko, Creyts and Hindmarsh2014).
(a) SRTM DEM of the upstream portion of the Red River Lobe (ice flow from north to south; location shown on Fig. 4). (b) Mapped ribbed features (black shapes), along with the distribution of ridge a-axis deviation from ice flow direction for the two areas. Note the digitate appearance of the Pas moraine (labelled) running west to east towards the top of the image. This moraine was overrun by a later readvance (Dyke and Dredge, Reference Dyke, Dredge and Fulton1989), which is likely, based on their superimposition, to have been at the time when the ridges formed. (c), (d) Ribbed features overlain on a slope and aspect map, respectively.
To summarise, we mapped 1478 individual ridges spread across nine locations that range in area from 150 to 6800 km2. Rib-like ridges are found in both upstream and downstream locations and typically occur in association with elevated areas of the ice stream bed and commonly (although not always) on adverse slopes with ridge a-axes aligned locally parallel to the slope contours. Their lengths, widths, amplitudes and wavelengths are similar (Fig. 13; Tables 1, 2); and they are typically found to deviate from ice flow direction between 45° and 70°, apart from one case (Fig. 12), in which they are more closely aligned.

5. DISCUSSION
5.1. Comparison between ‘traction ribs’ and rib-like ridges on palaeo-ice streams
Sergienko and Hindmarsh (Reference Sergienko and Hindmarsh2013) and Sergienko and others (Reference Sergienko, Creyts and Hindmarsh2014) noted the similarity in form and pattern between the ‘traction ribs’ they identified beneath modern ice streams and ribbed landforms that have been reported on palaeo-ice sheet beds. However, they also noted that the scale of the ‘traction ribs’ appeared to lie in between previously-reported landforms. The mega-ribs reported by Greenwood and Kleman (Reference Greenwood and Kleman2010) are typically longer (a-axes transverse to flow: 20–40 km) and wider (b-axes parallel to ice flow: 3–6 km) (Fig. 2), and their orientation is more consistently aligned perpendicular to the inferred direction of ice flow. Sergienko and Hindmarsh (Reference Sergienko and Hindmarsh2013) also noted that the relatively subdued amplitude of mega-ribs (reported as 5–10 m in Greenwood and Kleman, Reference Greenwood and Kleman2010) would be difficult to detect beneath thick ice. In contrast, although ribbed moraines appear in a variety of forms and patterns (Hättestrand and Kleman, Reference Hättestrand and Kleman1999; Dunlop and Clark, Reference Dunlop and Clark2006a; Trommelen and others, Reference Trommelen, Ross and Ismail2014), they are generally much smaller than the traction ribs reported by Sergienko and others, with typical lengths of hundreds of metres to a few kilometres, and widths of just a few hundred metres (Dunlop and Clark, Reference Dunlop and Clark2006a, Reference Dunlop and Clarkb) (Fig. 3). They are also spaced much closer together (of the order of a few hundred metres) and, again, their long axes are typically perpendicular to the inferred ice flow direction (Fig. 3), rather than oblique.
The ridges we report in this paper (Figs 5, 7–12) exhibit similar dimensions to those reported by Sergienko and Hindmarsh (Reference Sergienko and Hindmarsh2013). Their lengths (interquartile range: 1.2–3.6 km; Fig. 13) are slightly lower than the mean value of ~6 km reported by Sergienko and Hindmarsh (Reference Sergienko and Hindmarsh2013), but their mean widths (0.4–1 km) are much closer to the traction ribs under modern ice streams. Their wavelengths (~0.9–2 km; Fig. 13) are also similar to most of the patterns reported by Sergienko and others, but towards the lower end of their mean value of 6.5 km (Sergienko and Hindmarsh, Reference Sergienko and Hindmarsh2013). Unlike mega ribs and ribbed moraines, we also note that many of the ribbed features we mapped are aligned obliquely to ice flow direction at angles of ~20°–70° (Fig. 13) and mimic the arcuate patterns of ribs reported by Sergienko and others. Profiles across the ridges indicate that they have amplitudes of 10–19 m, which is higher than mega-ribs (Greenwood and Kleman, Reference Greenwood and Kleman2010), but slightly lower than the mean value for a large sample of ribbed moraines (17 m in Dunlop and Clark, Reference Dunlop and Clark2006a). Thus, the ridges we observe appear to represent an intermediate scale of ribbed landform that overlaps with the more extreme (larger) upper dimensions of ribbed moraine (Fig. 3) and the lower dimensions of mega-ribs (Fig. 2). This can be clearly seen when traction ribs are compared – at the same scale – with mega-ribs, ribbed moraine and the ridges we report in this paper (Fig. 14). We therefore suggest that the ridges we have mapped may be related to the ‘traction ribs’ identified from inverse methods on modern ice masses (Sergienko and Hindmarsh, Reference Sergienko and Hindmarsh2013; Sergienko and others, Reference Sergienko, Creyts and Hindmarsh2014). This is an unusual example of features inferred from beneath modern ice masses subsequently being identified on a palaeo-ice sheet bed (rather than the other way around).
Scale comparison of the similarity between ‘traction ribs’ and the ridges we report. (a) Ribbed moraines from the Lac Naococane region of Québec (Fig. 3); mapping from Dunlop and Clark (Reference Dunlop and Clark2006b). (b) Mega-ribs mapped by Greenwood and Kleman (Reference Greenwood and Kleman2010) in Keewatin (Fig. 2). (c) Areas of basal shear stress higher than 100 kPa (‘traction ribs’; also Fig. 1) modelled under the Petermann Glacier (Greenland) by Sergienko and others (Reference Sergienko, Creyts and Hindmarsh2014). (d) Ridges mapped in this study in the upstream part of the Buffalo Ice Stream corridor (Fig. 5). Ice flow directions are indicated by blue arrows. Note the similarity between (c) and (d).

5.2. Formation of ribbed features on ice stream beds
If the features we observe are related to the traction ribs from under modern ice masses, they may provide additional insight into their formation. Observations of both modern and palaeo-ice stream beds (e.g. King and others, Reference King, Hindmarsh and Stokes2009; Spagnolo and others, Reference Spagnolo2014) indicate that where till is present in sufficient thickness, it is usually shaped into a corrugated surface of highly elongated ridges and grooves that are aligned parallel, rather than oblique, to ice flow direction. Rib-like landforms have only rarely been reported on palaeo-ice stream beds and these have usually been much smaller ribbed moraines and have been interpreted to reflect higher basal shear stresses and/or ice stream sticky spots (Dyke and Morris, Reference Dyke and Morris1988; Stokes and others, Reference Stokes, Clark, Lian and Tulaczyk2007, Reference Stokes, Lian, Tulaczyk and Clark2008; Trommelen and Ross, Reference Trommelen and Ross2014). However, there is little consensus as to their precise mechanisms of formation. Some view ribbed moraines as polygenetic landforms with separate stages of development that might involve ice flow re-shaping pre-existing ridges, moraines, or even drumlins (e.g. Boulton, Reference Boulton, Menzies and Rose1987; Lundqvist, Reference Lundqvist1989, Reference Lundqvist1997; Möller, Reference Möller2006). Others have sought specific mechanisms that are not reliant on pre-existing ridges and these can be grouped into four main categories: (1) glaciotectonic shearing and stacking (e.g. Shaw, Reference Shaw1979; Aylsworth and Shilts, Reference Aylsworth and Shilts1989; Bouchard, Reference Bouchard1989); (2) fracturing and extension of frozen till sheets (Hättestrand, Reference Hättestrand1997; Hättestrand and Kleman, Reference Hättestrand and Kleman1999); (3) subglacial meltwater floods (Fisher and Shaw, Reference Fisher and Shaw1992; Beaney and Shaw, Reference Beaney and Shaw2000), and (4) an instability in the coupled flow of ice and till (Dunlop and others, Reference Dunlop, Clark and Hindmarsh2008; Chapwanya and others, Reference Chapwanya, Clark and Fowler2011).
As noted in Section 2, the rib-like features that we report have mostly been interpreted as overridden thrust-block moraines (Evans and others, Reference Evans, Lemmen and Rea1999, Reference Evans, Clark and Rea2008, Reference Evans, Young and Ó Cofaigh2014; Evans, Reference Evans2000), which involves overriding of pre-existing proglacial/submarginal moraines. This mechanism is similar to Bouchard's (Reference Bouchard1989) ‘shear and stack’ theory for ribbed moraines and is based on field evidence showing glaciotectonic disturbance within the ridges, including folding and thrusting of both sediment and bedrock (Evans and others, Reference Evans, Lemmen and Rea1999, Reference Evans, Clark and Rea2008, Reference Evans, Young and Ó Cofaigh2014; Evans, Reference Evans2000). It is also consistent with their preferential occurrence on the stoss side of higher elevation areas, which would have generated compressive flow at the ice stream bed (Figs 5, 7–12). Evans and others (Reference Evans, Clark and Rea2008) also noted how some of the ridges were concave in plan form (i.e. with their limbs pointing up-ice) and that this was consistent with them being overridden and deformed/displaced by ice stream activity, although we note that the limbs more commonly point down-ice in our larger sample.
A key question is whether the development of the ridges requires pre-emplacement of proglacial or submarginal moraines that are then overridden, or whether the mere presence of a deformable substrate is sufficient. Their regular wavelength (down-flow) and amplitude in many locations (e.g. Fig. 5), and the lack of any obvious asymmetry on individual ridges (Figs 7, 10) might imply some form of self-organised pattern that would not necessarily be expected from simply overriding moraines in proglacial or submarginal settings, or the fracturing of pre-existing frozen till sheets (Hättestrand, Reference Hättestrand1997; Hättestrand and Kleman, Reference Hättestrand and Kleman1999). It was partly for this reason that Beaney and Shaw (Reference Beaney and Shaw2000) likened the Milk River examples in southern Alberta (Fig. 10) to fluvial ripple forms, and speculated that the features were primarily erosional and formed by large subglacial meltwater floods. However, there is no independent evidence for large floods in either the palaeo- or modern-ice stream settings where the ribs are observed, and the volume of water required is deemed implausible (Clarke and others, Reference Clarke, Leverington, Teller, Dyke and Marshall2005).
In contrast, Dunlop and others (Reference Dunlop, Clark and Hindmarsh2008) suggested that ribbed features can be produced by a naturally-arising instability in the coupled flow of ice and till, which has been demonstrated in physically-based numerical modelling (e.g. Hindmarsh, Reference Hindmarsh1998a, Reference Hindmarshb, Reference Hindmarshc; Fowler, Reference Fowler, Maltman, Hambrey and Hubbard2000; Schoof, Reference Schoof2007; Chapwanya and others, Reference Chapwanya, Clark and Fowler2011). Significantly, Sergienko and Hindmarsh (Reference Sergienko and Hindmarsh2013) demonstrated that similar governing equations that form much smaller and closely-spaced ribbed moraines (Fig. 3) can also produce instabilities that resemble the patterns of traction ribs, for a plausible range of subglacial water and till mixtures. As such, they hypothesised that the basal traction ribs they observed under Pine Island and Thwaites Glaciers might arise from similar dynamic instabilities at the bed of these glaciers, leading to a pattern-forming process that arises from bed strength variations and spatial variations in effective pressure resulting from subglacial water transport. On this basis, traction ribs would only occur in regions where the bed is temperate and till deforms through shearing (Sergienko and Hindmarsh, Reference Sergienko and Hindmarsh2013). The appeal of this instability theory is that the transport of water can be highly variable over short distances leading to localised patches of ridges that we map and their various sizes, potentially including transitions into linear features that we observe as the subglacial water system evolves (Fowler and Chapwanya, Reference Fowler and Chapwanya2014). It is also clear that the growth of the ridges could lead to localised areas of higher effective pressure (cf. Sergienko and Hindmarsh, Reference Sergienko and Hindmarsh2013) that might then induce glaciotectonism (cf. Evans and others, Reference Evans, Lemmen and Rea1999, Reference Evans, Clark and Rea2008, Reference Evans, Young and Ó Cofaigh2014; Evans, Reference Evans2000), particularly on adverse slopes of the ice stream bed.
Related to the above, our slope and aspect analyses point to a tendency for the ribbed bedforms to cluster on adverse slopes where the ice streams flowed over pre-glacial valleys or drainage divides (also Evans and others, Reference Evans, Clark and Rea2008, Reference Evans, Young and Ó Cofaigh2014). Given that isostatic loading is not accounted for in our DEM analysis, all bed slopes would have been tipped toward the ice sheet interior (generally towards the north-west) and these adverse slopes would have been higher. Moreover, any subtle overdeepenings associated with these adverse slopes would have acted as subglacial dams, increasing water pressures by causing upstream pressures to rise (Hooke, Reference Hooke1991; Creyts and Clarke, Reference Creyts and Clarke2010). Depending on the level of connectivity along the adverse slope, effective pressures can turn slightly negative. This causes water to either hydraulically jack (Murray and Clarke, Reference Murray and Clarke1995) or fracture the ice/bed interface open (Tsai and Rice, Reference Tsai and Rice2010). Water then distributes across the bed until the pressure lowers. Water distribution across the bed helps create broad zones that are in a similar low-strength state that may help explain the lateral dimension of the rib-like features. This increased water pressure will weaken subglacial till, enhancing deformation and potentially leading to a wave like instability.
If overdeepenings are much steeper than the surface slope of the ice sheet by about a factor of two, then glaciohydraulic supercooling can cause ice formation in the subglacial water system (Röthlisberger and Lang, Reference Röthlisberger, Lang, Gurnell and Clark1987; Alley and others, Reference Alley, Lawson, Evenson, Strasser and Larson1998). While there is no definitive relationship between bed and surface slope in the areas where ribs are observed, it is likely that many overdeepened areas in our study area meet this slope criterion because ice stream surface slopes tend to be extremely low. The freezing constricts water flow and adds to the overpressure in the hydraulic system (Lawson and others, Reference Lawson1998; Roberts and others, Reference Roberts2002). Observations from numerous glaciers with glaciohydraulic supercooling show high-water pressures as well as high rates of sediment transport. Notably, the rate of change of sediment transport scales with the curvature of the bed (Creyts and others, Reference Creyts, Clarke and Church2013). Sediment will be deposited, where the bed has high-upward curvature, such as at the onset of overdeepenings. These sediments are then available to be moved up the adverse slope under shear from the overlying ice adding sediment that can be deformed and transported up the slope by the ice sheet.
Thus, we suggest that the two mechanisms, both the instability and glaciotectonism, are potentially linked, but we cautiously conclude that shear instabilities are most compatible with both the regular pattern of landforms that we observe and the patterns inferred from modern ice streams, where overridden moraines are unlikely given the duration of ice-sheet occupation.
5.3. Implications and future work
We suggest that there are three main implications of our observations of an intermediate scale of ribbed landforms that overlaps with and bridges the scale of landforms from ribbed moraines to mega-ribs. First and foremost, it implies that the patterns of basal shear stress calculated from control methods (Sergienko and Hindmarsh, Reference Sergienko and Hindmarsh2013; Sergienko and others, Reference Sergienko, Creyts and Hindmarsh2014) are consistent with a topographic expression seen on palaeo-ice stream beds. Second, our observations provides support for the notion of a subglacial ribbed continuum (Ely and others, Reference Ely2016) that extends from ribbed moraine (e.g. Hättestrand, Reference Hättestrand1997; Dunlop and Clark, Reference Dunlop and Clark2006a, Reference Dunlop and Clarkb; Trommelen and others, Reference Trommelen, Ross and Ismail2014), through to intermediate-scale ‘traction ribs’ (Sergienko and Hindmarsh, Reference Sergienko and Hindmarsh2013; Sergienko and others, Reference Sergienko, Creyts and Hindmarsh2014; this paper), and upward to the much larger mega-ribs (Greenwood and Kleman, Reference Greenwood and Kleman2010). The overlapping pattern and dimensions of these features suggests a continuum of ribbed bedforms of different sizes that could be genetically-related, and that different names need not imply different formative mechanisms (ribbed moraine, traction ribs, mega-ribs), although each, potentially, exhibits a different wave-length relative to ice thickness. A third important implication is that ribbed landforms are not necessarily associated with low ice velocities. While ribbed moraines are abundant on former ice-sheet beds and tend to occur in core areas, close to ice divides, where there may be changes in basal thermal regime (Hättestrand, Reference Hättestrand1997; Hättestrand and Kleman, Reference Hättestrand and Kleman1999; Kleman and Hättestrand, Reference Kleman and Hättestrand1999), the ribbed landforms we report here are typically associated with higher ice velocities, adverse slopes and the presence of warm-based ice. Coupled with observations from modern-ice streams (Sergienko and Hindmarsh, Reference Sergienko and Hindmarsh2013; Sergienko and others, Reference Sergienko, Creyts and Hindmarsh2014), this suggests that ribbed landforms can form localised patches of higher basal friction within fast-flowing sectors of ice sheets and that this may play an important role in modulating resistance in the interior of the ice stream and their total ice discharge (Sergienko and Hindmarsh, Reference Sergienko and Hindmarsh2013). A similar conclusion was reached by Trommelen and others (Reference Trommelen, Ross and Ismail2014) who suggested that ribbed moraines in Manitoba may be associated with increased bed stickiness, perhaps associated with dewatered subglacial sediments.
Given the apparent ubiquity of traction-ribs under modern ice masses (Sergienko and others, Reference Sergienko, Creyts and Hindmarsh2014), one might wonder why they have not been reported more widely from palaeo-ice sheet beds. One possibility is that they are common, but observational techniques have been unable to detect them. They clearly require DEMs of sufficient resolution. While previous workers using the 3 arcsec SRTM data had reported their existence in the southern Interior Plains (Evans and others, Reference Evans, Lemmen and Rea1999, Reference Evans, Clark and Rea2008, Reference Evans, Young and Ó Cofaigh2014; Evans, Reference Evans2000; Ross and other, Reference Ross, Campbell, Parent and Adams2009; Ó Cofaigh and others, Reference Ó Cofaigh, Evans and Smith2010), they did not map the detailed morphometry and pattern. The 1 arcsec SRTM data in this study has enabled more detailed mapping. Given that similar and higher resolution DEMs are now commonly used to map glacial geomorphology on palaeo-ice sheet beds (Hughes and others, Reference Hughes, Clark and Jordan2010; Dowling and others, Reference Dowling, Spagnolo and Möller2015), we suggest that observational techniques/bias might have allowed some features to remain undetected, but this is unlikely to explain their apparent scarcity.
Thus, another possibility is that they are actually quite rare and only generated in specific settings. Observations from the Interior Plains clearly show that their occurrence is patchy, which suggests that they require specific conditions to form that only exist in some regions of the ice-sheet bed. This occurrence is consistent with the notion that traction ribs should only occur in regions where the strength of a till that is sheared is determined by a subglacial water system (Sergienko and Hindmarsh, Reference Sergienko and Hindmarsh2013). However, post-glacial drainage can erode soft sediments so that they are not preserved. Moreover, if the traction ribs in Antarctica and Greenland (Sergienko and Hindmarsh, Reference Sergienko and Hindmarsh2013; Sergienko and others, Reference Sergienko, Creyts and Hindmarsh2014) are due as well (or sometimes instead) of transverse undulations in water pressure without coupling to till, this might also explain their relative scarcity in the topography of palaeo-ice sheet beds. Furthermore, they appear to require softer sedimentary bedrock and a sufficient till cover (Fig. 6), but large areas of the Laurentide and Eurasian ice sheet beds are dominated by crystalline bedrock. Related to this possible geological control, it might also be the case that even when they do form, they are only rarely preserved. Sergienko and Hindmarsh (Reference Sergienko and Hindmarsh2013) noted that the numerically modelled growth of the features is of the order of decades to centuries and that the basal resistance offered by traction ribs could change over these timescales in response to changes in ice sheet geometry or subglacial hydrology. Thus, there may be some process that acts to remove traction ribs from the ice-sheet bed prior to deglaciation and/or that they commonly transition into other landforms (such as glacial lineations; Ely and others, Reference Ely2016). It may be, for example, that many ridges are ‘drumlinised’ by late-glacial ice stream activity.
Clearly, future work could attempt to systematically search for and map traction ribs on palaeo-ice sheet beds to resolve some of these issues. In addition, it should be possible to detect them beneath modern ice masses using high-resolution geophysical techniques (e.g. radar; King and others, Reference King, Hindmarsh and Stokes2009). Detailed field investigation of the traction ribs reported in this paper may also be able to further constrain their mode of formation (e.g. geophysical surveys and sedimentological analyses) and examine the prevalence of glaciotectonism and whether it took place during or after ridge formation.
6. CONCLUSIONS
Recent work using standard inverse techniques has highlighted a previously-unrecognised pattern of basal shear stress beneath modern ice masses, particularly in areas of ice streaming (Sergienko and Hindmarsh, Reference Sergienko and Hindmarsh2013; Sergienko and others, Reference Sergienko, Creyts and Hindmarsh2014). These are characterised by regular rib-like patterns of very high basal shear stress (>200 kPa) embedded within much larger areas of near-zero basal shear stress in regions where ice was assumed to be sliding across the bed. They have been termed ‘traction ribs’ (Sergienko and Hindmarsh, Reference Sergienko and Hindmarsh2013) and their pattern resembles rib-like features observed on palaeo-ice sheet beds. However, they occur at a scale that is intermediate between smaller and more closely-spaced ribbed moraines and much larger mega-ribs (Greenwood and Kleman, Reference Greenwood and Kleman2010). Furthermore, it is not known whether they are caused by variations in topography that cause ‘stickiness’, or whether they are simply stickier areas within an otherwise flat bed, e.g. undulations in water pressure.
In this paper, we report observations of similar features from the now-exposed bed of the Laurentide ice sheet. We used DEMs to map >1000 rib-like features on four previously-identified palaeo-ice streams from the Interior Plains of Western Canada (Evans and others, Reference Evans, Lemmen and Rea1999, Reference Evans, Clark and Rea2008, Reference Evans, Young and Ó Cofaigh2014; Evans, Reference Evans2000; Ross and other, Reference Ross, Campbell, Parent and Adams2009; Ó Cofaigh and others, Reference Ó Cofaigh, Evans and Smith2010). Measurements of their length, width, spacing and amplitude indicate that they resemble the traction ribs inferred from beneath modern ice masses. We therefore suggest the traction ribs inferred from beneath modern-ice masses might have a topographic expression, and that their identification implies a continuum of ribbed landforms from smaller, closely spaced ribbed moraines, through traction ribs and up to the much larger mega-ribs (Ely and others, Reference Ely2016). To date, there is little consensus as to the mechanisms of formation of ribbed features in subglacial environments but our observations, coupled with those from modern ice masses, suggest that the instability theory (Dunlop and others, Reference Dunlop, Clark and Hindmarsh2008; Chapwanya and others, Reference Chapwanya, Clark and Fowler2011; Fowler and Chapwanya, Reference Fowler and Chapwanya2014) – invoking the growth of ribs as a result of a naturally-arising instability in the coupled flow of ice and till (and/or subglacial water) – is most compatible with their form and pattern, perhaps also involving glaciotectonic thrusting of subglacial material (Evans and others, Reference Evans, Lemmen and Rea1999, Reference Evans, Clark and Rea2008, Reference Evans, Young and Ó Cofaigh2014; Evans, Reference Evans2000).
ACKNOWLEDGEMENTS
This research was funded by a Natural Environment Research Council grant (NE/J00782X/1). We thank Martin Ross and Michelle Trommelen for their constructive reviews and the Scientific Editor, Neil Glasser and Editor-in-Chief, Jo Jacka. We also thank Dave Evans, Richard Hindmarsh and Olga Sergienko for useful discussions.


 Open access