

Over the last decade, attention to policing in the United States has taken center stage, peaking in the summer of 2020 with the police killing of George Floyd (Carney and Kelekay Reference Carney and Kelekay2022). With this has come a multitude of narratives seeking to “explain” police-civilian interactions. Here, we ask whether such narratives seeking to contextualize police killings can shift Americans’ attitudes or behaviors. While prior research demonstrates that exposure to different narratives, information, and frames can alter one’s opinions, attitudes, and behavior (Baumgartner, De Boef, and Boydstun Reference Baumgartner, Boef and Boydstun2008; Cappella and Jamieson Reference Cappella and Hall Jamieson1997; Chong and Druckman Reference Chong and Druckman2007 a, Reference Chong and Druckman2007 b; Druckman et al. Reference Druckman2011; Valentino, Beckmann, and Buhr Reference Valentino, Beckmann and Buhr2001), other work indicates that these effects might diminish when the public has been inundated with similar stories or if narratives have been polarized (Haynes, Merolla, and Ramakrishnan Reference Haynes, Merolla and Karthick Ramakrishnan2016).
Here, we seek to better understand whether divergent media narratives applied to an incident of police violence can shift Americans’ attitudes or behaviors—or whether such attitudes (and resulting behaviors) are too crystallized to change. We focus on two narratives that have been used in prominent newspapers over the last two decades when covering police killings. The first contextualizes police violence within a broader pattern of racial bias in policing. The second reports on a police killing with an emphasis on the dangers of being a police officer. These two narratives are not meant to be equivalents but instead reflective of the polarized stances—and associated narratives—on policing that persist in public opinion (Bonilla and Tillery, Reference Bonilla and Tillery2020; Cooper, Reference Cooper2020; Smith, Reference Smith2023). Empirically, we first establish that these media narratives exist with an overtime analysis of the presence of each narrative in seven newspapers from 2000 to 2024. We find evidence of the presence of both narratives, and that the systemic racism narrative is more prominent and has increased over time.
With the presence of such narratives documented, we then turn to an original YouGov experiment to evaluate their effectiveness. We randomly expose respondents to one of four narratives reporting on a police killing: the first contextualizes the violence in a broader pattern of racial bias, the second emphasizes the dangers of being a police officer, the third only reports on the police killing with no additional narrative, and the fourth is a control condition unrelated to a police killing. With this, we test whether narratives can shift public opinion about policing or a willingness to participate in politics. In this experiment, as well as in a replication, we find broad, null effects. Instead, respondents’ strongly held attitudes within the realm of policing persist in the face of receiving additional, more proximate narratives.
Lastly, to better understand the null results from this experiment, we turn toward a content analysis of open-ended responses from the respondents to the treatments. Here, we find that demographic and ideological factors—like race and partisanship—are more associated with the particular narratives that respondents adopt to explain an incident of police violence than the actual experimental narrative they were presented with. This indicates largely ossified perspectives on policing that are unlikely to shift in the face of different narratives or information.
Overall, these findings indicate that attitudes about policing are too strongly held to shift in the face of a single narrative. As such, it contributes to multiple literatures. First, it contributes to our understanding of how the public views and responds to police violence and particularly police killings, with prior studies focused more so on how the public directly responds to those killings (Boudreau, MacKenzie, and Simmons Reference Boudreau, MacKenzie and Simmons2019; Kaminski and Jefferis Reference Kaminski and Jefferis1998; Weitzer Reference Weitzer2002) and what characteristics of police-civilian interactions elicit different responses (Burch Reference Burch2023; Crabtree and Yadon Reference Crabtree and Yadon2024; Israel-Trummel and Streeter Reference Israel-Trummel and Streeter2022). Second, it contributes to our understanding of the limits of media narratives in our polarized era and for contentious political issues (Jerit and Barabas, Reference Jerit and Barabas2012; Haynes, Merolla, and Ramakrishnan, Reference Haynes, Merolla and Karthick Ramakrishnan2016; Peterson and Iyengar, Reference Peterson and Iyengar2021). Third, it expands our understanding of how the public responds to police violence by considering racial and ideological heterogeneity, while prior work has largely focused on the former (Israel-Trummel and Streeter, Reference Israel-Trummel and Streeter2022; Jefferson, Neuner, and Pasek, Reference Jefferson, Neuner and Pasek2020; Kaminski and Jefferis, Reference Kaminski and Jefferis1998). Lastly, it centers the role of race in modern American politics—and the understanding of how race structures systemic inequalities in our society (Alexander Reference Alexander2010; Hutchings and Valentino Reference Hutchings and Valentino2004; Omi and Winant Reference Omi and Winant2014).
Prior Research on the Impacts of Police Violence
A growing number of studies have examined the way that police violence affects individuals’ political attitudes and behavior. Studies have considered both the prevalence of violence in a given geographic area as well as the media coverage of police violence. Research examining the way that police violence affects political attitudes has often focused on differences in support for the police and/or for the government more broadly, while research on the way police violence affects political behavior has considered a wide variety of outcomes, including both voting and non-voting participation, as well as willingness to contact the police. Overall, studies on attitudes highlight that group membership, specifically racial identity, matters, while studies on behavior highlight that how we understand police contact shapes our responses. Below, we first review prior studies on the relationship between police violence and attitudes towards the police and then on relationships between police contact and political behavior.
Police Violence & Attitudes toward the Police
Unsurprisingly, when people learn about police violence, their support for the police tends to decrease (e.g., Boudreau, MacKenzie, and Simmons Reference Boudreau, MacKenzie and Simmons2019; Crabtree and Yadon Reference Crabtree and Yadon2024; Israel-Trummel and Streeter Reference Israel-Trummel and Streeter2022; Jefferson, Neuner, and Pasek Reference Jefferson, Neuner and Pasek2020; Kaminski and Jefferis Reference Kaminski and Jefferis1998; Weitzer, Reference Weitzer2002). This aligns with research demonstrating that negative contact with the police, when understood as unfair (Sunshine and Tyler Reference Sunshine and Tyler2003; Tyler, Reference Tyler2003), leads to lower evaluations of the police and a decline in trust in government (Lerman and Weaver, Reference Lerman and Weaver2014 a; Weaver and Lerman, Reference Weaver and Lerman2010). Within this broad trend, though, there is substantial variation based on group membership.
Often, the racial identity of the person receiving information about police violence matters in subsequent evaluations of the police. Americans from racially minoritized groups, and specifically Black Americans, are more likely to develop negative attitudes about the police, blame the police, and develop negative emotional reactions in response to incidents of police violence than their white counterparts (Kaminski and Jefferis Reference Kaminski and Jefferis1998; McGowen and Wylie Reference McGowen and Wylie2020; Mullinix, Bolsen, and Norris Reference Mullinix, Bolsen and Norris2020; Weitzer Reference Weitzer2002). Jefferson, Neuner, and Pasek (Reference Jefferson, Neuner and Pasek2020) add that it is not only racial identity but also prior beliefs of the police that shape how people will respond to police violence. This aligns with more general findings that demonstrate that Black Americans tend to have more negative views of the police than white Americans, reflecting the harsh targeting that their communities often receive (Gibson and Nelson Reference Gibson and Nelson2018; Hurwitz and Peffley Reference Hurwitz and Peffley2005; Weitzer and Tuch Reference Weitzer and Tuch2005).
Similarly, research has explored the extent to which victim race matters in shaping attitudes toward the police, with some mixed findings (Burch Reference Burch2023; Crabtree and Yadon Reference Crabtree and Yadon2024; Israel-Trummel and Streeter Reference Israel-Trummel and Streeter2022). Israel-Trummel and Streeter (Reference Israel-Trummel and Streeter2022) find that perceptions of the necessity of police violence do vary by identity of the victim. Respondents were more supportive of financial restitution when the victim was a white female and least supportive when the victim was a Black female—and these effects were largely driven by white respondents. However, Crabtree and Yadon (Reference Crabtree and Yadon2024) find that when white Americans read about police violence, their approval of the police decreases, and that this effect does not vary by identity of the victim.
While we do know that other ideological factors relate to police approval (Newman, Reny, and Merolla Reference Newman, Reny and Merolla2023; Sances Reference Sances2024; Russell and Garand Reference Russell and Garand2023; Vitro et al. Reference Vitro2022), it is unclear whether these attributes influence how people respond to incidents of police violence. Specifically, we know that Democrats approve of the police less than Republicans (Gaudette Reference Gaudette2024; Sances Reference Sances2024; Vitro et al. Reference Vitro2022). Similarly, white Americans with higher levels of racial resentment are more approving of the police (Newman, Reny, and Merolla Reference Newman, Reny and Merolla2023) and their use of force (Carter, Corra, and Jenks Reference Carter, Corra and Jenks2016). Finally, while Black Americans tend to express lower levels of approval of the police in general, linked fate significantly shapes their approval, whereby those with higher levels of linked fate are less approving than those with lower levels (Russell and Garand Reference Russell and Garand2023). While much of the literature has understandably focused on racial differences in responses to police violence, there are likely partisan and ideological factors that impact how individuals respond to learning about police violence as well. Here, we consider not only race, but also partisanship, racial resentment, and linked fate when evaluating the attitudinal and behavioral consequences of learning about an incident of police violence, as well as the associated media narrative.
Altogether, existing research suggests that exposure to police violence decreases evaluations of the police and government more broadly. Further, existing literature demonstrates that racial identity conditions this relationship and provides suggestive evidence that other individual characteristics, like partisanship or ideological attachments, may similarly condition how police violence affects the development of political attitudes.
Police Violence & Political Behavior
Not only does police violence often impact evaluations of the police, but it can also affect behaviors of individuals and communities. Areas with higher levels of police violence are associated with declines in political efficacy (Branton, Carey Jr., and Martinez-Ebers Reference Branton, Carey and Martinez-Ebers2023), strategically withdrawing to minimize contact with the police (Weaver, Prowse, and Piston Reference Weaver, Prowse and Piston2020), and a declining willingness to contact 911 when needed (Desmond, Papachristos, and Kirk Reference Desmond, Papachristos and Kirk2016 a; Drolc and Shoub Reference Drolc and Shoub2024). Though the extent to which political behavior is mobilized or demobilized depends on the type of behavior. Morris and Shoub (Reference Morris and Shoub2024) find that police killings are linked with increases in voter turnout, especially in Black neighborhoods and when there is more media attention to the incident (see also Ang and Tebes Reference Ang and Tebes2024).
These findings largely echo evidence about how contact with the police shapes behavior at the individual level. Direct, personal, and harsh contact with the police and carceral state leads to political demobilization, including declines in voting and other non-voting forms of participation (Lerman and Weaver, Reference Lerman and Weaver2014 a; Weaver and Lerman, Reference Weaver and Lerman2010). However, the type of contact matters. When that contact is light, like a traffic ticket, it can boost non-voting forms of participation among those with positive views of the police (often, white Americans) (Christiani and Shoub, Reference Christiani and Shoub2022). This indicates that the individuals’ expectations of the police significantly condition their response to light contact—when they expect positive interactions but receive a (light) negative interaction, they are motivated to participate, but when they expect negative interactions and receive a light negative interaction, there is no effect on participation (Christiani and Shoub Reference Christiani and Shoub2022). This points to the importance of cognitive understanding and expectations in shaping reactions to police contact.
Somewhat similarly, proximal contact can boost participation. Proximal contact occurs when an individual’s loved one (e.g., close friend or family) comes into contact with the police or carceral state. Proximal contact can lead to increased political participation outside the realm of voting (Walker Reference Walker2014; Reference Walker2019; Reference Walker2020; Walker and Garc a-Castañon Reference Walker and Garca-Castañon2017). The key causal mechanism in boosting participation after proximal contact is the way that the individual understands their loved one’s interaction with the police or carceral state. When people see harsh contact with the police as the result of systemic bias, they are more likely to participate in non-voting forms of politics. For Black Americans, seeing police contact as a manifestation of structural racism mobilizes political action (Walker Reference Walker2014; Reference Walker2019; Reference Walker2020; Walker and Garc a-Castañon Reference Walker and Garca-Castañon2017).
These findings indicate that the way that interactions with the police are understood shapes attitudes toward the police and a willingness to participate politically. When people perceive their interactions with the police as unfair, their evaluations of the police and their willingness to support or comply with the police decline (Sunshine and Tyler Reference Sunshine and Tyler2003; Tyler Reference Tyler2003; Reference Tyler2017). Similarly, when people understand their (or their proximal) interactions with the police as symptomatic of structural racism (Walker Reference Walker2019; Reference Walker2020), or when such negative interactions run counter to expectations for positive interactions (Christiani and Shoub Reference Christiani and Shoub2022), they are motivated to engage in the political process.
While much of this work has engaged actual contact with the police, rather than media narratives of contact, it nevertheless demonstrates the importance of individuals’ perception of police contact as vital in shaping attitudinal and behavioral outcomes. Perceiving an interaction as unfair, unexpectedly negative, or part of a larger system of racial bias is fundamental to shaping political attitudes and participation. Here, this is crucial, as the media might play a role in building those connections and informing those perceptions.
What Role Do Media Narratives Play?
Research on the way that police violence shapes attitudes has largely centered on examining what happens when someone learns about police violence directly. Here, we seek to understand whether shifting the media narrative used to discuss police violence can have an effect on individuals’ attitudes toward the police or their willingness to engage in politics. We focus on what we call media “narratives” as we are providing respondents with different information that contextualizes an incident of police violence, rather than just a different frame. While a frame may vary word changes or shift emphases, the different narratives that we provide give separate sets of background information.
On the one hand, we may expect that media narratives would have some effect. The way news stories are discussed, contextualized, and framed by the media matters for shaping public opinion about current events and, at times, mobilizing participation (Baumgartner, De Boef, and Boydstun Reference Baumgartner, Boef and Boydstun2008; Cappella and Jamieson Reference Cappella and Hall Jamieson1997; Chong and Druckman Reference Chong and Druckman2007 a; Reference Chong and Druckman2007 b; Druckman et al. Reference Druckman2011; Valentino, Beckmann, and Buhr Reference Valentino, Beckmann and Buhr2001). Haynes, Merolla, and Ramakrishnan (Reference Haynes, Merolla and Karthick Ramakrishnan2016) describe multiple ways that media can affect the public. First, particular media narratives can introduce new information, effectively inducing learning. Further, media narratives can prime particular issues and/or shift the weight given to considerations when evaluating a particular issue. Here, we are most interested in the first mechanism—how couching information about an incident of police violence within a broader narrative could shift attitudes or behavior by providing new information to the public. Indeed, as it relates to policing and police violence, we saw mass mobilization in 2020 after the police murder of George Floyd, driven more by the circulation of information in the media than by direct or proximal contact itself (Chenoweth et al. Reference Chenoweth2022).
While it is possible that introducing new information could affect the public, Haynes, Merolla, and Ramakrishnan (Reference Haynes, Merolla and Karthick Ramakrishnan2016) find that on the issue of immigration, media narratives do not have much of an effect, as attitudes about immigration are largely crystallized. Policing is similar to the issue of immigration in the sense that it is a highly charged and polarizing topic on which many hold strong beliefs (Phelps and Hamilton Reference Phelps and Hamilton2022; Smith, Reference Smith2023). Indeed, while it is true that the police murder of George Floyd mobilized political participation (Chenoweth et al. Reference Chenoweth2022), research has also demonstrated that any attitudinal effects dissipated quickly, as individuals returned to their baseline racial attitudes (Reny and Newman Reference Reny and Newman2021). Divergent attitudes on policing are often only further solidified by media consumption, as media sources increasingly polarize (Berry and Sobieraj Reference Berry and Sobieraj2014; Freelon and Wells Reference Freelon and Wells2020; Peck Reference Peck2019; Rhodes Reference Rhodes2022). Jefferson, Neuner, and Pasek (Reference Jefferson, Neuner and Pasek2020) find that White and Black Americans react markedly differently to news about police violence, in ways that confirm their prior expectations. On the whole, this set of research indicates that people seek out and consume news that confirms their prior beliefs, leading to increasingly ossified attitudes that are resistant to opposing narratives—suggesting that there may be no attitudinal or behavioral changes in response to media narratives.
Thus, this study is testing whether policing is a policy area in which media narratives could shape attitudes and behaviors or if it is one in which attitudes are too polarized to move. Even if it is the case that there is limited or no movement on political attitudes and planned engagement that results from media narratives about policing, such findings still have important implications. Organizations and elites devote time, energy, and resources toward attempting to shape media narratives in a way that will persuade the public. So, if we find evidence that this is not particularly fruitful in the area of policing, that is important, additional information that may shape where or how advocacy organizations direct their efforts.
Here, we seek to test whether how an incident of police violence is contextualized in the media affects individuals’ attitudes toward the police and/or their willingness to participate. To do so, we develop several hypotheses that anticipate a connection between media narratives and attitudinal and behavioral outcomes. These are enumerated in detail in the pre-registration in the appendix. To summarize these expectations, we hypothesize that when the incident of police violence is couched within a broader pattern of racial bias, attitudes toward the police may sour. But when it is presented alongside a discussion of how dangerous the profession of policing is, such evaluations may increase. Of course, attitudes toward the police are polarized by race, partisanship, and racial attitudes, as outlined above. White Americans, Republicans, and those with higher levels of racial resentment tend to report higher approval of the police at baseline (Gibson and Nelson Reference Gibson and Nelson2018; Newman, Reny, and Merolla Reference Newman, Reny and Merolla2023; Vitro et al. Reference Vitro2022). As a result, we anticipate that to the extent that media can have any effect on attitudes, such effects may vary by preexisting attitudes and identities.
When it comes to a willingness to participate in politics, we expect that understanding the incident as part of a larger system of oppression would lead to an increased willingness to participate, following the causal mechanism that Walker (Reference Walker2020) identifies for the way that proximal contact mobilizes participation. When police contact is seen as unjust and racist, Black Americans are mobilized to participate (Walker Reference Walker2020). This effect should be most prominent among Black respondents, as they experience and resist racial oppression (Walker Reference Walker2020). Further, it should be most pronounced among Black Americans with higher levels of linked fate, as these individuals see their own life as inextricably tied to the status of their racial group (Dawson Reference Dawson1995). Thus, within Black respondents, those with high levels of linked fate are probably most likely to respond to structural anti-Black racism with a desire to change the system. Lastly, this effect should also be more pronounced among Democrats, as these individuals are likely more willing to accept the fact that systemic racism exists (Zell and Lesick Reference Zell and Lesick2022) and to feel upset by an inegalitarian system (Jost, Federico, and Napier Reference Jost, Federico and Napier2009). We saw some of this during the 2020 racial justice protests in the wake of the police killing of George Floyd, as the protesters largely leaned Democratic (Chenoweth et al. Reference Chenoweth2022).
Conversely, we expect that a narrative emphasizing the dangers of being a police officer would mobilize those most sympathetic to such a notion—white respondents, especially those with higher levels of racial resentment, and Republicans (Keyes and Keyes Reference Keyes and Keyes2022; Newman, Reny, and Merolla Reference Newman, Reny and Merolla2023; Shanahan and Wall Reference Shanahan and Wall2021; Smith Reference Smith2023). This pro-police narrative has a long history of being used to subtly express racial animus in the United States (Keyes and Keyes Reference Keyes and Keyes2022; Newman, Reny, and Merolla Reference Newman, Reny and Merolla2023; Shanahan and Wall Reference Shanahan and Wall2021; Smith Reference Smith2023), and as a result, we think that the use of such a narrative would mobilize those with more hostile racial attitudes, which include white Americans and Republicans (Engelhardt Reference Engelhardt2021).
Evaluating the Presence of Policing Narratives in the Media
Before evaluating whether media narratives can shift attitudes or behavior related to policing, we theoretically identify and empirically measure the existence of two divergent media narratives: (1) that police violence is part of a larger system of racial oppression, or a systemic racism narrative; and (2) that policing is a dangerous career, such that at least the use of force might be justified to maintain the officer’s safety, or a “justified cop” narrative. These two narratives were chosen to reflect the polarized stances on policing that often emerge in the wake of high-profile police killings (Bonilla and Tillery Reference Bonilla and Tillery2020; Cooper Reference Cooper2020; Smith Reference Smith2023), rather than to reflect any sort of equivalency between the content of the narratives themselves. By establishing that both narratives are used, we can better establish the external validity of the designed experiment.
Various studies have examined narratives used by police departments, political entities, and the broader media to examine incidents of police violence (Arora, Phoenix, and Delshad Reference Arora, Phoenix and Delshad2019; Bonilla and Tillery Reference Bonilla and Tillery2020; Burch Reference Burch2022; Canevez, Karabelnik, and Winter Reference Canevez, Karabelnik and Winter2022; Gruenewald and Hipple Reference Gruenewald and Kroovand Hipple2021; Hirschfield and Simon Reference Hirschfield and Simon2010). Many of which identify some version of a systemic racism and/or justified officer narrative. Hirschfield and Simon (Reference Hirschfield and Simon2010) find in their analysis of news coverage between 1997 and 2000 that the dominant frame sought to legitimate police violence by casting officers as professionals and the civilians as threats. They did observe a shift, though, after the murder of Amadou Diallo in 1999, when coverage started to skew more toward emphasizing the role of systemic racism. Burch (Reference Burch2022)’s analysis of public statements by police chiefs, mayors, and prosecutors finds that the justification frame dominated—they sought to deny injury and blame victim behavior. Arora, Phoenix, and Delshad (Reference Arora, Phoenix and Delshad2019) identify both a pro-protester frame, grounded in the demand for police accountability, and a pro-police frame, justifying police actions. Most recently, Canevez, Karabelnik, and Winter (Reference Canevez, Karabelnik and Winter2022) find that in the wake of George Floyd’s murder in 2020, the dominant narrative used in YouTube comments was a pro-accountability, emphasizing the brutality and systemic nature of the violence.
We seek to identify two narratives that have been present in media coverage of police violence over time to establish that they exist before getting to the experimental employment of these narratives. In other words, we are seeking some external validity around using these two narratives. The main purpose here is not a comprehensive counting of the exact prevalence of each narrative. Instead, we hope to just demonstrate that these narratives have existed over time in media coverage of police violence.
The first media narrative focuses on the way that police violence is part of a larger system of racial oppression. This narrative comes out of a push to call attention to the way that racism and anti-Blackness, in particular, result in police violence (among many other negative social outcomes). It focuses on structural, rather than individual, conceptions of racism (Bonilla and Tillery Reference Bonilla and Tillery2020; Bunyasi and Smith Reference Bunyasi and Watts Smith2019; Smith Reference Smith2023) and has been characteristic of anti-racist movements, like the Civil Rights Movement and the contemporary Movement for Black Lives (Smith Reference Smith2023).
The second, divergent narrative that we examine downplays police violence, situating it as an unfortunate but justified outcome given the dangers of being a police officer. This narrative is often used to justify police killings, blame victims rather than the police, and center the police officers themselves (Cooper Reference Cooper2020; Hawkins Reference Hawkins2020; Newman, Reny, and Merolla Reference Newman, Reny and Merolla2023). This kind of pro-police counter-narrative has a long history of being used to subtly express racial animus in the United States (Keyes and Keyes Reference Keyes and Keyes2022; Newman, Reny, and Merolla Reference Newman, Reny and Merolla2023; Shanahan and Wall Reference Shanahan and Wall2021; Smith Reference Smith2023).
With these two narratives conceptualized, we turn toward measuring their presence in the media. To do so, we utilize ProQuest and its TDM Studio to search for these two narratives in media from 2000 through 2024.Footnote 1 Following Rose and Baumgartner (Reference Rose and Baumgartner2013), we narrow our search to the following publications: the Baltimore Sun, the Chicago Tribune, the Los Angeles Times, the New York Times, and the Washington Post. We also include the Atlanta Journal-Constitution and the Wall Street Journal to broaden our reach. We then further narrowed our returns to those that ProQuest also identified and tagged as being about policing based on the subject terms applied by ProQuest. For more on this, see the appendix. Finally, the searches return a number of duplicated articles for each publication, so we deduplicate based on article title. In total, we identify 2169 articles, of which 470 articles report on police violence with a bend toward emphasizing the dangers of being a police officer (the justified cop narrative), 1400 articles report on police violence with a bend toward emphasizing systemic racism, and 299 articles use both narratives.Footnote 2
We first track the total number of articles over time in Figure 1. We find two large spikes in media coverage between 2014 and 2016 and between 2020 and 2021. The first aligns with the deaths of Michael Brown and Eric Garner—and the ensuing national protests against and conversations around police violence and racial disparities in policing, which were some of the first after the creation of the Black Lives Matter movement. The second spike aligns with the murder of George Floyd and the death of Breonna Taylor and again the ensuing international protests against and conversations around police violence, racial disparities, and legacies of slavery and Jim Crow in the United States. These spikes—and the conversations they brought forth and centered—are also reflected in much more coverage with either the systemic narrative or both narratives rather than the justified narrative during these years.
Number of articles over time.

We find that, over time, articles are more likely to use terms associated with the systemic narrative than those with the justified narrative. Figure 2 shows that systemic narratives make up the majority of all articles in all years under study except 2004, where there are more justified narratives. Meanwhile, justified narratives make up between 0% and 55% of articles, while both narratives are present in 0%–24% of articles. In general, justified narratives are more prevalent than articles with both narratives. In only four years do articles with both narratives outpace those with justified narratives. Taken as a whole, we see evidence of both narratives in articles in major newspapers when covering police killings over the past quarter century.
Proportion of articles over time.

Data and Design
To evaluate whether these divergent narratives shape attitudes or behavior, we designed a preregistered survey experiment.Footnote 3 We contracted with YouGov to field the survey on a sample of 1,000 respondents—500 white respondents and 500 Black respondents, as we hypothesized racial differences. Within racial groups, these respondents were recruited to match national distributions on gender, age, race, and education. The survey was fielded in May of 2022.
Respondents first answered a series of pre-treatment demographic and attitudinal questions. Then, they were told, “On the next page, you will be asked to read a news article and answer a few questions.” Respondents were randomly exposed to one of four fabricated news articles, written to mimic common media narratives surrounding police violence. Screenshots of the headlines and first 1–3 sentences of each story are shown in Figure 3 (see appendix for full text).
Snapshots of each experimental condition.
Note: The titles, bylines, dates, and start of each story in each condition are shown here. Due to space constraints the full story in each condition is not included. For the full text, please see the appendix. The first heading is the control, the second is the “no narrative” condition, the third is the “systemic racism” condition, and the fourth is the “justified cop” condition.

In the control condition, respondents read an article unrelated to policing or race; instead, it discussed a hometown Olympic athlete. In the “no narrative” condition, respondents read an article about a supposed recent incident of police violence (a murder of a Black man), but there was no narrative associated with the article—it simply reported on the incident. Then the “systemic racism” condition contained everything in the “no narrative” condition but prefaced it by explaining how this incident relates to other forms of racism that are systemic throughout society, as seen in the snippet in Figure 3. Finally, the “justified cop” condition was similarly built on the “no narrative” condition but was prefaced with an explanation about how it relates to policing being a dangerous profession, as seen in the snippet in Figure 3. Both of the two treatment conditions foregrounded references to research on the topic and then contextualized the recent incident in that research. The full text of each experimental condition is reported in the appendix.
After reading the article, respondents were asked, “What is your reaction to this article? How did it make you feel? What did it make you think about? Please write 1-3 sentences.” Then, participants responded to the key dependent variables: (a) attitudes about the police and (b) plans to engage in political participation. Each of the behavioral questions is borrowed or adapted from prior work on police contact, police killings, and political attitudes and behavior.Footnote 4 These items, asked in the following order, read:
• We’re interested in your engagement with your local police department. In the next year, how likely are you to…?
- Contact your local police department if you need help.Footnote 5
- Sign a petition in support of your local police department.
- Sign a petition in support of Black Lives Matter.
• In general, do you approve of the job that the police are doing in this country?” (5-point scale, which is re-scaled to run from 0 to 1.)
• How likely are you to vote in the next election? (5-point scale, which is re-scaled to run from 0 to 1.)Footnote 6
• In the next year, how likely are you to…?” (Order randomized, 5-point scale, which is re-scaled to run from 0 to 1.)Footnote 7
- Work for a candidate or campaign
- Donate money to a candidate, campaign, or political organization
- Participate in a protest
- Volunteer for a community group or nonprofit organization
- Sign a petition
- Attend a political meeting or town hall
- Contact a public official
To simplify the interpretation of the results, a scale of planned participation was constructed.Footnote 8 If the respondent indicated that they were “very” or “somewhat” likely to engage in one of these actions, that was coded as a 1.Footnote 9 Then, all items were added together, resulting in a 7-point scale that we rescaled to 0–1. Finally, respondents ended by answering a final set of demographic items and were debriefed about the experiment.
Were framing effects observed?
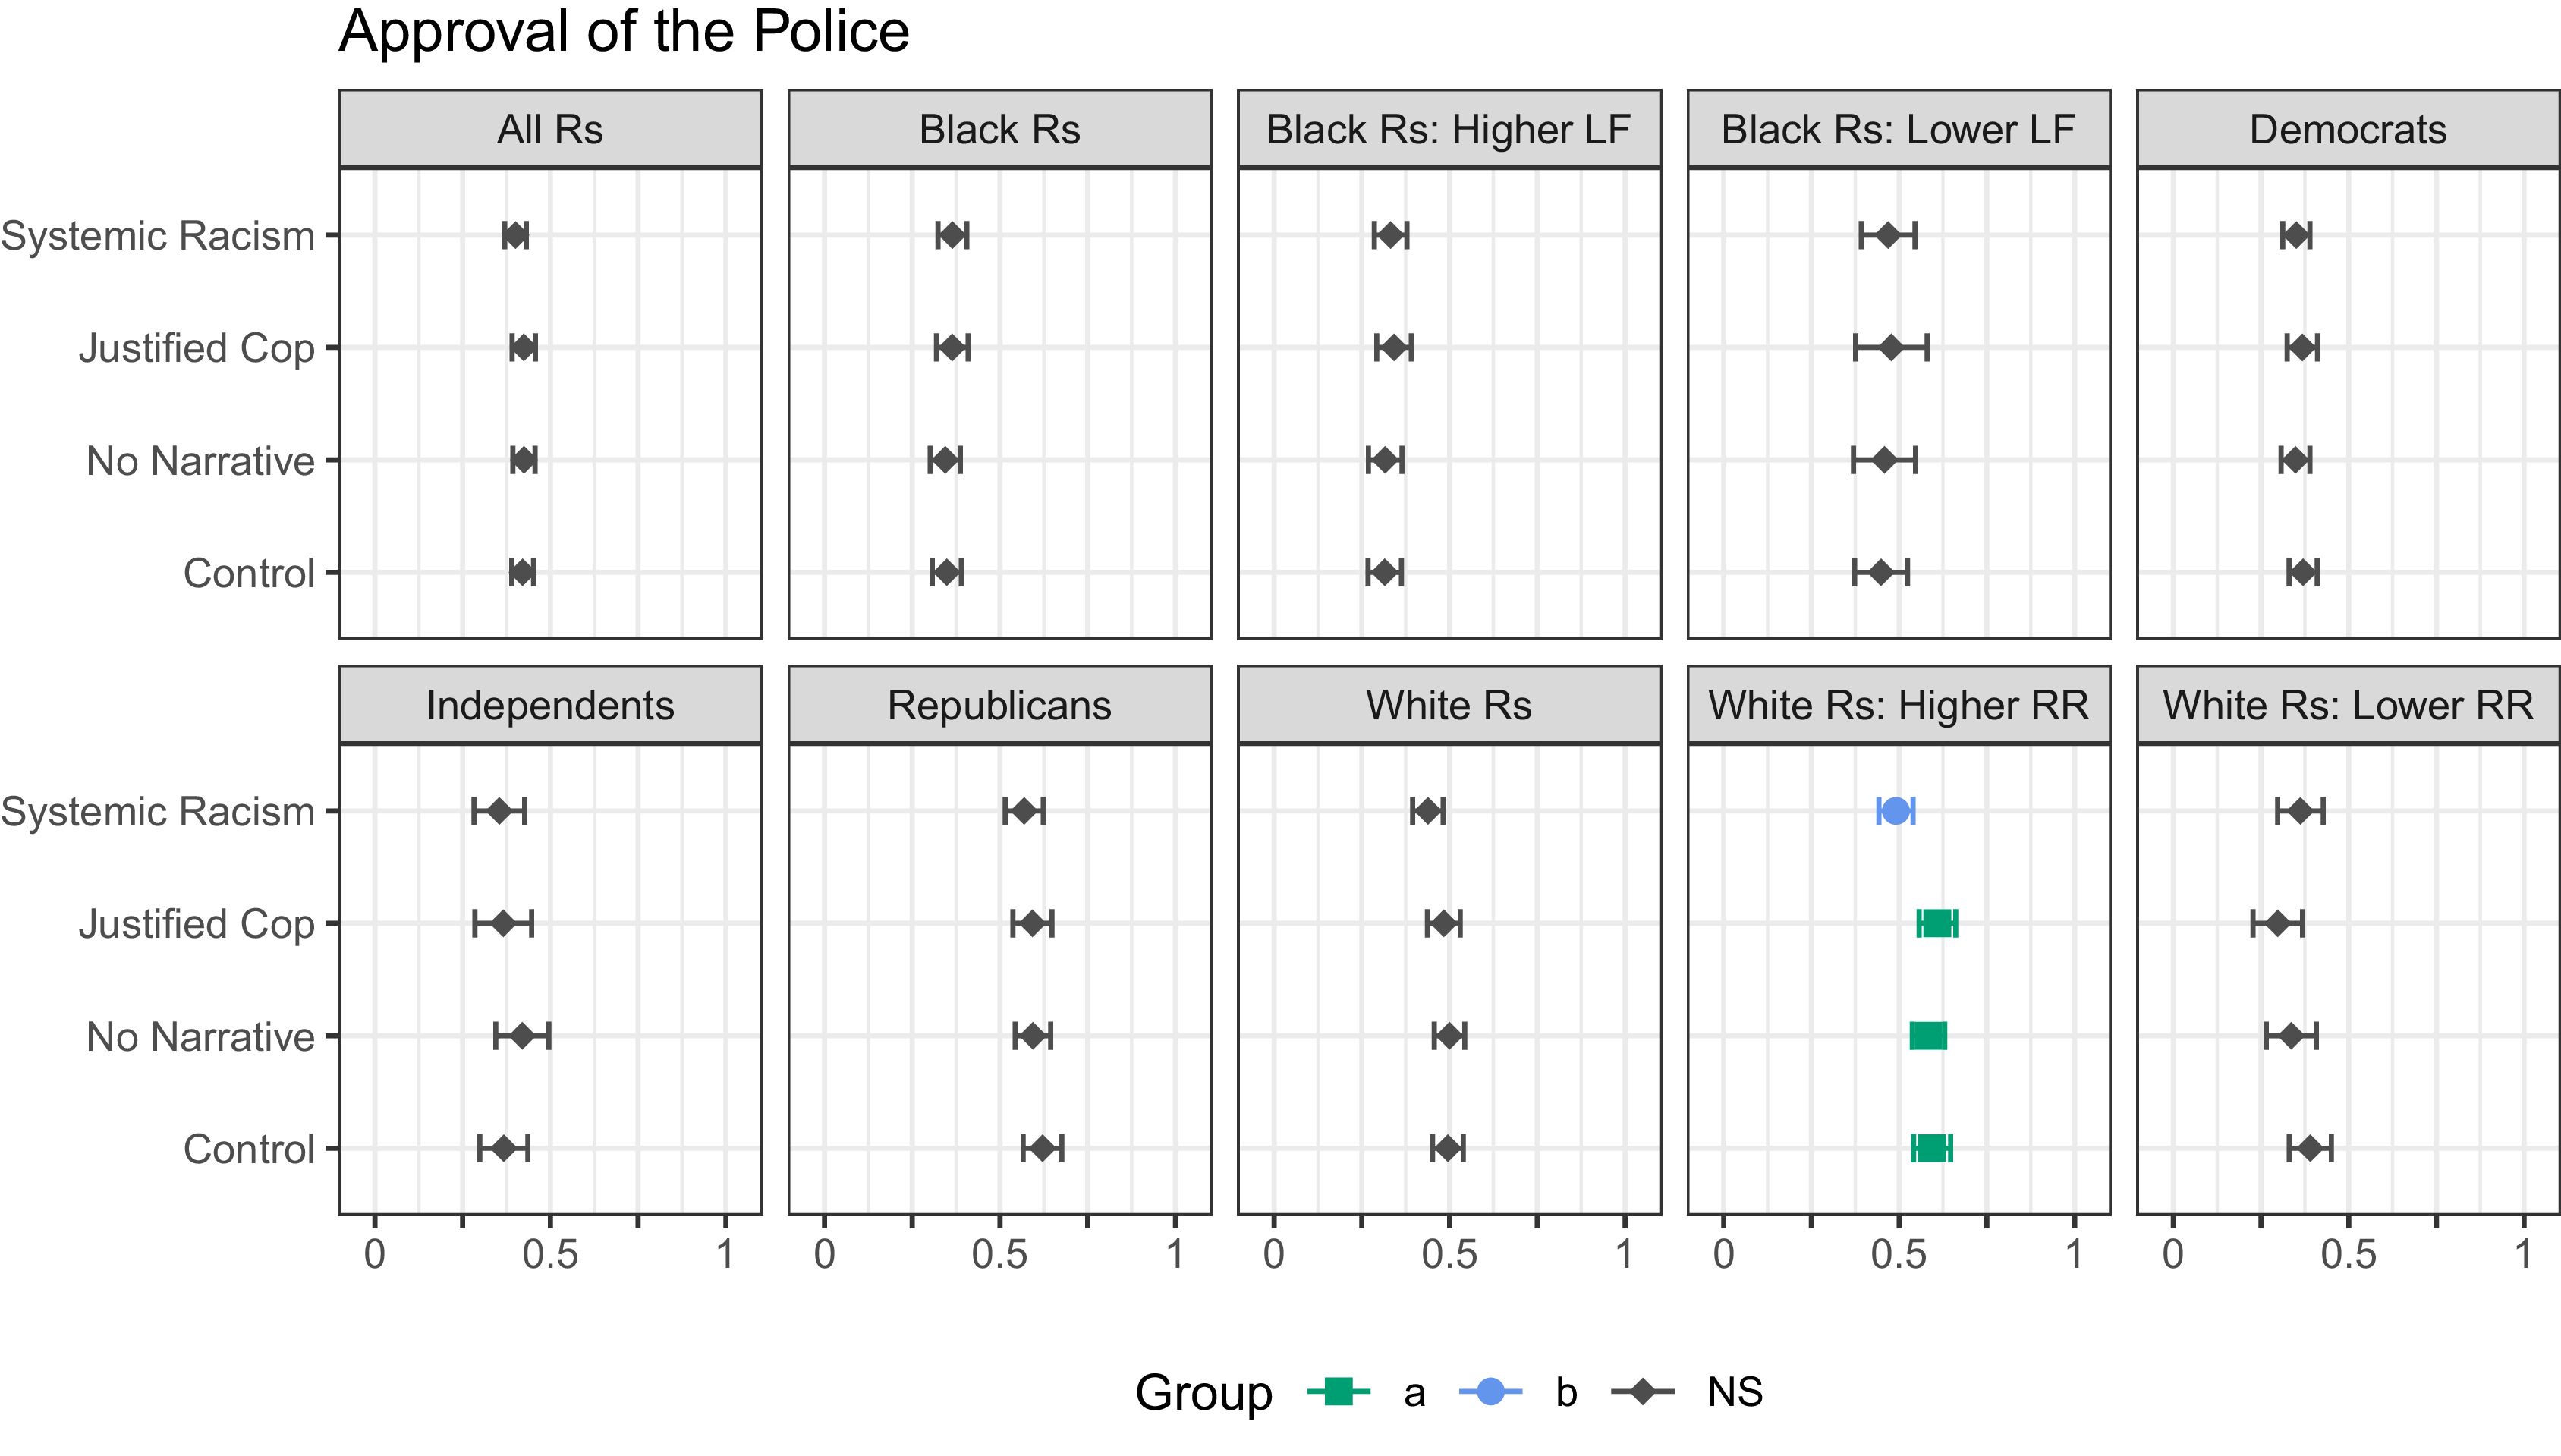
To test whether media narratives about an incident of police violence shape attitudes or behavior, we run a series of analysis of variation (ANOVA) tests to evaluate whether the experimental conditions had any effect on attitudes or behavior.Footnote 10 Then, if there is a statistically significant relationship between the experimental conditions and the dependent variable, we run Tukey’s honestly significant difference (HSD) test (e.g., King Reference King1986). In the figures that follow, the x-axis shows the full, possible range for the dependent variable, with points showing the mean values and error bars indicating their 95% confidence intervals. If points and error bars are black and circles, the initial ANOVA run for that dependent variable using the specified (sub)set of respondents failed to reach a conventional level of statistical significance of 0.05. If points and error bars are colored and vary in shape, that indicates that the initial ANOVA returned a statistically significant result (i.e., p < 0.05), with the legend indicating which groups are distinct from each other.
Figure 4 plots the ANOVA results for the attitudinal dependent variable that measures level of approval of the police. The overall results for all respondents are in the top left panel (“All Rs”), and results by different subsets of respondents are shown throughout. Respondents were subset according to the ideological and demographic differences that we preregistered: by race (white vs. Black), by partisanship (Democrat, Independent, Republican), by racial attitudes for white respondents (i.e., higher versus lower racial resentment, split at the 0.5 midpoint), and by linked fate for Black respondents (i.e., higher versus lower linked fate, split at the 0.5 midpoint).
Framing of the story of a police killing does not shift attitudes, on average.
Note: The “Group” indicates which conditions are statistically significantly different from one another. “a” means that the condition or conditions are statistically significantly different from those in group “b” at the 0.05 level or less. “ab” means that the condition is not statistically significantly different from either group “a” nor those in group “b”. “NS” means that there no statistically significant differences between any conditions.

Overall, we observe null effects of the experimental treatments. In one case, we see that white respondents with higher racial resentment decreased their approval of the police in the “systemic racism” condition, which is shown as group “b” in blue, indicating a difference from the other three conditions shown as group “a” in green. However, this effect is small and not particularly substantive. These null results, on average, likely indicate ossified opinions around policing with no space for movement—at least not from a brief news story. Providing different information with which to contextualize reports on an incident of police violence did not shift approval of the police.
Next, we turn to evaluating whether the experimental treatments shifted planned political participation at all. We operationalize participation by measuring whether respondents would contact the police, sign a petition in support of Black Lives Matter, sign a petition in support of the police, and vote in the future, as well as what proportion of seven possible activities they report being likely to do in the future. Each of these is rescaled to run from 0 to 1, where 0 indicates a respondent is unlikely and 1 indicates a respondent is very likely to do the specified action. As before, specify a series of analysis of variation (ANOVA) tests and, if applicable, Tukey’s HSD test. The overall results and results by respondent race are shown in Figure 5. Once again, we observe no statistically nor substantively significant differences across conditions.
Effects of framing on respondents’ planned participation, by race.
Note: There are no statistically significant differences between any conditions.

Next, we evaluate whether there were heterogeneous effects on racial attitudes, group consciousness, or political affiliations. Figure 6 similarly reports almost exclusively null results that are substantively insignificant. The slight exception to this is among white, racially resentful respondents, who appear to be less likely to sign a petition in support of the police when exposed to a systemic racism narrative—which was unanticipated given our preregistered hypotheses.
Effects of framing on white respondents’ planned participation, by racial attitudes.
Note: The “Group” indicates which conditions are statistically significantly different from one another. “a” means that the condition or conditions are statistically significantly different from those in group “b” at the 0.05 level or less. “ab” means that the condition is not statistically significantly different from either group “a” nor those in group “b.” “NS” means that there are no statistically significant differences between any conditions.

Further, we preregistered expectations that reactions to the way an incident of police violence is framed may vary by party affiliation, as issues around policing and our understanding of the role of the police in the United States are highly polarized. Figure 7 allows us to examine this possibility. Again, we largely uncover null results, with inconsistent and rare effects observed.
Effects of framing on respondents’ planned participation, by party identification.
Note: The “Group” indicates which conditions are statistically significantly different from one another. “a” means that the condition or conditions are statistically significantly different from those in group “b” at the 0.05 level or less. “ab” means that the condition is not statistically significantly different from either group “a” nor those in group “b.” “NS” means that there are no statistically significant differences between any conditions.

In summary, we find largely null results. The treatments did not appear to shift respondents’ willingness to participate in politics, whether it be in police-specific domains or broader forms of participation.Footnote 11 , Footnote 12
A Replication with a Lucid Sample from 2022
These results are replicated in a similar experiment fielded in April 2022 with the survey firm Lucid, with a sample of 1,000 respondents recruited to match national distributions on age, race, ethnicity, and gender. This experiment and survey were nearly identical, again measuring support for the police and planned future political participation after exposure to one of four experimental conditions. For more details, see the appendix.
When we replicate the analyses presented here with the Lucid survey sample, we again observe resounding null results across dependent variables. Together, these results indicate that the results presented in the body of this paper are not specific to the YouGov sample but are instead likely indicative of a larger pattern of results. Respondents’ attitudes and planned participation do not appear to shift in response to a media narrative reporting on police violence.
What Could Explain These Results?
With reinforcing null results, we now ask, why do we see these null results? We examine two potential answers through exploratory analyses, as neither was preregistered. First, it could be that respondents in both surveys minimally read and did not take in anything from what we asked them to read. To test this, we turn to our manipulation check below. Second, if respondents did seem to read and understand the article, is it possible that they rejected the information contained in the narrative they read? They may have relied on prior, more stable, preexisting attitudes or heuristics to understand police violence. To test this, we leverage the open-ended responses immediately following the prompt asking respondents about their reactions to the article.
Did Respondents Ignore The Article?
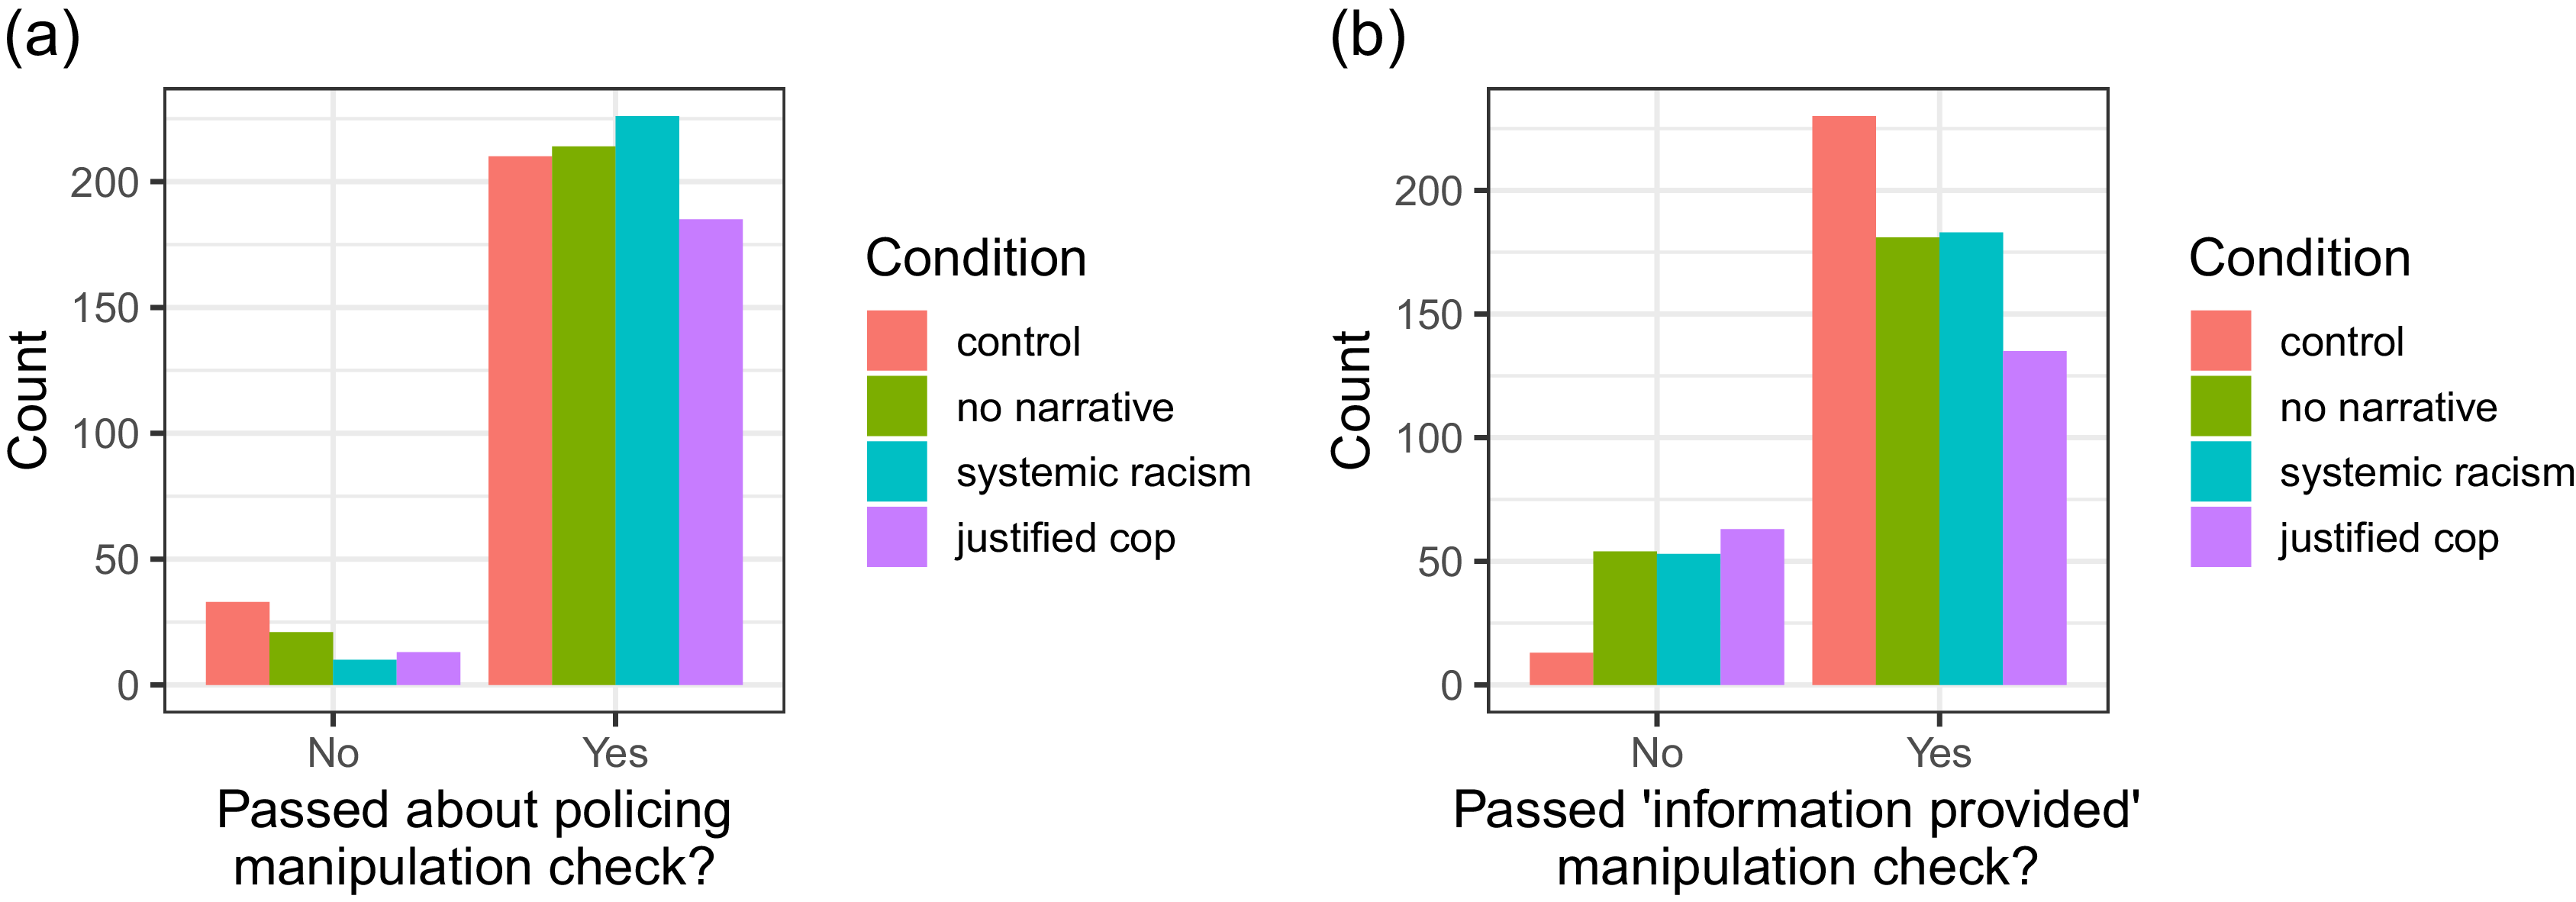
One explanation for why we see consistent null effects is that respondents did not read—or take in—the hypothetical news story. In this case, we would uncover null effects because the respondents were not effectively being treated by the experimental treatment conditions. To test for this, we turn to two manipulation checks, asked after all key dependent variables were measured. First, we asked respondents whether the news story they read earlier was about policing or about the Olympics (the latter of which was the subject of the pure control article). Second, we asked whether they learned about research finding racial disparities in policing, research on danger in policing, or neither (i.e., “The story I read did not report on research”).Footnote 13 From these two questions, we created new variables indicating whether respondents got each question correct by condition, which is shown in Figure 8.Footnote 14
Evaluating whether respondents passed the manipulation checks.

First, in Figure 8a, the counts of respondents who passed the first manipulation check around whether the story was about the Olympics or policing are shown. Here, we see that an overwhelming number of respondents answered this item accurately—the respondents in the control condition were much more likely to say that the article was about the Olympics, and the rest of the respondents who read about police violence were much more likely to say that the article was about policing. Then, Figure 8b shows the counts of respondents who passed the second manipulation check around what information was provided in the story they read. In other words, this item demonstrates that respondents answered that second manipulation check appropriately—i.e., that the respondents in the systemic racism condition were able to identify that they read about racial disparities in policing, respondents in the justified cop condition were able to identify that they read about the dangers of being a police officer, and that respondents in the no narrative condition identified that they did not read about research. While there are fewer respondents in each of the policing conditions that passed that second manipulation check, an overwhelming majority of respondents—across all conditions—passed each manipulation check.
In short, this provides evidence that respondents did read and retain information from the randomized, hypothetical story that we instructed respondents to read. This rules out—to the best of our ability—the first possibility: that our results were due to a failure of respondents to register the stories.
Did Respondents Reject What They Read?
Next, we turn to evaluating whether respondents accepted or rejected the narrative provided by the treatment, which is another explanation for the null results across two separate survey experiments. There is substantial evidence that attitudes about the police and the way that policing (de)mobilizes participation vary by race, partisanship, and racial attitudes (Chenoweth et al. Reference Chenoweth2022; Gibson and Nelson Reference Gibson and Nelson2018; Walker Reference Walker2020; Weaver and Lerman Reference Weaver and Lerman2010). Given the disproportionate targeting of Black Americans by police, they tend to hold more negative views of the police than their white counterparts (Epp, Maynard-Moody, and Haider-Markel Reference Epp, Maynard-Moody and Haider-Markel2014; Gibson and Nelson Reference Gibson and Nelson2018) and are likely better able to recognize systemic racism in policing (Walker Reference Walker2020). Likewise, Democrats tend to have a better understanding of systemic racism (Zell and Lesick Reference Zell and Lesick2022) and to hold more negative views of the police (Vitro et al. Reference Vitro2022) compared to their Republican counterparts. Finally, those with higher levels of racial resentment tend to have higher levels of support for the police (Keyes and Keyes Reference Keyes and Keyes2022; Newman, Reny, and Merolla Reference Newman, Reny and Merolla2023; Shanahan and Wall Reference Shanahan and Wall2021; Smith Reference Smith2023).
If providing media narratives about policing functions similarly, say, to other policy domains where attitudes are particularly strong and polarized, like immigration (Haynes, Merolla, and Ramakrishnan Reference Haynes, Merolla and Karthick Ramakrishnan2016), then it is possible that respondents rejected the particular media narrative they were exposed to. This would explain why respondents were unlikely to shift in the face of a relatively weak treatment—a short news article about an incident of police violence. Specifically, it could be that Black Americans, Democrats, and respondents with lower levels of racial resentment were more likely to adopt the systemic racism narrative compared to their demographic and ideological counterparts—regardless of the treatment condition they were in. Similarly, white Americans, Republicans, and those with higher levels of racial resentment may have been more likely to mention the dangers of being a police officer regardless of the narrative associated with the news story they read.
To test for this possibility, we leverage the written responses received to our open-ended question that immediately followed the provided story, where respondents were asked, “What is your reaction to this article? How did it make you feel? What did it make you think about? Please write 1–3 sentences.” As a reminder, this analysis was not preregistered and thus, should be considered exploratory.
All responses to the treatments (n = 740) for all respondents in three of the four conditions—the no narrative, systemic racism, and justified cop conditions—were hand coded. We focus on the three “policing” conditions, as we are primarily interested in whether respondents reiterated the provided narrative and then whether they accepted or rejected said narrative. We developed a codebook and trained two undergraduate research assistants to carry out the coding. Responses were coded for whether a nonsense response was provided, whether they mentioned the systemic racism narrative, whether they accepted that narrative, whether they mentioned the dangerous job narrative, and whether they accepted that narrative. Across the 145 responses that were coded by both research assistants, the calculated Cohen’s $\kappa $
was above 0.6—the commonly accepted threshold for substantial agreement—for all but the acceptance of the justified cop narrative, which was still above 0.4—indicative of moderate agreement. For more information on the coding process and intercoder reliability, see the appendix. Overall, this meets the common conventions of reliability, so we feel comfortable proceeding with analyses.
$\kappa $
was above 0.6—the commonly accepted threshold for substantial agreement—for all but the acceptance of the justified cop narrative, which was still above 0.4—indicative of moderate agreement. For more information on the coding process and intercoder reliability, see the appendix. Overall, this meets the common conventions of reliability, so we feel comfortable proceeding with analyses.
First, we examine whether the narratives about the treatment conditions were mentioned by the respondents in their written responses. Figure 9 summarizes these results, with the subfigures in the top row—Figures 9a and 9b—showing the number of responses that did or did not mention each narrative. The subfigures in the bottom row—Figures 9c and 9d—show the proportion of respondents within each condition that mention each narrative, respectively. Note, however, that mentioning one narrative does not preclude one from mentioning the other.
Were the narratives in the treatment conditions mentioned by respondents?

This series of figures reveals a number of patterns. First, while a minority of respondents mentioned each narrative, more respondents overall mentioned the systemic racism narrative compared with the justified cop narrative. This is reflective of the overall media trends shown in Figures 1 and 2 earlier in this paper. This provides some additional validity to both analyses—the ProQuest media analysis demonstrated that newspapers were much more likely to employ the systemic racism narrative when reporting on police violence, and here, we see that respondents are indeed more likely to utilize this narrative when presented with a story on police violence. Also, we should note that the fact that the victim was Black in all treatments may have prompted respondents to think about race and racism across the treatment groups.
Second, looking at the proportion of respondents that mention each narrative in their written responses, we see that the modal group that mentions each respective narrative is those who read the story that included that narrative. This is effectively an additional manipulation check—respondents were reading and responding to the specific narrative they were randomized into. However, we also see that in each case there are some number of respondents assigned to other conditions that also mention each narrative, hinting that respondents are bringing in outside information and heuristics. They are clearly not uniformly and solely adopting the narrative that they are presented with experimentally.
Given the null treatment effects that we have uncovered thus far in these analyses, we anticipate that demographic and ideological factors likely play a larger role than the treatment in governing where respondents assign blame and whether they recognize systemic racism or focus instead on policing being dangerous. Specifically, we anticipate that Black (white) respondents and Democrats (Republicans) will be more likely to accept (reject) a systemic racism narrative, while they will be conversely more likely to reject (accept) a justified cop narrative. If this is the case, then we have some evidence that these narratives are strongly ingrained in respondents’ attitudes about policing and are cued regardless of the specific narrative used when discussing a specific incident of police violence. To examine these possibilities, we turn to the coding of whether respondents seemed to accept or reject the narrative that they discussed in their written responses.
Figure 10 summarizes whether respondents belonging to different indicated groups rejected or accepted the narrative they mentioned. Here, the top row shows the results with reference to the systemic racism narrative, with the bottom row showing the results for the justified cop narrative. Further, the left column shows the results by respondent race—white or Black, as this was a split sample between white and Black respondents—and the right column shows the results by respondent party identification—Democrats, Republicans, and Independents—with leaners grouped as identifying with a party. Additionally, we estimated accompanying bivariate tests as a preliminary test for whether there are statistically significant differences. To that end, we estimated difference of proportions tests for each of the by-race comparisons, as well as comparing Democrats and Republicans in the by-party-identification comparisons, while also estimating chi-squared tests for a holistic look at the by-party-identification comparisons.
Who accepted and who rejected each narrative if they mentioned it?.
Note: Based on two difference of proportion tests, differences by race for both narratives are statistically distinct (Systemic Racism: p < 0.01; Justified Cop: p = 0.03). Difference of proportions tests comparing Democrats to Republicans reveal statistically significant differences for the systemic racism narrative (p < 0.01) but not for the justified cop narrative (p = 0.17). Chi-squared tests by party identification reveal the same pattern (Systemic Racism: p < 0.01; Justified Cop: p = 0.16).

As can be seen, the expected patterns emerge. With respect to race, although a majority of both Black and white respondents accept the system racism narrative if they mention it, a greater proportion of white respondents rejected the narrative compared with Black respondents, with this difference being statistically significant based on a difference of proportions test (p < 0.01). Similarly, but conversely, although a majority of both Black and white respondents accept the justified cop narrative, a greater proportion of Black respondents rejected the narrative compared with white respondents, with the difference again being statistically significant based on a difference of proportions test (p = 0.03).
The differences by party identification are in some ways starker. Democratic respondents who mentioned the systemic racism narrative almost uniformly accepted it, while a majority of Republicans who mentioned the systemic racism narrative rejected it. Independents fell somewhere in the middle, with a majority accepting the narrative if mentioned, but a higher proportion rejected it compared to Democratic respondents. Both a difference of proportions test comparing Democrats and Republicans (p < 0.01) and a chi-squared test comparing Democrats, Republicans, and independents (p < 0.01) reveal that these differences are statistically significant. Visually, these differences carry through to the justified cop narrative, although they are more muted, with a majority of all respondents who mention the justified cop narrative accepting it. However, just under a quarter of Democrats reject it, around 12% of independents reject it, and no Republicans reject it. These differences are not statistically significant, but this may be due to the low numbers that mention the justified cop narrative.
We again replicated these analyses using the April 2022 Lucid sample. To do so, we used the same codebook, had the same two undergraduate research assistants hand-code the responses, and conducted the same analyses. Overall, we observed the same substantive patterns and found roughly the same statistical results. For these, see the appendix.
Taken together, these analyses of the open-ended responses indicate that respondents do seem to bring in outside information, experiences, and heuristics. Their attitudes about the police and the way that people understand incidents of police violence are strongly held and unwavering in the face of new narratives or new information. Instead, demographic and ideological characteristics are more associated with how a respondent understands and seems to process a police killing than the immediate media narratives presented alongside news of a killing.
Limitations
While this survey experiment did not find evidence that media narratives shift attitudes or behaviors, that does not necessarily mean that it is impossible in every context. This could be due to other factors such as (1) design elements specific to this survey experiment, (2) the use of a survey experiment in general, or (3) the timing of fielding.
First, the news story that respondents read in the experiment is ambiguous, leaving room for diverse perspectives in terms of who is at fault. While this was a conscious decision, as we wanted to hold that ambiguity constant and then shift the additional information people read in a way that we expected would fill in the rest of the story, it does amount to a lighter treatment. If the treatment was more clear, such as if it indicated that the officer was unnecessarily escalating the situation or even that they were later charged for their actions during the traffic stop, it may have more effectively shaped respondents’ attitudes toward the police and planned political engagement.
Similarly, it could be that the particular dependent variables that we chose were not affected by the media narratives, but others would be. While we chose dependent variables that are well established in the literature (Ang and Tebes Reference Ang and Tebes2024; Burch Reference Burch2022; Christiani and Shoub Reference Christiani and Shoub2022; Morris and Shoub Reference Morris and Shoub2024; Walker Reference Walker2019; Reference Walker2020), there is always the possibility that other, unasked dependent variables would have shown some movement. In this case, it may have been that even more specific outcome measures, like belief in the existence of racial bias in policing or policy preferences on training, body cams, and the use of force, could have shown some movement. Future work may consider expanding this analysis to additional dependent variables.
It could also simply be that a survey experiment is not the appropriate design to assess whether media narratives can shift attitudes or behaviors. The kind of media attention that came to police violence in 2014 and 2020 was much more encompassing than a brief interaction on a survey experiment. Further, it was not a media narrative in isolation. Instead, it was coupled with a mass movement—something that is bigger, more meaningful, and more impactful than a brief snippet of a news story. Thus, media coverage and associated narratives in the context of broader social movements may be able to make changes that are not easily detectable in a survey experimental context.
Recent work has demonstrated that the prevalence of the Black Lives Matter movement, in particular, makes it difficult to detect smaller or more localized shifts in attitudes, like what would occur in a survey experiment. Sances (Reference Sances2025) demonstrates, by applying a synthetic control design, that the BLM movement did polarize attitudes toward the police by partisanship. He finds polarizing attitudinal shifts when he compares across policy opinions because, he argues, the ubiquity of the BLM movement means that essentially every American has already received the “treatment” of learning about BLM, police violence, and associated narratives.
Finally, it could be elements specific to the current time period that are blocking any effects. It may be that before attitudes become too crystallized, some shift in opinion or political engagement would result from narratives contextualizing police violence. Now, in an era of ossification of attitudes, though, such effects may be impossible.
Conclusion
On the whole, these results reveal more about the stability of attitudes about the police than anything else. Across two experiments, neither respondents’ attitudes nor behavior shifted in response to different media narratives used to report on an incident of police violence. Neither explaining such an incident as part of a larger system of racial inequality nor emphasizing the dangers of being a police officer shaped how respondents saw the police or their willingness to engage in political action.
When exploring possible explanations for these null results, we saw that a minority of respondents independently mentioned either narrative in their open response reactions, even though a majority appropriately identified the main topic and narrative of the article they read. Of those that did mention either narrative, more mentioned the systemic racism narrative, reminiscent of the relative prevalence of each narrative in newspapers. Of course, however, there is variation in adoption. Ideological and demographic factors determine how respondents react to the news story about police violence. Black Americans and Democrats are more likely to adopt the narrative that points to systemic racism in policing, while white respondents and Republicans are more likely to adopt the narrative that justifies the police officer’s use of violence.
Together, we make contributions to multiple literatures. First, there is a growing community of scholars within political science studying how carceral contact affects political behavior and attitude development. Here, we specifically add to the conversation around how the public views and responds to narratives seeking to contextualize police violence, particularly police killings. While previous work has focused on differences in responding to police violence by racial identity of the respondent (Jefferson, Neuner, and Pasek Reference Jefferson, Neuner and Pasek2020; Kaminski and Jefferis Reference Kaminski and Jefferis1998; McGowen and Wylie Reference McGowen and Wylie2020; Mullinix, Bolsen, and Norris Reference Mullinix, Bolsen and Norris2020; Weitzer Reference Weitzer2002) or victim (Burch Reference Burch2023; Crabtree and Yadon Reference Crabtree and Yadon2024; Israel-Trummel and Streeter Reference Israel-Trummel and Streeter2022), our work evaluates whether the narrative associated with the story about police violence has any effect. Here, we find it does not—expanding our understanding of the extent to which attitudes toward the carceral state and associated political engagement are firmly established. Relatedly, we expand upon previous work by examining potential heterogeneity across other ideological characteristics of respondents—i.e., racial attitudes, linked fate, and partisanship.
Second, within the work that sits at the intersection of framing and polarization, this study expands on previous work showing the general rejection of incongruent information among partisans (e.g., Druckman, Peterson, and Slothuus Reference Druckman, Peterson and Slothuus2013; Taber and Lodge Reference Taber and Lodge2006) and the frequent choice to seek out confirming information (Jerit and Barabas Reference Jerit and Barabas2012; Peterson and Iyengar Reference Peterson and Iyengar2021; Taber and Lodge Reference Taber and Lodge2006). In the case of our experiment, participants did not have choice, forcing some to encounter enough incongruent information, which we see them rejecting in line with prior work on the rejection of information that places their party in a negative light (Jerit and Barabas Reference Jerit and Barabas2012). Future research should build from this study and examine the ways in which mismatched narratives (i.e., when the news source adopts an opposing narrative to the respondent’s) affect other political attitudes, like trust in the news source itself. For example, even if these narratives do not have the ability to shift attitudes, they may affect the perception of the source.
Finally, across both of these literatures, the role of race—and understandings of the systemic ways race (still) plays a role—in American politics and policy. While prior studies have shown that understanding racial disparities in policing outcomes as unjust and systemic can mobilize participation (Walker Reference Walker2019; Reference Walker2020), here we focused on how media narratives may affect attitudes or behavior. As is clear from this work, attitudes about police violence are crystallized. Future research should examine to what extent and in what ways the public fills in the rest of the story based on short snippets of information—and likely how these “blanks” are differentially filled in based on one’s prior experiences and race—in an era of soundbites. This is especially true for topics that are racialized, such as policing.
On the whole, we have uncovered an instance in which people bring strong, preexisting narratives to news reports about police violence and are not easily swayed by media narratives. These findings contribute to our understanding of the limits of media narratives, especially on a highly polarized topic like policing. Normatively, this is troubling, as it highlights that here, like other polarized topics, there may be little hope for change in the current political climate.
Supplementary material
The supplementary material for this article can be found at https://doi.org/10.1017/rep.2025.10049.


 Open access