





Introduction
Postweaning diarrhea (PWD) represents a major challenge for the global swine industry, causing significant mortality and substantial economic losses (Rhouma et al. Reference Rhouma, Fairbrother and Beaudry2017). Mortality rates vary depending on disease severity and treatment intervention. In large-scale commercial farms, the impact can be even more pronounced, with some farms reporting diarrhea incidence rates as high as 50% and mortality rates ranging from 15% to 20% (Tang et al. Reference Tang, Lan and Zhou2024). Beyond mortality, PWD significantly compromises production performance. For instance, Escherichia coli F18-induced intestinal damage has been shown to reduce key growth parameters, including a 20% decline in feed conversion efficiency (gain-to-feed ratio), a 10% reduction in average daily feed intake, and a 28% decrease in average daily gain (Duarte et al. Reference Duarte, Garavito-Duarte and Kim2023). Collectively, these effects highlight the multifaceted economic burden PWD imposes on swine industry.
PWD arises from a complex interplay of bacterial infection, physiological stress, and disruption of the intestinal microbiota associated with the weaning transition (Guevarra et al. Reference Guevarra, Hong and Cho2018; Tang et al. Reference Tang, Yin and Wen2025). Enterotoxigenic Escherichia coli (ETEC) is the primary bacterial agent responsible for considerable economic losses (Fairbrother et al. Reference Fairbrother, Nadeau and Gyles2005). Early weaning compromises intestinal barrier integrity, disrupting chemical, mechanical, and immunological defenses (Su et al. Reference Su, Gong and Jiang2022). Abrupt environmental and dietary changes further destabilize gut microbial communities, predisposing piglets to dysbiosis and pathogen overgrowth (Tang et al. Reference Tang, Yin and Wen2025).
Conventional interventions for PWD, such as antibiotics and zinc oxide, are increasingly limited by antimicrobial resistance and environmental concerns. In 2010, global antimicrobial consumption in food animals was estimated at 63,151 tons, with pigs accounting for an annual consumption of 172 mg/kg of animal produced (Van Boeckel et al. Reference Van Boeckel, Brower and Gilbert2015). Such practices have been linked to the spread of antimicrobial-resistant pathogens in both livestock and humans, posing a major public health threat (Yang et al. Reference Yang, Chowdhury and Huo2015). Regulatory measures have responded accordingly. The European Union banned antibiotic growth promoters in animal production in 2006 (Bengtsson and Wierup Reference Bengtsson and Wierup2006). These developments underscore the urgent need for effective antibiotic alternatives that maintain production performance (Yang et al. Reference Yang, Chowdhury and Huo2015).
Bacteriophages – viruses that specifically infect bacteria – have emerged as a promising alternative (Choi et al. Reference Choi, Lee and Kwon2024). Ubiquitous in nature, phages are estimated to outnumber bacteria tenfold (Brüssow and Hendrix Reference Brüssow and Hendrix2002). Bacteriophages replicate through lytic cycles, whereby they infect bacteria, hijack cellular machinery, and release progeny phages upon cell lysis (Donovan Reference Donovan2007). Unlike antibiotics, which broadly target both harmful and beneficial bacteria, phages exhibit remarkable specificity, typically infecting distinct bacterial species (Wu and Pinta Reference Wu and Pinta2019). Moreover, phage can self-amplify at infection sites, offering continuous antibacterial action without the need for frequent dosing (Alaaeddine et al. Reference Alaaeddine, Al-Mohammed and Pillai2025).
Experimental studies in pigs have demonstrated phage efficacy, including 99–99.9% reductions in Salmonella tissue loads (Wall et al. Reference Wall, Zhang and Rostagno2010), and significant mitigation of ETEC-induced diarrhea (Jamalludeen et al. Reference Jamalludeen, Johnson and Shewen2009). Reductions in bacterial load appear most pronounced 48–96 h posttreatment (Desiree et al. Reference Desiree, Mosimann and Ebner2021). Phage cocktails can control pathogens without disrupting the normal gut microbiota; in weaned pigs, supplementation with a 0.10% phage cocktail increased beneficial anaerobic bacteria, such as Bifidobacterium spp. and Lactobacillus spp., while reducing Clostridium spp. and coliform populations (Lee et al. Reference Lee, Kim and Park2017; Seo et al. Reference Seo, Song and Lee2018). However, practical challenges remain, including phage inactivation by gastric acid, emergence of phage-resistant bacterial mutants, and lack of standardized regulatory frameworks for phage products.
Despite these promising findings, reported outcomes of phage therapy remain highly variable, influenced by factors such as study design, phage type, dosage, administration route, timing of the treatment, targeted pathogen strains, and the animal subject. This variability underscores the need for a rigorous synthesis of available data to identify key determinants of phage efficacy. Previous systematic reviews and meta-analyses have demonstrated that bacteriophage treatment can significantly reduce bacterial concentrations in pigs, with efficacy influenced by sampling time, pig age, and sample type (Desiree et al. Reference Desiree, Mosimann and Ebner2021). However, earlier syntheses were not restricted to PWD models, relied primarily on single-level meta-analytic approaches, and included heterogeneous pig populations and production stages. The present study extends this body of work by focusing specifically on piglets challenged with enteric pathogens relevant to PWD, incorporating a larger and more recent dataset, and applying a multilevel meta-analytic framework to account for nonindependence among multiple outcomes within studies.
In this study, we hypothesized that bacteriophage therapy would significantly reduce pathogen loads in challenged piglets, with efficacy modulated by factors such as phage formulation and dosage, administration type and timing, and challenge characteristics. The objectives were to (i) quantify the overall efficacy of bacteriophage therapy in reducing pathogen load in challenged piglets; (ii) identify moderators that influence treatment efficacy; and (iii) assess publication bias and robustness of findings through sensitivity analyses. Accordingly, this meta-analysis provides a quantitative evaluation of bacteriophage effectiveness against PWD-associated pathogens in piglets.
Methodology
Search strategy and study selection
A comprehensive literature search was conducted independently by two reviewers across Scopus, Web of Science Core Collection, and PubMed. No language restrictions were applied, and all searches were updated to December 2025. Database-specific search strategies were developed using combinations of controlled vocabulary (MeSH terms) and free-text synonyms covering three domains: (i) bacteriophage intervention (phage, bacteriophage, phage therapy), (ii) swine host terms (pig, pigs, swine, porcine, hog, piglet), and (iii) bacterial pathogens and diseases context (E. coli, Escherichia coli, Salmonella, Clostridium, ETEC, bacteria, pathogen, colibacillosis). The full search strings for each database are provided in Supplementary Table S1. Across the three databases, the searches returned 1,315 records from Scopus, 971 from Web of Science Core Collection, and 786 from PubMed, totaling 1,957 records.
After removing 684 duplicates, 1,273 unique records remained and were entered into a structured PRISMA (Preferred Reporting Items for Systematic Reviews and Meta-Analyses)-based screening process. In the first phase (title screening), studies were excluded if phage-related terminology and pig-related terminology were not mentioned, if the study involved guinea pigs, or if the article was a review or meta-analysis. This resulted in the exclusion of 1,141 records for irrelevance and 3 records for being reviews or meta-analyses, leaving 129 studies for abstract screening.
In the second phase (abstract screening), 102 records were excluded for the following reasons: the study did not involve therapeutic bacteriophage application (enzyme-only, lab-scale, or environmental work) (n = 94); the study was not related to piglets (n = 6); the article was a review with no primary data (n = 1); or the wrong in vivo animal model was used (n = 1). A total of 27 studies were advanced to full-text review.
In the final phase (full-text screening), articles were assessed for methodological rigor and extractability of quantitative data. A total of 17 studies were excluded for the following reasons: studies lacking quantitative pathogen outcomes or only reporting general microbiota (n = 8); no infection model or not a therapeutic challenge study (n = 4); pooled independent trials with a compromised control group (n = 1); combined interventions where the phage effect could not be isolated (n = 2); and missing statistical data such as no standard deviation reported (n = 2). After applying these criteria, nine studies from the database search were included in the final review. Inter-reviewer agreement statistics were not calculated, and discrepancies were resolved through discussion and consensus. This systematic review was not preregistered.
Additionally, two more studies meeting all inclusion criteria were identified through manual searches and retrieved from the Korean Journal of Veterinary Service, which is not indexed in PubMed, Scopus, or Web of Science. Summaries of all 11 studies are included in Supplementary Table S2.
Data extraction
Data from each eligible study were systematically extracted by two independent authors. The variables extracted from eligible studies were summarized in the Supplementary Table S3. Each experimental unit – defined as a treatment–control pair conducted under identical experimental conditions – was entered as a single record. Quantitative data presented only in graphical form were digitized using WebPlotDigitizer (Rohatgi and Stanojevic Reference Rohatgi and Stanojevic2015). To minimize errors, all graphs were digitized twice by each reviewer, and values were averaged.
Outcome variables included the mean log₁₀ colony-forming units (CFU) per gram of sample in the treated group (Mean_log10CFU_t) and control group (Mean_log10CFU_c), the standard deviations of log₁₀ CFU in the treated group (SD_log10CFU_t) and control group (SD_log10CFU_c), and the number of pigs in the treated group (n_t) and control group (n_c).
Data transformation and grouping
Experimental variables were standardized to enable cross-study comparisons. Phage dose was categorized as low (≤10⁸ plaque-forming units, PFU), medium (10⁸–1010 PFU), or high (≥1010 PFU), and challenge dose as low (≤3 × 10⁸ CFU), medium (3 × 10⁸–5 × 10⁹ CFU), or high (>5 × 10⁹ CFU). Administration frequency was classified as once (1 administration), few (2–4), or many (>4), and phage administration route as oral gavage, in feed, or other methods. Intervals between challenge doses were grouped as 0–24 or > 24 h. Sampling times were harmonized into 0–24, 24–48, or >48 h from the point of phage–pathogen contact, which is critical for distinguishing prophylactic from therapeutic application. Phage administration timing was classified as prophylactic (pre- or peri-challenge) or therapeutic (post-challenge) (Supplementary Table S4).
Two composite indicators captured treatment and challenge intensity: DoseRoute, defined by phage dose × frequency × administration method, and ChallengePattern, defined by challenge dose × frequency × interval (Supplementary Table S5). Hierarchical identifiers accounted for experimental structure: Study_Id (independent study), Exp_Group (unique combination of DoseRoute, ChallengePattern, encapsulation, and administration type), and Sampling_Event (Sampling_time × Sampling_site).
Statistical analysis
Preliminary analyses of explanatory variables
Preliminary analyses were carried out to describe patterns in the raw data prior to meta-analysis. They do not account for study-level clustering, within-study correlations, or sampling variance, which are addressed in the subsequent multilevel meta-analysis. All statistical analyses were conducted in R using RStudio. The log reduction was calculated as the difference between the mean bacterial load in the treatment and control groups (log₁₀ CFU/g), such that negative values indicate a reduction in pathogen load due to phage treatment. Normality was assessed using the Shapiro–Wilk test (Shapiro and Wilk Reference Shapiro and Wilk1965) and visualized using a histogram (Fig. 1). As the data were non-normally distributed (p < 0.05), nonparametric tests were applied.
Histogram of log reduction of pathogen counts (log10 CFU treatment − log10 CFU control).
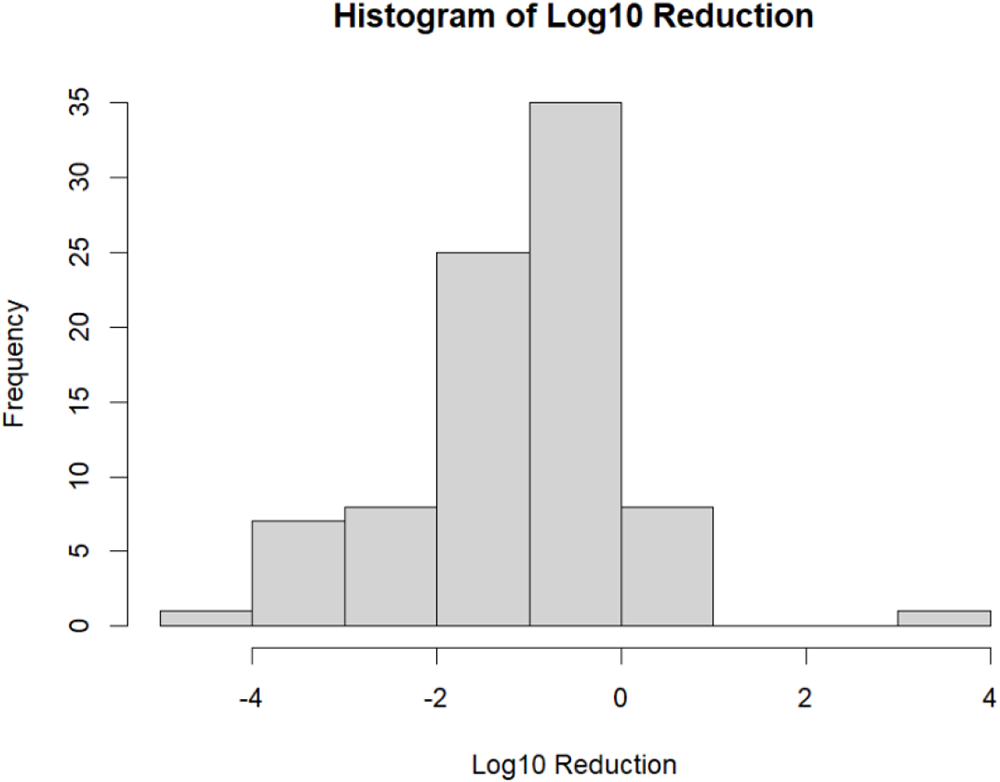
Figure 1 Long description
Histogram of Log10 Reduction The horizontal axis label is Log10 Reduction. The horizontal axis range is negative 4 to 4. The vertical axis label is Frequency. The vertical axis range is 0 to 35. Bars are shown across the Log10 Reduction axis, with the tallest bar located between negative 1 and 0 and reaching 35 on the Frequency axis. A bar between negative 2 and negative 1 reaches 25. A bar between negative 3 and negative 2 reaches 10. A bar between negative 4 and negative 3 reaches 1. A bar between 0 and 1 reaches 10. A bar between 3 and 4 reaches 1.
Ten categorical moderators were analyzed: challenge type, phage administration method, challenge pattern, dose route, phage type, encapsulation, administration timing, sampling time, sampling site, and detection method. Descriptive statistics (mean, standard deviation, median, and percentages) were calculated for each level using the dplyr package (Wickham et al. Reference Wickham, François and Henry2014).
Group differences were tested using the Wilcoxon rank-sum test for two-level moderators and the Kruskal–Wallis test for multilevel moderators. When significant differences were detected (p < 0.05), Dunn’s post hoc test with Bonferroni correction identified pairwise differences. The multcompView package (Spencer Graves, Hans-Peter Piepho and Luciano Selzer with help from Sundar Dorai-Raj 2006) was used to generate compact letter displays indicating nonsignificant groupings.
Meta-analyses
Two complementary approaches were applied to evaluate the effect of bacteriophage treatment across studies. First, the standardized mean difference (SMD) was calculated for each experimental comparison to estimate the overall pooled effect:
 \begin{equation*}\mathrm{SMD}
=\frac{\mathrm{Mean}\,\log_{10}\mathrm{CFU}_{t}-\mathrm{Mean}\,\log_{10}\mathrm{CFU}_{c}}{\mathrm{SD}_{\mathrm{pooled}}}\end{equation*}
\begin{equation*}\mathrm{SMD}
=\frac{\mathrm{Mean}\,\log_{10}\mathrm{CFU}_{t}-\mathrm{Mean}\,\log_{10}\mathrm{CFU}_{c}}{\mathrm{SD}_{\mathrm{pooled}}}\end{equation*}where
 \begin{equation*}S{D_{{\text{pooled}}}} = \sqrt {\frac{{\left( {{n_t} - 1} \right)SD_t^2 + \left( {{n_c} - 1} \right)SD_c^2}}{{{n_t} + {n_c} - 2}}} ,\end{equation*} $t\,$ and $c\,$ denote the treated and control groups, respectively, and SD is the standard deviation.
Second, potential moderators influencing treatment outcomes were explored. Each unique experimental condition – defined as a combination of explanatory variables within a study – was treated as an independent observation. This approach allowed proper modeling of shared controls, where a single control group was compared against multiple treatment groups, reducing within-study dependency while increasing statistical power. Data preprocessing included assignment of experimental group identifiers to capture within-study variation and sampling event identifiers to capture measurement-level variability.
A three-level multilevel random-effects meta-analysis was fitted using restricted maximum likelihood (REML) via the rma.mv() function using metafor package, R (Viechtbauer Reference Viechtbauer2010), with random effects specified at three hierarchical levels:
1. Study level (Level 1): accounted for between-study heterogeneity due to differences in trial conditions, animal models, and study design.
2. Experimental group level (Level 2, nested within study): captured variation among treatment combinations, including cases with shared controls, to prevent underestimation of variance.
3. Sampling event level (Level 3, nested within experimental group): addressed correlations among repeated measurements within the same treatment group across time points, sampling sites, or detection methods.
The model structure was specified as
 \begin{equation*}yi \sim 1 + \left( {1\mid Study/Group/Sampling} \right).\end{equation*}
Heterogeneity was first assessed using Cochran’s Q statistic as provided by the multilevel meta-analysis model (Cochran Reference Cochran1954). For descriptive purposes, a conventional I 2 statistic was calculated for the overall model using (Higgins and Thompson Reference Higgins and Thompson2002):
 \begin{equation*}{I^2} = \frac{{Q - df}}{Q} \times 100\% ,\end{equation*}
where  $Q\,\,$ represents Cochran’s heterogeneity statistic and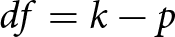 $df = k - p$, with $k$ being the number of effect sizes and $p$ the number of model parameters. This statistic provides a global summary of excess variability beyond sampling error but does not account for hierarchical dependence.
Given the multilevel structure of the data, heterogeneity was primarily quantified using variance component decomposition from the three-level random-effects model fitted via REML. The model estimated variance components ( ${\tau ^2}$) corresponding to study-level, experimental group-level, and sampling-level variation. Total heterogeneity variance was defined as
 \begin{equation*}\tau _{{\text{total}}}^2 = \sum \tau_{{\text{levels}}}^2.\end{equation*}
To appropriately account for sampling error, heterogeneity was expressed using variance partition coefficients, calculated as
 \begin{equation*}
I_{level}^2 = \frac{\tau_{level}^2}{\sum {\tau ^2} + \acute{v}}\end{equation*}
\begin{equation*}
I_{level}^2 = \frac{\tau_{level}^2}{\sum {\tau ^2} + \acute{v}}\end{equation*}where  $\tau _{{\text{level}}}^2$ represents the variance attributable to a specific hierarchical level and $\acute{v}$ is the mean sampling variance. The overall multilevel heterogeneity was defined as
 \begin{equation*}I_{total}^2 = \frac{\sum \tau ^2}{\sum \tau ^2 + \acute{v}}\end{equation*}
This framework extends the conventional I 2 statistic to multilevel meta-analytic structures and allows partitioning of total variability into study-, group-, and sampling-level components.
Importantly, proportions of variance attributed to each level were also reported as
 \begin{equation*}{\text{Proportion of }}{\tau ^2} = \frac{\tau _{level}^2}{\sum \tau^2}\end{equation*}
These values describe the relative contribution of each hierarchical level to between-study heterogeneity but do not include sampling variance.
This decomposition provides a clear picture of true variability at each hierarchical level. Publication bias was assessed with funnel plots and Egger’s regression test. To account for dependencies in the multilevel model, effect sizes were aggregated to the study level for Egger’s test, regressing standardized effect sizes (yi/sei) against precision (1/sei), with significance set at p < 0.05.
Influential studies were identified using two complementary diagnostics: standardized residuals (|z| > 2) to detect outlying effect-size observations and leave-one-out (LOO) analysis at the study level. Studies causing SMD changes greater than 2 standard deviations of the LOO differences were considered influential and removed in sensitivity analyses. The multilevel model was refitted without these studies to confirm the robustness of results.
The risk of bias of included studies was assessed using the SYRCLE Risk-of-Bias tool (Hooijmans et al. Reference Hooijmans, Rovers and De Vries2014), which evaluates 10 domains relevant to internal validity in animal experiments, including random sequence generation, allocation concealment, blinding of caregivers and outcome assessors, baseline characteristics, and completeness of outcome reporting. Each domain was rated as low, high, or unclear risk of bias by two independent reviewers. Discrepancies were resolved using a predefined decision rule (Low + Unclear → Unclear; High + Unclear → High; Low + High → High), after which consensus ratings were applied in all analyses. This structured approach provides transparency regarding study quality and supports interpretation of the pooled effect estimates.
Moderator analyses were conducted to investigate whether one of the moderators explained variability in bacteriophage efficacy across studies. For each, separate multilevel random-effects meta-analyses were fitted using REML as implemented in the “rma.mv()” function of the metafor package in R (Viechtbauer Reference Viechtbauer2010). In these models, each moderator level was analyzed as a distinct subset of effect sizes while maintaining the same three-level hierarchical random-effects structure (study, experimental group nested within study, and sampling event). This approach accounts for dependency among effect sizes arising from multiple measurements within studies and shared control (Hedges et al. Reference Hedges, Tipton and Johnson2010; Van Den Noortgate et al. Reference Van Den Noortgate, López-López and Marín-Martínez2013).
For each moderator level, the pooled SMD was estimated along with its 95% confidence interval (CI). The corresponding p-value reported in Table 1 is based on a Wald-type test (z-test), calculated as the ratio of the estimated effect size to its standard error (z = estimate/SE). These tests evaluate whether each subgroup-specific pooled effect differs significantly from zero (no treatment effect) rather than comparing one subgroup directly against another or against a reference category (Viechtbauer Reference Viechtbauer2010).
Prevalence and effects of explanatory variables on pathogen count raw data
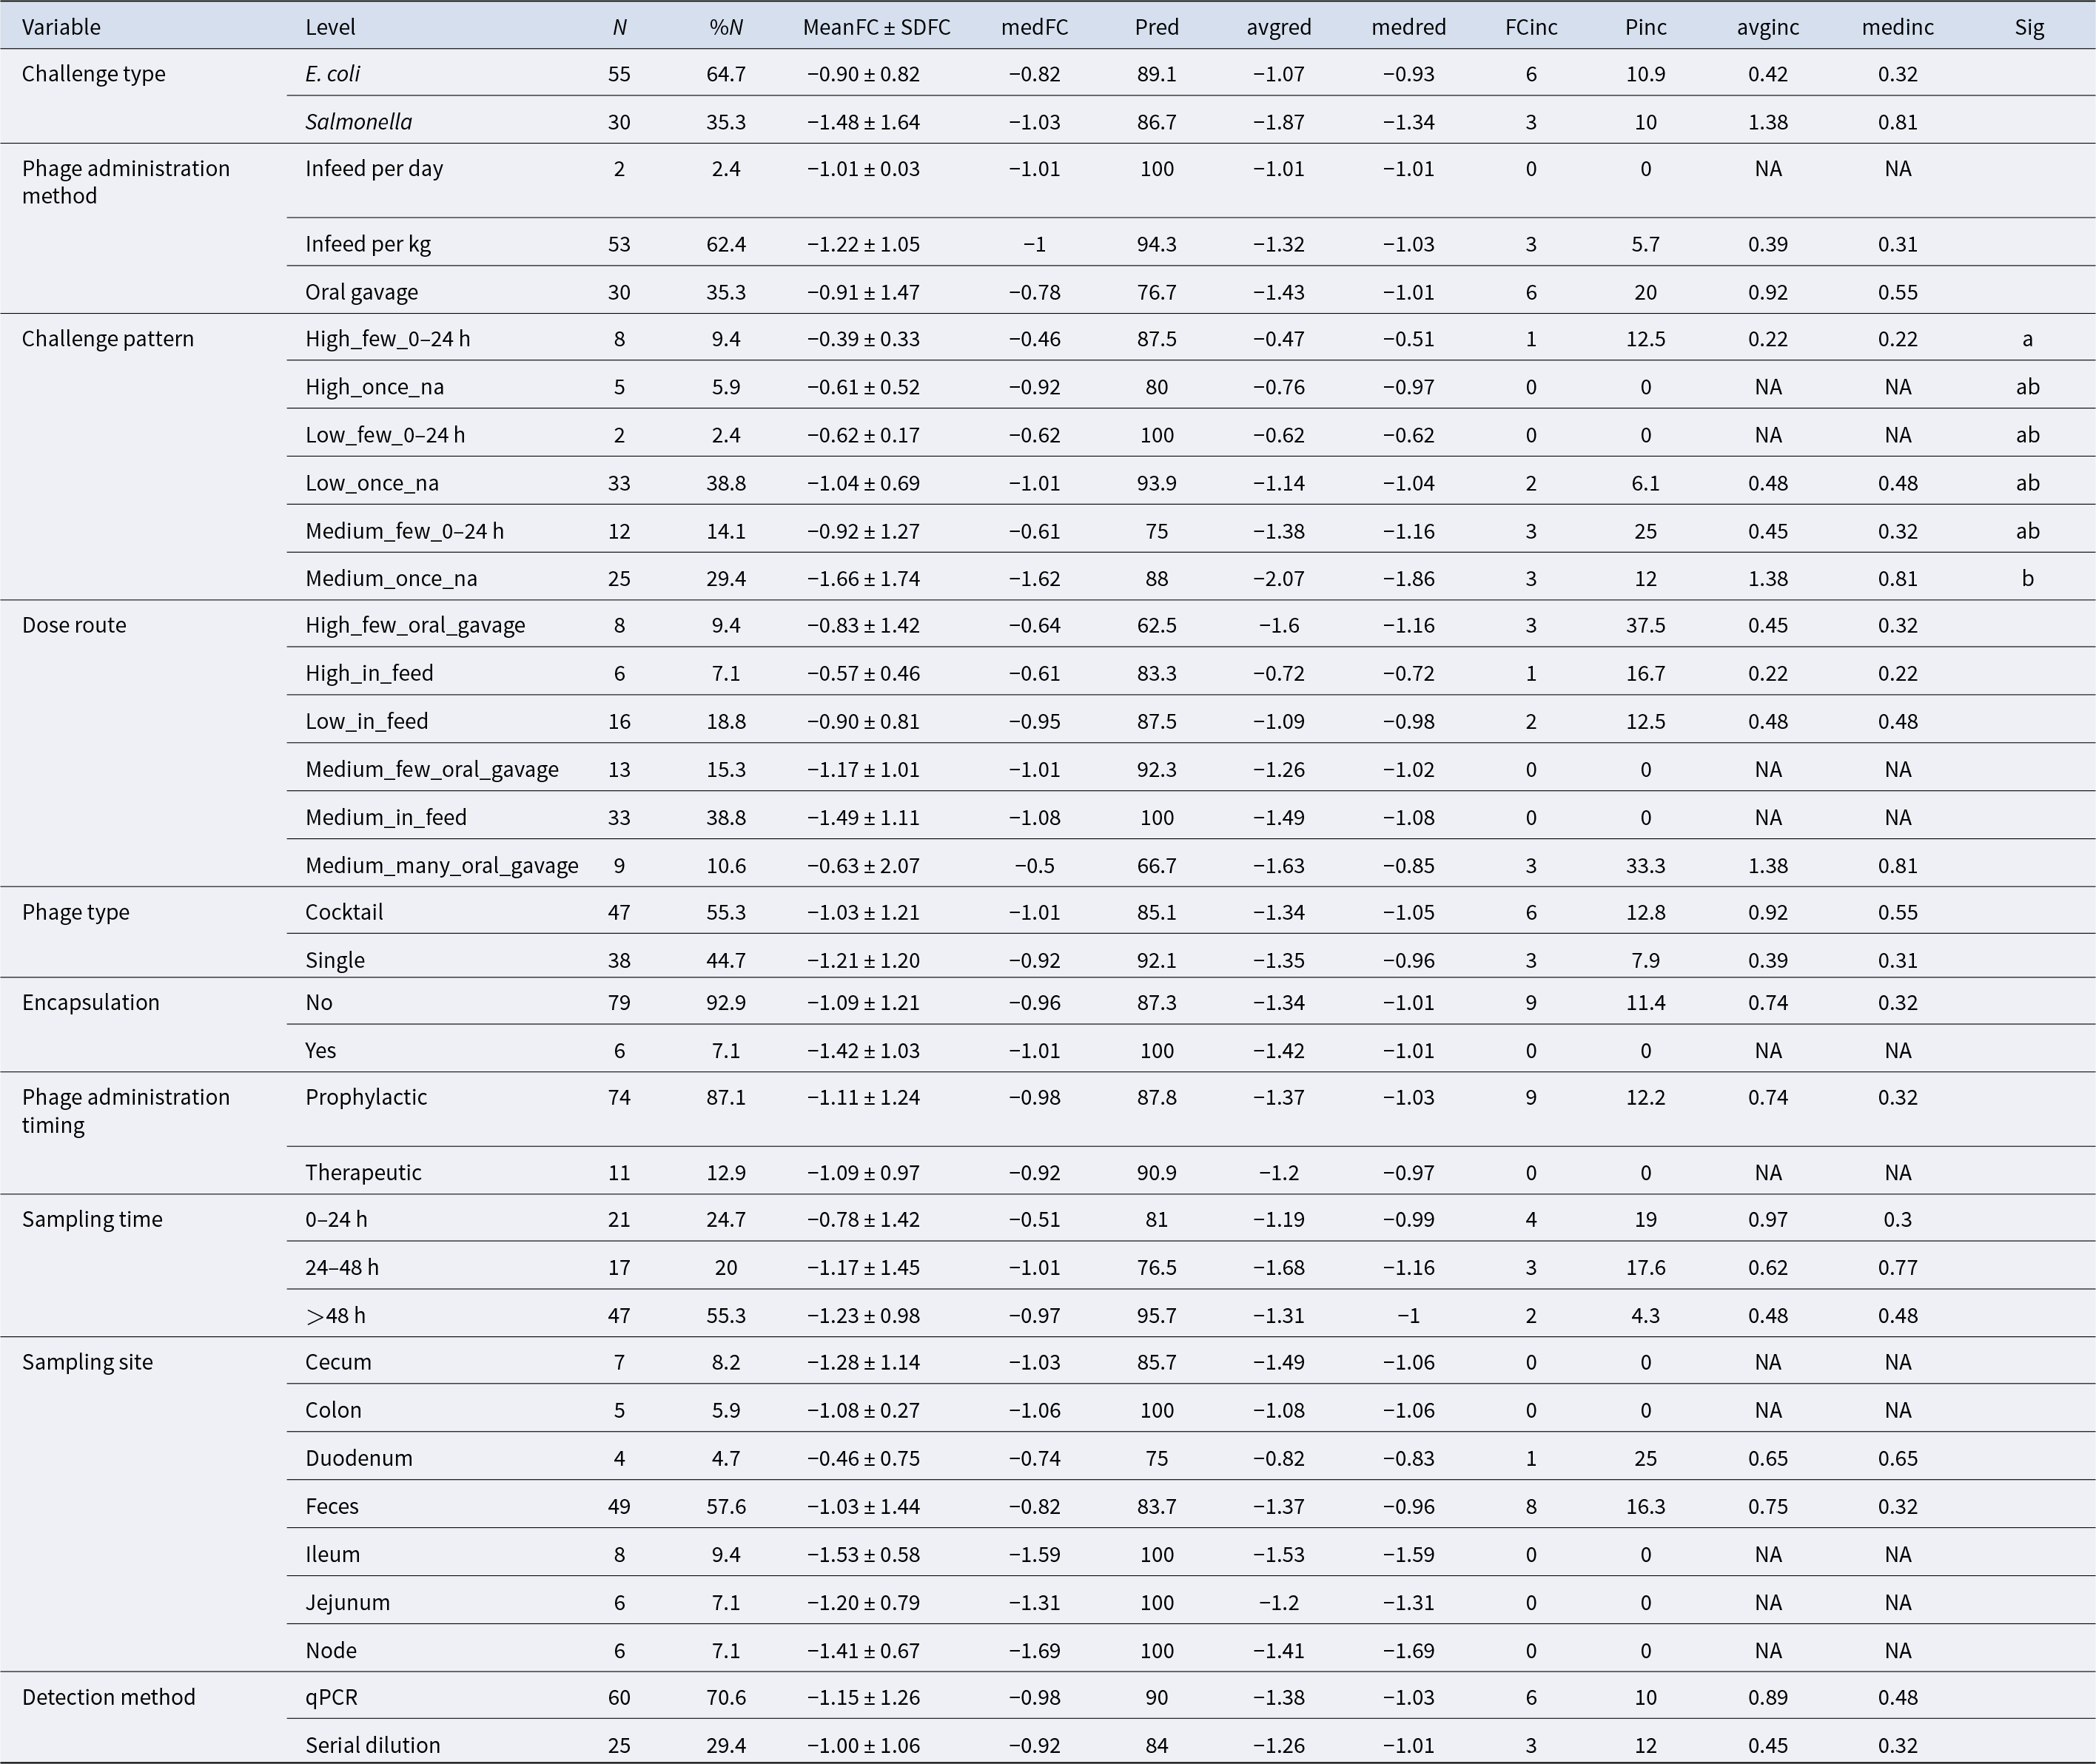
Table 1 Long description
The table summarizes paired treatment–control effect sizes for pathogen counts, reported as log10 fold-change differences (negative values indicate reductions) across study variables and levels. Overall mean effects are consistently negative, typically around −0.9 to −1.5 log10, and most levels show reductions in the majority of observations (generally ~80–100%), with increases occurring in a minority (~0–20%). By challenge type, Salmonella shows a larger average reduction (mean −1.48) than E. coli (mean −0.90), with similar low rates of increases (~10%). Administration method differs: in-feed per kg has high prevalence of reductions (94.3%) and mean −1.22, while oral gavage shows a lower reduction prevalence (76.7%) and more increases (20%). Challenge pattern indicates the strongest average reduction for “Medium_once_na” (mean −1.66) and the weakest for “High_few_0–24 h” (mean −0.39); significance letters suggest “Medium_once_na” differs from “High_few_0–24 h,” while other patterns overlap. Sampling time trends toward stronger and more consistent reductions after >48 h (mean −1.23; 95.7% reductions; 4.3% increases) compared with earlier windows. Sampling site varies, with ileum, jejunum, node, and colon showing 100% reductions (means about −1.08 to −1.53), while feces has more mixed outcomes (83.7% reductions; 16.3% increases). Detection methods are similar, with qPCR slightly more negative on average (−1.15) than serial dilution (−1.00). Some levels have very small sample sizes (e.g., N=2–6), so their averages and percentages are less stable and should be interpreted cautiously.
N: Number of paired effect size.
%N: Percentage of total observations.
avgFC: Mean log₁₀ difference between treatment and control groups (negative values indicate reduced deviation of log₁₀ fold change).
medFC: Median log₁₀ fold change.
Pred: Percentage of observations showing reduction (%).
avgred: Mean log₁₀ fold change among reduced observations.
medred: Median log₁₀ fold change among reduced observations.
FCinc: Number of observations showing log₁₀ fold change increase.
Pinc: Percentage of observations showing an increase (%).
avginc: Mean log₁₀ fold change among increased observations.
medinc: Median log₁₀ fold change among increased observations.
Sig: Statistical significance grouping; different letters indicate significant differences between levels (p < 0.05).
To assess whether each moderator explained a significant proportion of between-study heterogeneity, omnibus tests were performed using the QM statistic. The QM test evaluates whether all subgroup effects associated with a moderator jointly differ from zero after accounting for sampling variance and the multilevel random-effects structure (Viechtbauer Reference Viechtbauer2010). A significant QM value (p < 0.05, Table 1) indicates that effect sizes differ across moderator levels beyond chance, whereas a nonsignificant result indicates that observed subgroup differences are consistent with random variation.
Heterogeneity within each model was quantified using I 2 statistics. The overall I 2 reported in Table 1 represents the proportion of total variability attributable to true heterogeneity rather than sampling error, extended to multilevel meta-analysis settings (Higgins and Thompson Reference Higgins and Thompson2002). Additional decomposition of heterogeneity into study-, group-, and sampling-level components (Supplementary Table S7) was based on variance component estimates (τ 2) extracted from the multilevel models and expressed as proportions of total heterogeneity, following established methods for multilevel I 2 partitioning (Cheung Reference Cheung2014; Nakagawa and Santos Reference Nakagawa and Santos2012).
Together, these analyses allow (i) estimation of subgroup-specific treatment effects, (ii) correct interpretation of within-group significance relative to zero effect, and (iii) formal evaluation of whether moderators explain heterogeneity across studies while properly accounting for dependence in the dataset.
Results and discussion
Search results
The database searches identified 1,957 records (Scopus: 1,315; Web of Science: 971; PubMed: 786). After removing 684 duplicates, 1,273 unique records were screened. Title screening excluded 1,141 irrelevant records and 3 review and meta-analysis articles, leaving 129 studies for abstract assessment. Of these, 102 were excluded for non-therapeutic phage work (n = 94), use of non-postweaning pig models (n = 6), absence of primary data (n = 1), or use of an incorrect in vivo model (n = 1). Twenty-five studies proceeded to full-text review. Full-text screening excluded 17 studies due to insufficient quantitative pathogen outcomes (n = 8), absence of an infection or therapeutic challenge model (n = 4), compromised control groups (n = 1), inability to isolate phage-specific effects in combined interventions (n = 2), or missing statistical variance measures (n = 2). Nine studies met all inclusion criteria. Two additional eligible studies were identified through manual searching of the Korean Journal of Veterinary Service, resulting in a final set of 11 studies included in the review. The full study selection process is summarized in the PRISMA flow diagram (Fig. 2).
PRISMA 2020 workflow diagram of the study selection process.
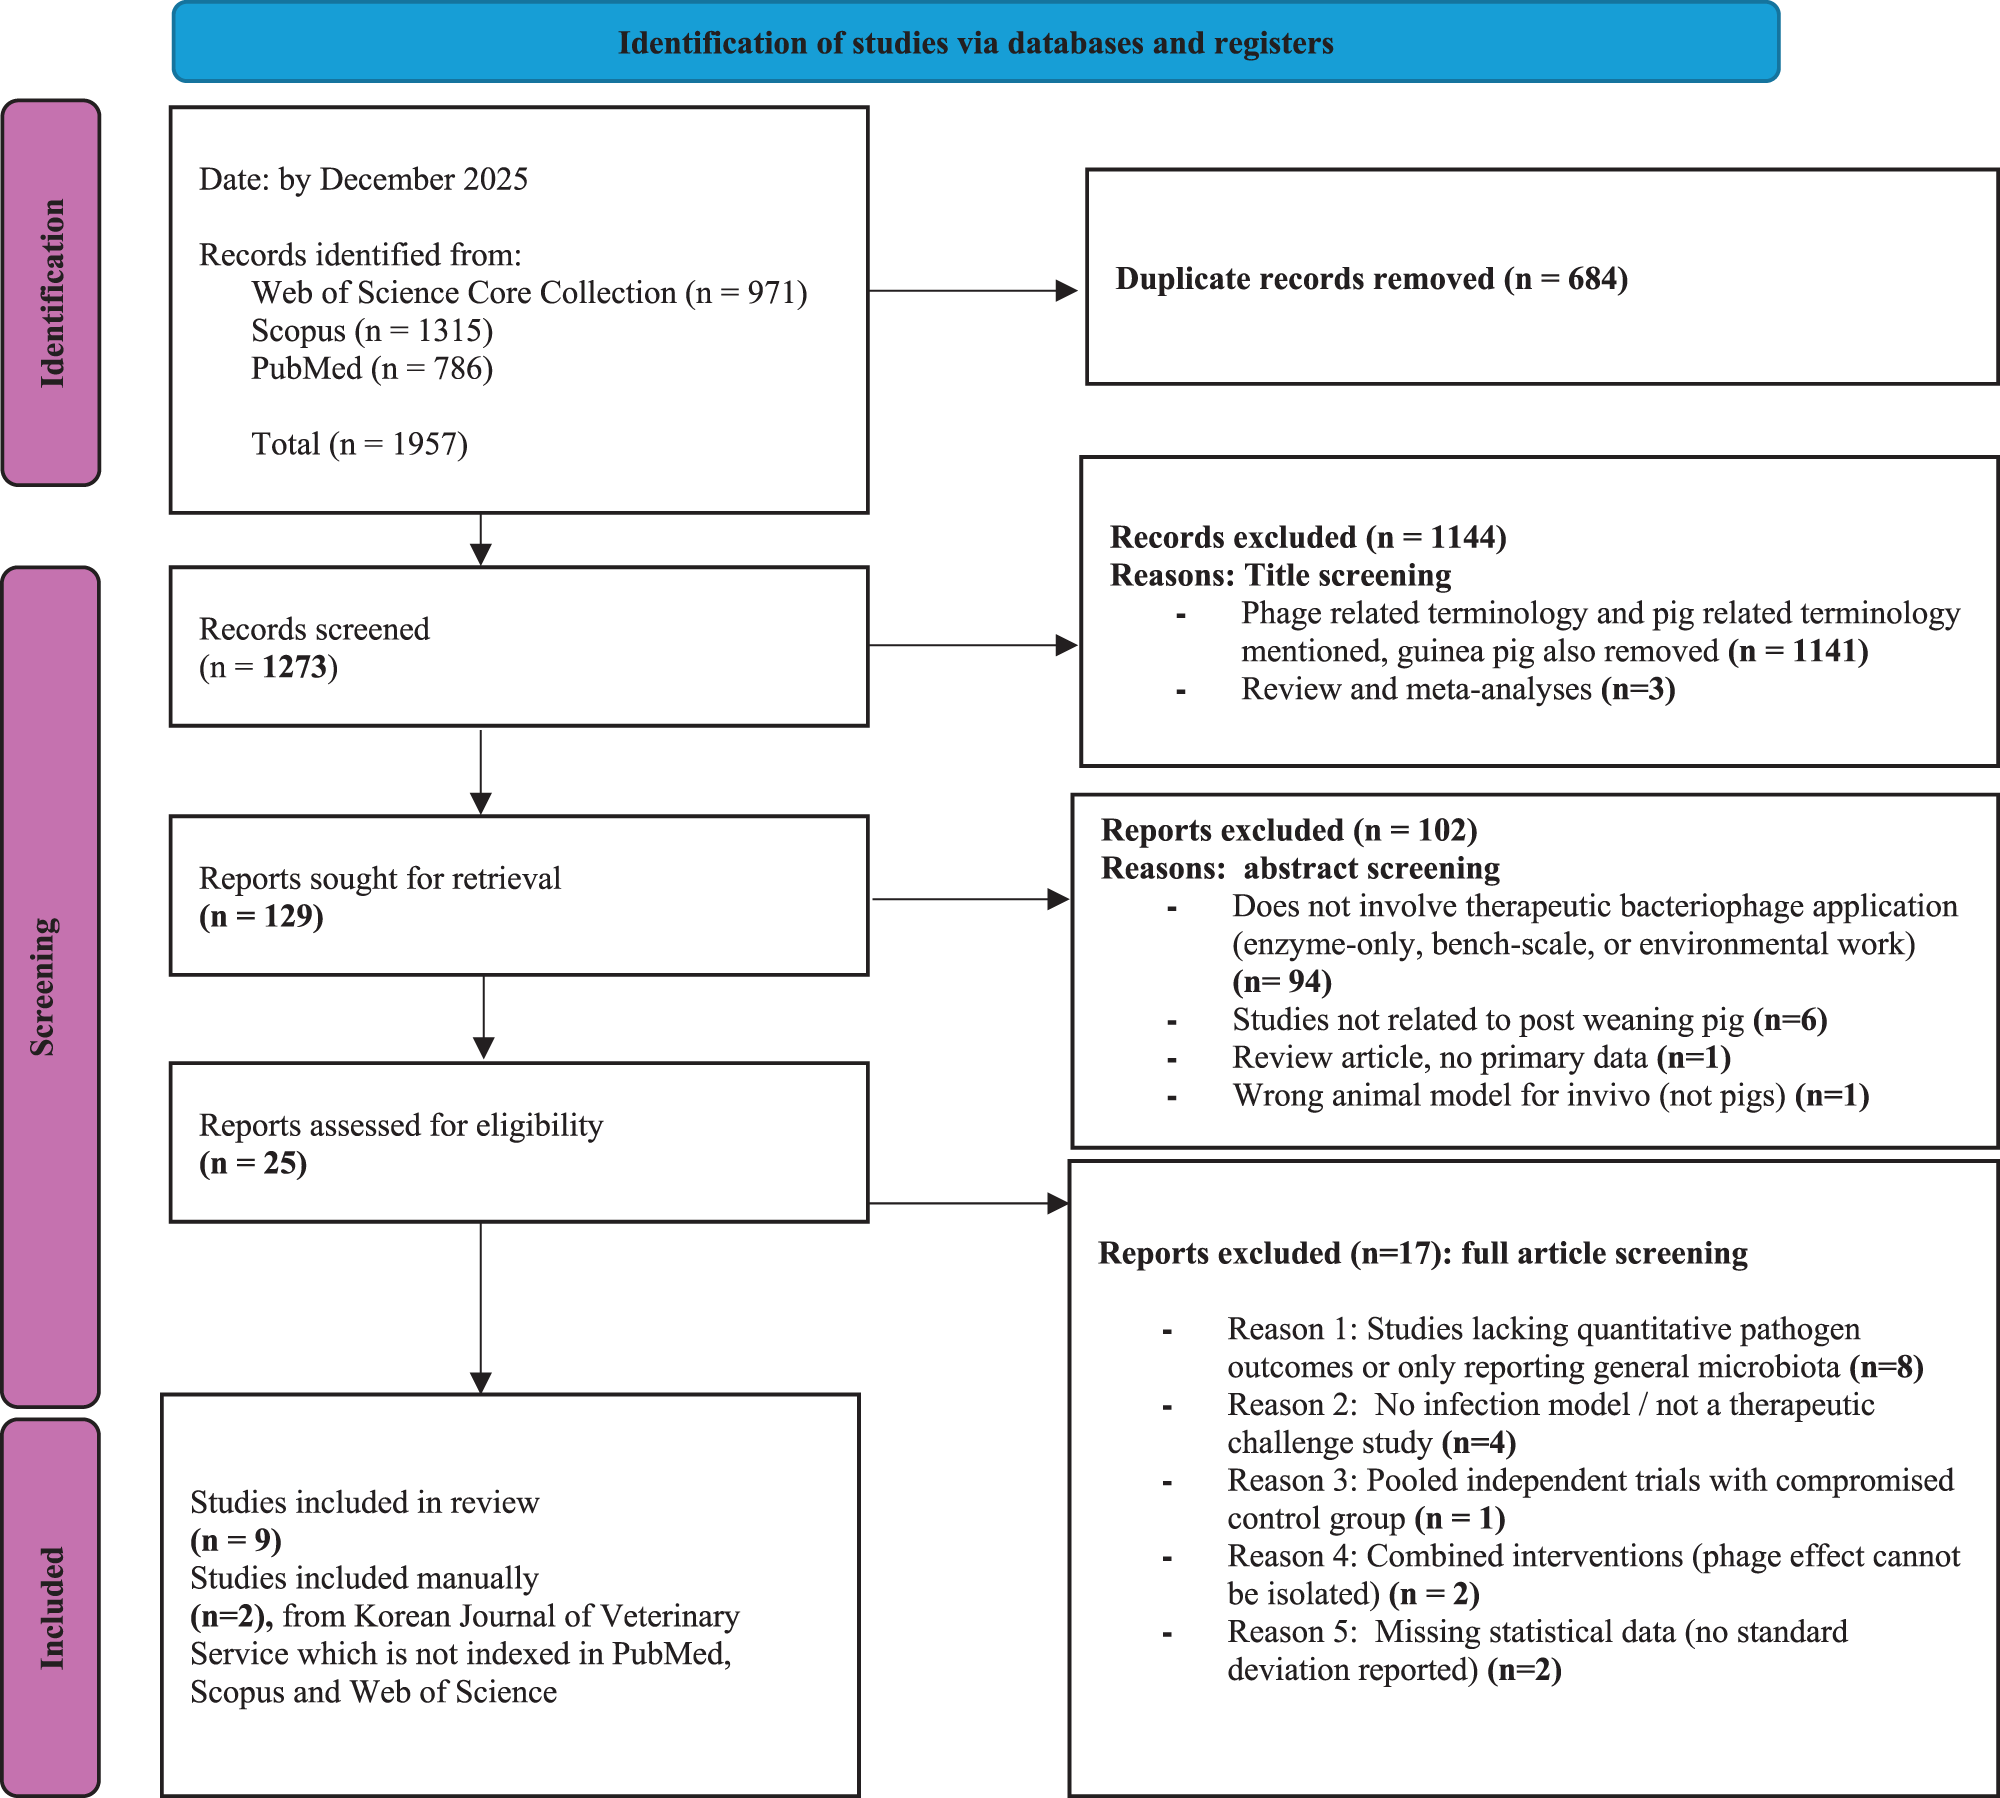
Figure 2 Long description
The diagram details the study selection process via databases and registers. Identification: By December 2025, 1,957 records were identified from Web of Science Core Collection (971), Scopus (1,315) and PubMed (786). After removing 684 duplicates, 1,273 records were screened. Screening: 1,144 records were excluded due to phage-related terminology and pig-related terms (1,141) and review/meta-analyses (3). 129 reports were sought for retrieval, with 102 excluded for reasons such as non-therapeutic bacteriophage application (94), non-post weaning pig studies (6), review articles with no primary data (1) and incorrect in vivo models (1). 25 reports were assessed for eligibility, with 17 excluded due to reasons like lacking quantitative pathogen outcomes (8), no infection model (4), compromised control groups (1), combined interventions (2) and missing statistical data (2). Included: 9 studies were included in the review, with 2 additional studies identified manually from the Korean Journal of Veterinary Service, not indexed in PubMed, Scopus and Web of Science.
Analysis of raw data
Overview of raw dataset
This meta-analysis compiled data from 11 independent studies (Appendix A), yielding a total of 85 treatment versus control comparisons, each representing a distinct sampling event. The dataset encompasses a wide range of biological, methodological, and experimental variables relevant to phage therapy, allowing for an assessment of how phage performance may differ across conditions. Key moderators included challenge type (E. coli, N = 55; Salmonella, N = 30), which enabled examination of whether phage efficacy varies by challenge pathogen. Similarly, variation in phage administration method (infeed per kg, N = 53; oral gavage, N = 30; infeed per day, N = 2) and challenge pattern (six distinct combinations of dose intensity and timing) reflect the diversity of delivery strategies and infection pressures common in piglet studies. Dose-route combinations (six integrated levels reflecting phage frequency, dose, and administration method) further allowed us to explore how treatment design influences outcomes. Other moderators such as phage type (cocktail, N = 47; single, N = 38), encapsulation status (encapsulated, N = 6; non-encapsulated, N = 79), and timing of phage administration (prophylactic, N = 74; therapeutic, N = 11) capture important biological factors that may contribute to treatment success or variability. Differences in sampling time (0–24 h, N = 21; 24–48 h, N = 17; >48 h, N = 47) and quantification method (quantitative polymerase chain reaction [qPCR], N = 60; serial dilution for CFU counts, N = 25) also introduce methodological heterogeneity and were considered when interpreting the results. Bacterial load measurements were collected from seven anatomical sites, with fecal samples most frequently reported (N = 49), followed by ileum contents, jejunum contents, cecum contents, colon contents, lymph node, and duodenum contents. This anatomical variation provides insight into bacterial dynamics across different parts of piglet gut, strengthening the ecological relevance of the dataset while also introducing additional layers of variability that the meta-analysis must account for.
Variability of outcome by measurement method (qPCR vs. serial dilution)
Before conducting the meta-analysis, we assessed whether the bacterial quantification method could influence the observed treatment effects. The influence of the bacterial quantification method on log10 reductions was evaluated by comparing qPCR and serial dilution techniques for CFU counts. Descriptive analysis showed that most bacterial measurements were performed using qPCR (70.6%, N = 60), whereas serial dilution plating accounted for 29.4% (N = 25) of the comparisons. Studies using qPCR reported an average log₁₀ reduction of −1.15 ± 1.26 (median −0.98), corresponding to an average predicted reduction of 90%. In comparison, serial dilution methods showed a slightly smaller mean reduction (–1.00 ± 1.06; median −0.92) with an average predicted reduction of 84%. Both methods, therefore, produced comparable average log₁₀ reductions and similarly high proportions of reductions (Table 2). A comparison between the two methods showed no statistically significant difference (p > 0.05). This consistency suggests that the reduction of bacterial load following phage treatment was robust across measurement approaches. Consequently, combining studies that used different quantification techniques is unlikely to introduce substantial methodological bias, supporting the integration of qPCR- and serial dilution–based data in the meta-analysis. The visual agreement between the two measurement techniques further supports this conclusion (Fig. 3).
Mean log₁₀ fold change (± SD) and predicted reduction measured by qPCR and serial dilution.
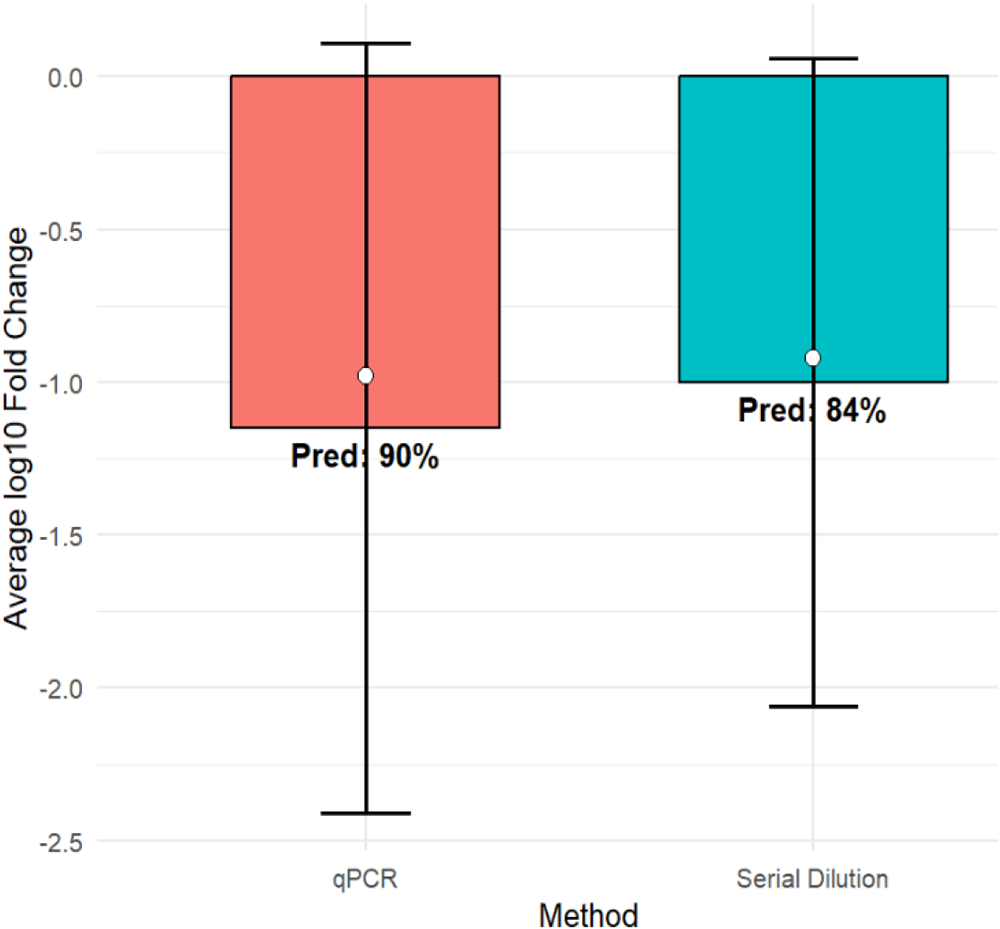
Figure 3 Long description
The chart is titled by its axis labels. The horizontal axis is labeled Method, with two categories: qPCR and Serial Dilution. The vertical axis is labeled Average log superscript 10 Fold Change, extending from 0.0 to negative 2.5. Each bar represents the average log superscript 10 fold change for each method. A marker within each bar indicates a point estimate and error bars extend above and below each bar to show the spread of values. For qPCR, the bar extends to approximately negative 1.2, with the marker at approximately negative 1.0. The error bar extends from approximately positive 0.1 to approximately negative 2.5. The label Pred 90 percent is shown on this bar. For Serial Dilution, the bar extends to approximately negative 1.0, with the marker at approximately negative 0.9. The error bar extends from approximately positive 0.1 to approximately negative 2.1. The label Pred 84 percent is shown on this bar. Both methods show negative average log superscript 10 fold change values of similar magnitude, with qPCR showing a slightly larger bar extent and a wider error bar range compared to Serial Dilution. The Pred labels indicate the predicted reduction percentage associated with each method, with qPCR at 90 percent and Serial Dilution at 84 percent.
Moderator-specific meta-analysis results
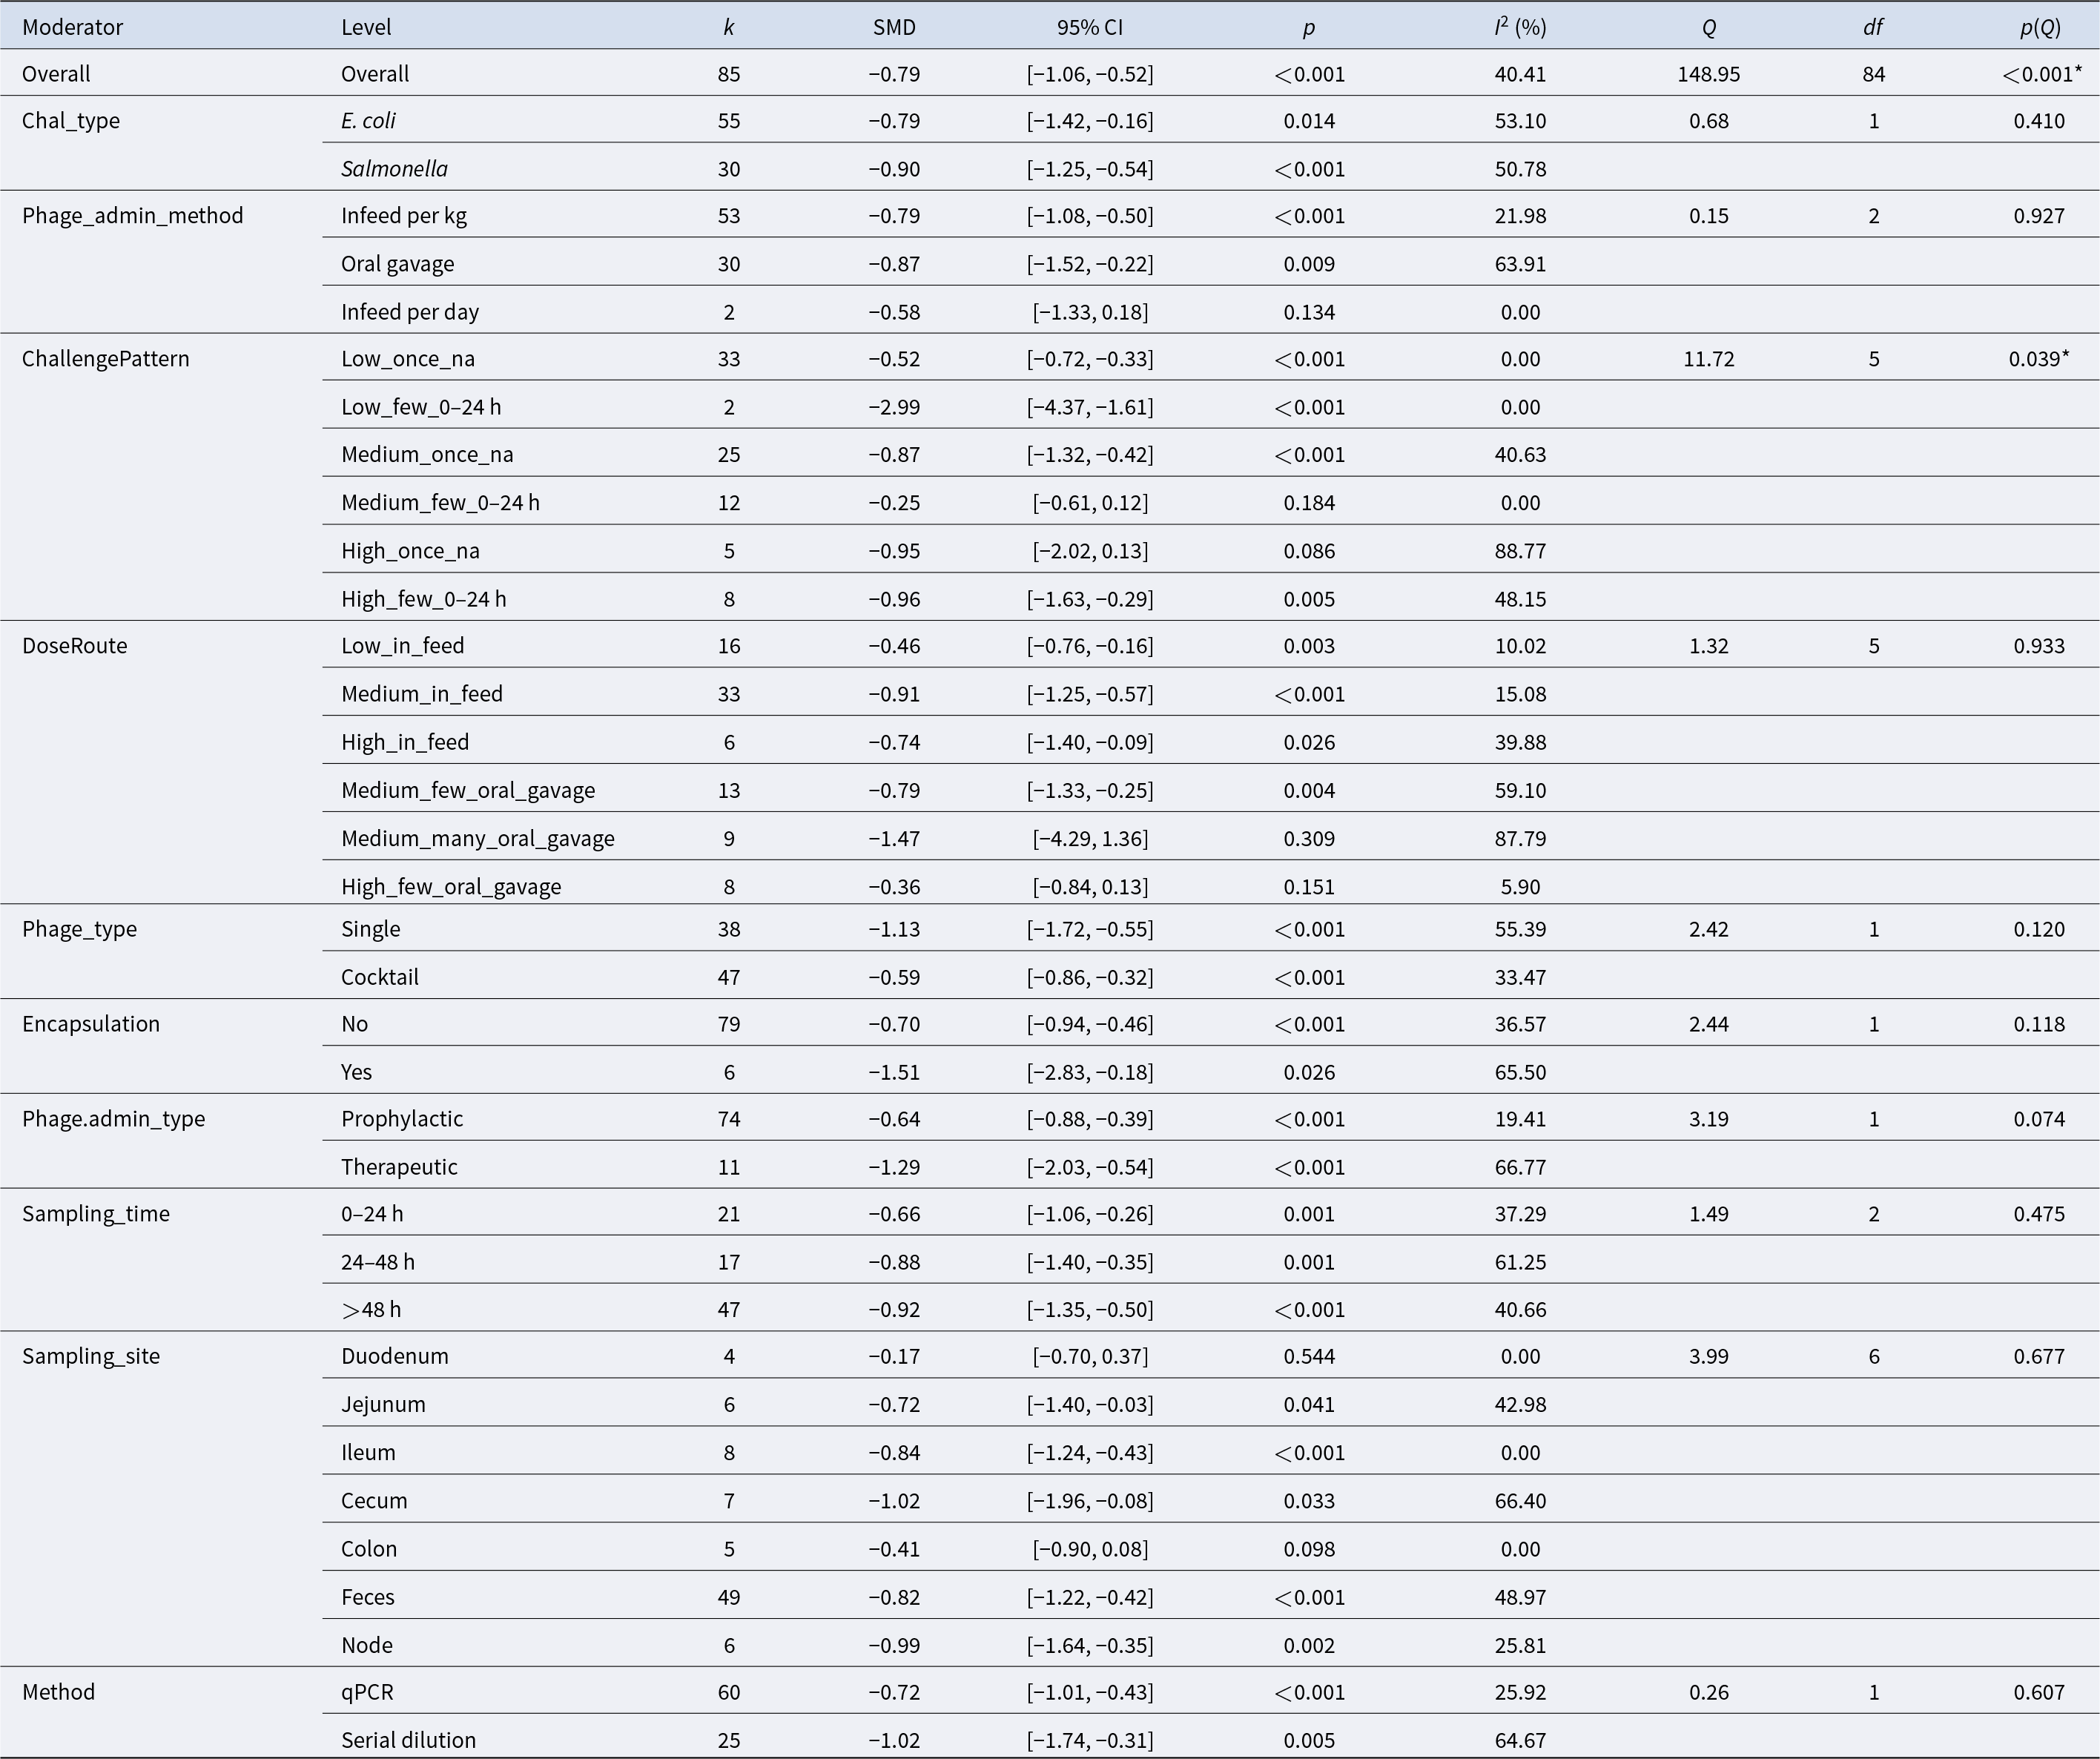
Table 2 Long description
Moderator subgroup meta-analysis results report pooled standardized mean differences (SMDs) with 95% confidence intervals, p-values, and heterogeneity statistics for each subgroup. Overall, 85 effect sizes yield a negative pooled effect (SMD −0.79, 95% CI −1.06 to −0.52; p<0.001) with moderate heterogeneity (I2 40%). By challenge type, effects are negative for both E. coli (−0.79) and Salmonella (−0.90), with stronger statistical support for Salmonella. Administration method is negative for in-feed per kg (−0.79) and oral gavage (−0.87), while the small in-feed per day subgroup (k=2) is not statistically clear (CI crosses 0). Challenge pattern varies widely: the largest reduction appears in “Low_few_0–24 h” (−2.99; k=2), whereas “Medium_few_0–24 h” is near zero and not significant (−0.25). Dose/route shows generally negative effects across in-feed and oral-gavage categories, but some small, high-heterogeneity gavage subgroups are inconclusive (e.g., “Medium_many_oral_gavage” CI crosses 0). Single-phage studies show a more negative pooled effect (−1.13) than cocktails (−0.59); encapsulated studies (k=6) are more negative (−1.51) than non-encapsulated (−0.70). Therapeutic administration is more negative (−1.29) than prophylactic (−0.64), and later sampling (>48 h) remains negative (−0.92). Sampling site effects are mostly negative, with feces (k=49; −0.82) dominating the evidence; duodenum is not significant (−0.17). Measurement method differs: serial dilution is more negative (−1.02) than qPCR (−0.72), and several subgroups show substantial heterogeneity, so small-k and high-I2 results should be interpreted cautiously.
k – number of effect sizes contributing to each subgroup estimate.
SMD – pooled standardized mean difference within each subgroup, representing the estimated effect size for that category.
95% CI – 95% confidence interval around the pooled SMD.
p – p-value testing whether the pooled SMD within each subgroup differs from zero (null hypothesis: SMD = 0).
I 2 (%) – proportion of total variability in observed effect sizes attributable to between-study heterogeneity within each subgroup, after accounting for sampling variance.
Q – Cochran’s Q statistic assessing residual heterogeneity within each subgroup.
df – degrees of freedom for the Q test (typically k − 1).
p(Q) – p-value for Cochran’s Q test evaluating whether significant heterogeneity remains within each subgroup, (* = p < 0.05, ** = p < 0.001).
Distribution of raw data
Descriptive summaries of log₁₀ fold-change values were generated across all experimentally defined moderators to characterize patterns of pathogen reduction prior to meta-analysis (Table 1). These moderators captured biologically relevant sources of variation, including challenge type, phage administration method, dose–route combinations, phage type, encapsulation, administration timing, sampling time, sampling site, and detection method. This descriptive assessment was intended to characterize preliminary patterns in pathogen reduction rather than to support causal inference. Across pathogen types, both E. coli and Salmonella challenges showed predominantly negative mean fold changes (−0.90 and −1.48, respectively) with high proportions of reductions (Pred = 86.7–89.1%), and although reductions were numerically larger for Salmonella, the difference was not statistically significant. Challenge pattern was the only moderator showing a statistically significant overall effect (p < 0.05). The Medium_once_na pattern – representing a dose challenge from 3 × 10⁸ to 5 × 10⁹ CFU administered once – produced the largest mean reduction (MeanFC = −1.66; Pred = 88%) and differed significantly from the High_few_0–24 h pattern (MeanFC = −0.39; Pred = 87.5%), which involved challenge dose more than 5 × 10⁹ CFU administered two to four times within 24 h. This contrast suggests that a single medium-dose exposure may allow phage treatment to achieve greater apparent reductions than repeated high-dose exposures, which may generate more severe or persistent infections. Phage administration method showed broadly comparable mean reductions across infeed and oral gavage delivery (−0.91 to −1.22; Pred = 76.7–100%), with no significant differences.
Dose–route combinations exhibited numerical variation but no significant overall effect. Phage type and encapsulation status showed similar patterns, with phage cocktails and single phages producing comparable mean reductions (MeanFC = −1.03 and −1.21, respectively), and encapsulated phages showing numerically larger but non-significant reductions (MeanFC = −1.42; Pred = 100%; N = 6) compared with non-encapsulated phages (MeanFC = −1.09; Pred = 87.3%; N = 79). Prophylactic and therapeutic administration yielded nearly identical mean reductions (−1.11 vs. −1.09) with high proportions of reductions (Pred = 87.8–90.9%). Sampling time and sampling site were not significantly associated with fold change, although samples collected >48 h posttreatment showed numerically larger and more consistent reductions (MeanFC = −1.23; Pred = 95.7%), and samples from ileum, jejunum, and lymph nodes similarly exhibited strong and uniform reductions (MeanFC = −1.53, −1.20, and −1.41; Pred = 100% for all three sites). Detection method also showed no significant differences, with qPCR and serial dilution producing similar mean reductions (−1.15 vs. −1.00). Overall, these descriptive patterns highlight substantial heterogeneity in pathogen reduction outcomes across experimental conditions. Although most moderators showed clear numerical trends, only challenge pattern demonstrated a statistically significant association with fold change, and large within-moderator variability (Standard deviation of the fold change (SDFC) up to 2.07) indicates that reductions are not uniform across studies. The predominance of negative fold-change values across nearly all moderator levels (Pred generally > 75%) provides a consistent directional signal favoring phage-associated reduction, but the overlap among moderator categories and the variability in experimental design underscore the need for multilevel meta-analytic modeling to partition variance and formally evaluate moderator effects.
Meta-analysis – General results
Overall pooled effect
A multivariate multiple linear regression model was fitted to evaluate log-transformed reductions in pathogen load across 85 comparisons from 11 independent studies. The model revealed a significant overall effect of bacteriophage treatment on pathogen reduction (pooled SMD = −0.79, SE = 0.1311, z-statistic [z] = −5.99, p < 0.001), with a 95% CI ranging from −1.06 to −0.52. Although this pooled estimate is expressed on a standardized scale, it is directionally consistent with previously reported raw log-scale reductions of similar biological magnitude (−1.06 log₁₀ CFU/g, p < 0.0001) across 576 observations (Desiree et al. Reference Desiree, Mosimann and Ebner2021). While the two effect sizes are not numerically comparable due to differences in scaling, both indicate a substantial and statistically robust decrease in bacterial load following phage treatment.
Variance component estimates indicated that heterogeneity was primarily distributed across study- and group-level random effects. The between-study (τ 2₁ = 0.0361) and between-group (τ 2₂ = 0.0361) variance components contributed equally to the total random-effects variance, each accounting for 14.56% of the total (prop_τ 2), whereas sampling-level variance was negligible (τ 2₃ = 0.0000; prop_τ 2₃ = 0%). Partitioning of total heterogeneity (I 2) across model levels indicated that 5.89% of the total observed variance was attributable to between-study heterogeneity (I 2₁), 5.89% to between-group heterogeneity (I 2₂), and 0% to sampling-level heterogeneity (I 2₃), yielding an overall I 2_total of 40.41%. The Cochran’s Q-test indicated significant residual heterogeneity (Q(84) = 148.95, p < 0.001), suggesting that variability in effect sizes exceeded that expected from sampling error alone. Collectively, these findings support the use of a multilevel modeling framework and indicate that meaningful heterogeneity arises at both the study and group levels, despite a moderate overall level of inconsistency.
Publication bias and sensitivity analysis
Potential publication bias was assessed using funnel plots and Egger’s regression. Visual inspection of the funnel plot suggested slight asymmetry, with fewer studies in the lower-left region, which could indicate underreporting of smaller studies with negative effects (Fig. 4). However, Egger’s test did not detect significant small-study effects (t = −0.30, df = 9, p = 0.77) providing no statistical evidence of publication bias.
Funnel plot of effect size (SMD) of pathogen count.
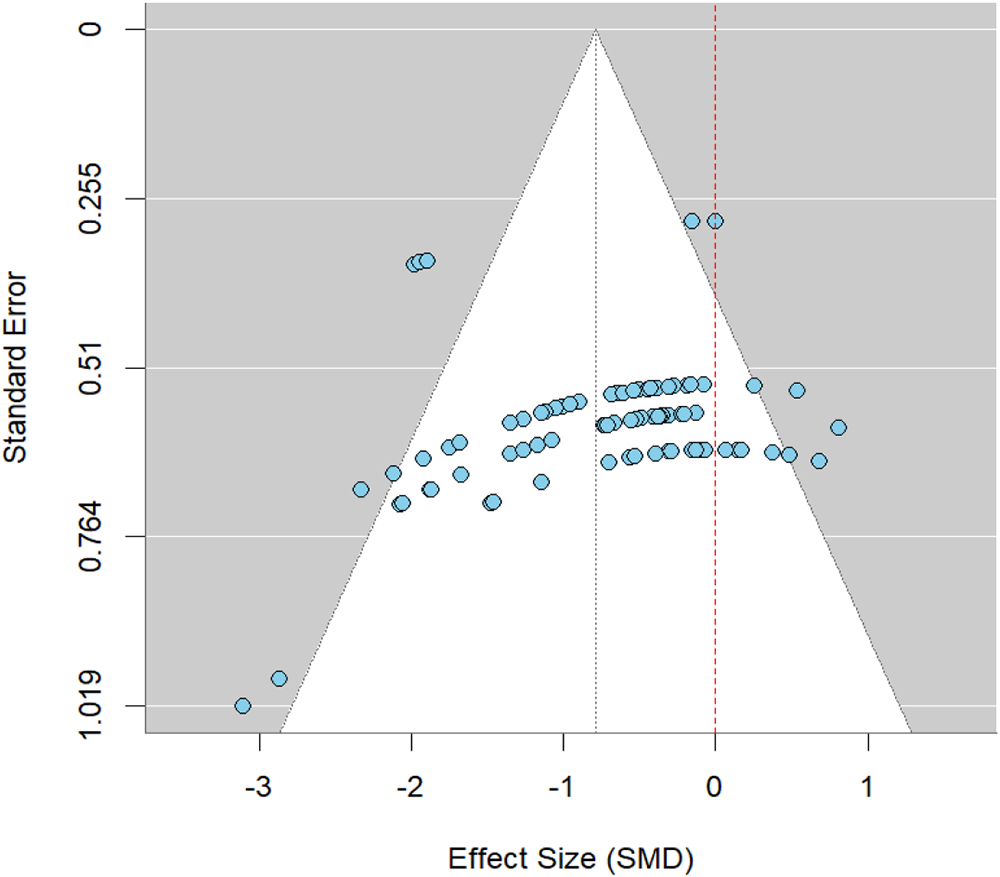
Figure 4 Long description
A scatter plot with the horizontal axis labeled Effect Size (SMD). The visible tick labels on the horizontal axis are negative 3, negative 2, negative 1, 0 and 1. The vertical axis is labeled Standard Error. The visible tick labels on the vertical axis are 0, 0.255, 0.51, 0.764 and 1.019. Multiple circular data points are plotted. A triangular funnel-shaped region is drawn around the points, with the apex near the top of the plot and the base widening toward the bottom. A vertical dashed reference line is drawn near the 0 mark on the horizontal axis. The plotted points are densest around effect size values between negative 1 and 0 and standard error values between about 0.51 and 0.764. A smaller number of points appear at more negative effect sizes, including points near negative 3. Points are sparse near effect size 1.
Influential observations were identified using two complementary approaches. Standardized residuals at the effect-size level (|z| > 2) flagged three paired effect sizes (2, 62, 77), and LOO analysis at the study level flagged four studies (5, 6, 8, 10). The residual-identified effect sizes were retained as they did not reflect data or methodological errors.
The primary multilevel meta-analysis (k = 85) yielded an SMD of −0.79 (95% CI: −1.04 to −0.53, p < 0.0001). Excluding the four LOO-influential studies (k = 51) produced a pooled SMD of −0.76 (95% CI: −0.96 to −0.55, p < 0.0001), representing only a 3.6% change. This minimal difference indicates that the results are robust and not driven by individual studies.
The observed discrepancy between the visual asymmetry of the funnel plot and the nonsignificant Egger’s test likely reflects true heterogeneity rather than publication bias. Variance components at the sampling-event level (σ 2 = 0.14) and at other levels, along with differences in study design, experiment design, and sampling timing and sites, contribute to this heterogeneity. Overall, these findings support the validity of the meta-analytic conclusions, which are based on the full dataset (k = 85), with sensitivity analyses confirming the robustness of the results.
Within each study, a structured SYRCLE assessment of the 11 included studies showed several recurring gaps in methodological reporting, particularly in how randomization, allocation concealment, and blinding were carried out (Supplementary Table S5). These details were seldom described, which led to many domains being rated as unclear rather than indicating definite methodological flaws. In contrast, most studies reported comparable baseline characteristics and had little or no attrition, resulting in low-risk judgments for these areas. A few studies did show clear concerns, mainly related to the absence of caregiver blinding or other potential sources of bias. Because many of the primary outcomes – such as bacterial counts measured by CFU or qPCR – are objective laboratory measures, the influence of subjective bias on the results is likely limited. Taken together, the evidence base is characterized more by incomplete reporting than by consistently high risk of bias. The pooled estimates should, therefore, be interpreted with some caution, but the overall findings remain informative and underline the value of structured risk-of-bias assessment when interpreting preclinical evidence.
Subgroup analysis
To explore potential sources of heterogeneity in bacteriophage efficacy, subgroup meta-analyses were conducted across 10 moderators: challenge type, phage administration method, challenge pattern, dose route, phage type, encapsulation status, phage administration type, sampling time, sampling site, and detection method. Each moderator was entered as a fixed effect in a multilevel meta-regression model while retaining the nested random-effects structure (Study_ID/Study_Group/Sampling_Event). Subgroup-specific pooled effect sizes (SMD), 95% CI, and within-subgroup heterogeneity statistics, along with the omnibus moderator tests (QM and p QM), are all reported in Table 1. Forest plots (Fig. 5) provide a visual summary of subgroup estimates and associated heterogeneity.
Forest plot of moderator-specific meta-analysis, SMD with 95% confidence intervals for all moderator levels.
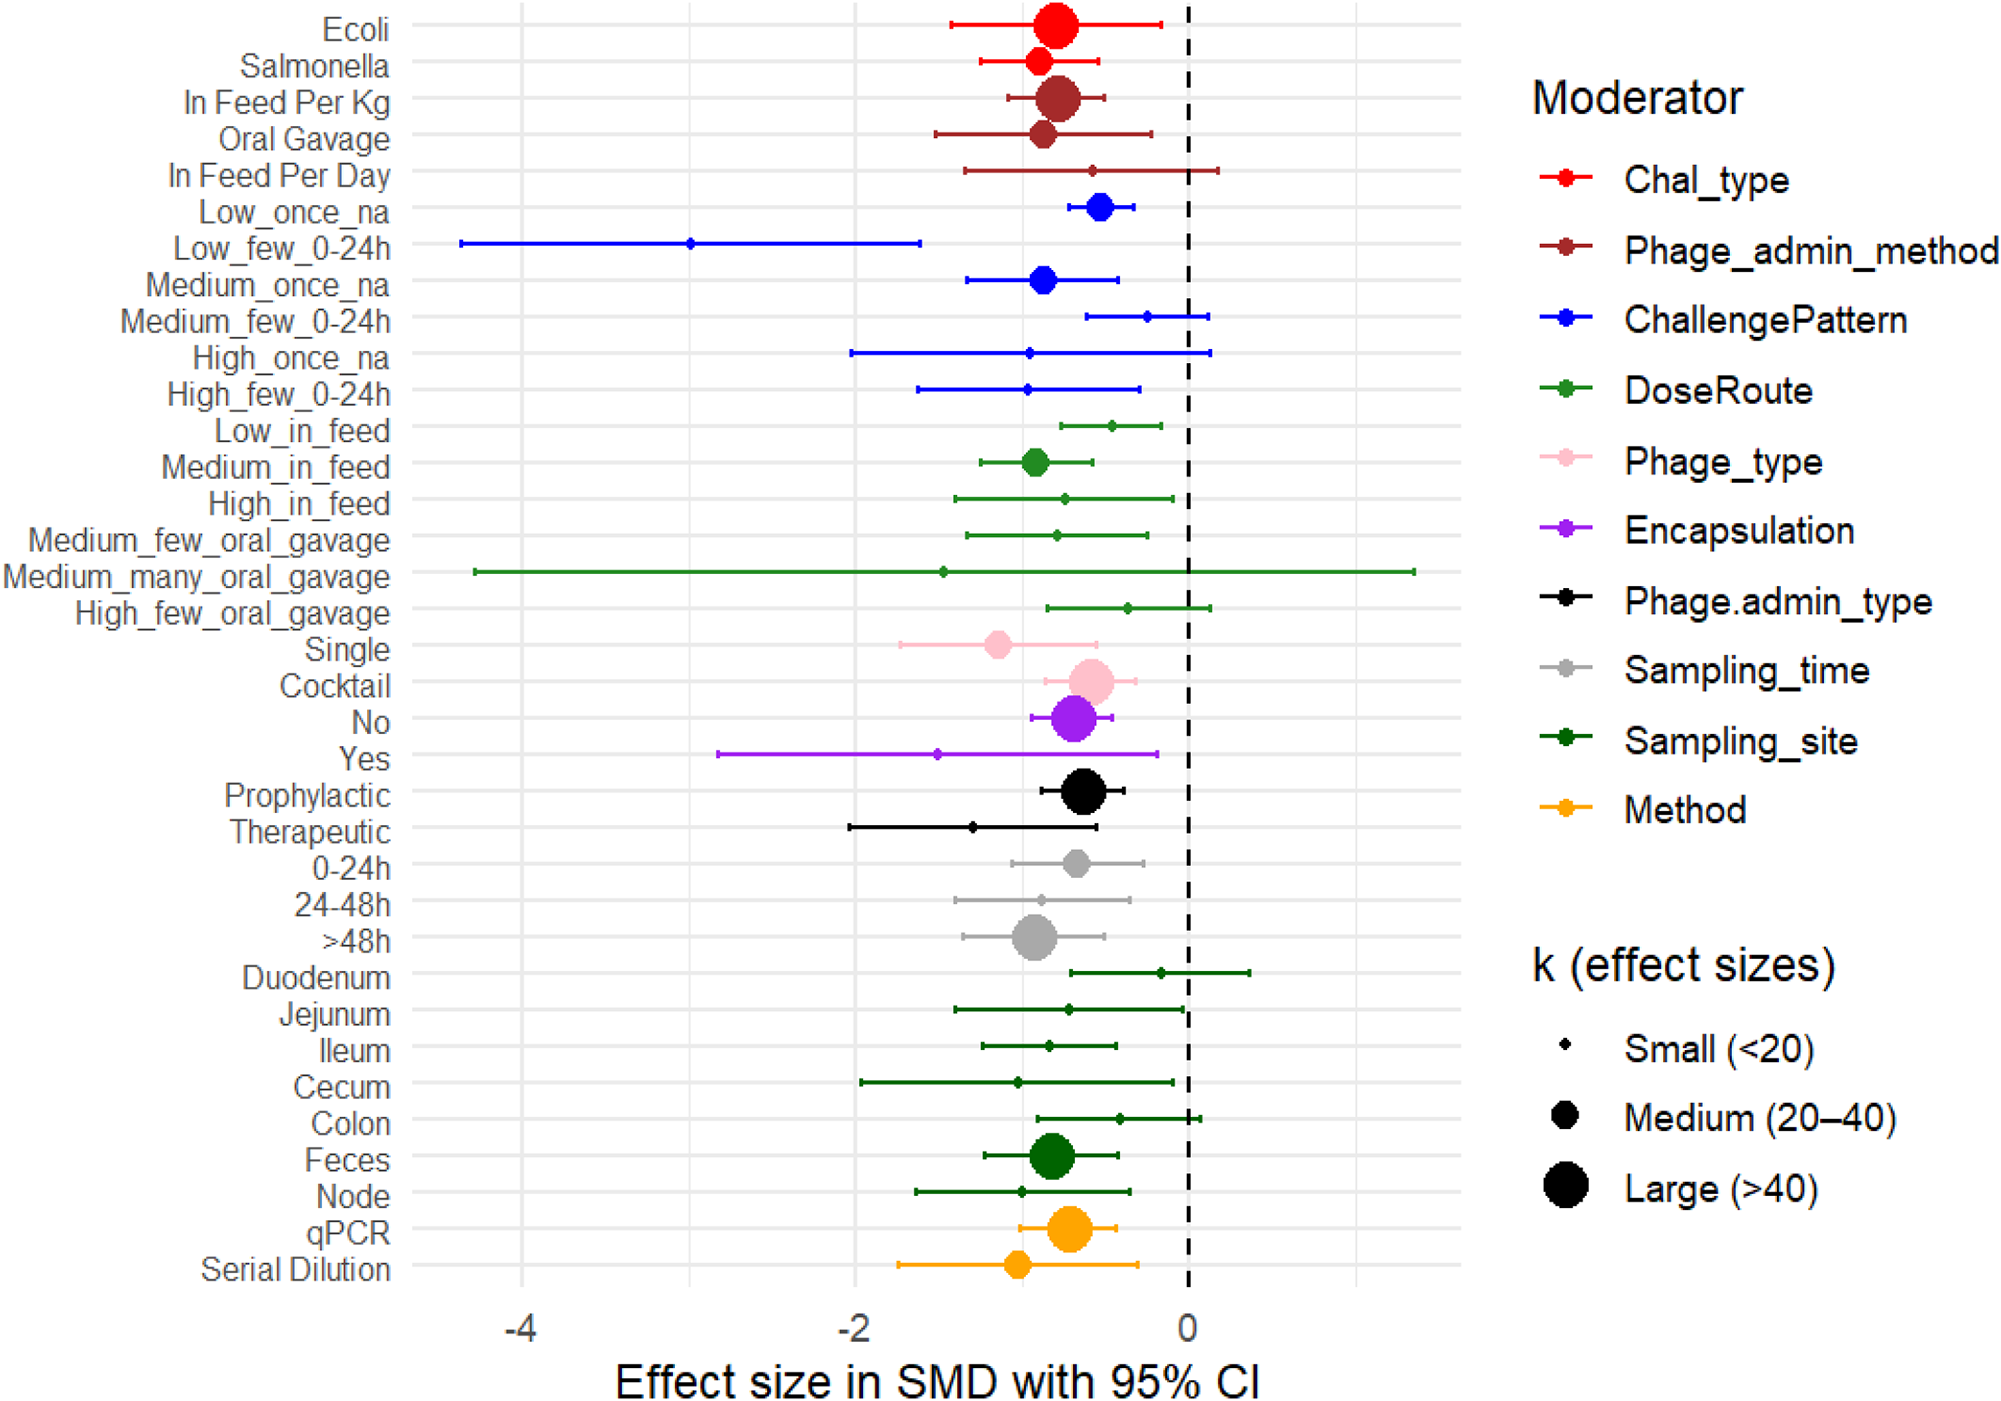
Figure 5 Long description
The forest plot displays effect sizes in standardized mean difference with 95 percent confidence intervals for various moderator subgroups. The x-axis is labeled 'Effect size in SMD with 95 percent CI,' ranging from -4 to 2. The y-axis lists subgroups such as challenge type, phage administration method and others. Each point represents a subgroup's effect size, with colors indicating different moderators: red for challenge type, blue for phage administration method and others as per the legend. Point sizes indicate the number of effect sizes (k), with small, medium and large sizes representing less than 20, 20 to 40 and more than 40, respectively. The null effect line is at zero. Notable subgroups with strong negative effects include 'Salmonella' and 'Oral Gavage,' while 'In Feed Per Day' shows a wide confidence interval. The plot provides a visual summary of subgroup estimates and associated heterogeneity.
Challenge type
Phage treatment significantly reduced pathogen load in both E. coli and Salmonella challenge models. For E. coli, the pooled effect size was −0.79 (95% CI: −1.42 to −0.16; k = 55; p = 0.014), with moderate heterogeneity (I 2 = 53.1%). A slightly larger reduction was observed for Salmonella (SMD = −0.90; 95% CI: −1.25 to −0.54; k = 30; p < 0.001), with comparable heterogeneity (I 2 = 50.8%) (Table 1). These findings indicate that phage therapy effectively reduces bacterial load across both pathogens. The residual heterogeneity between subgroup estimates was not statistically significant (Q = 0.68, p = 0.41), suggesting that variability between the E. coli and Salmonella effect sizes was small relative to within-subgroup variation.
Variance decomposition further highlighted differences in the structure of heterogeneity between pathogens. E. coli studies exhibited substantially higher between-study variance (τ 2₁ = 0.1449; prop_τ 2₁ = 33.3%; I 2₁ = 17.7%) compared to Salmonella studies (τ 2₁ = 0.0147; prop_τ 2₁ = 4.3%; I 2₁ = 2.2%) (Supplementary Table S7). A comparable pattern was observed at the group level, with E. coli also showing higher between-group variance (τ 2₂ = 0.1449; prop_τ 2₂ = 33.3%) than Salmonella (τ 2₂ = 0.0147; prop_τ 2₂ = 4.3%), indicating greater variability in experimental conditions among E. coli studies, whereas both variance components were small in Salmonella, suggesting more consistent study designs. Sampling-level variance was negligible in both subgroups (τ 2₃ = 0). Despite these differences in variance structure, the overall magnitude of heterogeneity was comparable between pathogens (I 2 ≈ 51%), indicating similar levels of total inconsistency across subgroups.
Several biological mechanisms may nonetheless shape pathogen-specific responses to phage treatment. Host receptor recognition and adsorption kinetics are well-established determinants of phage infection efficiency (Bertozzi Silva et al. Reference Bertozzi Silva, Storms and Sauvageau2016; Storms et al. Reference Storms, Arsenault and Sauvageau2010), and differences in the frequency of bacteriophage-insensitive mutant formation have been reported across bacterial species (Levin et al. Reference Levin, Moineau and Bushman2013). Such mechanisms can influence phage–host dynamics and contribute to study-level variability, even if they do not produce clear subgroup differences in pooled effect sizes.
The emergence of bacterial resistance remains a major constraint in phage therapy. Phage cocktails targeting multiple bacterial receptors can mitigate this limitation by reducing the probability of simultaneous resistance. Studies combining E. coli- and Salmonella-specific phages have demonstrated enhanced reductions in Salmonella populations (≈3.2 log CFU/mL) and delayed resistance development, approaching the reductions typically observed in E. coli (≈4.5 log CFU/mL) (Costa et al. Reference Costa, Pereira and Gomes2019). These findings illustrate how receptor diversity and complementary host ranges can strengthen phage formulations, even though our meta-analysis did not detect statistically significant differences in efficacy between pathogens.
Broad-host-range phages isolated from livestock environments further demonstrate the potential of this strategy. Several phages are capable of lysing ≥70% of tested E. coli O157:H7 strains and multiple Salmonella serotypes, with complete bacterial elimination achieved at high multiplicities of infection (MOI), although reductions in certain serotypes remain MOI-dependent (López-Cuevas et al. Reference López-Cuevas, Castro-del Campo and León-Félix2011). Such variability reflects known differences in phage–host interactions and infection kinetics, which may contribute to study-level heterogeneity without producing clear subgroup differences in pooled effect sizes.
Challenge pattern
Challenge pattern was defined by combining bacterial challenge dose (low ≤3 × 10⁸ CFU, medium 3 × 10⁸–5 × 10⁹ CFU, or high >5 × 10⁹ CFU), number of administrations, and dosing interval. The moderator test indicated that challenge pattern significantly influenced phage efficacy (Q = 11.72, df = 5, p = 0.039), suggesting that variation in experimental challenge design contributes to differences in observed treatment outcomes. However, the pattern of effects across categories did not follow a consistent dose–response relationship.
Phage treatment produced the strongest reduction under low challenge dose with multiple administrations (Low_few_0–24 h; SMD = −2.99, 95% CI: −4.37 to −1.61; p < 0.001; k = 2; I 2 = 0%) and under high challenge dose with multiple administrations (High_few_0–24 h; SMD = −0.96, 95% CI: −1.63 to −0.29; p = 0.005; k = 8; I 2 = 48.15%). However, both estimates are based on small numbers of comparisons and should be interpreted cautiously due to limited statistical stability.
Under medium challenge dose, a single administration (Medium_once_na) produced a significant reduction (SMD = −0.87, 95% CI: −1.32 to −0.42; p < 0.001; k = 25), whereas multiple administrations within 24 h (Medium_few_0–24 h) resulted in a nonsignificant effect (SMD = −0.25, 95% CI: −0.61 to 0.12; p = 0.184; k = 12). For low challenge dose with a single administration (Low_once_na), phage treatment produced a moderate and consistent effect (SMD = −0.52, 95% CI: −0.72 to −0.33; p < 0.001; k = 33; I 2 = 0%). In contrast, high challenge dose with a single administration (High_once_na) showed a large but imprecise effect (SMD = −0.95, 95% CI: −2.02 to 0.13; p = 0.086; k = 5), accompanied by very high heterogeneity (I 2 = 88.77%).
Variance decomposition indicated that most challenge pattern subgroups did not provide sufficient information to reliably estimate between-study (τ 2₁) or between-group (τ 2₂) variance components, with values frequently defaulting to zero in sparse categories. This reflects limited sample sizes within several subgroups rather than true homogeneity. The exception was the Medium_once_na subgroup, which showed moderate and stable heterogeneity at both study and group levels (τ 2₁ = 0.0497; τ 2₂ = 0.0497; I 2 = 40.63%), indicating meaningful variability in effect sizes within this category.
Although some subgroups exhibited moderate to high total heterogeneity (High_once_na: I 2 = 88.77%; High_few_0–24 h: I 2 = 48.15%), these estimates were not supported by stable τ 2 components. Overall, these findings suggest that while challenge pattern is associated with variation in phage efficacy, the structure of heterogeneity cannot be reliably partitioned across all levels due to sparse data within several subgroups.
The observed variability across challenge patterns is consistent with established principles of phage–host dynamics. Phage efficacy is influenced by the phage-to-bacterium ratio and the frequency of exposure, with repeated phage administrations at lower bacterial densities increasing the likelihood of effective phage–bacteria encounters before extensive pathogen expansion occurs (Abedon Reference Abedon2011). These dynamics are conceptually consistent with MOI-dependent interactions, which determine the probability that bacterial cells encounter infective phage particles and influence the rate of phage amplification within the host environment. Conversely, phage efficacy may decrease when bacterial and phage population dynamics fall outside the range that supports efficient phage replication and maintenance, particularly when bacterial growth outpaces phage amplification (Berryhill et al. Reference Berryhill, Huseby and McCall2021).
Taken together, these findings highlight that experimental challenge design can meaningfully influence measured efficacy, suggesting that differences in infection models across studies may contribute as much to treatment outcomes as phage characteristics themselves. Importantly, the data do not support a linear relationship in which higher bacterial challenge exposure leads to proportionally greater reductions in pathogen load. Instead, outcomes appear to depend on the interaction between challenge intensity and dosing strategy. Despite this variability, all moderator levels yielded negative SMDs, indicating that phage treatment consistently reduced pathogen burden across studies, even though the magnitude of this reduction varied. To clarify this, future studies should use factorial designs with adequate replication to independently test how challenge dose, dosing frequency, and dosing interval interact to shape phage–host dynamics and treatment efficacy.
Phage administration method
Incorporating phage into feed (infeed per kg) produced a pooled effect size of −0.79 (95% CI: −1.08 to −0.50; k = 53; p < 0.001), with low heterogeneity (I 2 = 21.98%). A comparable reduction was observed with oral gavage (SMD = −0.87; 95% CI: −1.52 to −0.22; k = 30; p = 0.009), although this subgroup showed higher heterogeneity (I 2 = 63.91%). The smallest subgroup (infeed per day; k = 2) showed a nonsignificant effect (SMD = −0.58; 95% CI: −1.33 to 0.18; p = 0.134) with no detectable heterogeneity (I 2 = 0%).
However, the test for subgroup differences indicated no statistically significant moderating effect of administration method on treatment efficacy (Q = 0.15, df = 2, p = 0.927), meaning that the analysis did not detect evidence that administration method alters the magnitude of pathogen reduction. Although heterogeneity differed across subgroups in terms of variance structure, these differences did not translate into significant differences in pooled effect sizes.
Variance decomposition further indicated that infeed per kg studies exhibited lower between-study variance (τ 2₁ = 0.0221; prop_τ 2₁ = 22.57%; I 2₁ = 4.96%), reflecting relatively consistent outcomes across studies. In contrast, oral gavage showed higher between-study variance (τ 2₁ = 0.1425; prop_τ 2₁ = 20.08%; I 2₁ = 12.83%), suggesting greater variability in experimental implementation. Sampling-level variance was negligible across all subgroups (τ 2₃ = 0). Despite these differences in heterogeneity structure, overall heterogeneity did not differ between administration methods in a way that influenced pooled effect sizes, reinforcing that administration route does not significantly moderate phage efficacy.
Several practical and biological factors may contribute to variability within administration methods. Oral gavage delivers phages as a single bolus directly to the stomach, exposing them to abrupt pH changes and digestive enzymes. Feed-based delivery may buffer phages within the feed matrix and release them more gradually, although intake can vary between animals. These differences can influence early phage survival and infection dynamics, yet they did not produce consistent differences in treatment outcomes across studies. A further limitation is that the analysis did not account for the interaction between phage encapsulation and administration method. Encapsulation was unevenly reported and not distributed equally across delivery routes, and because encapsulation can enhance phage survival through the gastrointestinal tract, the inability to model this interaction may have obscured potential differences between feed-based and gavage delivery. In addition, variation in individual feed intake was not reported consistently, preventing us from assessing how differences in actual phage consumption may have contributed to variability within feed-based studies.
From a practical standpoint, feed-based delivery is the more feasible option for on-farm use. It avoids the labor, handling stress, and technical demands associated with oral gavage, and it integrates easily into routine feeding practices. Given similar efficacy and the logistical advantages of feed-based delivery, it may be the more practical option for on-farm use.
Phage dosage by route of administration (DoseRoute)
DoseRoute combined information on phage dose (low ≤10⁸ PFU, medium 10⁸–1010 PFU, or high ≥1010 PFU), phage administration method (infeed or oral gavage), and number of administrations. The test for subgroup differences showed no significant effect of DoseRoute on treatment efficacy (Q = 1.32, df = 5, p = 0.933), indicating that dose–route combinations did not meaningfully influence the magnitude of phage-mediated pathogen reduction.
Infeed administration resulted in significant reductions in pathogen load across all dose levels, including low (SMD = −0.46, 95% CI: −0.76 to −0.16; k = 16; I 2 = 10.02%), medium (SMD = −0.91, 95% CI: −1.25 to −0.57; k = 33; I 2 = 15.08%), and high doses (SMD = −0.74, 95% CI: −1.40 to −0.09; k = 6; I 2 = 39.88%). Oral gavage also produced significant reductions at medium doses administered two to four times (SMD = −0.79, 95% CI: −1.33 to −0.25; k = 13; I 2 = 59.1%), while high doses administered two to four times showed a nonsignificant effect (SMD = −0.36, 95% CI: −0.84 to 0.13; k = 8; I 2 = 5.9%). Medium doses administered more than four times produced an imprecise estimate (SMD = −1.47, 95% CI: −4.29 to 1.36; k = 9; I 2 = 87.8%), reflecting high variability and limited data.
Variance decomposition showed that several subgroups had τ 2 estimates of zero, particularly where sample sizes were small, indicating limited information rather than true absence of heterogeneity. Moderate between-study variance was observed for Medium_in_feed (τ 2₁ = 0.0129) and High_few_oral_gavage (τ 2₁ = 0.0049). Medium_many_oral_gavage showed high heterogeneity (τ 2₁ = 0.7531; I 2 = 87.79), although this estimate was based on few comparisons and should be interpreted with caution. Overall, there was no evidence that DoseRoute modified the overall effect of phage treatment.
Despite these results, this moderator does not account for interactions with pathogen challenge dose, so the analysis cannot determine whether specific dose–route combinations perform differently under low, medium, or high bacterial exposure. The model also reflects the administered phage dose rather than the amount that ultimately reaches the small intestine. Factors such as gastric survival and release kinetics were not incorporated into the present meta-analysis model, although they are known to influence in vivo phage delivery (Vinner et al. Reference Vinner, Richards and Leppanen2019). These delivery-related limitations influence key phage–host interaction processes – such as adsorption, amplification, and the density-dependent thresholds required for effective bacterial clearance – consistent with established principles of phage pharmacokinetics and pharmacodynamics (Abedon Reference Abedon2011).
Overall, the results show that phage dose influences the magnitude of pathogen reduction, but the pattern is not linear and varies across experimental designs. Several moderator levels were represented by a small number of effect sizes, and these estimates – particularly those with wide CIs or τ 2 = 0 – should be interpreted with caution. Future studies should determine how the effective phage dose, defined by the amount that survives digestion and reaches the small intestine, shapes pathogen reduction, and should evaluate dosage in relation to delivery strategies such as encapsulation while keeping the bacterial challenge constant to better capture host–phage interactions.
Phage administration timing (prophylactic vs. therapeutic)
Phage administration timing did not significantly influence treatment outcomes (Q = 3.19, df = 1, p = 0.074). Prophylactic administration (k = 74) produced a moderate and consistent reduction in bacterial load (SMD = −0.64, 95% CI: −0.88 to −0.39; p < 0.001), with low heterogeneity (I 2 = 19.41%). These patterns suggest that prophylactic phage delivery tends to perform more consistently across the included experimental conditions. This consistency is consistent with the biological expectation that pre-exposure may allow phages to establish in the gut before pathogen arrival resulting in predictable protective effects. This interpretation is consistent with broader evidence from other host species. For example, a quail model demonstrated that prophylactic phage administration reduced Salmonella enterica colonization more effectively than post-infection treatment (Ahmadi et al. Reference Ahmadi, Karimi Torshizi and Rahimi2016), supporting the general principle that pre-exposure allows phages to establish before pathogen arrival. Administering phages before bacterial challenge allows them to reach effective concentrations in the gastrointestinal tract and act immediately upon pathogen arrival, preventing early colonization and replication.
Therapeutic administration (k = 11) showed a larger mean effect (SMD = −1.29, 95% CI: −2.03 to −0.54; p < 0.001), but with substantially higher heterogeneity (I 2 = 66.77%). Such variability is biologically plausible. Once infection is established, performance may be influenced by factors such as timing of administration, pathogen load, phage–host match, immune clearance, and the physiological state of the host (Ryan et al. Reference Ryan, Gorman and Donnelly2011).
Together, these findings suggest that prophylactic phage delivery tends to produce more stable and predictable outcomes, whereas therapeutic administration can achieve stronger reductions but with far greater variability. The significant moderator effect indicates that timing of phage application is associated with differences in treatment outcomes.
Phage type
Single-phage formulations produced a greater reduction in bacterial load (SMD = −1.13, 95% CI: −1.72 to −0.55; k = 38; p < 0.001) compared with phage cocktails (SMD = −0.59, 95% CI: −0.86 to −0.32; k = 47; p < 0.001). However, single-phage treatments were associated with higher between-study heterogeneity (τ 2₁ = 0.1098; I 2 = 55.39%), indicating greater variability in effect sizes across experiments. In contrast, cocktail formulations showed lower heterogeneity (τ 2₁ = 0.0104; I 2 = 33.47%), suggesting more consistent outcomes across studies.
Despite these numerical differences, the test for subgroup differences was not statistically significant (Q = 2.42, df = 1, p = 0.12), indicating that phage type (single vs. cocktail) did not explain a significant proportion of the variability in treatment outcomes. Biologically, both single phages and cocktails were effective, as indicated by significant subgroup p-values. Single phages produced stronger average reductions in bacterial load but showed high variability, consistent with their dependence on precise host–phage matching and their susceptibility to resistance. In contrast, cocktails yielded more modest but more consistent effects, reflecting broader host-range coverage and functional redundancy among phages, which reduce the likelihood of resistance emergence (Hosseindoust et al., Reference Hosseindoust, Lee and Kim2017; Gao et al., Reference Gao, Ji and Li2023) .
Encapsulation
Encapsulation of phages was associated with a larger reduction in bacterial load compared with non-encapsulated formulations. Encapsulated phages showed a significant effect (SMD = −1.51, 95% CI: −2.83 to −0.18; k = 6; p = 0.026), but with substantial heterogeneity (I 2 = 65.5%). Non-encapsulated phages also produced a significant reduction in bacterial load (SMD = −0.70, 95% CI: −0.94 to −0.46; k = 79; p < 0.001), with lower heterogeneity (I 2 = 36.57%).
However, the difference between subgroups was not statistically significant (Q = 2.44, df = 1, p = 0.118), indicating that encapsulation did not significantly affect treatment efficacy. The observed differences, therefore, reflect variation in magnitude rather than a true moderator effect.
Variance decomposition showed low between-study variance for non-encapsulated phages (τ 2₁ = 0.02), suggesting relatively consistent effects across studies. Encapsulated phages showed higher variance (τ 2₁ = 0.2189), but this estimate is based on few comparisons and should be interpreted with caution. Overall, encapsulation was associated with a higher average effect size, but there is no statistical evidence that it modifies phage efficacy.
The encapsulation techniques reported were calcium alginate microspheres coated with chitosan (Mao et al. Reference Mao, Wu and Ma2023) and oil-emulsion ionic gelation stabilized with poly-l-lysine (Saez et al. Reference Saez, Zhang and Rostagno2011; Wall et al. Reference Wall, Zhang and Rostagno2010). These alginate-based microencapsulation systems are specifically designed to protect phages from gastric acidity and digestive enzymes while enabling controlled release in the intestinal environment. This protective effect is particularly relevant for oral phage delivery, where premature inactivation in the stomach remains a major barrier to therapeutic success. Supporting this mechanism, previous studies have demonstrated sustained anti-Salmonella efficacy of alginate/CaCO₃-encapsulated phages (Colom et al. Reference Colom, Cano-Sarabia and Otero2015) and have shown that encapsulated phages remain viable under acidic conditions that completely inactivated free phage counterparts (Abdelsattar et al. Reference Abdelsattar, Abdelrahman and Dawoud2019). These mechanistic observations may help explain the larger effect sizes observed for encapsulated formulations in the present meta-analysis, although this interpretation remains limited by the high between-study variability and the relatively small number of available effect sizes. Despite this variability, encapsulation emerged as one of the most promising formulation strategies for enhancing phage therapy efficacy, but its effectiveness requires further evidence to strengthen confidence in this conclusion.
While alginate-based cold gelation remains the most widely used encapsulation approach due to its biocompatibility, low toxicity, and mild gelation abilities (Lai et al. Reference Lai, Azad and Sulaiman2024), recent studies have begun exploring some advanced technologies such as electrospun fibers, liposomes, chitosan nanoparticles, lipid-based nano-carriers, and electrospray (Kaur et al. Reference Kaur, Kumari and Kumari Negi2021; Yue et al. Reference Yue, Xu and Soteyome2025). Future research should prioritize comparative in vivo validation, standardized reporting of encapsulation parameters such as particle size, loading efficiency, release profiles, and scalable manufacturing strategies compatible with regulatory and biosafety requirements to facilitate the translation of encapsulated phage therapies into the animal industry.
Sampling site
Sampling site did not significantly moderate treatment outcomes (Q = 4.06, df = 6, p = 0.669), indicating that differences among anatomical sampling locations did not explain a meaningful proportion of variability across studies. Phage treatment showed significant reductions in several gastrointestinal sites, although not across all sampling locations.
Fecal samples (k = 49) showed a significant reduction in bacterial load (SMD = −0.82, 95% CI: −1.22 to −0.42; p < 0.001) with moderate heterogeneity (I 2 = 48.97%). Significant reductions were also observed in the cecum (SMD = −1.02, 95% CI: −1.96 to −0.08; p = 0.033; I 2 = 66.40%), ileum (SMD = −0.84, 95% CI: −1.24 to −0.43; p < 0.001; I 2 = 0%), jejunum (SMD = −0.72, 95% CI: −1.40 to −0.03; p = 0.041; I 2 = 42.98%), and lymph nodes (SMD = −0.99, 95% CI: −1.64 to −0.35; p = 0.002; I 2 = 25.81%). In contrast, colon (SMD = −0.41, 95% CI: −0.90 to 0.08; p = 0.098) and duodenum (SMD = −0.17, 95% CI: −0.70 to 0.37; p = 0.544) did not show statistically significant effects.
Although numerical differences were observed across sites, including larger reductions in the cecum and lymph nodes and smaller or nonsignificant effects in the proximal intestine, these differences were not statistically supported by the moderator test. Variance decomposition indicated that several subgroups had τ 2 estimates of zero, particularly those with fewer effect sizes, reflecting limited information rather than true absence of heterogeneity. Other sites showed varying levels of between-study variance, such as the cecum (τ 2₁ = 0.2795) and fecal samples (τ 2₁ = 0.0755), suggesting potential differences in study-level variability across anatomical locations. In the context of ETEC infections, the jejunum and ileum are recognized as primary sites of intestinal injury, including villus atrophy, whereas bacterial loads tend to be lower in the cecum and colon (Xu et al. Reference Xu, Jia and Xiao2023). In contrast, Salmonella typically colonizes the ileum, cecum, and colon at high densities early in infection, with epithelial damage frequently observed in the jejunum and ileum (Bellido-Carreras et al. Reference Bellido-Carreras, Argüello and Zaldívar-López2019; Collado-Romero et al. Reference Collado-Romero, Arce and Ramírez-Boo2010). These established colonization patterns may help contextualize the numerical variation observed across sites, as phages are expected to replicate more efficiently at higher host bacterial densities, leading to improved bacterial clearance (Chae Reference Chae2023). Regions with lower bacterial abundance or faster transit, such as the proximal small intestine, may, therefore, show smaller apparent reductions, although this was not directly evaluated here. Fecal samples may reflect phage activity across multiple gut compartments, while physiological factors such as gastric acidity, digestive enzymes, and localized immune responses may contribute to site-specific variability, although these factors were not assessed in this analysis. Because these mechanisms were not directly evaluated in the present meta-analysis, they should be viewed as plausible biological explanations rather than confirmed drivers of the observed patterns.
Sampling time
Sampling time did not significantly moderate treatment outcomes (Q = 1.49, df = 2, p = 0.475), indicating that sampling interval did not explain a meaningful proportion of variability across studies. Phage treatment remained effective across all sampling windows.
At 0–24 h (k = 21), phage treatment produced a significant reduction in bacterial load (SMD = −0.66, 95% CI: −1.06 to −0.26; p = 0.001) with moderate heterogeneity (I 2 = 37.29%). The 24–48 h subgroup (k = 17) showed a slightly larger effect (SMD = −0.88, 95% CI: −1.40 to −0.35; p = 0.001) with higher heterogeneity (I 2 = 61.25%). The >48 h subgroup (k = 47) showed a similar effect (SMD = −0.92, 95% CI: −1.35 to −0.50; p < 0.001) with moderate heterogeneity (I 2 = 40.66%).
Although effect sizes were slightly higher at later sampling times, these differences were not statistically supported by the moderator analysis. Variance decomposition showed moderate between-study variance in the 0–24 h (τ 2₁ = 0.0683) and >48 h (τ 2₁ = 0.0871) subgroups. No stable variance estimate was obtained for the 24–48 h subgroup, likely due to insufficient information to reliably partition between-study heterogeneity within this category despite a moderate number of effect sizes. Overall, there was no evidence that sampling time affected the efficacy of phage treatment, although reductions in bacterial load were consistently observed across all time points. Although sampling time was not a significant moderator in our analysis, previous work has reported stronger effects at 48–96 h posttreatment (Desiree et al. Reference Desiree, Mosimann and Ebner2021). These external findings indicate that sampling timing may influence observed effect sizes in some contexts, but this was not evident in our dataset.
Detection method
Before conducting the meta-analysis, we examined whether the bacterial quantification method could influence the observed treatment effects. Descriptively, most measurements were obtained using qPCR (70.6%, N = 60), whereas serial dilution plating accounted for 29.4% (N = 25). qPCR-based measurements showed an average log₁₀ reduction of −1.15 ± 1.26 (median −0.98), corresponding to an estimated 90% reduction, while serial dilution produced a similar mean reduction (–1.00 ± 1.06; median −0.92) with an estimated 84% reduction. These descriptive patterns suggested broadly comparable reductions across methods, and a direct comparison showed no statistically significant difference (p > 0.05), suggesting that the choice of quantification technique did not introduce detectable systematic bias in this dataset.
The meta-analytic moderator analysis did not indicate a significant effect of detection method on treatment outcomes (Q = 0.26, df = 1, p = 0.607), suggesting that differences between qPCR and serial dilution did not explain a meaningful proportion of variability across studies. Both methods showed significant reductions in bacterial load. qPCR (k = 60) produced an effect size of SMD = −0.72 (95% CI: −1.01 to −0.43; p < 0.001) with low heterogeneity (I 2 = 25.92%) and a relatively small between-study variance (τ 2₁ = 0.0258). Serial dilution (k = 25) showed a larger effect size (SMD = −1.02, 95% CI: −1.74 to −0.31; p = 0.005) but with substantially higher heterogeneity (I 2 = 64.67%) and greater between-study variance (τ 2₁ = 0.1562). Although serial dilution yielded a numerically larger effect, the nonsignificant moderator test indicates that this difference is not statistically supported at the meta-analytic level. Variance decomposition showed a similar structure across methods, with both qPCR and serial dilution exhibiting low contributions from sampling-level variance (τ 2₃ = 0) and comparable proportions of between-study variance relative to total heterogeneity (prop_τ 2 ≈ 0.21–0.22). However, serial dilution displayed substantially greater overall heterogeneity, indicating more variability in effect sizes across studies compared with qPCR. Although no statistically significant differences were observed between quantification methods in the present dataset, previous studies have reported that qPCR may provide improved analytical precision and reproducibility compared with culture-based approaches (Ferdous et al. Reference Ferdous, Hossain and Tulsiani2016), particularly when absolute quantification is based on standard curves generated from genomic DNA dilutions rather than serially diluted cell suspensions. These improvements have been attributed to reduced DNA loss during sample preparation and greater consistency in template input, whereas culture-based serial dilution relies on CFU enumeration and can be affected by plating efficiency, cell aggregation, and viable but non-culturable states. In the present analysis, neither qPCR nor culture-based methods showed evidence of systematically influencing estimated phage efficacy, and moderator analysis confirmed that quantification method did not significantly explain heterogeneity across studies.
Conclusion
This meta-analysis demonstrates that phage therapy tends to reduce bacterial load in piglets, with an overall pooled effect size of SMD = −0.79 (95% CI: −1.06 to −0.52, p < 0.001; k = 85). This reflects a moderate and statistically reliable decrease in pathogen burden across diverse experimental conditions in piglets. Although heterogeneity was significant (Q(84) = 148.95, p < 0.001; I 2 = 40.41%), variance decomposition indicated that most variability originated from between-study and between-group differences (τ 2 = 0.0361 each).
Challenge pattern showed a statistically significant association with effect sizes, though interpretation is limited by sparse subgroup (Q = 11.72, df = 5, p = 0.039), and the absence of a clear dose–response trend, suggesting that interactions between challenge intensity and dosing frequency may contribute to variability.
Other moderators were not statistically significant and, therefore, did not explain a meaningful proportion of heterogeneity. Challenge type showed no significant moderation effect (Q = 0.68, df = 1, p = 0.410), with broadly comparable effects between E. coli (SMD = −0.79; I 2 = 53.10%) and Salmonella (SMD = −0.90; I 2 = 50.78%). Phage administration method was also not significant (Q = 0.15, df = 2, p = 0.927), although infeed delivery (k = 53; SMD = −0.79; I 2 = 21.98%) appeared more consistent than oral gavage (k = 30; SMD = −0.87; I 2 = 63.91%). Encapsulation did not significantly moderate outcomes (Q = 2.44, df = 1, p = 0.118), despite numerically larger effects in encapsulated formulations (SMD = −1.51; I 2 = 65.50%) compared with non-encapsulated phages (SMD = −0.70; I 2 = 36.57%). Phage type was also not significant (Q = 2.42, df = 1, p = 0.120), with single phages (SMD = −1.13; I 2 = 55.39%) showing larger but more variable effects than cocktails (SMD = −0.59; I 2 = 33.47%). Administration timing was not statistically significant (Q = 3.19, df = 1, p = 0.074), although prophylactic administration (k = 74; SMD = −0.64; I 2 = 19.41%) showed more consistent outcomes than therapeutic administration (k = 11; SMD = −1.29; I 2 = 66.77%). Sampling time was not significant (Q = 1.49, df = 2, p = 0.475), and sampling site also did not significantly moderate outcomes (Q = 3.99, df = 6, p = 0.677). Detection method showed no significant moderation effect (Q = 0.26, df = 1, p = 0.607), with comparable results between qPCR (SMD = −0.72; I 2 = 25.92%) and serial dilution (SMD = −1.02; I 2 = 64.67%).
Assessment of publication bias did not indicate small-study effects (Egger’s test: p = 0.77), although slight funnel-plot asymmetry suggests that some degree of reporting bias cannot be fully excluded. Sensitivity analyses showed that the overall pooled effect was robust, with only a 3.6% change after excluding four LOO-identified studies. Despite a comprehensive multi-database search strategy, the possibility of missing unpublished or non-indexed studies remains an inherent limitation of preclinical systematic reviews. Incomplete reporting in primary studies, particularly regarding randomization, allocation concealment, and blinding, further limits the ability to fully assess internal validity. Several moderator subgroups contained very few effect sizes, resulting in wide CIs and reduced power to detect true differences. In addition, moderators were evaluated independently, and potential interactions among variables were not modeled, which may contribute to unexplained heterogeneity. The multilevel variance partitioning approach also has inherent limitations, as variance components may be unstable in sparsely populated subgroups and τ 2 estimates can be sensitive to small sample sizes and model specification. Finally, phage therapy is inherently constrained by host specificity, and variation in phage–host matching across studies was not systematically quantified; this strain-level variability may, therefore, contribute to residual heterogeneity in treatment outcomes.
Future research should focus on areas where the evidence base remains limited or uncertain. Several moderator categories were represented by few effect sizes – such as therapeutic dosing, encapsulated phage, and specific challenge patterns – highlighting the need for studies with stronger replication. Standardized comparisons of dose-delivery methods and well-designed time-course studies would help clarify how phages behave in the gut and how bacterial loads change under typical postweaning feeding conditions. Because moderators were assessed independently, future experiments should evaluate how key factors interact, such as timing of administration, delivery route, formulation type, and challenge intensity, to better explain remaining variation in treatment responses. There is also a practical need to understand how phages function alongside other feed additives and dietary strategies commonly used in piglet production systems. Future studies should also monitor the development of phage-resistant bacterial strains and assess how resistance dynamics interact with diet composition, gut microbiota shifts, and overall host resilience. Finally, more explicit characterization of phage–host matching and strain-level susceptibility is needed, as these biological factors likely influence treatment success in vivo.
Supplementary material
The supplementary material for this article can be found at https://doi.org/10.1017/anr.2026.10045.
Author contributions
Tsiamidy Onjatina Tolojanahary (conceptualization, data curation, formal analysis, investigation, methodology, writing – original draft, writing – review and editing), Mingli Xu (data curation, formal analysis, investigation, methodology, writing – original draft), Song Liu (conceptualization, project administration, resources, supervision, writing – review and editing), Chengbo Yang (conceptualization, project administration, resources, supervision, writing – review and editing).
Funding statement
This work was supported by the Swine Research Cluster 4 program cofounded by Agriculture and Agri-Food Canada (AAFC): Swine Innovation Porc (SIP, Project #22181), Manitoba Pork Council (Project #59991), and AB Neo (Project # 61292). All the authors read and agree to the content of this paper and its publication.
Conflict of interest
All authors declare that they have no conflict of interest.
Appendix A. References of the 11 studies in meta-analysis
[1] Cha S.B., Yoo A.N., Lee W.J. et al., (2012). Effect of bacteriophage in enterotoxigenic Escherichia coli (ETEC) infected pigs. JOURNAL OF VETERINARY MEDICAL SCIENCE, 74(8), 1037–1039. DOI10.1292/jvms.11-0556.
[2] Han S.-J., Oh Y., Lee C.Y. et al., (2016). Efficacy of dietary supplementation of bacteriophages in treatment of concurrent infections with enterotoxigenic Escherichia coli K88 and K99 in postweaning pigs. JOURNAL OF SWINE HEALTH AND PRODUCTION, 24(5), 259–263. DOI10.54846/jshap/943.
[3] Imklin N., Sriprasong P., Phuttapatimok S. et al., (2022). In vivo assessment of bacteriophages specific to multidrug resistant Escherichia coli on fecal bacterial counts and microbiome in nursery pigs. RESEARCH IN VETERINARY SCIENCE, 151, 138–148. DOI10.1016/j.rvsc.2022.07.012.
[4] Kim S.-J., Kim J.-D., Yang S.-Y. et al., (2011). Evaluation of bacteriophages for prevention and treatment of diarrhea due to experimental enterotoxigenic Escherichia coli K88 infection of weaned piglets. KOREAN JOURNAL OF VETERINARY SERVICE, 34(4), 341–352. DOI10.7853/kjvs.2011.34.4.341.
[5] Kim S.-J., Kim J.-H., Jun S.-Y. et al., (2014). Protective effect of bacteriophages against Salmonella typhimurium infection in weaned piglets. KOREAN JOURNAL OF VETERINARY SERVICE, 37(1), 35–43. DOI10.7853/kjvs.2014.37.1.35.
[6] Mao X., Wu Y., Ma R. et al., (2023). Oral phage therapy with microencapsulated phage A221 against Escherichia coli infections in weaned piglets. BMC VETERINARY RESEARCH, 19, 165. DOI10.1186/s12917-023-03724-y.
[7] Seo B.-J., Song E.-T., Lee K. et al., (2018). Evaluation of the broad-spectrum lytic capability of bacteriophage cocktails against various Salmonella serovars and their effects on weaned pigs infected with Salmonella typhimurium. THE JOURNAL OF VETERINARY MEDICAL SCIENCE, 80(6), 851–860. DOI10.1292/jvms.17-0501.
[8] Won Y., Kim S., Han J. (2021). The protective effect of dietary supplementation of Salmonella-specific bacteriophages in post-weaning piglets challenged with Salmonella typhimurium. JOURNAL OF ADVANCED VETERINARY AND ANIMAL RESEARCH, 8(3), 440–447. DOI10.5455/javar.2021.h532.
[9] Callaway T.R., Edrington T.S., Brabban A. et al., (2011). Evaluation of phage treatment as a strategy to reduce Salmonella populations in growing swine. FOODBORNE PATHOGENS AND DISEASE, 8(2), 261–266. DOI10.1089/fpd.2010.0671.
[10] Wall S.K., Zhang J., Rostagno M.H. et al., (2010). Phage therapy to reduce preprocessing Salmonella infections in market-weight swine. APPLIED AND ENVIRONMENTAL MICROBIOLOGY, 76(1), 48–53. DOI10.1128/AEM.00785-09.
[11] Saez A.C., Zhang J., Rostagno M.H. et al., (2011). Direct feeding of microencapsulated bacteriophages to reduce Salmonella colonization in pigs. FOODBORNE PATHOGENS AND DISEASE, 8(11), 1269–1274. DOI10.1089/fpd.2011.0905.
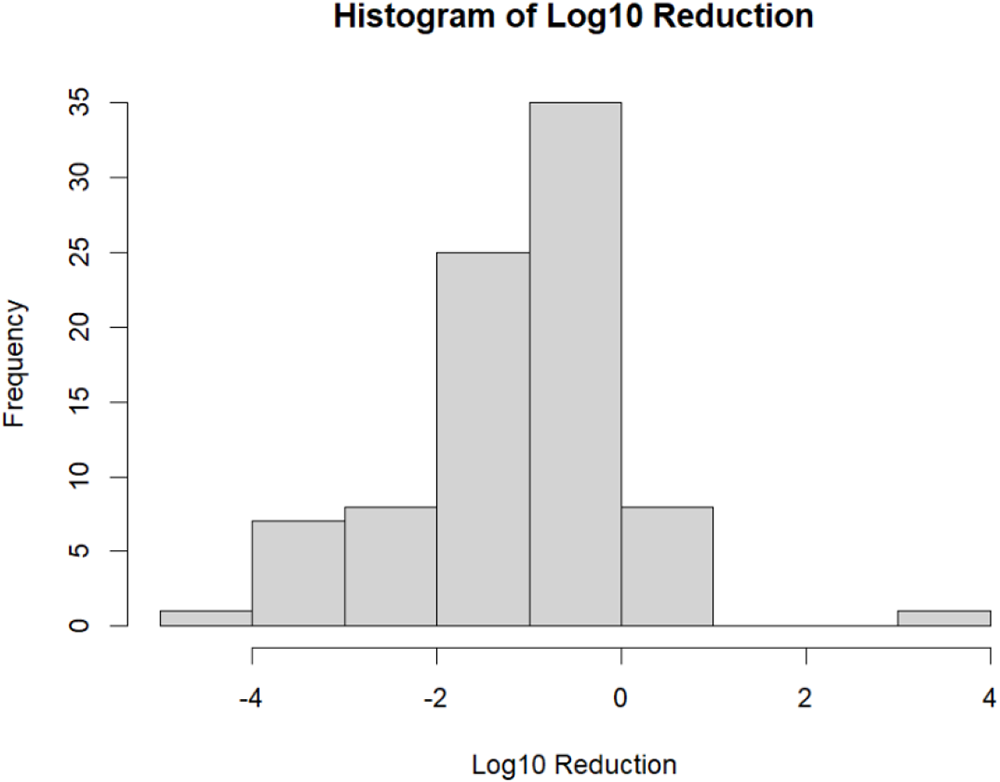
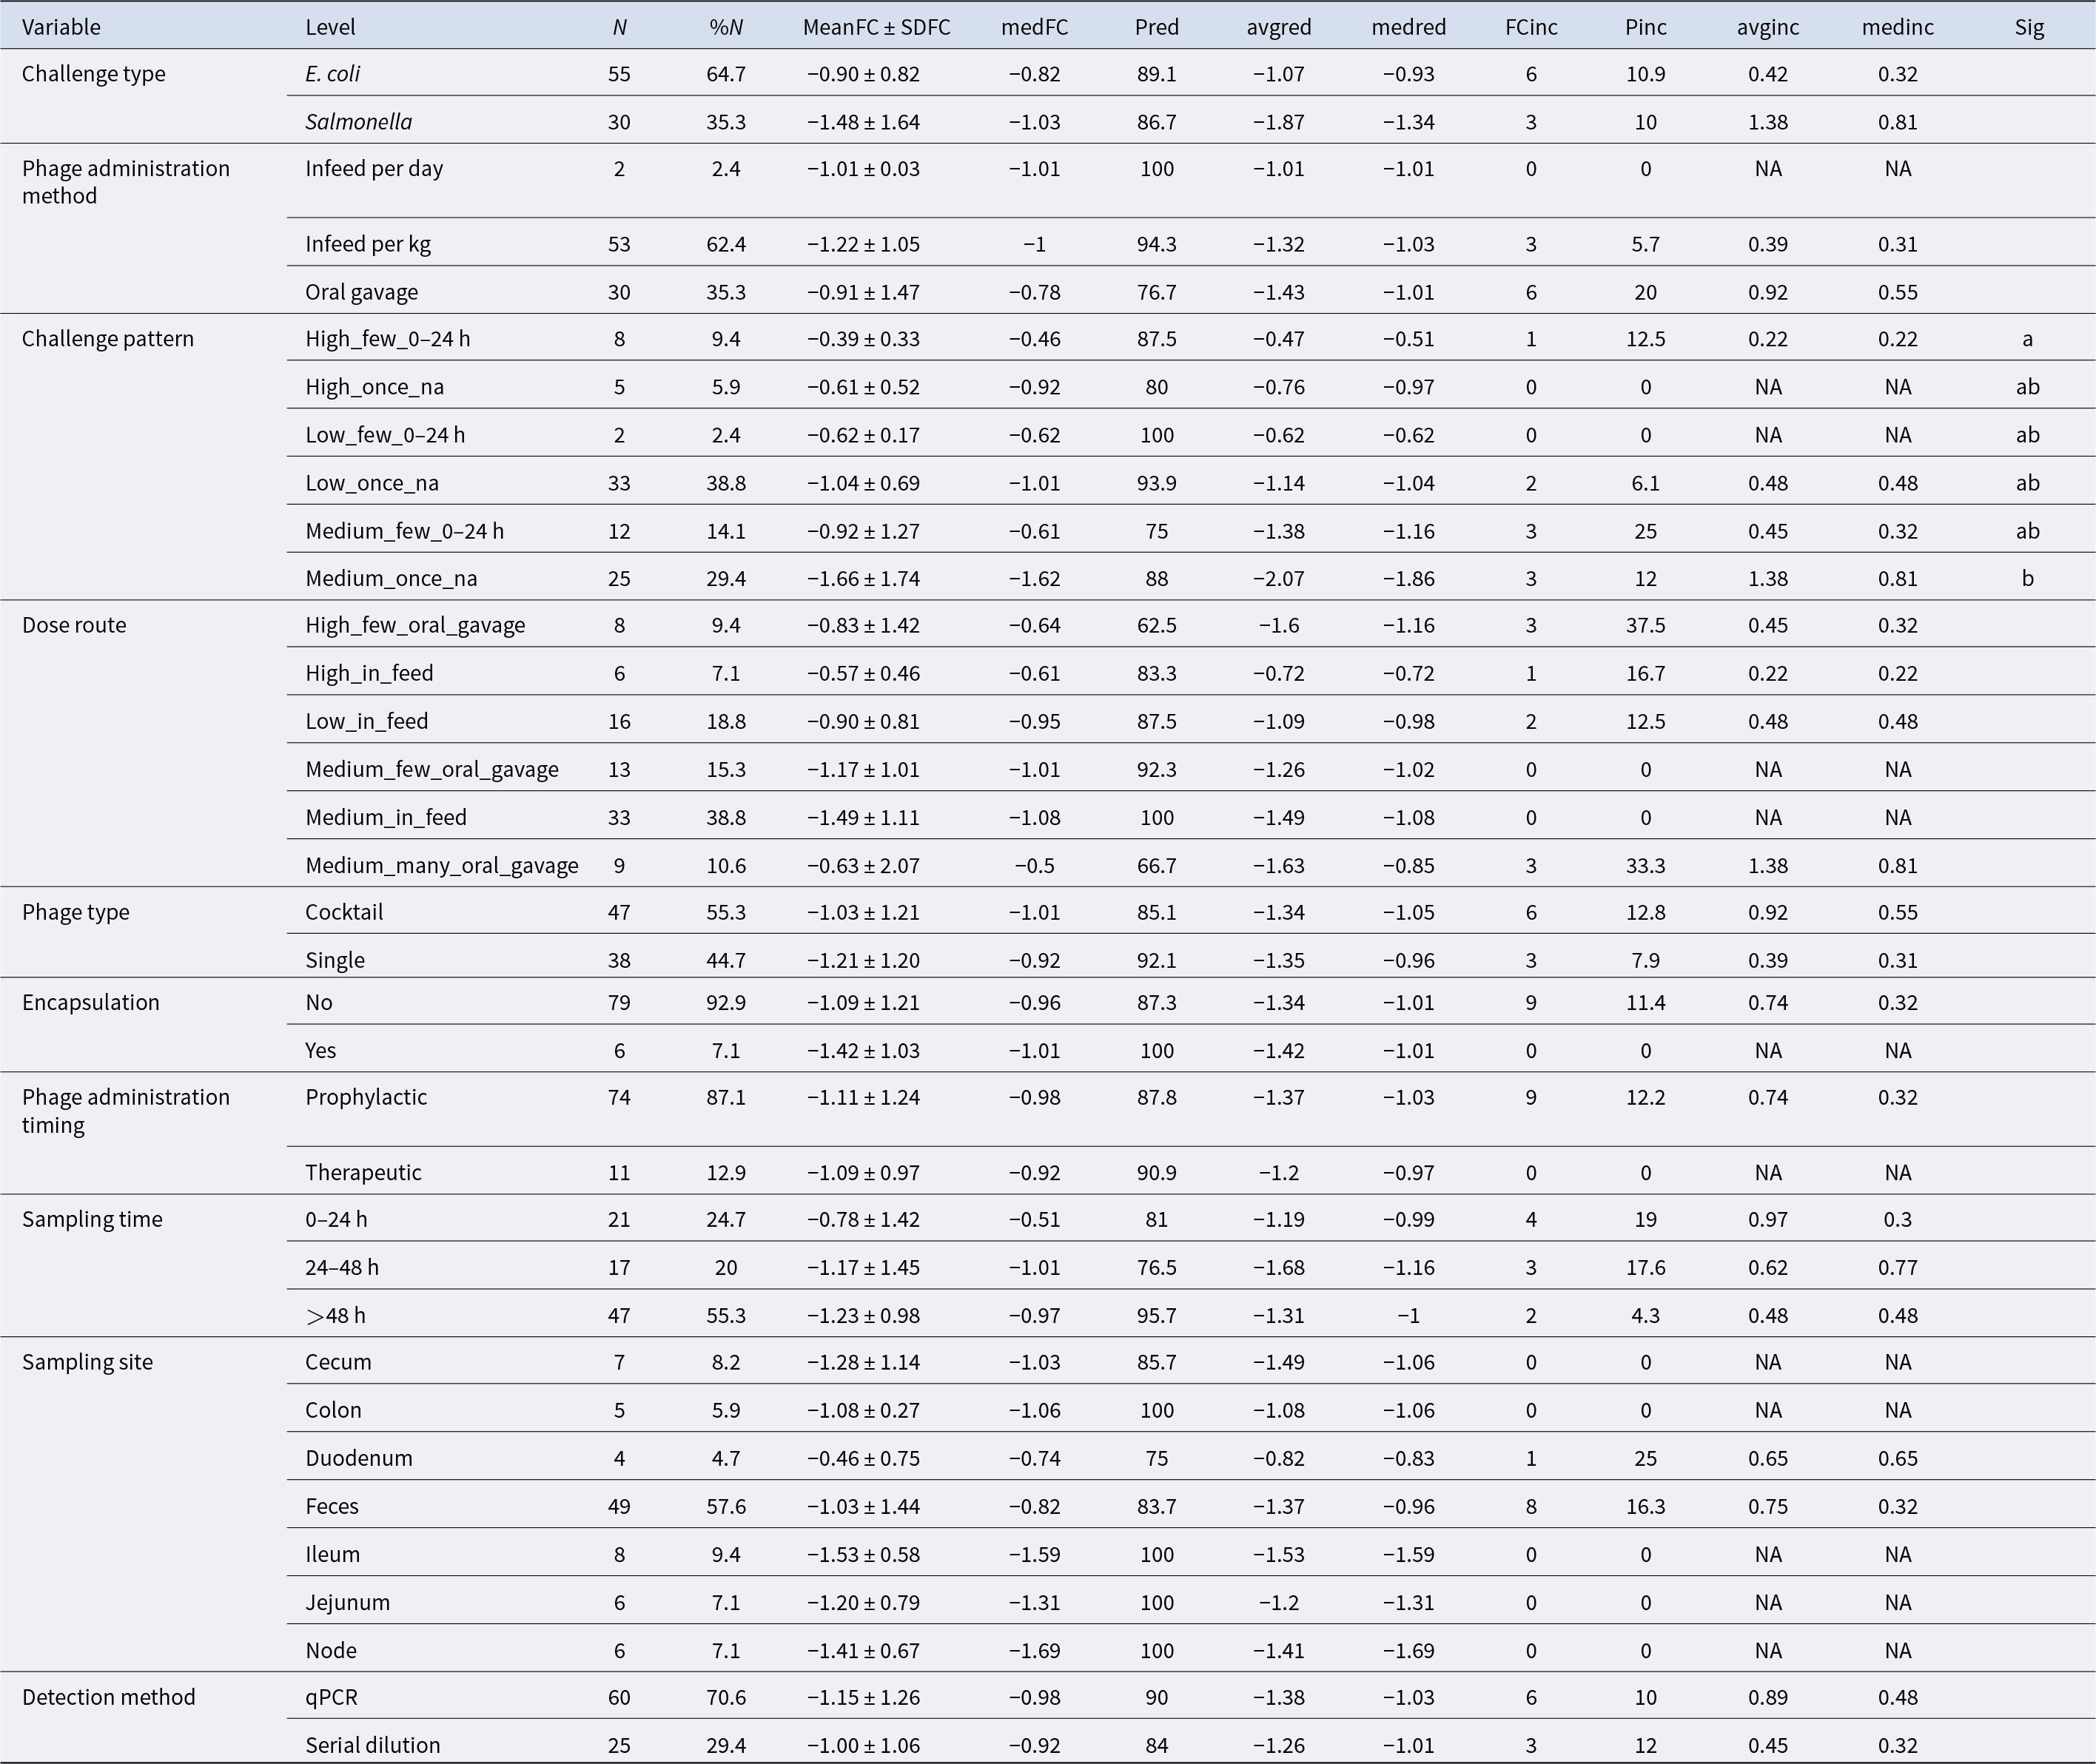
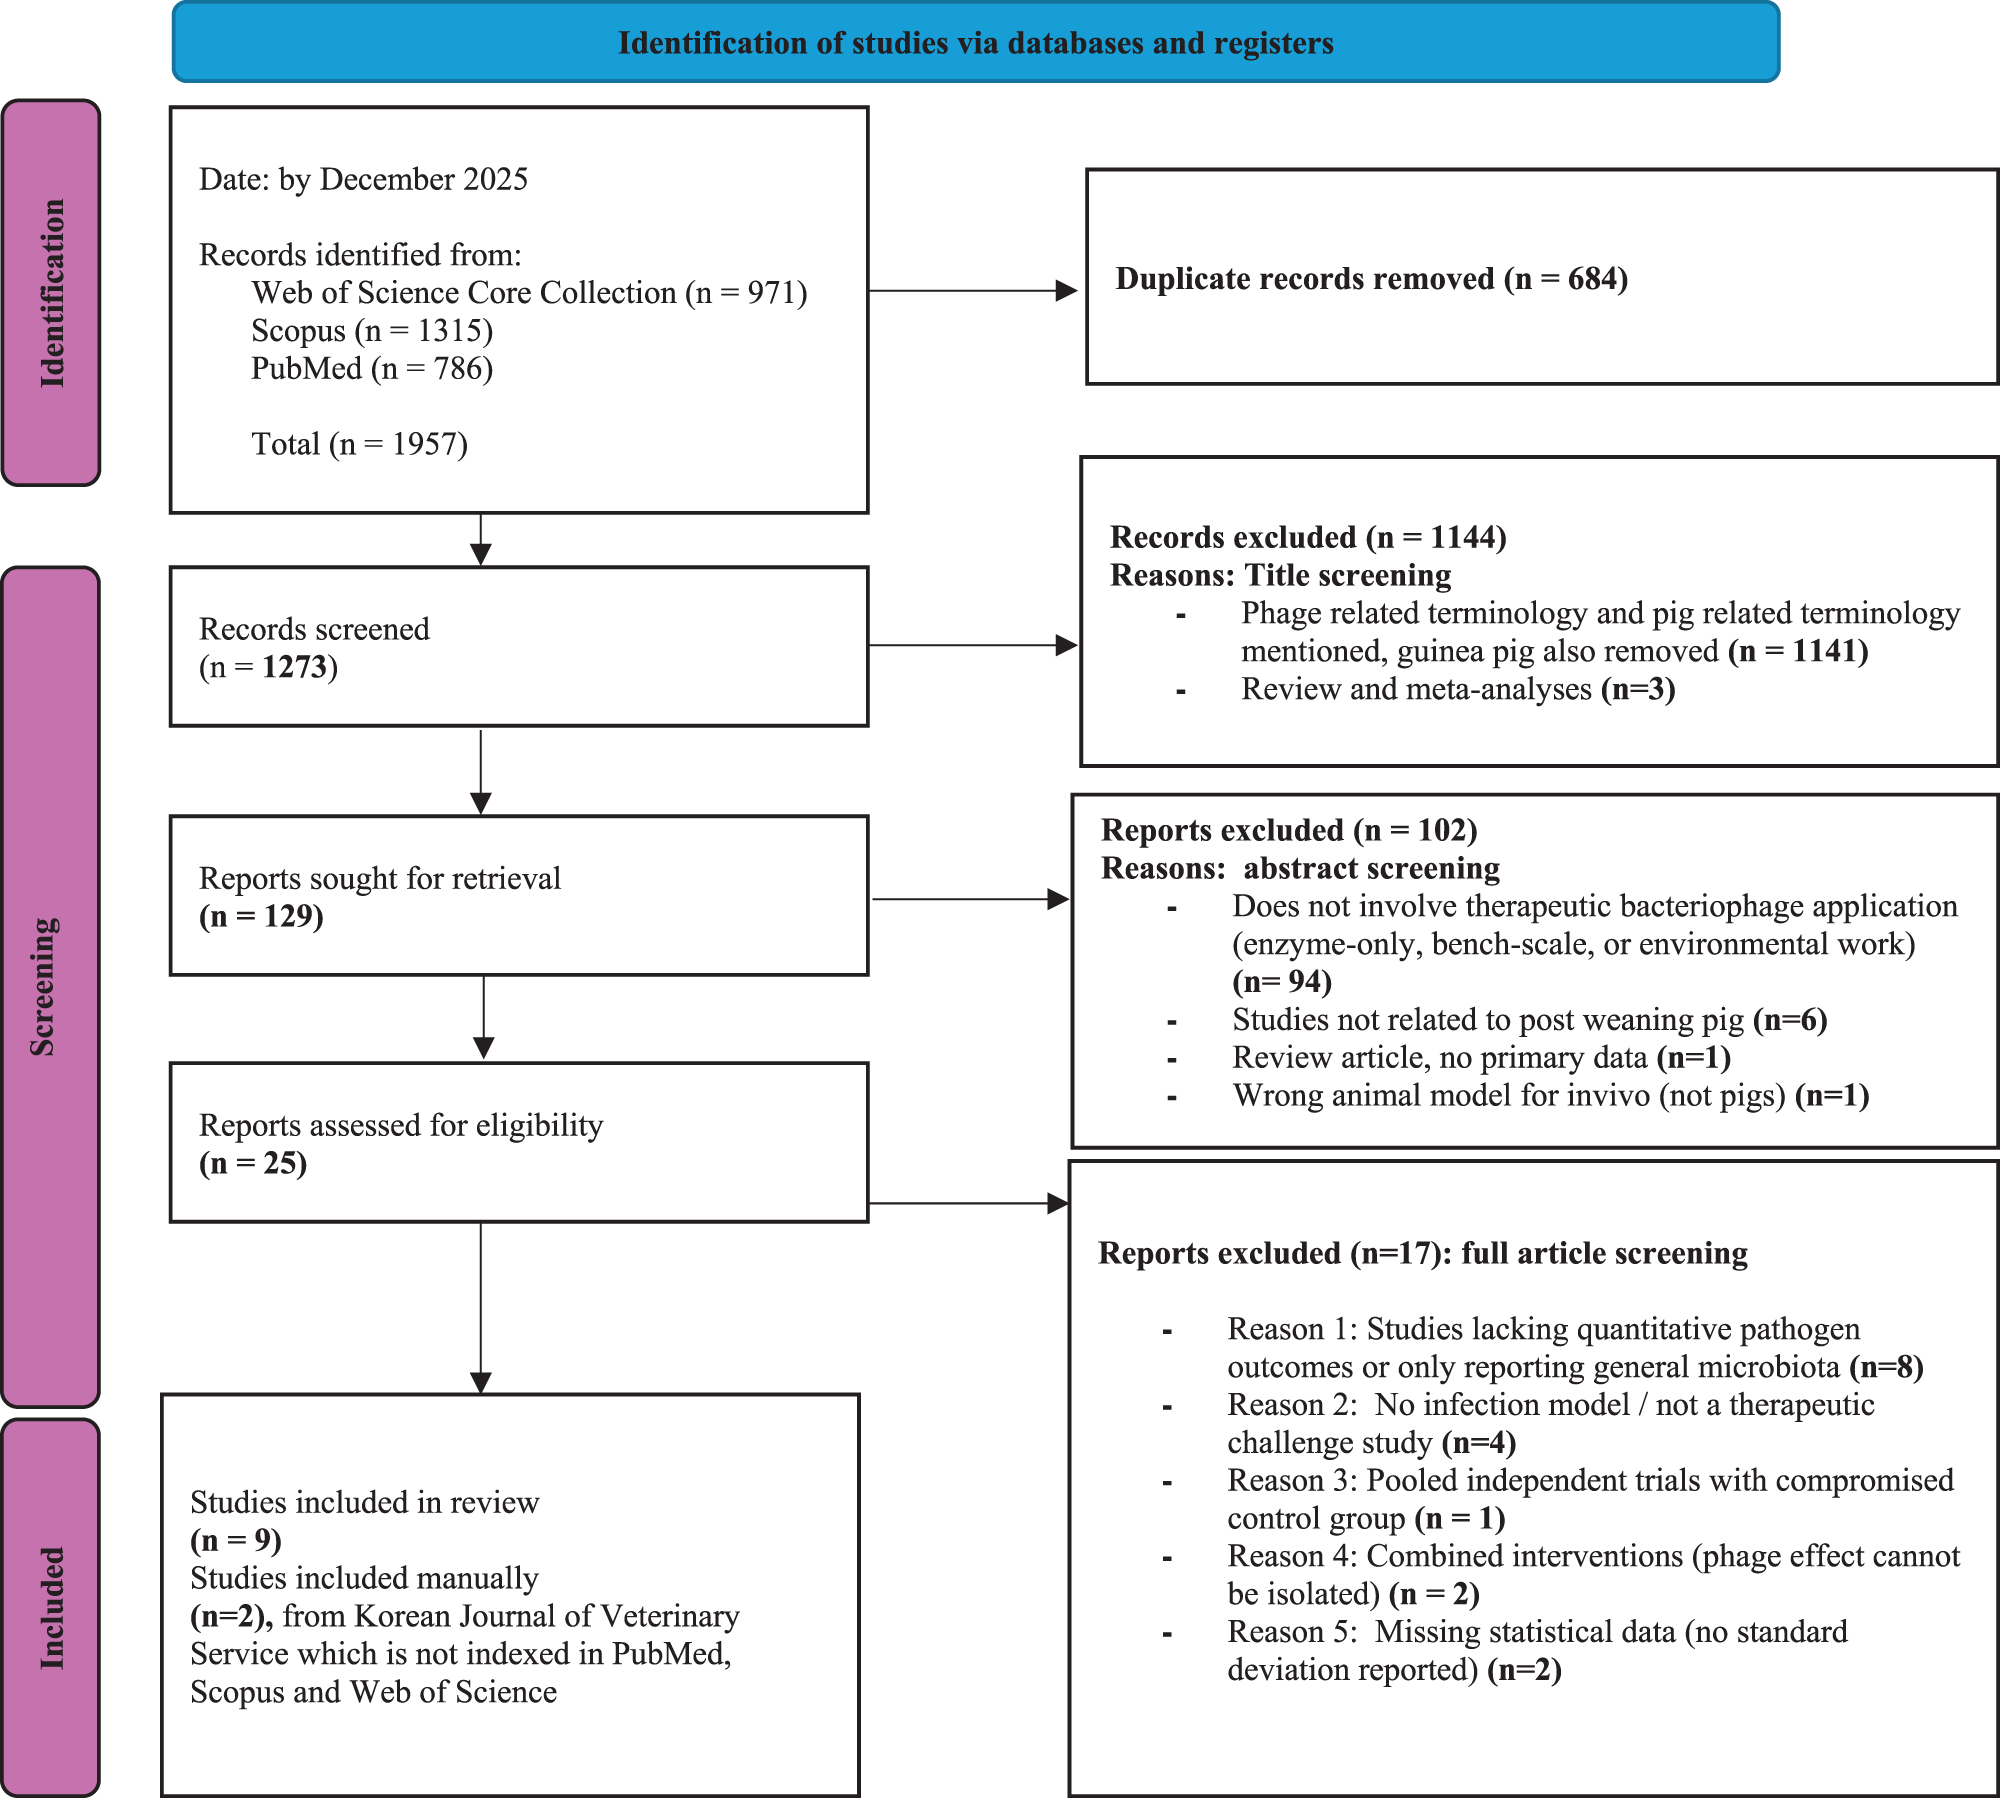
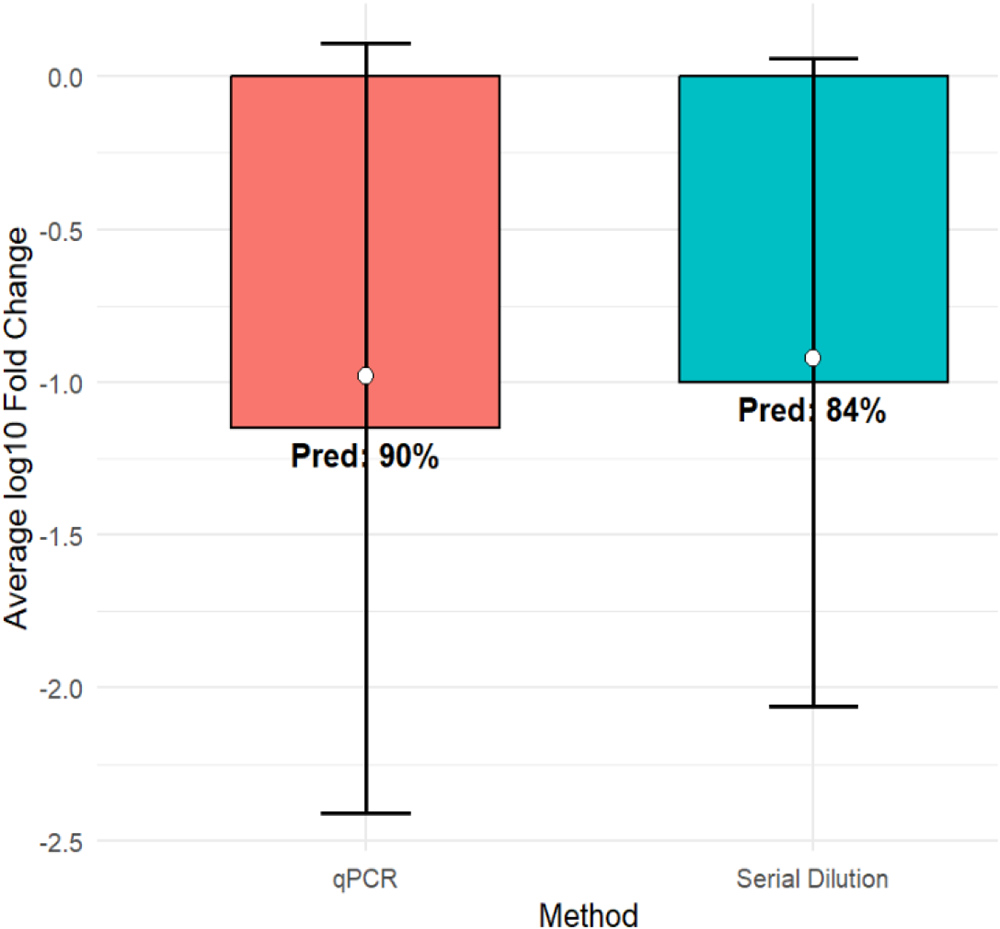
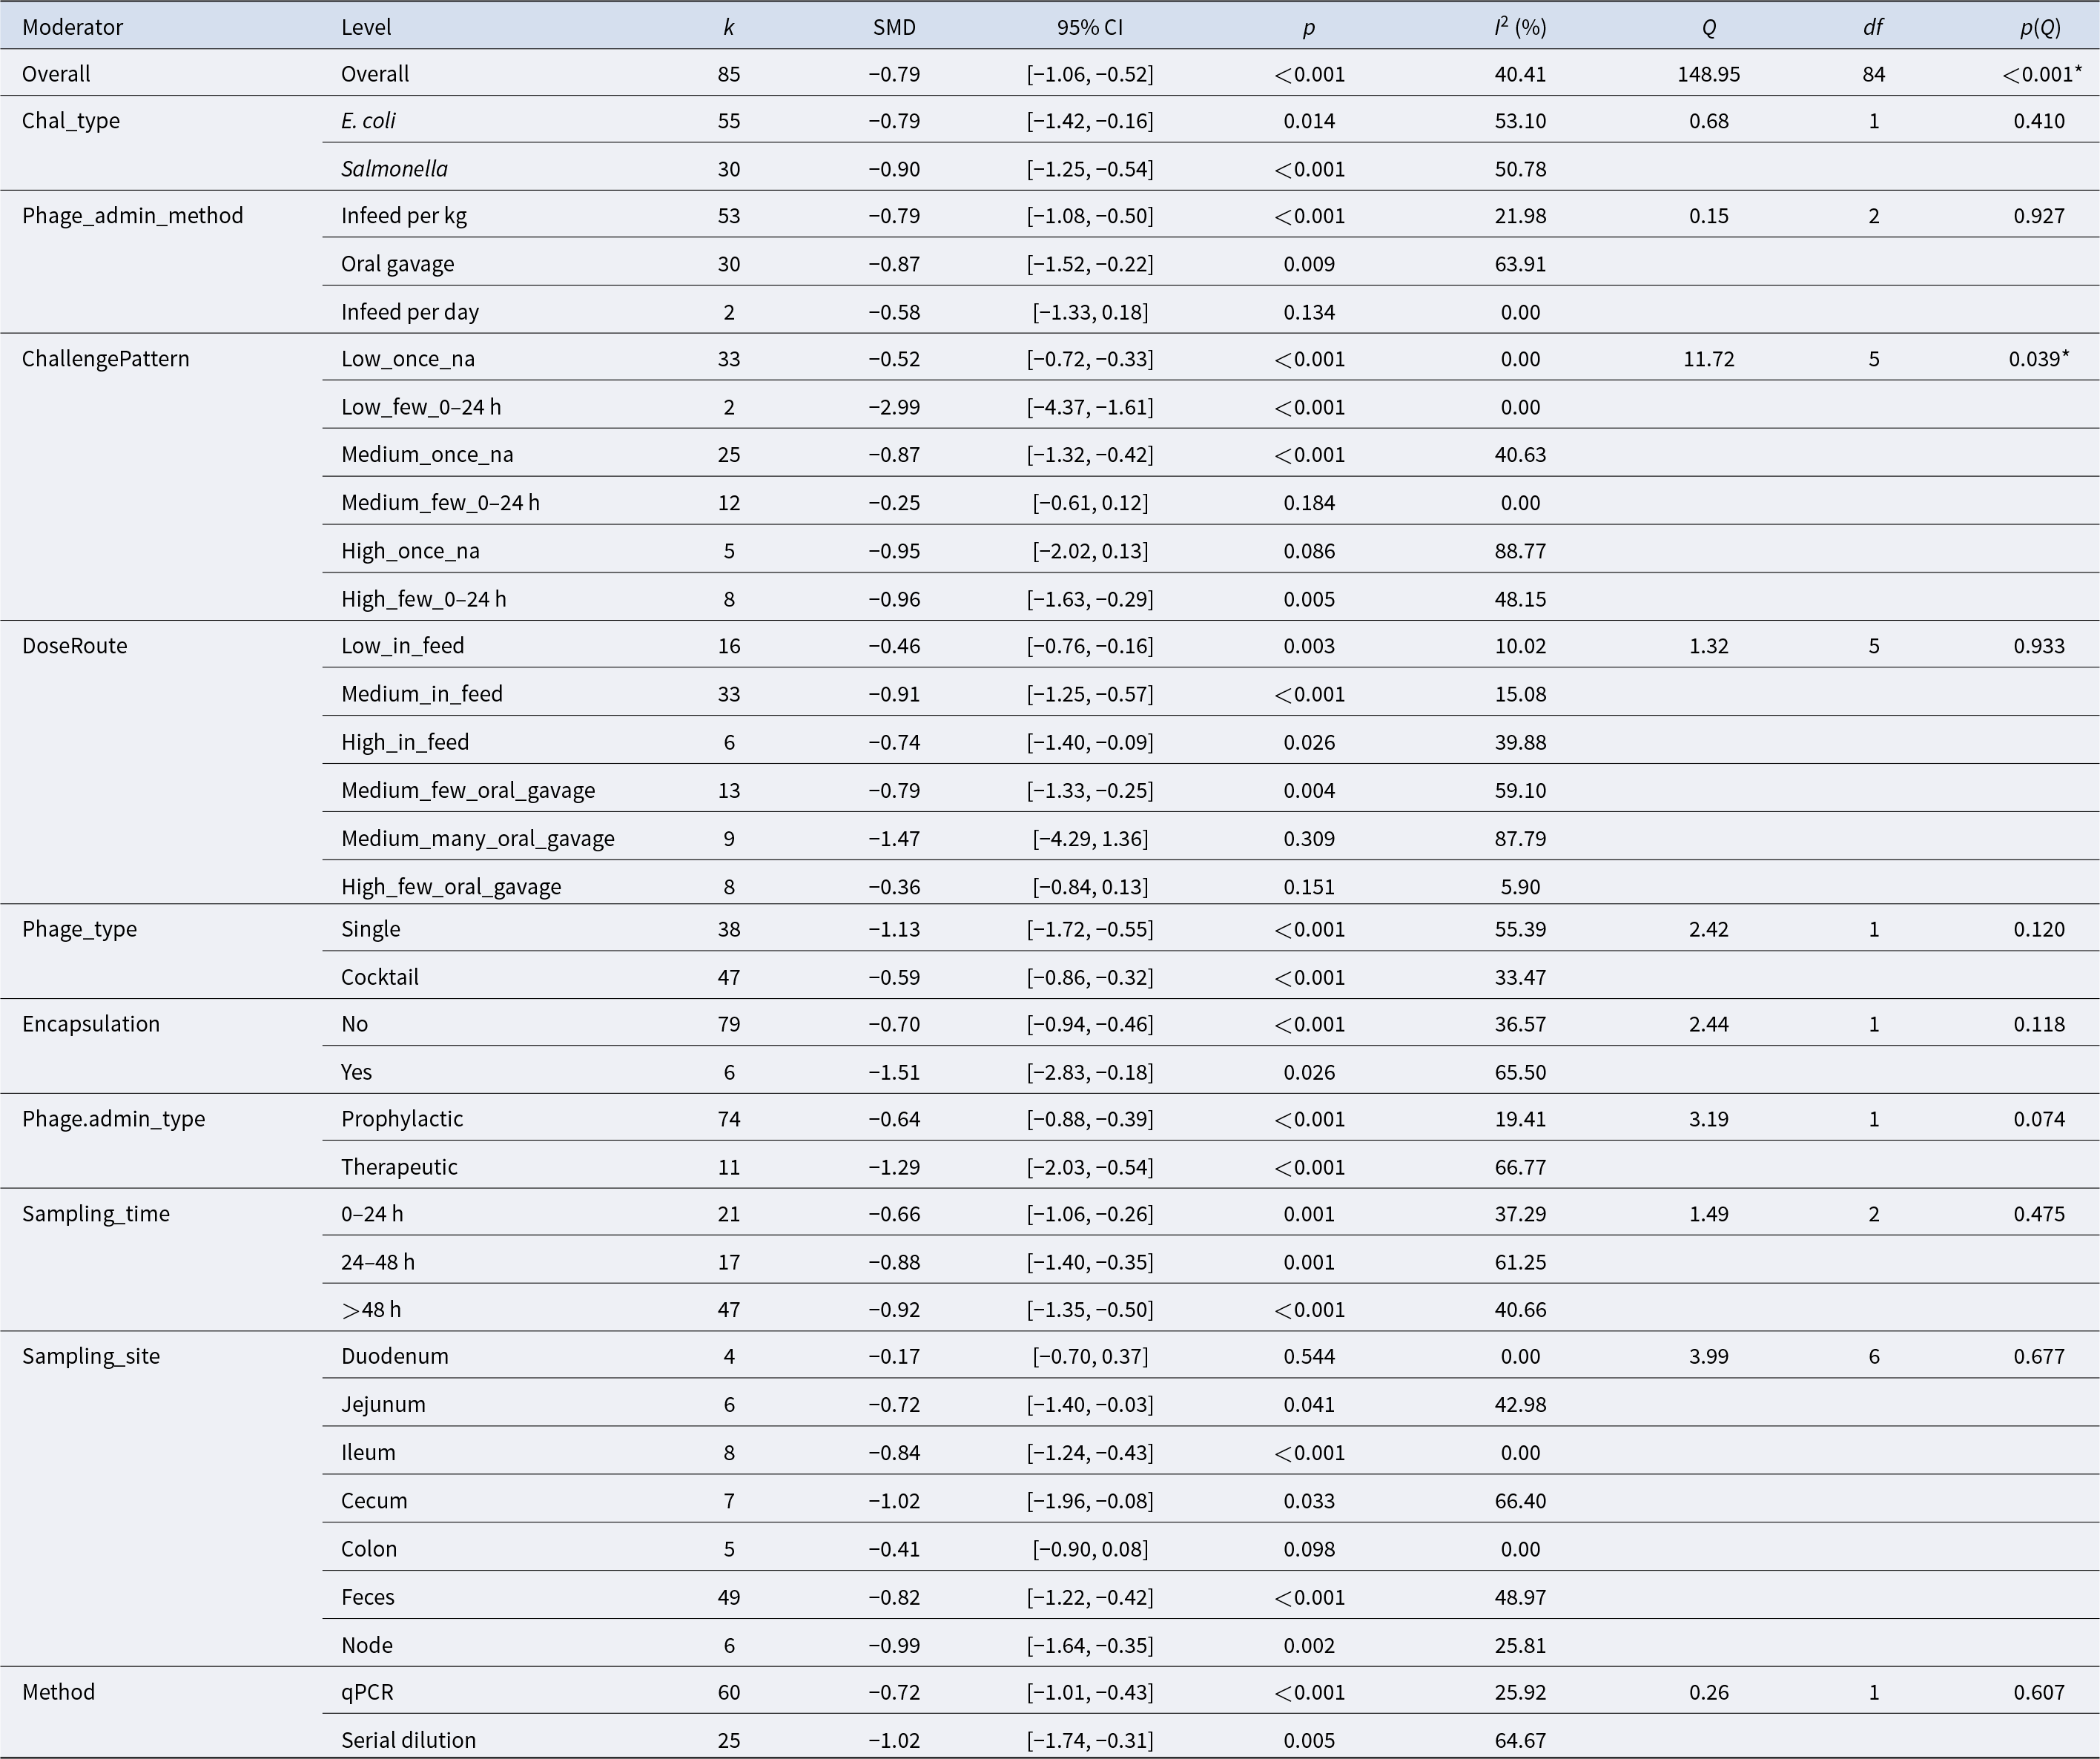
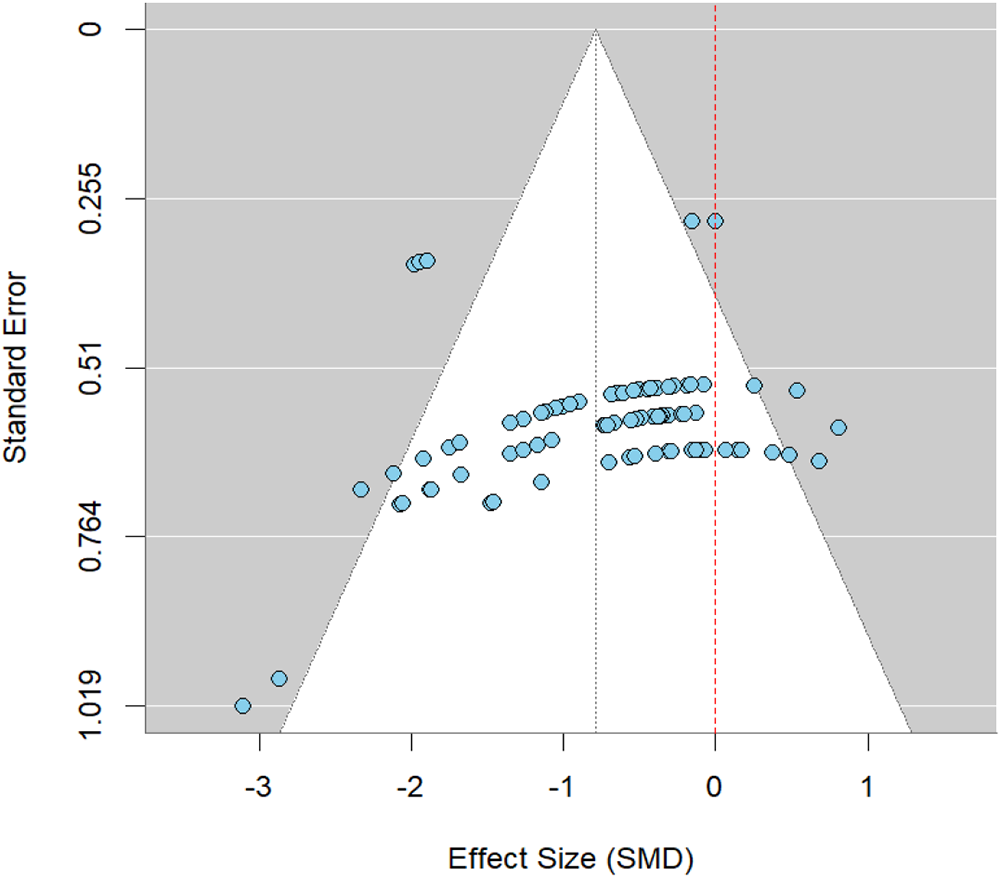
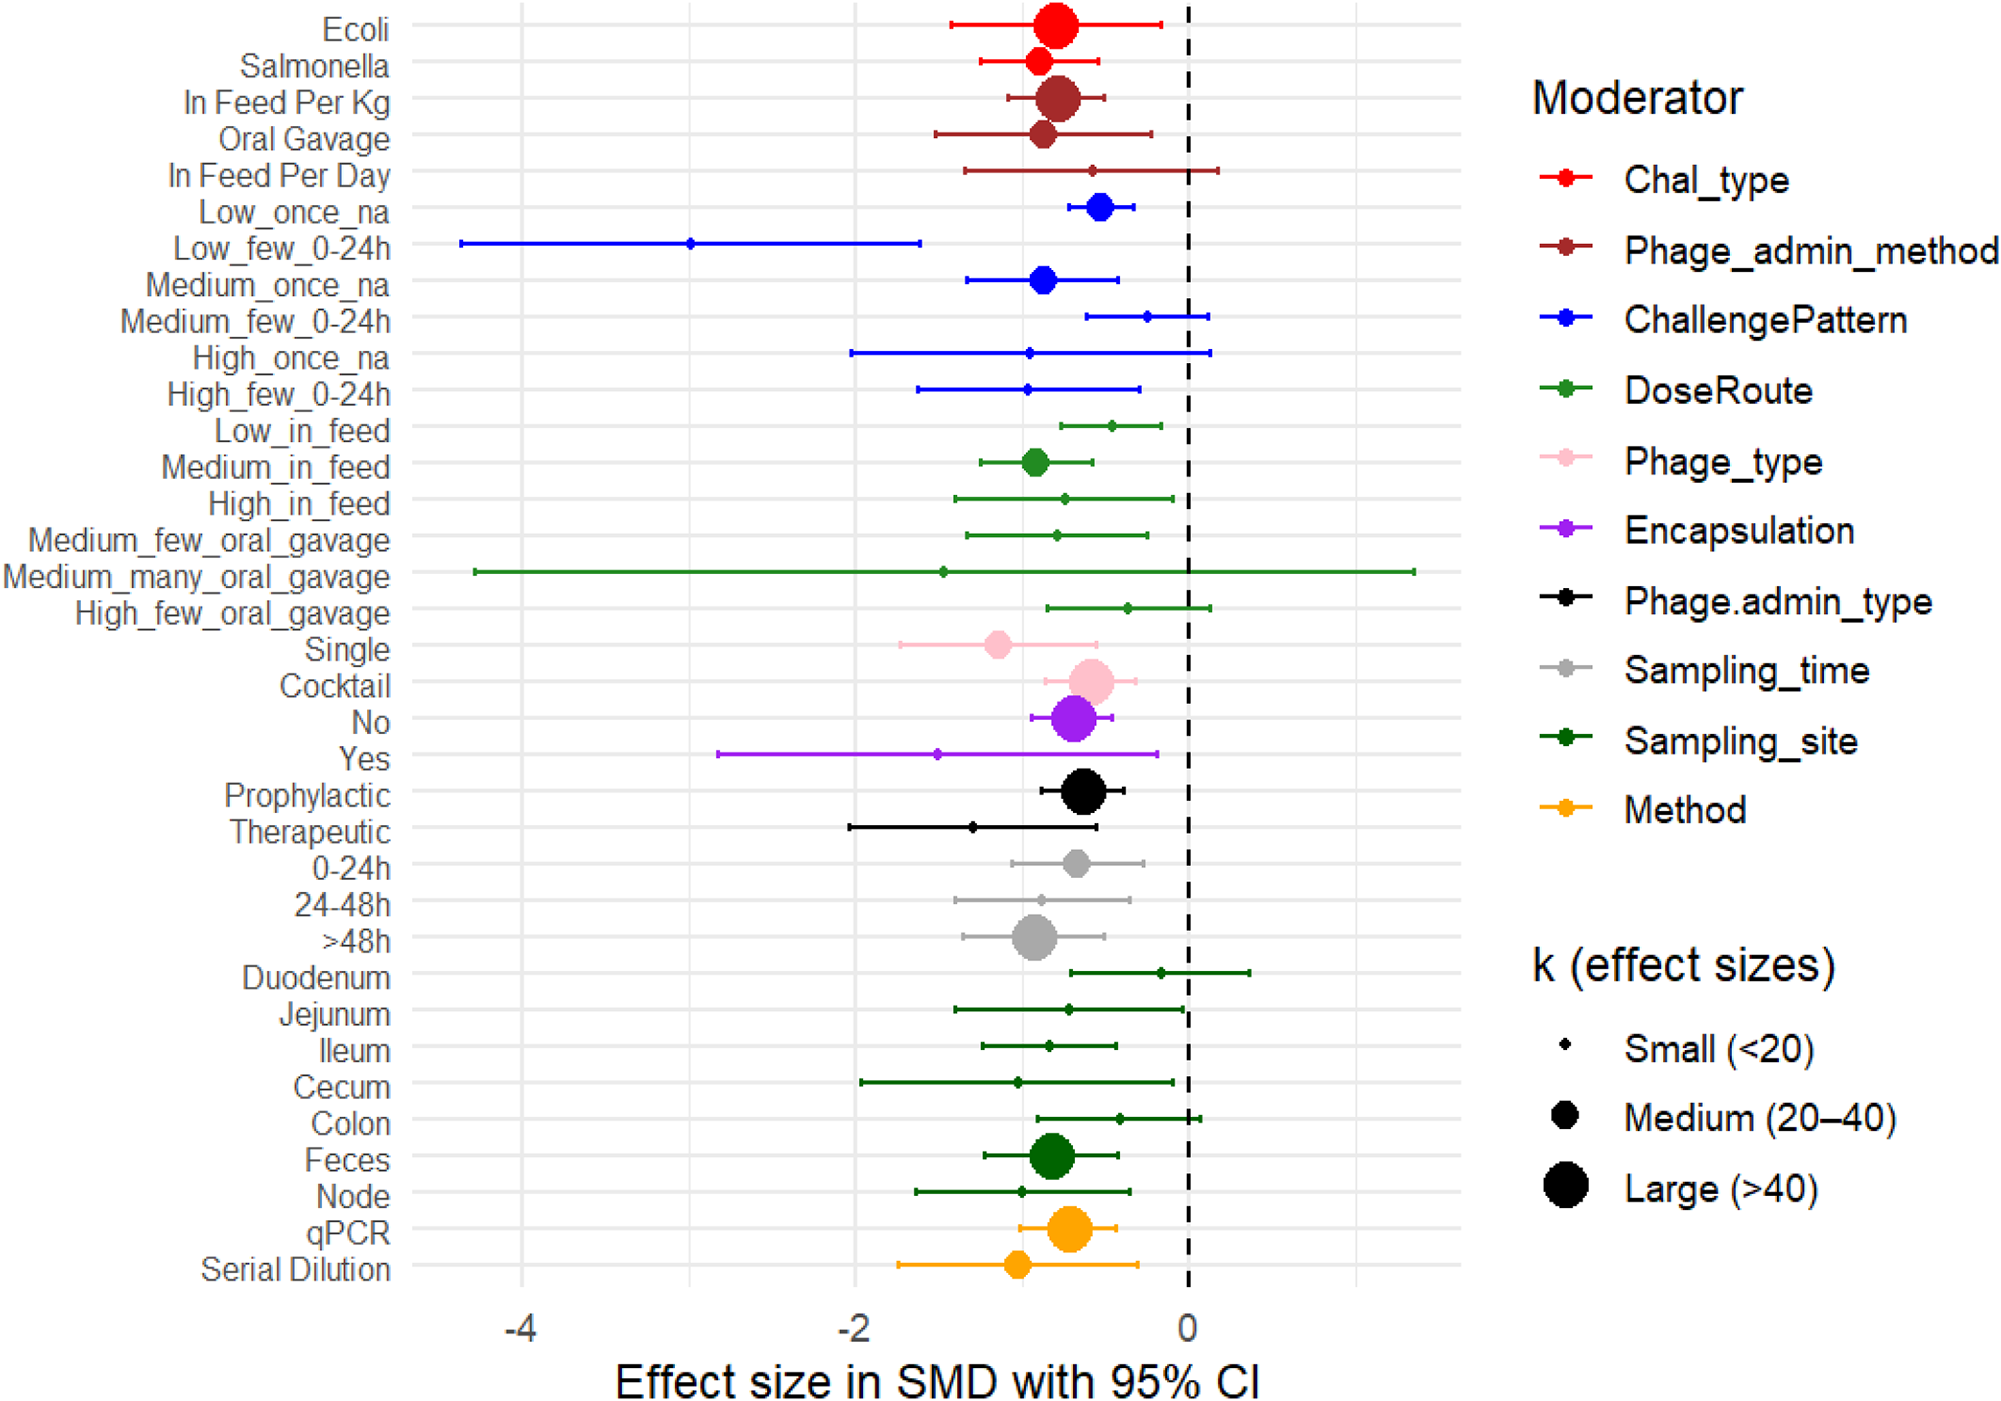


 Open access

