

1. Introduction
In Asian mountain regions, large-volume drainage events occur from supraglacial lakes on debris-covered glaciers. For example, during May–June 2008, the Hunza Valley of the Karakoram had four large drainage events from supraglacial lakes at the terminus of the Ghulkin Glacier. These drainages destroyed homes and four irrigation channels in Borit Village and also temporarily closed the Karakoram Highway (Richardson and others, Reference Richardson, Quincey and Nasab2009). On 29 April 2009, in the Lunana region of northwestern Bhutan, a sudden large discharge event occurred through englacial or subglacial conduits at the Tshojo Glacier, forcing the evacuation of the people of Punakha Town, located 70 km downstream (Komori and others, Reference Komori, Koike, Yamanokuchi and Tshering2012). After this event, Yamanokuchi and others (Reference Yamanokuchi, Tadono, Komori, Kawamoto and Tomiyama2011) observed a large outlet of an englacial conduit through which drainage water flowed at the glacier terminus. Thus, the drainage was considered to have been supplied by water that was stored in the supraglacial lake as well as in the englacial or subglacial conduits (Komori and others, Reference Komori, Koike, Yamanokuchi and Tshering2012). Later, on 12 July 2016, the Lhotse Glacier in the Khumbu region of eastern Nepal had large-scale drainage from a large supraglacial lake and englacial storage water (Rounce and others, Reference Rounce, Byers, Byers and McKinney2017). Lastly, from April to July 2017, a supraglacial lake with an area of 180 000 m2 rapidly formed on a tributary of the Khumbu Glacier, then completely discharged in mid-July (Miles and others, Reference Miles2018a). These recent studies show that large-scale drainage events are coupled with supraglacial and englacial water-storage dynamics.
Supraglacial lakes on debris-covered glaciers form by water flowing into a basin or depression through englacial or surface channels. They form when the englacial conduits close and then continue to develop until a connecting englacial conduit opens (Benn and others, Reference Benn2017; Narama and others, Reference Narama2017). For example, a lake may form due to closing of englacial channels by roof collapse, creep closure, freezing of stored water and deposition of ice and debris (Gulley and Benn, Reference Gulley and Benn2017; Narama and others, Reference Narama2018). Then, the lake may expand by erosion of the lake basin and englacial channel due to ice melting, inflow of ice meltwater and transfer of lake water through lake connectivity to the englacial network (Sakai, Reference Sakai2001; Benn and others, Reference Benn2012; Miles and others, Reference Miles, Willis, Arnold, Steiner and Pellicciotti2017a; Narama and others, Reference Narama2017; Watson and others, Reference Watson2017). In addition, the development of supraglacial lakes depends on the glacier's surface gradient (Reynolds, Reference Reynolds, Nakawo, Raymond and Fountain2000; Liu and others, Reference Liu, Mayer and Liu2015), ice velocity (Miles and others, Reference Miles, Willis, Arnold, Steiner and Pellicciotti2017a) and the glacier mass balance (Benn and others, Reference Benn2012). Conversely, any water from the surface and side of the glacier that fills a subglacial reservoir will affect the motion at the glacier bed (Bartholomaus and others, Reference Bartholomaus, Anderson and Anderson2011). Moreover, supraglacial lakes accelerate glacier ablation due to their greater absorption of solar radiation as well as circulation of meltwater (Sakai, Reference Sakai2001; Benn and others, Reference Benn2012; Thompson and others, Reference Thompson, Benn, Dennis and Luckman2012; Miles and others, Reference Miles2018b), particularly those with high turbidity water (Takeuchi and others, Reference Takeuchi, Sakai, Shiro, Fujita and Nakawo2012).
Satellite data showed that the total ponded area of some debris-covered glaciers changed seasonally during 2000–2015 in the Everest region (Watson and others, Reference Watson, Quincey, Carrivick and Smith2016). Also, during 2010, 2012 and 2015, each supraglacial lake on Ngozumpa Glacier had a different life cycle of drainage and recharge (Benn and others, Reference Benn2017). In central Tien Shan, the number of supraglacial lakes on the Southern Inylchek changes seasonally, as it also does on the Tomur Glacier, but the timing of their maxima differs despite being in the same climate region (Narama and others, Reference Narama2017).
In the Langtang Valley of central Nepal, supraglacial lakes expand in the pre-monsoon period due to snow melt, and then shrink due to the opening of englacial conduits that occur from increasing precipitation and snow-ice melting in the monsoon period (Miles and others, Reference Miles, Willis, Arnold, Steiner and Pellicciotti2017a). In the study area of the southern Inylchek Glacier, the Tien Shan, satellite data in 1999–2015 show the number of supraglacial lakes to vary seasonally. This number increases in April, reaches a maximum from May to June, and then decreases from June to July (Narama and others, Reference Narama2017). The increase in number from April to June is caused by melt, and the later decrease in number is caused by connections of the supraglacial lakes to the englacial conduit network. Daily variations of water levels have been measured in supraglacial lakes using water-level loggers (Miles and others, Reference Miles2017b; Narama and others, Reference Narama2017); the connectivity and relationship between supraglacial lakes and englacial conduits remain unclear.
The large-volume drainage events of supraglacial lakes can occur on any debris-covered glacier. Large-scale flooding might be caused by drainage from a single large supraglacial lake, or from a simultaneous drainage event involving multiple glacial lakes (Narama and others, Reference Narama2017). Although such simultaneous drainage events have been studied, we still need a better understanding of their mechanism, their precursor phenomenon, the possibility of recurrence and the scale of the englacial network. In this study, we focus on supraglacial lakes on the southern Inylchek Glacier in Kyrgyzstan.
To help understand the mechanism for simultaneous drainage, we obtained spatial data on daily water levels to determine the relationship between the lake-level changes of a given supraglacial lake and its network connectivity. Specifically, we investigated daily water-level variations of the lakes in the summers of 2017, 2018 and 2019, primarily using digital surface models (DSMs) and ortho-images derived from an uncrewed aerial vehicle (UAV). In describing the network, we make the distinction here between an ‘englacial conduit’ as a conduit covered on all sides by ice or debris, and a ‘supraglacial conduit’ as a conduit partly exposed on the surface.
2. Study area
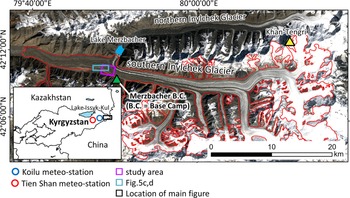
The study area is the southern Inylchek Glacier in the central Tien Shan mountains (Fig. 1). This glacier is the largest in Kyrgyzstan (~500 km2 in area, 60.5 km long), with a debris-covered zone that stretches over 22 km up-glacier from the glacier terminus (Shangguan and others, Reference Shangguan2015; Narama and others, Reference Narama2017), and medial moraines from several tributary glaciers. For 1999–2007, the average annual mass balance was −0.28 ± 0.46 m w.e. a−1 (Shangguan and others, Reference Shangguan2015). The estimated maximum thickness is 380 m, and the mean thickness of its debris-covered part is 136 m (Pieczonka and others, Reference Pieczonka, Bolch, Kröhnert, Peters and Liu2018). Partway down the glacier, and between it and the northern Inylchek Glacier, lies Lake Merzbacher (Fig. 1). The surface-flow velocities up-glacier of this lake are faster than those down-glacier (Nobakht and others, Reference Nobakht, Motagh, Wetzel, Roessner and Kaufmann2014; Shangguan and others, Reference Shangguan2015). Distributed on its debris-covered area lie many supraglacial lakes that have an annual seasonal drainage cycle (Narama and others, Reference Narama2017).
The southern Inylchek Glacier in central Tien Shan, Kyrgyzstan (black box region in inset map). The glacier outline (red) is adapted from the GAMDAM glacier inventory (Sakai and others, Reference Sakai2015). The purple box is the study site shown in Figure 2. Image is Landsat-8/OLI taken on 4 September 2017.

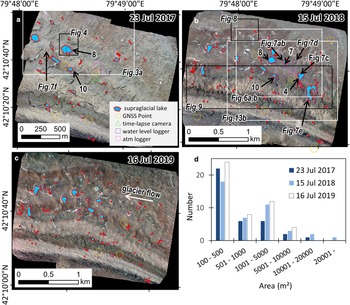
Study area imaged by UAV (purple box in Fig. 1). (a) The study area in 2017 (2 × 2 km2). (b) Same as (a) except 2018 and larger area (2 × 2.5 km2). (c) Same as (b) except for 2019. Regions shown in subsequent figures outlined with black and white boxes and labeled. (d) Lake area distribution in the study area on the dates shown.

The closest meteorological stations are the Tien Shan Station (78.2°E, 41.9°N, 3614 m a.s.l., data from 1960 to 1997) and the Koilu Station (79.0°E, 42.2°N, 2800 m a.s.l., data from 1960 to 1990; Fig. 1), with annual precipitation amounts of 279 and 311 mm a−1, respectively (Reyers and others, Reference Reyers, Pinto and Paeth2013). About 75% of the annual precipitation occurs from March to September with peak precipitation occurring in June–July. According to observation data at the Tien Shan station, the annual average air temperature is −7.7°C, with the lowest monthly average temperature being −21.8°C in January, the highest being 4.3°C in July (Osmonov and others, Reference Osmonov, Bolch, Xi, Kurban and Guo2013; Shangguan and others, Reference Shangguan2015).
3. Methods
3.1 Field survey
We ran a field survey on the middle part of the southern Inylchek Glacier near the Lake Merzbacher B.C. during summers in 2017, 2018 and 2019. The camp was built by the Central-Asian Institute for Applied Geosciences (CAIAG) and Deutsches GeoForschungsZentrum (GFZ) (Fig. 1). Aerial photographs were taken using a UAV (Phantom-3 Advance and Phantom-4 (DJI): camera pixels 12.4 MP, lens FOV94̊, 20 mm, f/2.8, ISO 100-1600) each day (22 July–15 August 2017, 8–29 July 2018, and 12–19 July 2019) to determine the supraglacial lakes' water-level variations. The area of the UAV survey was 2 × 2 km2 in 2017 and 2 × 2.5 km2 in 2018–2019. The photo forward lap and side lap were 80 and 65%, respectively. The survey time was 05:30–07:00 am (UTC + 6), as this time period had the clearest weather as well as good sun angle for photographs. We changed the flight time on several days due to the weather.
To correct the relative water-level fluctuations to absolute elevation values, we also made ortho-images and DSMs using GCPs (ground control points). The GCPs in 2017 (Fig. 2a), in 2018 (Fig. 2b) and in 2019 (Fig. 2c) were measured by a GNSS survey for 30 min with Trimble GeoExplorer6000. We obtained absolute positions with 20–40 cm accuracy at the GCP positions and lake-level data by post-processing with data from the Kyrgyz GNSS reference stations. We also set up water-level data loggers (water pressure transducer HOBO U20) based on pressure measurements in the water (water pressure) and at the nearby shore (barometric pressure). The water levels were determined every hour by correcting water pressure data with barometric pressure data. We also set up time-lapse cameras (Brinto) for 1 d intervals from 2016 to 2019 (Fig. 2).
3.2 GIS analysis
Ortho-images and DSMs come from UAV aerial images (resolution: 15 cm) via the Pix4D mapper of SfM (Structure from Motion) software. Briefly, images with GNSS locations from the UAV are imported into the SfM software, and the software automatically creates the DSM and ortho-images. (For details, see Immerzeel and others (Reference Immerzeel2014) and Piermattei and others (Reference Piermattei, Carturan and Guarnieri2015, Reference Piermattei2016).) Daily water levels are derived from these UAV DSMs and ortho-images. We also created ortho-images and DSMs using the GCPs setting of Trimble GeoExplorer6000. GCP DSMs are used to relate relative water-level variations to absolute elevation. We numbered the lakes from the UAV survey then used the following procedure to acquire the water levels.
(1) For each lake, designate a ‘standard’ data from the DSM and ortho-image from when that lake level was relatively low. For example, for lake 1 in 2017, the standard data are on 25 July 2017, but for lake 4 in 2017, the standard data are on a different day.
(2) As the glacier surface here flows at a speed of ~4 m per month, all other ortho-images are fitted to the standard ortho-image and DSM for each lake by shifting them using the ‘georeference’ function (non-linear) with more than ten tie points in ArcGIS. The shift is horizontal because the surface gradient is <2° in the study site (2 × 2.5 km).
(3) Manually make lake polygons for each day using each shifted ortho-image during survey period. Then, convert the perimeter lines of the lake polygon to points at 15 cm intervals and extract relative water-level elevations of point data of the perimeter line from each lake's ‘standard DSM’. The relative water-level elevation is from the average elevations of these points (over 500 points), excluding 45% of the highest and lowest values, on the lake's ‘standard’ DSM. Water volume changes are calculated based on the standard DSM using the ‘Cut-Fill’ function in ArcGIS. Finally, convert relative-elevation changes of water level to absolute elevation using DSM based on GCPs from Trimble GNSS data.
A UAV was used because it allowed us to discern daily water-level variations when compared to 15 cm DSMs and ortho-images. However, UAVs limit the survey range and survey period, and require good weather. In addition to these limitations, a UAV's battery requires charging, limiting potential sites to places where electric power can be supplied.
To investigate simultaneous drainage events in May and July, we used 13 satellite images of Landsat-8/OLI, Sentinel-2 and PlanetScope satellite images in 2017–2019. Supplementary Table 2 summarizes the drainage events and data material in 2017–2019. Lake-area variations outside the UAV survey period were determined from 13 satellite data and their outlines manually delineated on false-color images as in (3) above.
3.3 Accuracy of water-level variation
Water-level data taken from UAV ortho-images and DSMs were tested against direct measurements from water-level loggers (Hobo U20; accurate to ±1.5 cm). These water-level logger measurements came from lakes 8 and 10 in 2017, lakes 4, 7 and 8 in 2018. Supplementary Table 1 shows the direct measurements minus the UAV–DSM values. The average difference of five lakes was 6.3 ± 8.8 cm. These uncertainties are significantly less than the lake-level variations that could vary up to 20 m.
4. Results
4.1 Number and distribution of supraglacial lakes in mid-July 2017–2019
Figures 2a–c show UAV ortho-images in mid-July 2017, 2018 and 2019. Locations of the supraglacial lakes, shown in blue with red outline, are similar in all 3 years. All lakes had high turbidity. Counting only those of area over 100 m2, the total numbers of lakes in the figure images (within the same overlapping area) are 37 on 23 July 2017, 42 on 15 July 2018 and 48 on 16 July 2019. For those over 1000 m2, the total numbers are 9 in 2017, 17 in 2018 and 16 in 2019. For the lakes over 5000 m2, the totals for these years are even smaller, at 3, 6 and 4, respectively. These larger lakes lie near the middle, along the glacier flow direction. The number of lakes in all size classes is plotted in Figure 2d. The total number of lakes is generally larger in 2018 and 2019 than in 2017.
4.2 Storage and drainage phenomena
4.2.1 Drainage event in July 2017
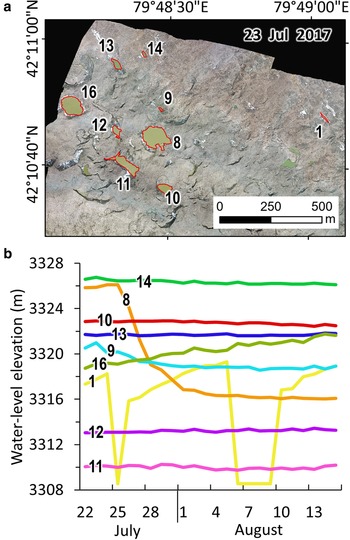
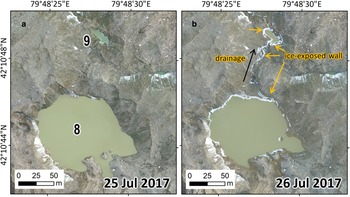
Within the area of Figure 3a, the water levels of nine lakes (1, 8–14, 16) vary during 22 July to 15 August 2017 as plotted in Figure 3b. For example, initially near 3326 m, the water level of the largest, lake 8, first increases slightly by 0.3 m through 25 July, a volume increase of 2723 m3, then drops sharply by 9.8 m by 4 August, a volume loss of 62 293 m3, and thereafter did not change. Nearby, the much smaller lake 9 drops 2 m (volume loss: 328 m3) from 24 July to 30 July, thereafter remaining at the same level (~3319 m). Before-and-after ortho-images in Figure 4 (25 and 26 July 2017) show the changes in surface conditions from the drainage of these lakes. The two lake areas clearly shrink after drainage and ice-exposed parts become visible in Figure 4b due to erosion by the drainage water flowing from lake 8. During the field survey, we observed a conduit with ice-exposed parts on the glacier surface between the two lakes.
Lake locations and water-level variations from July to August 2017. (a) Location of lakes with ID numbers. Region is the white rectangle in Figure 2a. The ortho-image was made from UAV data on 23 July 2017. (b) Daily water-level variations (based on DSM data) for the numbered lakes in (a).

UAV ortho-images of lakes 8 and 9 before and after drainage. Yellow arrows show an ice wall along the englacial conduit that was exposed after drainage. Black arrow shows drainage direction. Region is the black rectangle in Figure 2a.

Lake 1 discharges twice during the 25 d observation period (Fig. 3b). Specifically, the water level declines 9.9 m, draining 1378 m3 on 24 July, then the water level increases by 7.5 m the next day, a volume of 738 m3, and then an even larger drainage of 1756 m3 occurs on 5 August in which the water level drops 10.7 m. Four days later, the lake recharges, gaining 942 m3 over 1 d as its water level increases 8.3 m. These three lakes (1, 8, 9) gradually increase just before drainage. Similarly, the water level of lake 16 increases gradually, but does not drain during the survey period (Fig. 3b). The water levels of the remaining lakes (10, 11, 12, 13, 14) remain relatively stable during the survey period with two of them (10, 11) not draining completely during at least 2 years of observation.
4.2.2 Drainage events in May and July 2018
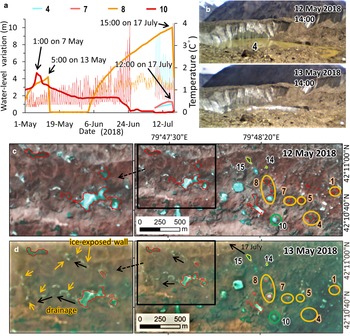
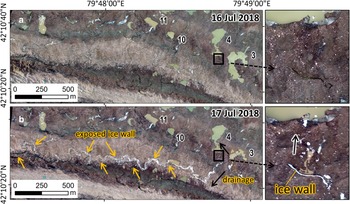
Figure 5a shows water-level (thick line) and temperature (thin line) variations based on water-level data loggers from May through July 2018 for four lakes (see Supplementary Table 1). The temperature remained ~1–2°C from the time that water level starts rising above the data logger. But the temperature fluctuates more when the lake is shallower due to drainage from lake. Lake 10 discharged at 1:00 on 7 May, followed by lake 8 at 5:00 on 13 May. Later, lakes 4, 7 and 8 simultaneously discharge on 17 July. The images in Figure 5b show the drainage of lake 4 between 12 and 13 May showing that this lake drained at about the same time as that of lake 8. Additional PlanetScope and Sentinel-2 images in Figures 5c, d show the drainage of lakes labeled with orange highlighting (1, 4, 5, 7, 8) on 12–13 May (Supplementary Table 2). The black rectangles of Figure 5d show newly exposed ice on 13 May, indicating two drainage routes for this event. Thus, these results show simultaneous drainage events from several lakes within an area of 1 km2 on 12–13 May and 17–18 July.
Drainage event on 13 May 2018. (a) Water-level (thick line) and temperature (thin line) variations of four lakes from water-level logger data. (b) Sequential images of lake 4 that discharged on 12–13 May. (c, d) PlanetScope and Sentinel-2 images taken on 12 and 13 May. Region is the blue rectangle in Figure 1. Left images are enlargements of the black box in the right images. Yellow circles show lakes in the simultaneous drainage event. Yellow arrows show ice wall along englacial conduit that was exposed after drainage. Black, solid arrows show drainage direction (with drainage date in d, right side). All times shown are local (GTM +9:00).

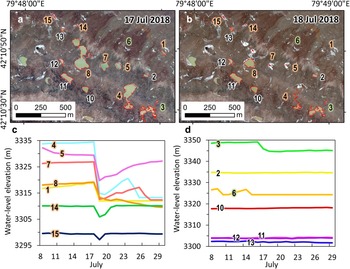
For July 2018, we examined the 14 lakes marked in Figure 6. The seven lakes labeled with orange highlighting in Figures 6a, b (1, 4, 5, 7, 8, 14, 15) simultaneously discharge on 17–18 July (Fig. 6c). From Figure 5a, lakes 4, 7 and 8 drain at about 12:00–15:00 on 17 July. In calculating the amount of lake water simultaneously discharged (based on the DSMs), we find a total amount of 188 673 m3. Even without the additional water in the englacial channel, this is a large transference of water in 1 d. In contrast, the lakes highlighted in white (2, 10–13) do not change during this period in July, whereas those highlighted in green (3, 6) changed, but not during the simultaneous drainage event (Fig. 6d).
Lake locations and water-level variations in July 2018. (a) Location of lakes with ID numbers on 17 July. Region is the white rectangle in Figure 2b. IDs with orange highlight are lakes that drained simultaneously, IDs with white highlight are lakes unaffected by the multi-lake drainage event. IDs with green highlight are lakes that drained on another day. The ortho-image was made from UAV data on 17 July. (b) Same as (a) except the next day. (c) Daily water-level variations (based on DSM data) in lakes that simultaneously drained. Lake 8 includes former lake 9 of 2017 due to a merging of the lakes prior to this image. (d) Same as (c) except for the lakes that did not simultaneously drain.

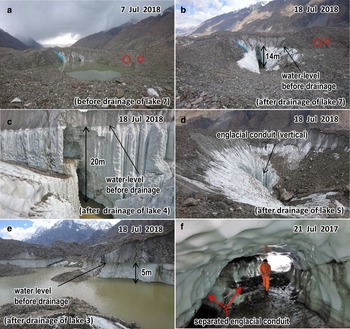
We now examine the cases of lakes 3–5 and 7. For lake 7, the water level drops ~14 m during the 17 July drainage event (Figs 7a, b). For lake 4, the images in Figure 7c show a 20 m drop, and during our survey, we found a large englacial conduit after drainage. For lake 5, Figure 7d shows a large, vertically oriented englacial conduit that was exposed after drainage on 18 July. Lake 3 drained a day earlier, showing a drop of ~5 m (Fig. 7e). From 8 to 17 July, before the drainage event, the water levels of lakes 1, 4, 7 and 8 gradually increased by 0.6–2 m. In contrast, the level of lake 5 decreased gradually by 2.5 m (losing 7999 m3) during 8–12 July and then maintained the same level before drainage on 17 July. Then, after the drainage event, lakes 4, 5 and 7 recharged, with two of them (4, 7) discharging again (23, 25 July). According to the analysis of PlanetScope satellite images, lake 5 also discharged again, but on a later date (7–9 August; Supplementary Table 2).
Field photos near several lakes. (a, b) Lake 7 before and after drainage on 17 July 2018. Red circles show landmark stones. (c) Lake 4 after drainage on 17 July 2018. (d) Lake 5 after drainage on 17 July 2018. (e) Lake 3 situation after drainage on 16 July 2018. (f) Separated englacial conduit at the location marked in Figure 2a.

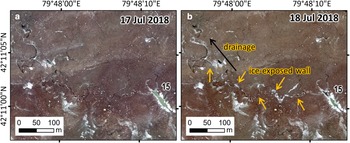
Of the seven lakes that drained on 17 July, five (1, 4, 5, 7, 8) also drained on 13 May. The two lakes (14, 15) did not discharge on 13 May, with both recharging to within 0.2 m of their pre-drainage water level within 3 d (Fig. 6c). These two lakes have the lowest elevations of all seven lakes in the event. This result suggests that the drainage path re-routed toward lakes 14 and 15 after the 13 May drainage event. For the drainage on 17 July, the water flowed through a complex mixture of englacial and supraglacial conduit. For instance, in the case of lake 15, Figure 8 shows ice walls that were exposed on the surface due to drainage water on 17 July. The position of the exposed ice walls changed between May and July (Figs 5, 8). This change indicates that the drainage route changed between May and July.
Drainage of lake 15 on 17 July 2018. Drainage route is marked by the black arrow and exposed ice wall is marked by yellow arrows in (b). New white areas in (b) show newly exposed ice. Ortho-images (a, b) were made from UAV data on 17 and 18 July 2018. Location is marked in Figure 2b.

Of the lakes that did not respond to the drainage event on 17 July, the five with white highlight in Figs 6a, b (2, 10–13) have a constant level through July (Fig. 6d). Lake 3 instead discharges on 16 July, and lake 6 discharges on both 10 and 15 of July (Fig. 6d). The water levels of lake 3 increase 0.6 m during 8–16 July before draining, whereas lake 6 increases 0.5 m during 8–9 July before draining the first time, and then gradually increases 4.2 m during 10–14 July before its second drainage. Soon thereafter, lake 3 drains 77 700 m3 of water (Fig. 7e). Lake water from lake 3 discharged mainly through a complex mixture of englacial and supraglacial conduit on 16 July (Fig. 9). But, some of the water from lake 3 flowed through a surface channel to lake 4. For example, the images in Figure 9 show exposed ice walls of an englacial conduit with some parts exposed on the surface due to erosion from the drainage of lake 3. The exposed ice was also observed in a field survey.
Drainage of lake 3 on 16 July 2018. Newly exposed ice occurs in (b) along the englacial conduit with some parts exposed on the surface due to debris washed away during the drainage. Black arrows show water-flow directions. Some lake water flowed to lake 4. Seven lakes drained the next day. Right box shows close-up of inset region. Yellow arrows show exposed ice along englacial conduit where most water flowed. Ortho-images (a, b) were made from UAV data on 16 and 17 July 2018. Location is marked in Figure 2b.

4.2.3 Drainage events in May and July 2019
According to Landsat-8 (21 May 2019), Sentinel-2 (28 May 2019) and PlanetScope (9, 11, 12 July 2019) images (Supplementary Table 2), drainage in 2019 occurred at lakes 1, 4, 5, 7 and 8 during 21–28 May, and lakes 1, 4, 7 and 8 during 9–12 July. These drainage events resembled those in 2018 except that lakes 14 and 15 did not discharge. After the first drainage in May 2019, exposed ice was observed on the same route as that in May 2018. This finding indicates that the first drainage event followed the same route in both years. The second event had less drainage and the route was hard to discern. After the drainages in July, each lake discharged at later, but different, times. From both UAV and satellite data, we determined that lake 4 discharged again on 14–15 July, whereas lake 7 discharged again on 24–27 July.
5. Discussion
5.1 Connecting to main or branch englacial conduits
Seven lakes (1, 4, 5, 7, 8, 14, 15) drained at the same time on 17 July 2018, indicating that they shared one or more englacial conduits despite being on different tributary glaciers. Five of them (4, 5, 7, 14, 15) recharged after the drainage event, with three of them (4, 5, 7) discharging again later, though at different times. The different times of discharge indicate that these three lakes no longer shared an englacial conduit after the earlier drainage event, suggesting that part of the englacial conduit system changed.
That the three lakes (4, 5, 7) recharged and then discharged suggests that their englacial conduit had closed temporarily and then opened. These lakes discharged again within a few days. This suggests that the conduit may not have completely closed. Such temporary blockages may be due to either a collapse (external or internal), or to transported material (debris or ice). Fountain and Walder (Reference Fountain and Walder1998) reported that englacial conduits develop vertically from crevasses, and then form complex branching networks by uniting with other englacial conduits. These englacial conduits are complex shapes such as curving and branching channels (Gulley and Benn, Reference Gulley and Benn2017; Gulley and others, Reference Gulley, Benn, Müller and Luckman2009). Such a network consists of a main conduit to which branch conduits connect from various lakes. The discharge event of each lake after recharging may be due to an opening of a branch englacial conduit connecting to the main englacial conduit.
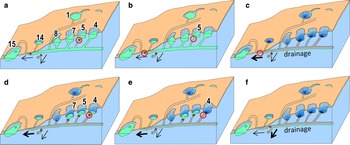
For the study site, we sketch such a network and time sequence in Figure 10. Consider first lake 5. Its first drainage on 8 July 2018 occurs when its branch englacial conduit connects to the main englacial conduit (Figs 10a, b). Although the englacial conduit is at the lake bottom (Fig. 7b), drainage had been impeded due to the deposition of ice and debris. Also, as it shares water with three other lakes (4, 7, 8), the water level stabilizes until the multiple-drainage event on 17 July (Figs 6c, 10c). This event drains lakes 1, 4, 5, 7, 8, 14 and 15 when the main englacial conduit opens (Figs 10b, c). This opening may be due to an increase in water pressure, at least partly due to the release of water from lake 5, to water supplied to lake 4 from lake 3 on 16 July, and to an increase of meltwater on the glacier surface. Then, temporal closure of each branch englacial conduit by debris and ice deposits (Fig. 10d) causes lakes 4, 5 and 7 to recharge. Subsequent discharging of these lakes then occurs due to branch conduits opening at different times as in Figs 10d, e. In this way, the branch englacial conduits allow small-scale drainage, whereas the opening of the main englacial conduit can cause large-scale drainage.
Estimated englacial network changes in the study site. (a) Distribution of lakes and englacial conduits. (b) First, lake 5 drains due to a newly opened connection between its branch and the main englacial conduit. (c) Simultaneous drainage of lakes due to opening of the main englacial conduit. (d) Recharging of each lake due to closure of the branch englacial conduits by debris and ice. (e) Re-discharge of each lake due to opening of a branch englacial conduit. (f) Simultaneous drainage occurs due to the opening of another route of the main englacial conduit.

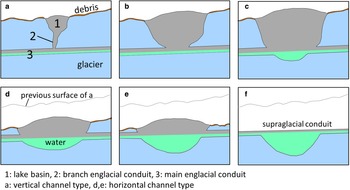
Based on these results, we group the development of lake basins and englacial conduits into several types in Figure 11. In Figure 11a, the branch englacial conduit has developed a mainly vertical connection between the main englacial conduit and the lake basin. This ‘vertical channel’ type fits lake 5. The basin expands due to back-wasting, collapse of an ice wall or ice melting around the basin (Watson and others, Reference Watson2017). For lakes 4 and 7 in 2019, we argue that the bottom of the basin connected to the main englacial conduit without a branch englacial conduit as sketched in Figs 11b, c. Later, as the glacier surface ablates, the main englacial conduit approaches the surface (Figs 11d, e). Eventually, the main englacial conduit is exposed on the surface, becoming a supraglacial conduit as in Figure 11f. This situation applies to lake 15, which we call a ‘horizontal channel’ type. Lake 15 retained water after the simultaneous drainage event because its basin was connected to the main englacial conduit directly without a branch englacial channel.
Development process of lake basin. (a) Vertical channel type. Lake basin connects to the main englacial conduit through a branch englacial conduit. (b, c) Lake basin connects directly to the main englacial conduit due to ice melting. (d, e) Horizontal channel type. Lake basin and main englacial conduit become closer to the glacier surface due to glacier melting. (f) Supraglacial conduit. The englacial conduit becomes exposed on the glacier surface.

A sudden recharge also suggests the presence of subsurface channels from other lakes. For example, in July 2017, after each of two drainages, the level of lake 1 increased 7.5 and 8.3 m over 1 d. The sudden and large increase indicates that inflow occurred from one or more lakes discharging through an englacial network.
5.2 Abandonment and reuse of englacial conduits
Of the seven lakes that drained simultaneously (1, 4, 5, 7, 8, 14, 15) on 17 July 2018, the first five of them also drained simultaneously 2 months earlier (13 May). Thus, the drainage route of the first five lakes did not pass through the last two lakes (14, 15) in May, yet did so in July (Figs 5, 8). This indicates a change in the englacial conduit between May and July. Specifically, the five lakes (1, 4, 5, 7, 8) and the two lakes (14, 15) did not connect through the main englacial conduit (Fig. 10f). But in July, the last two lakes connected to the first five through a former englacial channel that became exposed at the glacier surface.
In May and July 2019, four of the same five lakes (1, 4, 7, 8, but not 5) drained simultaneously, similar to their drainage events in May and July 2018. This repeating behavior indicates that the englacial conduit in 2018 and 2019 had the same network connections. As lake 5 did not drain in July 2019, its branch englacial conduit probably did not connect to the main englacial conduit.
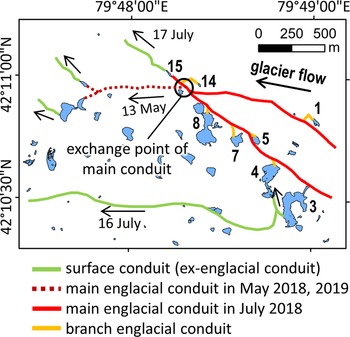
Based on this behavior, we propose the approximate location of conduits shown in Figure 12. The branch englacial conduits (orange) connect lakes or basins to a main englacial conduit (red). Part of the main englacial conduit changed between May and July 2018, as marked with a dotted red curve, and the main englacial conduit changed back again the next year in May 2019. These changes of main englacial conduit are consistent with the repeat cycles of abandonment and reuse reported by Benn and others (Reference Benn2012, Reference Benn2017). In addition, we observed an englacial conduit that split into two channels (Fig. 7f; photo locations in Fig. 2a). Thus, englacial conduits may contain several routes and continually change channels.
Estimated locations of the main and branch englacial conduits 2018–2019. The circled exchange point of the channel shows the location where the main englacial conduit changed from May 2018 to July 2018.

5.3 Phenomena of simultaneous drainage events
The DSM and water-level loggers showed the water level of several lakes to increase gradually before drainage, consistent with previous studies (Miles and others, Reference Miles2017b; Narama and others, Reference Narama2017). For example, Figure 13a shows the increase in water level of lakes 1, 4, 7 and 8, just before their simultaneous discharge on 17 July 2018. Three of these lakes (4, 7, 8) increase at nearly the same relatively low rate. If they were connected to the same englacial conduit and main englacial conduit closed completely, then their water levels should become the same, behaving like communicating vessels. However, their water levels have different elevations before drainage (Fig. 6c). Having the same gradual increases of water level at different elevation indicates that the opening of an englacial conduit may be caused by an increase in water pressure in the conduit with the increase in water level being due to an inflow of meltwater. Thus, the behavior suggests that they were connected to the same englacial conduits, but as their levels differed, the main conduit might not have closed completely.
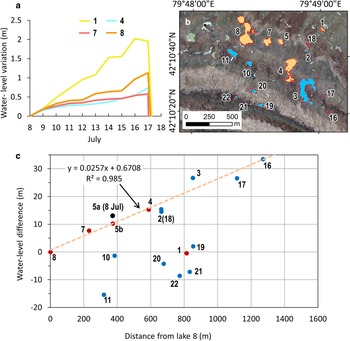
Characteristics of supraglacial lakes before the simultaneous drainage event on 17 July 2018. (a) Water-level increases of lakes 1, 4, 7 and 8. (b) Locations of supraglacial lakes. Red-outlined lakes participated in the drainage event. Blue lakes are not related to the drainage event. Location is marked in Figure 2b. (c) Water-level differences for each lake, depending on distance to lake 8. Red points (1, 4, 5b, 7, 8) are lakes that drained simultaneously. The blue points (2, 3, 10, 11, 16, 17, 18, 19, 20, 21, 22) are lakes unrelated to the drainage event. The black point (5a) is the water level of lake 5 before the first drainage on 8 July 2018, whereas 5b marks the water level before the second drainage on 17 July 2018.

In addition, we examined the relations between the water levels for all of the monitored lakes near lake 8 (Fig. 13b). In Figure 13c, we plot the horizontal distance from lake 8 versus the difference in lake-surface elevation. Lake 8 is the reference here because it was the lowest elevation lake in the group that drained simultaneously on 17 July 2018. As recent studies found that the hydraulic potential between supraglacial lakes is governed by the pressure gradient (Benn and Evans, Reference Benn and Evans2010; How and others, Reference How2017; Ravier and Buoncristiani, Reference Ravier, Buoncristiani, Menzies and van der Meer2018), we similarly fit a hydraulic gradient line between the lakes that drained. Four of these lakes (4, 5b, 7, 8) lie on the same hydraulic gradient line (orange dashed line) in Figure 13c, suggesting that if the main englacial conduit had not been completely closed, they would share water through the same englacial conduit. Most other lakes (10, 11, 19–22) are well below the line. Lakes 3 and 5a are slightly above the hydraulic gradient line, suggesting that they are not fully connected to the main englacial conduit. However, after the first drainage on 8 July, the lake level for lake 5 moves down to the line (5b) as sketched in Figures 10a, b, presumably because the englacial conduit became shared by four lakes (4, 5, 7, 8). Although lake 1 also drained in the drainage event (4, 5, 7, 8) on 17 July 2018, it does not lie on the hydraulic gradient line. This suggests that it drained through a different englacial conduit (Fig. 10c). Lake 1 also differs from 4, 7, 8 in having a different increase rate of water level (Fig. 13a), and in 2017, its water-level variations differed from that of the other four lakes. We also confirmed the same situation before and after lake 3 drained (Fig. 9). Lakes 20, 23, 25, 28 and 32 existed before drainage from lake 3 on 16 July 2018 (Supplementary Fig. 1a). These lakes lie on the same hydraulic gradient line (Supplementary Fig. 1b). We found that after lake 3 drained, these lakes developed on the same englacial conduit (Fig. 9b).
The three lakes with nearly the same rate in water-level increase (4, 7, 8) all fall on the same line in Figure 13c. As they also discharged simultaneously, they likely shared the same main englacial conduit. If this correlation is general, then lakes with the same rate of increase, and that lie along a hydraulic gradient line, may be more likely to share the same main englacial conduit. And if they do share the same conduit, then they would experience a simultaneous large-scale drainage event if their main englacial conduit opened. If so, then by using satellite data to monitor the variations of area and water levels of supraglacial lakes, one may confirm such a pattern of water storage and drainage events. In the Tien Shan, the total area of many supraglacial lakes has increased, due to glacier shrinkage under climatic warming (Wang and others, Reference Wang2013). We found here that the simultaneous drainage event that can produce large-scale flooding occurs from multiple supraglacial lakes on a debris-covered glacier. The larger the network connecting the lakes, the greater the potential amount of water that may discharge. In this way, monitoring the water levels of supraglacial lakes on a debris-covered glacier may help us predict the occurrence of some large-scale drainage events.
6. Conclusions
We used DSMs and ortho-images derived from an uncrewed aerial vehicle (UAV) to investigate daily water-level variations of supraglacial lakes on a debris-covered glacier in 2017, 2018 and 2019. Although the UAV has a limited range and survey period, and is dependent on the weather, the daily DSMs and ortho-images were very effective in enabling the understanding of the details of water-level variations on the southern Inylcheck Glacier. We observed several simultaneous drainage events and argued that for such an event to occur, each lake should be connected to the same main englacial conduit via a branch englacial conduit. Moreover, the larger the network connecting the lakes, the greater the water volume that may be discharged simultaneously. For the drainage events occurring from only one lake, the event indicated an opening of a branch englacial conduit to the main englacial conduit. In addition, the drainage routes of englacial conduits changed over a timescale of months. Debris and ice deposits sometimes closed one branch, leaving other ones open. Before a simultaneous drainage event, the water levels of the lakes tended to increase gradually. If several lakes shared the same main englacial channel and were on the same hydraulic gradient line, then they also showed similar rates of increase in water level. Therefore, by monitoring water levels, one might be able to determine which lakes share the same englacial channel.
These results may help us to predict possible large-scale drainage events that may lead to floods. But to apply the results to a given region, we need to monitor the region using daily, high-resolution satellite images and use the data to determine if the supraglacial lakes are likely connected via a main englacial conduit.
Supplementary material
The supplementary material for this article can be found at https://doi.org/10.1017/jog.2021.77.
Acknowledgements
We thank B. Moldobekov, R. Usubaliev, A. Osmonov, E. Azisov R. Kenzhebaev of the Central-Asian Institute for Applied Geosciences (CAIAG), Ak-Say Travel, Mizunuma of NSi Co. Ltd., T. Matsumoto, R. Nishii, Y. Mori, H. Takadama, S. Okuyama, M. Yamamoto and N. Honma of Niigata University. We also thank the editor J. Shea, H. Jiskoot and two anonymous reviewers for valuable comments that helped to improve the paper. This study was supported by Grant-in-Aid for Scientific Research (B) 16H05642 and 19H01372 of the Ministry of Education, Culture, Sports, Science and Technology (MEXT), and the Sasakawa Scientific Research Grant from The Japan Science Society, and Inoue Field Science Research Fund from The Japanese Society of Snow and Ice.


 Open access