


1. Introduction
Product development methods are intended to help engineers systematically create innovative, feasible, and user-oriented products (Reference Eppinger and ChitkaraEppinger & Chitkara, 2007; Reference Tyagi, Choudhary, Cai and YangTyagi et al., 2015). They provide structured guidance for translating requirements into design solutions, supporting decision-making, and reducing development uncertainty (Reference Greve, Fuchs, Hamraz, Windheim, Rennpferdt, Schwede and KrauseGreve et al., 2022; Reference Rapp, Kalgave and WitusRapp et al., 2020; Reference Relvas and RamosRelvas & Ramos, 2021). Nevertheless, many engineers rely more on intuition or experience than on structured methods, whereas academic teaching emphasizes method literacy as a core design competence (Reference CrossCross, 2011; Reference Tu, Liu and WuTu et al., 2018).
As a result, the actual impact of these methods on product quality remains a topic of debate (Reference Cash, Daalhuizen and HekkertCash et al., 2023; Reference Daalhuizen and CashDaalhuizen & Cash, 2021; Reference GranerGraner, 2013). Whether our methods improve design outcomes under realistic project conditions still is an open and frequently discussed question (Reference Eisenmann, Grauberger, Üreten, Krause and MatthiesenEisenmann et al., 2021; Reference Kuechenhof and KrauseKuechenhof & Krause, 2023; Reference Üreten, Spallek, Üreten and KrauseÜreten et al., 2020).
In parallel, the rapid emergence of generative artificial intelligence (GenAI, referred to as AI in this paper) is transforming engineering practice and design education (Reference Bahroun, Anane, Ahmed and ZaccaBahroun et al., 2023). These tools can support ideation, data analysis, and documentation tasks, and their benefits are well-documented in software-related fields (Reference Calegario, Burégio, Erivaldo, Andrade, Felix, Barbosa, Lucena and FrançaCalegario et al., 2023; Reference Makatura, Foshey, Wang, Hähnlein, Ma, Deng, Tjandrasuwita, Spielberg, Owens, Chen, Zhao, Zhu, Norton, Gu, Jacob, Li, Schulz and MatusikMakatura et al., 2024a, Reference Makatura, Foshey, Wang, Hähnlein, Ma, Deng, Tjandrasuwita, Spielberg, Owens, Chen, Zhao, Zhu, Norton, Gu, Jacob, Li, Schulz and Matusik2024b). However, their effectiveness in domains that require physical reasoning, abstraction, and balancing multiple objectives, such as mechatronic or hardware design, appears more limited (Reference AsunmonuAsunmonu, 2025; Reference Daase, Haertel, Nahhas, Zeier, Ramesohl and TurowskiDaase et al., 2024). This raises new questions regarding how AI interacts with established product development methods and whether it enhances or disrupts the methodological rigor these approaches aim to foster (Reference Khlaif, Salameh, Ajouz, Mousa, Itmazi, Alwawi and AlkaissiKhlaif et al., 2025; Reference Longo and AlbanoLongo & Albano, 2025).
Together, these developments highlight a research gap: Although product development methods are widely taught, and AI tools are increasingly integrated into engineering education, there is a need for a better understanding of how the quality of method application and AI usage jointly affect design outcomes. Prior studies have primarily examined either the effectiveness of AI tools in design tasks (Reference Khlaif, Salameh, Ajouz, Mousa, Itmazi, Alwawi and AlkaissiKhlaif et al., 2025) or the correlations between methods and learning effects in project-based settings (Reference Hohnbaum, Martins Pacheco, Ponn and ZimmermannHohnbaum et al., 2024; Reference Pacheco, Geisler, Bajramovic, Fu, Sureshbabu, Mörtl and ZimmermannPacheco et al., 2024). Still, the potential confounding role of AI needs to be systematically quantified.
To address this, this study investigates the relationship between method application quality and product concept quality in an undergraduate, project-based learning environment. The analysis also considers AI usage, perceived usefulness, and other related factors as potential mediators or confounders of academic success (Reference Rieger, Göllner, Spengler, Trautwein, Nagengast and RobertsRieger et al., 2022; Reference Schneider and PreckelSchneider & Preckel, 2017). This focus allows an initial assessment of whether product development methods remain robust in the context of AI-supported design. Accordingly, the study is guided by the following research questions
-
• What is the relationship between the method application quality and the resulting product concept quality?
-
• How do AI usage and related perception variables influence, mediate, or confound this aforementioned relationship?
Based on this, two hypotheses were formulated:
-
1. The method application quality correlates positively with the resulting product concept quality at a moderate to high level (r ≥ 0.3).
-
2. AI usage and related perception variables, like perceived usefulness, frustration, or effort, act as mediators or confounders of this relationship at a significant level.
This paper is structured as follows: Section 2 describes the study setup, data collection, and variable operationalization. Section 3 presents descriptive and correlational results. Section 4 discusses observed relationships, practical implications, and limitations of the study.
2. Method
2.1. Participants
The participants of this study were 149 students enrolled in a product development course during the academic summer term of 2025. As an initial survey revealed, most participants were undergraduate engineering students with little to no experience applying product development methods or developing product concepts. Participants formed project teams of three, resulting in 49 teams. Participants were offered optional lectures on product development approaches and corresponding methods, as well as opportunities for supervised exercises. Each method application entailed a mandatory submission of its results during the semester. The developed product concept was presented to a jury of industry and academic experts at the end of the academic term.
2.2. Study setup
Participants of this study worked in self-selected teams to design and conceptualize a bottling system based on customer requirements. The course followed a structured methodological framework derived from the Munich Product Concretization Model (MCM), which served as the pedagogical backbone for organizing the product development process (Reference Ponn and LindemannPonn & Lindemann, 2011).
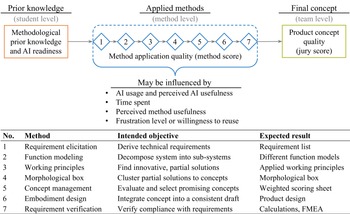
The MCM defines a sequence of abstraction layers that connect functions, working principles, and the embodiment of a product. It provides a structured mapping of methods and deliverables across these layers, linking early functional analysis to later embodiment and validation stages (Reference Ponn and LindemannPonn & Lindemann, 2011). Within this framework, students were guided to select and apply the predefined set of seven product development methods listed in Figure 1.
While the MCM served as the overarching organizational framework, its conceptual focus primarily lies in classifying product models and recommending appropriate development steps, rather than prescribing specific outcomes (Reference LindemannLindemann, 2009; Reference Ponn and LindemannPonn & Lindemann, 2011). Consequently, its use in this setting mainly ensured procedural consistency across teams but did not influence the content of the data collected for this study. The evaluated methods are widely established in traditional and contemporary product development frameworks (Reference Ehrlenspiel and MeerkammEhrlenspiel & Meerkamm, 2017; Reference Ponn, Hutterer, Braun, Birkhofer and EhrlenspielPonn et al., 2024); hence, potential bias introduced by the MCM as a course framework is considered negligible.
At the start of the course, all students completed a self-assessment survey that captured their prior methodological experience and familiarity with AI tools. These responses established the baseline variables for methodological prior knowledge and AI readiness. During the academic term, each participant documented their method applications in individual submissions and completed brief post-method surveys assessing perceived time effort, frustration, willingness to reuse the method, and the usefulness of both AI and method support.
In parallel, teaching assistants provided formative feedback on the exercises, while final submissions were summatively evaluated using rubrics specific to each method (Reference DawsonDawson, 2017; Reference PophamPopham, 1997). The course concluded with the external evaluation of the final product concept by a jury of industrial and academic experts. The resulting data reflect a hierarchical structure linking
-
1. Student level: individual prior knowledge and readiness,
-
2. Method level: repeated method applications and self-reports per participant and method, and
-
3. Team level: the final product concept evaluated by an external jury using a standardized rubric.
As illustrated in Figure 1, the central relationship examined in this study connects the method application quality (method score) to the jury-evaluated product concept quality (jury score). Other method-level variables were considered potential mediators or confounders of this relationship.
Study setup and hypothesized relationships (top) with corresponding methods used, their intended objectives, and expected outcomes (bottom)

Figure 1 Long description
A diagram representing the study setup and hypothesized relationships in product development methods. The diagram is divided into three main sections: Prior knowledge, Applied methods, and Final concept. Prior knowledge includes methodological prior knowledge and AI readiness. Applied methods consist of seven steps: Requirement elicitation, Function modeling, Working principles, Morphological box, Concept management, Embodiment design, and Requirement verification. Each method has an intended objective and an expected result. The method application quality may be influenced by factors such as AI usage, time spent, perceived method usefulness, and frustration level. The final concept is evaluated based on product concept quality, measured by a jury score.
2.3. Variables and assessment
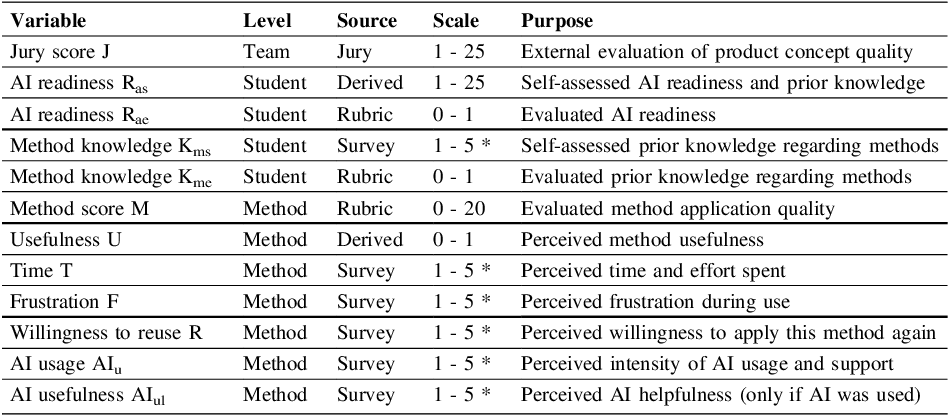
All variables examined in this study are summarized in Table 1. Data was collected on student, team, and method levels.
Product concept quality was assessed via jury score J, which served as an external evaluation of product concept quality. Derived from five rubric criteria (overall impression, technical feasibility, innovation, relevance, and special features), the concepts were rated by multiple jurors on a Likert scale and summed to a maximum of 25 points.
Method application quality M was assessed via rubric-based grades (0 - 20 points, method score) for each of the seven product development methods applied throughout the course. These method-level assessments were averaged per student to obtain an overall indicator of methodological performance.
Averaging was used to capture overall methodological rigor across the course and to reduce method-specific variability arising from differences in emphasis and cognitive demands across tasks. The resulting composite summarizes overall method application quality and should not be interpreted as evidence about any single method.
Students’ prior knowledge and readiness were obtained in two ways: Self-assessed AI readiness Ras was based on the mean of two Likert items (AI knowledge and AI usage frequency), while evaluated AI readiness Rae and evaluated method knowledge Kme were derived from qualitative free-text inputs scored against rubrics.
Additionally, self-reported time spent T, frustration F, perceived usefulness U, willingness to reuse R, AI use AIu, and perceived AI usefulness AIul were assessed for each method application as promising mediating or confounding factors (Reference Rieger, Göllner, Spengler, Trautwein, Nagengast and RobertsRieger et al., 2022; Reference Schneider and PreckelSchneider & Preckel, 2017).
All survey-based variables used five-point Likert scales unless stated otherwise. Derived variables were normalized for comparability.
Examined variables and their purpose for this study. Likert-scaled items are indicated with an asterisk (*); higher values represent stronger agreement or higher intensity. Method-level variables were assessed for each method application

2.4. Statistical analysis
All data processing and analysis were conducted using Python version 3.14 for descriptive and inferential statistics (Python Software Foundation, 2025).
Method-level variables were aggregated to obtain overall indicators per student. These aggregated values were merged into a unified student-level dataset, which contained individual method scores, self-assessed knowledge, and external jury evaluations for comparison with student- and team-level outcomes.
Descriptive statistics were used to examine data completeness, central tendencies, and distributions. Inferential analyses were primarily based on Pearson and Spearman correlations to assess the associations between method application quality, product concept quality, and potential confounders at student level. P-values were adjusted using the Benjamini–Hochberg false discovery rate (FDR) procedure to control for multiple comparisons for exploratory robustness checks (Reference Benjamini and HochbergBenjamini & Hochberg, 1995). All correlations were then classified into small, moderate, or strong effects according to Cohen’s d (Reference CohenCohen, 2013).
3. Results
The dataset comprised 149 students grouped into 49 project teams. Across all participants, 786 individual method evaluations were collected, resulting in an average of 6.2 completed method applications per student.
The jury score J as a measure of product concept quality averaged M = 16.7 (SD = 4.5, range 6-25), indicating a broad dispersion of concept quality outcomes. The mean method score M was M = 16.2 (SD = 3.2, range 7-20), suggesting satisfactory adherence to method procedures.
Regarding method-level perceptions, participants reported low to moderate AI usage AIu (M = 1.65, SD = 0.83, range 1-5), indicating that generative AI tools were employed occasionally rather than consistently. Perceived method usefulness U was moderate overall (M = 0.30, SD = 0.23, range 0-0.8), implying that students found methods helpful but not universally so. Frustration F (M = 2.72, SD = 0.99, range 1-5) and willingness to reuse R (M = 3.69, SD = 0.84, range 1-5) suggest that participants experienced moderate frustration but were generally open to reapplying the methods in future projects.
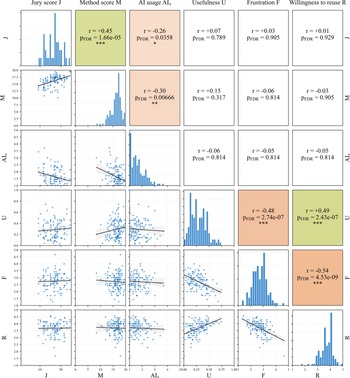
All variables listed in Table 1 were evaluated for correlations; however, only pairwise relationships with conclusive outcomes are presented in Figure 2 and are discussed further for brevity.
Pairwise relationships between selected variables after FDR correction across the complete set of tested correlations. Diagonal cells show histograms, lower triangles show scatter plots with regression lines and 95 % confidence intervals, and upper triangles display correlation coefficients r with FDR-adjusted p-values. Shaded cells indicate statistically significant correlations

3.1. Relationships and hypotheses
As shown in Figure 2, the correlational analysis confirmed hypothesis (1), revealing a clear and statistically significant positive relationship between method application quality M and jury-evaluated product concept quality J. This finding supports the assumption that more structured and rigorous use of product development methods is associated with higher-rated product concepts. The moderate effect size of the observed correlation (r = 0.45, pFDR < 0.001) further suggests that students with higher method scores M also tended to have more complete and feasible design concepts.
Hypothesis (2) addressed potential mediators or confounders of this relationship. AI usage showed a significant, moderate negative correlation with method application quality (r = −0.3, pFDR < 0.01) and a weakly significant correlation with concept quality (r = −0.26, pFDR < 0.05). This suggests that frequent AI use was associated with weaker outcomes, both in terms of method application and product concept quality.
Beyond these main effects, several internally consistent patterns emerged among perceptual variables. Perceived usefulness U, frustration F, and willingness to reuse R formed a coherent and statistically robust cluster (all |r| ≥ 0.48, pFDR < 0.001). As expected, higher frustration was associated with lower perceived usefulness and lower willingness to reuse, while usefulness and willingness to reuse correlated positively.
3.2. Student opinions on method application
Additionally, 345 opinions were submitted across all applied methods. Requirement elicitation and function modeling were often mentioned as helping participants grasp complex systems and think in a more solution-neutral way. Working principles and concept development (using the morphological box) were reported to foster creativity, systematic exploration, and transparent comparison of alternatives, with the morphological box frequently praised for supporting objective concept selection. The later stages, such as concept selection, embodiment design, and requirement verification, were commonly perceived as more practice-oriented, requiring tangible engineering decisions and feasibility considerations. The FMEA used within requirement verification was repeatedly noted as a clear and practical framework for identifying and assessing risks, providing what many perceived as a meaningful conclusion to the experienced design process.
Students’ critical remarks were primarily concerned with the perceived difficulty and varying intuitiveness of the individual methods. Working principles and function modelling were often described as abstract and demanding to apply, while embodiment design was characterized as detailed and time-consuming. Some participants found function modelling conceptually valuable yet cumbersome in practice, whereas requirement elicitation (especially formulation) was regarded as structured but overly formal. The evaluation process in concept management was sometimes viewed as subjective, despite its systematic scoring approach. Overall, students tended to value methods that appeared concrete and clearly structured (such as FMEA or the morphological box). At the same time, they expressed more mixed opinions toward abstract or effort-intensive methods.
The perceived usefulness of AI varied notably across methods. In the early phases, students reported using AI mainly for idea generation, term clarification, and phrasing support, which they found moderately helpful. During the working principles phase, AI was generally seen as least effective, as it could not adequately represent physical reasoning or methodological abstraction. In contrast, participants described more tangible benefits in concept management and requirement verification, where AI supported justification of design choices, material selection, exploration of manufacturing options, and risk estimation. In embodiment design, AI was said to assist occasionally with formula formatting, literature searches, and plausibility checks, although it rarely influenced the design outcome itself. Overall, students perceived AI primarily as a supportive tool for gathering, structuring, and documenting information; only a few reported to heavily rely on AI-generated results.
4. Discussion
4.1. Relationships
The results provide quantitative evidence that method application quality is a key correlate of concept quality in product development education. This confirms previous studies indicating that method-guided design is linked to more coherent and feasible outcomes (Reference Hohnbaum, Martins Pacheco, Ponn and ZimmermannHohnbaum et al., 2024). At the same time, the analysis revealed an unexpected negative association between AI usage and both methodological and conceptual quality. This aligns with similar studies, suggesting that, under current conditions, AI tools do not appear to integrate seamlessly into structured design processes yet (Reference Khlaif, Salameh, Ajouz, Mousa, Itmazi, Alwawi and AlkaissiKhlaif et al., 2025; Reference Longo and AlbanoLongo & Albano, 2025; Reference Mortlock and LucasMortlock & Lucas, 2024).
In contrast to domains such as programming, data analysis, or translation, where AI tools already yield clear efficiency and quality gains, conceptual design tasks rely more heavily on abstraction, problem structuring, and iterative reasoning (Reference AsunmonuAsunmonu, 2025). The observed negative relationship between AI usage and both method application quality (as measured by method score) and product concept quality (as measured by jury score) therefore suggests that, in its current form, AI assistance may not yet align well with the cognitive demands of early-phase product development.
The significant and internally consistent correlations among usefulness, frustration, and willingness to reuse further strengthen confidence in these findings. Their direction and magnitude align with the expected correlations for academic success (Reference Schneider and PreckelSchneider & Preckel, 2017). These internal validations support the robustness of the overall dataset and reinforce the likelihood that the main effects reflect genuine behavioral patterns rather than measurement artifacts.
Students’ qualitative statements partially supported this interpretation. Methods that required systematic reasoning, such as requirement elicitation and function modeling, were described as cognitively demanding but valuable. In contrast, more tangible and structured methods, such as the morphological box or requirement verification, were viewed as more transparent and easier to apply. AI usage was described as moderately helpful for documentation, ideation, and phrasing, but rarely as influential in the core reasoning process. These perceptions, while anecdotal, complement the statistical findings that AI support tends to assist peripheral rather than conceptual design tasks.
4.2. Practical implications
These results emphasize the importance of a guided and reflective integration of AI tools into design education and engineering workflows. In educational settings, students should be trained not only in how to prompt or query AI tools but also in when and how such use is methodologically appropriate. Embedding explicit reflection or comparison phases can help maintain rigor and critical thinking while preventing over-reliance on AI assistance (Reference CachoCacho, 2024).
From an industrial perspective, these findings caution against uncritical integration of generative AI into early development workflows. While AI can accelerate documentation or ideation, it could be associated with premature convergence or surface-level reasoning when used without methodological scaffolding (Reference Li, Lu, Xu and GaoLi et al., 2025; Reference Ravarini, Canavesi and PasseriniRavarini et al., 2024). Organizations should therefore combine AI implementation with method training and clear usage frameworks, ensuring that design teams preserve traceability, justification, and conceptual depth. This becomes particularly relevant when incorporating AI into structured industrial workshops or transformation processes. Here, structured transformation approaches can systematically leverage existing production assets while maintaining methodological rigor, which must equally apply when integrating AI to ensure it acts as a facilitator rather than a substitute within innovation processes (Reference Zapfe, Hohnbaum, Mörtl and ZimmermannZapfe et al., 2025).
4.3. Limitations and future research
Although the overall sample size of 149 students across 49 teams provides a solid basis for descriptive and correlational analysis, a larger data set or replication across multiple academic terms would allow for more robust statistical testing and broader generalization of the findings. Future work should therefore aim to collect longitudinal data to identify patterns of AI integration and methodological behavior over time.
Both the jury evaluations and several self-assessed variables are subject to potential bias. Jury ratings, while conducted using standardized rubrics, may still reflect subjective preferences or differences in interpretation among evaluators (Reference Boudier, Sukhov, Netz, Le Masson and WeilBoudier et al., 2023; Reference Stylidis, Wickman and SöderbergStylidis et al., 2020). Similarly, students’ self-assessments of prior knowledge, effort, or AI usage can be influenced by confidence, perceived performance, or social desirability biases. Triangulating these measures with behavioral or log data could improve reliability in future studies (Reference Shrivastava, Shah and NavaidShrivastava et al., 2018).
The educational setting itself may introduce systematic biases, both for students and teachers. Blind-spot biases cannot be ruled out during evaluation in this setting (Reference Staats, Capatosto, Tenney and MamoStaats et al., 2017). Additionally, Students often face competing goals such as grading requirements or time constraints, which may not reflect real-world product development conditions. Consequently, observed relationships should not be directly transferred to professional contexts without further validation (Reference Bodur and AkbulutBodur et al., 2022; Reference Juliá Sanchis, Jordá Vilaplana, Valor Valor, Pla Ferrando, Sempere Ripoll, Picó Silvestre, Bonet Aracil and Martínez CerverJuliá Sanchis et al., 2017).
Finally, this study is correlational in nature and does not establish causal relationships. While higher AI usage was associated with lower method application and product concept quality, this does not necessarily imply that AI use causes weaker outcomes. It is plausible that unstructured or compensatory AI use occurred among students with lower prior knowledge or motivation. AI may also facilitate rapid, surface-level completion of deliverables, enabling submissions that appear plausible initially but do not withstand closer evaluation. Future analyses should therefore model potential causal structures explicitly, for instance, using Directed Acyclic Graphs (DAGs) or structural equation modeling to disentangle mediating and confounding effects (Reference PearlPearl, 2009; Reference Shrier and PlattShrier & Platt, 2008).
5. Conclusion
This study empirically examined the relationship between method application quality and product concept quality in a project-based learning environment, incorporating potential mediators and confounders, such as the use of generative AI tools in the process. The findings provide quantitative evidence that method application quality correlates positively with product concept quality, supporting the core assumption underlying structured design education.
At the same time, the results revealed that AI usage correlated negatively with both method application quality and product concept quality. Although this finding was unexpected, it likely reflects the current state of maturity of AI tools in the context of conceptual design (Reference Khlaif, Salameh, Ajouz, Mousa, Itmazi, Alwawi and AlkaissiKhlaif et al., 2025; Reference Longo and AlbanoLongo & Albano, 2025). Unlike in software engineering or data analysis, where AI already offers substantial benefits (Reference Calegario, Burégio, Erivaldo, Andrade, Felix, Barbosa, Lucena and FrançaCalegario et al., 2023; Reference Makatura, Foshey, Wang, Hähnlein, Ma, Deng, Tjandrasuwita, Spielberg, Owens, Chen, Zhao, Zhu, Norton, Gu, Jacob, Li, Schulz and MatusikMakatura et al., 2024a), design processes rely on structured abstraction and iterative reasoning that are not yet effectively supported by existing AI systems (Reference AsunmonuAsunmonu, 2025; Reference Daase, Haertel, Nahhas, Zeier, Ramesohl and TurowskiDaase et al., 2024).
However, this limitation is likely temporary. As AI models evolve to better understand design reasoning, problem framing, and physical constraints, their potential to support creative engineering work will increase rapidly. For now, the observed pattern suggests caution: unstructured or compensatory AI use may coincide with weaker method application, emphasizing the need for guided, reflective integration of AI tools into design education and practice.
Acknowledgement
This research was conducted as part of the TuWAs (FKZ: 16THB0007E) research project, funded by the German Federal Ministry for Economic Affairs and Energy (BMWE). We thank all the students who participated and all the teaching assistants who supported and enabled this study.

 Open access

