


1. Introduction
Addressing climate change requires diverse and flexible energy solutions, and hydrogen is increasingly recognized as a key enabler for achieving both near-term and long-term sustainability goals (Reference Andrews and ShabaniAndrews and Shabani 2014). A sustainable hydrogen economy fundamentally depends on reliable hydrogen storage, which enhances the versatility of energy systems across stationary, portable, and transportation applications (Reference Brindhadevi, Kamarudin and PugazhendhiBrindhadevi et al. 2026). Although electrification dominates passenger vehicles, certain sectors, such as aviation (Reference VerstraeteVerstraete 2009) and heavy-duty transport (Reference Liu, Wang, Li, Yuan, Huang, Li and LiLiu et al. 2022), still lack viable decarbonisation alternatives (Nature 2022). Independent of the application, there are challenges in safely managing hydrogen, a substance characterized by high flammability, whilst being colourless and odourless, which complicates leak detection (Reference Al-Douri and GrothAl-Douri and Groth 2024; Reference Rasheed, Shafi, Anwar, Khurshid, Naveed and AlshoaibiRasheed et al. 2026). Hence, compared to petrol, as current standard for vehicle fuelling, where leaks are often noticeable and manageable, hydrogen leaks pose more severe safety risks, especially outside industrial settings where users cannot directly monitor vessel conditions. Consequently, preventing storage failures is critical for safe, widespread adoption of hydrogen technologies. A pressing need remains for design methods to improve the durability, reliability, and safety of storage containers and pipelines under operational stresses, such as cyclic loading, high pressures, and low temperatures (Reference Rasheed, Shafi, Anwar, Khurshid, Naveed and AlshoaibiRasheed et al. 2026). A key enabler is to design storage containers with ‘smart’ ability to monitor and prognose their state.
While strain gauges and finite element analyses are well-established tools for structural assessment, their application in hydrogen pressure vessels is typically limited to validation tests or isolated measurements under laboratory conditions. What is currently missing is a systematic design-oriented methodology that defines where, how many, and which strain sensors are required to reliably capture relevant degradation mechanisms under realistic operating conditions, while remaining compatible with lightweight and cost-sensitive storage systems.
This paper therefore proposes a sensor-oriented design approach for hydrogen storage vessels that combines experimentally measured strain data with structural analysis to identify critical load paths and damage-sensitive regions. The approach is experimentally enabled by a high-frequency, high-pressure hydraulic test bench, which allows accelerated fatigue testing under realistic pressure amplitudes and cycling rates. The contribution lies not in the individual use of strain gauges or simulations, but in the structured integration of sensor placement, load interpretation, and failure-relevant strain signatures into a scalable monitoring concept. The presented work establishes the experimental and methodological foundation for in-situ condition monitoring. The extension towards data-driven remaining useful life prediction and fully “smart” storage vessels is discussed as a perspective for future work.
2. Research background and state of the art
The following sections introduce the relevant details of the research background and established means of hydrogen storage as well as failure modes and health monitoring approaches.
2.1. Hydrogen storage
Hydrogen storage can be categorised into three main technical types: gaseous, liquid, and solid-state (Reference Habibi, Hosseini and WangHabibi et al. 2026). Of these, compressed gas storage is the most common and mature technology as it is the simplest (Reference Rasheed, Shafi, Anwar, Khurshid, Naveed and AlshoaibiRasheed et al. 2026). Here, hydrogen is compressed and stored in cylinders at pressures typically ranging from 350 to 700 bar (Reference Panek, Deutschmann and KrausePanek et al. 2025) and can be used directly in fuel cell vehicles (Reference BethouxBethoux 2020). These vessels fall into one of five categories, starting with such made entirely of metal (type I), to those with a steel shell partly lined with composites (type II), to those with a fully covered metal liner (type III), to those with a fully covered polymer liner (type IV), and finally such fully made from composite materials with no metal or polymer liner (type V) (Reference Air, Shamsuddoha and Gangadhara PrustyAir et al. 2023). For applications where weight is a key consideration, types III, IV or V are usually preferred. The addition of fibre-reinforced polymers (FRPs) structures, or reliance on them, makes calculation and monitoring more challenging, as will subsequently be described.
2.2. Failure modes in composite hydrogen vessels
Fibre-reinforced polymers (such as Carbon or Glass Fibre) have become increasingly relevant in a multitude of applications due to their lightweight and mechanical properties. For components subjected to repeated loading cycles, the excellent fatigue resistance of fibre-reinforced polymers (FRPs) contributes decisively to prolonged operational lifetimes. For these very reasons, Composite Overwrapped Pressure Vessels (COPVs) have been increasingly chosen over metallic vessels (Reference BarthélémyBarthélémy 2012). However, predicting and modelling fatigue failure and fatigue life in FRP-based products is extremely challenging, due to the variety in existing FRPs and the fact a small variation can greatly influence the material properties and damage modes (Reference Elenchezhian, Vadlamudi, Raihan, Reifsnider and ReifsniderElenchezhian et al. 2021). In FRPs, fatigue failures are usually the result of fibre or matrix cracking and matrix debonding or delamination (Reference Guo, Li, Niu and XianGuo et al. 2022). As FRP-based products, COPVs share some of these failure mechanisms (Reference Bouhala, Polesel, Karatrantos, Perbal, Senf and HiekelBouhala et al. 2025) but their initiation is more complex, as it is generated by internal pressure, thermal stresses or manufacturing flaws (Reference Khan and KumarKhan and Kumar 2025). Commonly, the FRP layer of the pressure vessels experiences cracks, delamination and fibre fractures, similar to FRP coupons. These failure modes dominate when the COPV is of Type IV or V, i.e., when the vessel is entirely made out of FRP and does not possess any metal liner. In Type II or III, liner failure due to cyclic loading and the generation of micro-cracks in the metallic liner can result in leakage or a gradual worsening of the mechanical properties, ultimately leading to a burst failure (Reference Liang, Li, Liu, Feng, Chen and LiLiang et al. 2026; Reference Zhang, Lv, Kang, Zhou and ZhangZhang et al. 2019).
2.3. Hydrogen composite pressure vessels monitoring methodologies
Multiple structural health monitoring (SHM) approaches have been proposed. Methods can be split into passive SHM (signal measurement) and active SHM (excitement of the structure and study of the response) (Reference Bouhala, Polesel, Karatrantos, Perbal, Senf and HiekelBouhala et al. 2025). Methods further vary based on the type of sensor (local or global monitoring) and the data processing method (physics-based or data-driven, static or dynamic). Reference Meemary, Vasiukov, Deléglise-Lagardère and ChakiMeemary et al. (2025) report piezoelectric (acoustic emissions sensors), strain gauges and fibre optic (often of the fibre Bragg grating type) sensors are the most commonly used, either embedded directly in the composite material or surface mounted onto the structure. Recent advances in material technology have also enabled the use of self-reporting coatings as sensors (Reference SajiSaji 2025). However, embedded fibre optic sensors and smart coatings can be extremely costly, making them hardly scalable for consumer applications. Another common stream of methods uses thermography or image tracking to infer the presence of a failure or compute the remaining life (Reference Shao, Betti, Carvelli, Fujii, Okubo, Shibata and FujitaShao et al. 2016; Reference Ueno, Xu and WatanabeUeno et al. 2013). The real-life implementation of such methods can be challenging, as they require a source of light and sufficient space, which can be complicated in some cases (e.g., most mobile applications). Thermal or high-resolution cameras are also a substantial cost. As such, methods using surface-mounted piezoelectric or piezoresistive sensors, including strain gauges, appear as the more accessible and cost-effective option and therefore form the basis of this study. One stream of data processing is to compare sensor data to physics- and model-based generated data to predict damage, fatigue failure progression and remaining useful life (Reference Khan, Azad, Sohail and KimKhan et al. 2023). However, the systematic use of physics-based models is arduous in real-life applications, as manufacturing information or variation is not always available and prevents the establishment of accurate models without further experimentation. Another stream of data processing methods directly uses acquired signals (Reference Meyer zu Westerhausen, Kyriazis, Hühne and LachmayerMeyer zu Westerhausen et al. 2024) or combines them with machine learning models to perform detection, localisation, diagnosis or prognosis of fatigue failure modes (Reference Elenchezhian, Vadlamudi, Raihan, Reifsnider and ReifsniderElenchezhian et al. 2021). Set-up and scale-up of such methods is more affordable and constitutes the focus of this work.
2.4. Fatigue failure detection and prognosis using piezo sensors
Surface mounted piezo sensors are valuable for their simplicity of installation and capability to be mounted in tight spaces with high accuracy in composite applications (Reference Bjørheim, Siriwardane and PavlouBjørheim et al. 2022), without introducing defects as embedded sensors may (Reference Kalamkarov and GeorgiadesKalamkarov and Georgiades 2002). The processing and interpretation of the sensor data is enabled using machine learning methods. Reference Karapanagiotis, Breithaupt, Duffner and SchukarKarapanagiotis et al. (2025) distributed optical fibre sensors on the surface of a COPV, enabling the capture of strain data at a 2.6 mm spatial resolution. A regression model is then used to predict the strain and the difference with the measured strain is used as a damage detection index. Within the last few cycles of the experiments, the measured strain increases and strays away from the expected strain. Despite good detection performance before failure, no remaining useful life (RUL) calculation is performed and requires 20 meters of optic fibre. Reference Khaled, Vasiukov, Shakoor, Bennebach and ChakiKhaled et al. (2024) propose a methodology based on the construction of a digital twin, the data part of which is based on capturing strain data using strain gauges sensors. However, this approach requires the building of a physical model which can be difficult for the reasons mentioned above. Reference Rocha, Antunes, Lafont and NunesRocha et al. (2024) monitor a COPV with embedded fibre Bragg grating sensors during more than 20,000 cycles. The authors note a change in strain when approaching failure and again do not perform RUL calculations. Other works, such as (Reference Charmi, Heimann, Duffner, Hashemi and PragerCharmi et al. 2024) have applied active SHM schemes in combination with timeseries-adapted deep learning models for fatigue failure detection. Past literature suggests that strain is a key element to monitor for fatigue failure detection and very much often employs expensive fibre-based sensors to do so. The use of strain gauges as stand-alone sensors (without further integration with a physical model) for fatigue damage prediction and RUL calculation, underpinned by machine learning models, remains underexplored.
2.5. Test regimes for vessels or cylinders
The existing standards for the design and certification of hydrogen components are limited to refuelling processes in the automotive sector (e.g., SAE J2579 and SAE J2601), or to fuel cells in general (IEC/EN 62282 series and UN ECE R 134 standards). Test standards in the aviation industry (RTCA DO-160 and EUROCAE ED-14) do not yet consider hydrogen or the associated challenges of testing components. Little research has been conducted into the fatigue and damage behaviour of carbon fibre pressure vessels, or the relationship between cumulative pressure cycles, structural damage, and pressure vessel failure. However, the SAE J2719 standard (SAE 2020) already provides guidelines for orientation purposes and includes framework conditions for durability or performance tests. Nevertheless, storing hydrogen under high pressure remains challenging, particularly as working pressures are increasingly reaching up to 700 bar (Reference Burgess, McDougall, Newhouse, Rivkin, Buttner and PostBurgess et al. 2011). As the aforementioned test specifications are relatively new, there is currently limited understanding of how test results can be applied to real-world scenarios, particularly with regard to the impact of damage or minor defects resulting from manufacturing or assembly. However, independent of the application to vessels, there are standards regarding the testing and identification of fatigue of polymer matrix composite materials, like the ASTM 3039/D3039M-17 (ASTM 2008).
3. Design methodology
The proposed design approach for monitoring and predicting life of hydrogen storage vessels involves a series of structured steps, summarised in the flow chart presented in Figure 1. They include vessel design or acquisition; identification of structural weak points through simulation; strategic sensor placement; laboratory validation of sensor data and simulation results; and continuous in-situ monitoring. Details of each phase are described below.
Proposed methodology towards smart vessels with in-situ monitoring

3.1. Vessel design or acquisition
The first step in the methodology is to design or select an appropriate vessel for analysis and testing. For this preliminary study, commercially available FRP hydrogen storage vessels were employed. Using such off-the-shelf vessels reduces the complexity and cost of manufacturing custom vessels while providing realistic and representative models for simulation and testing, and provides a scenario of designing the critical monitoring and prediction system of the smart vessel. This choice ensures that the findings are relevant to widely used practical applications. Using standardised vessel models facilitates efficient simulation and validation processes, ensuring the relevance and scalability of the results. Overall dimensions of the cylinder are: 54mm outer diameter, 36mm inner diameter, with a total length of 251 mm. Analysis of the cylinder shows that, in fact, there are three layers of different materials incorporated in the physical cylinder (see Figure 2) arranged around a core of 7 mm 6016 series Aluminium.
Section view of the cylinder, including its layer-setup

3.2. Weak point identification
In preparation of physical experimentation, Finite Element Analysis (FEA) is applied to simulate the cylinder’s behaviour under internal pressure. This serves three design purposes; firstly, we seek to verify the qualitative and quantitative stress and deformation behaviour of the cylinder to predict maximum internal pressures before burst failure and fatigue life after cycling loading; second, we want to identify appropriate placement of strain sensors to capture the resulting stresses and deformations accurately; and finally, we want to understand the general mechanical performance and support of the composite wrapping around the Aluminium core of the cylinder under load. The results will also guide the targeted placement of monitoring sensors, based on the identified weak points.
FEA was carried out using Siemens NX (2412) Nastran because of its established high performance in modelling ply-based composite structures as well as multi-body analysis where the user is given a lot of opportunity to parametrise the solver parameters and model setup. This lends itself for simulation of a Type III pressure cylinder, such as the one studied here, where a metal inner core is supported by an outer fibre-based reinforcement layer, composed of multiple plies at different fibre orientations.
The vessel setup was replicated in NX using the laminate functions combining 2D shell elements representing the composite wrapping of glass and carbon fibre, with 3D shells for the aluminium core. Composite plies were assumed as bonded UD tapes with orthotropic material properties mimicking the identified fibre orientations per each ply.
3.3. Sensor positioning
The positioning of the sensors (HBM 1-LY18-6/120GE) is based on FEA and a thorough review of the relevant literature, targeting regions of high principal stress, stress gradients and expected damage initiation. This enables focused and efficient strain data acquisition during in-situ stress monitoring. The aim is to target regions where critical stress is expected. To ensure comprehensive validation and accurate strain assessment at this stage, multiple sensors may be positioned at various locations beyond the identified weak spots. This approach enables robust capture of strain behaviour under operational conditions. Figure 3 shows the placement of sensors on one of the used FRP vessels. In addition to the strain gauges, also a thermocouple for temperature monitoring of the vessel (externally) is added. During later tests, other positions, like the bottom of the vessel, were also equipped with a sensor.
Placement of different sensors on the FRP vessel during the first tests

Figure 3 Long description
A diagram of a cylindrical vessel with various sensors attached. The vessel has several labels indicating the placement of different sensors. The labels include Top Strain Gauge 0 degrees, Top Strain Gauge 90 degrees, Centre Strain Gauge 0 degrees, Centre Strain Gauge 90 degrees, and Thermocouple. The sensors are connected with wires and secured with straps around the vessel.
3.4. Details of high-pressure tests
Laboratory experiments are carried out to validate simulation predictions and assess sensor setup performance under controlled conditions. This ensures the accuracy and reliability of the monitoring approach. To likewise gain a better understanding of the properties of the FRP vessels in this study, two different tests are conducted. First, a static high-pressure burst test is performed to determine the maximum load that the sample can withstand. These insights are then valuable for planning the cyclic tests. For high-load endurance tests with shortened cycle times, 70 to 90% of the maximum load (or ultimate tensile strain) is typically targeted (Reference Eliasson, Wanner, Barsoum and WennhageEliasson et al. 2019). However, as cyclic testing can have different effects on the material and asset, the maximum static load can be much higher than the cyclic load. The maximum pressure of the cyclic load is targeted to be between the vessel’s highest rated pressure and the maximum pressure determined in the static test. This pressure is deliberately set higher than the load of standard usage in order to accelerate deterioration and achieve quicker results at this stage of the process. Different test rigs and setups are used for these two tests, as described below.
While the ‘final’/in-situ setup does not involve the use of cameras, the test rigs are equipped with them to provide a live view of the test chamber or shielding. These cameras are solely intended to assist with the testing procedure and are not used as data sources for monitoring and prognostics.
The vessels are intended for use in storing hydrogen. At this point in the testing, for safety reasons and from a mere standpoint of the occurring strain, oil (type ISO VG xx) was chosen to be used for the pressurisation instead. Due to its lower compressibility and permeability, as well as the factor of flammability of hydrogen, this allows for a much easier and safer test setup while still applying comparable strain to the structure. The strain is captured using metallic strain gauges (see previous section), as they are easier to handle and cheaper than fibre optic gauges.
3.4.1. Burst test setup
To find out the maximum pressure that the FRP vessel can withstand, it is first safely placed inside a high-pressure test chamber, which allows for effective shielding. To catch any oil that might spill during the burst of the vessel, a smaller, flexible spill container is placed around it. A pressure sensor and camera enable the pressure values to be acquired and provide a live view of the shielded test setup. Pressure is manually applied using an ultra-high-pressure hand pump. During the test, the 0.3 L vessel is slowly pressurised by adding 0.65 cm3 of oil to the system with each stroke of the hand pump. Figure 4 shows a schematic diagram of the setup of the one conducted burst test (left) and a live view inside the spill container (right), as provided by the camera.
Test setup of burst test (left) and view inside the spill container (right)

3.4.2. Cyclic test setup
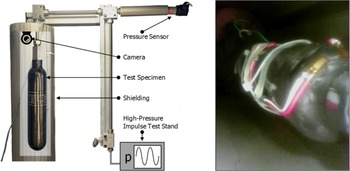
For cyclic testing, a high-pressure impulse test stand is used. This allows sinusoidal pressure loads to be applied automatically. The test rig has sophisticated controls that identify failures in the system and automatically abort the test procedure. This means that, although vessel failures are still targeted, a high-pressure burst, as occurs with the other test rig, is not expected. Nevertheless, the bottle is placed inside a metal shield to prevent oil, particles or fragments from flying around. A pressure sensor and camera allow the test procedure to be monitored once again, as illustrated in Figure 5. Sensors were placed according to the description in Section 3.3. A total of 12 vessels were tested with this setup, with frequencies between 5 and 10 Hz.
Test setup of cyclic tests (left) and view inside the shielding (right)

Figure 5 Long description
Panel A: A diagram of a test setup for cyclic tests on a composite overwrapped pressure vessel. The setup includes a pressure sensor, camera, test specimen, shielding, and a high-pressure impulse test stand. The pressure sensor and camera are mounted on an arm above the test specimen, which is a pressure vessel. The shielding surrounds the test specimen, and the high-pressure impulse test stand is positioned below the vessel. Panel B: A close-up view inside the shielding, showing the internal structure of the pressure vessel with visible cracks and delamination.
Different test settings are performed with changes to the maximum target pressure ranging from 600 to 900 bar, and to the frequency ranging from 5 to 20 Hz. Since higher frequencies result in higher temperatures in both the oil and the material, this is closely monitored using the sensors and controls of the test rig. For now, the values of each sensor are acquired at a frequency of 600 Hz, with the option to adapt this frequency according to needs and actually required input for processing later on.
3.5. In-situ monitoring
The final step involves the continuous monitoring of hydrogen storage vessels during operational use or use in a live environment. The aim of this phase is to enable real-time structural health assessment and lifetime prediction. The detailed implementation and analysis of in-situ monitoring is not the focus of this initial study and will be further addressed as part of future work.
4. Results
This section presents the results of the numerical simulations and laboratory experiments conducted on FRP hydrogen storage vessels. First, the FEA results are discussed, highlighting the key stress and deformation patterns that guided sensor placement. Next, the experimental findings from static burst and accelerated cyclic tests are detailed to provide critical insights into the vessels’ failure mechanisms and durability under operational conditions. Together, these results provide the fundamental knowledge required to evaluate and refine the proposed in-situ monitoring approach.
4.1. Simulation results
The FEA simulation (uniform internal pressure, fixed boundary at the neck) was well capable to identify the most appropriate locations of the strain gauges along the cylinder. The main principal stresses were found to occur along the cylinder wall in the middle of the structure (see Figure 6a). As such, strain gauges were placed along the length of the cylinder. A negative stress concentration was observed at the neck of the bottle, indicating a compression zone. This region was instrumented with a strain gauge and experimentally confirmed to exhibit compression rather than tension. Another finding is the maximum simulated deformation at the lower end of the main cylinder body (not the bottom area itself, see Figure 6b). This location coincided with the later burst failure of the cylinder.
a) Principal stresses at 750 bars pressure, b) Deformation of cylinder at 750 bars

4.2. Lab test results
The burst test showed a sudden, catastrophic failure of the Type III pressure vessel at 1,700 bar, exceeding the design limit. At failure, an additional volumetric expansion of 42.25 cm³ was measured. No precursor phenomena were detected, indicating brittle and instantaneous rupture. Post-test inspection (Figure 7, left, top) revealed fibre-dominated fracture with extensive delamination and peeling in the dome region, while the aluminium liner was severely torn. Three additional specimens were tested under cyclic pressurization between 100-900 bar (53 % of burst pressure) at 5-10 Hz. All specimens exhibited leak-before-break behaviour after approximately 4,000-5,500 cycles, while further tests reached up to ∼40,000 cycles at 50-450 bar. Leakage originated from crack initiation in the aluminium liner, followed by progressive damage of the adjacent CFRP layers, enabling localized oil permeation through the fibre structure. Figure 7 (left, bottom) shows the observed crack, including a magnified excerpt. No structural fragmentation was observed, but cyclic degradation led to loss of containment. Exemplary strain gauge results under cyclic pressurization are shown in Figure 7 (right).
Results of the burst test (left, top), Failure after cyclic pressurization (left, bottom) and exemplary strain gauge results under cyclic pressurization (right)

Figure 7 Long description
The image consists of three elements: one photo, one close-up photo, and one line graph. The photo on the top left shows a burst test of a composite material, highlighting the failure after cyclic pressurization. The close-up photo on the bottom left provides a detailed view of the failure area, emphasizing the structural damage. The line graph on the right displays the mean strain value over a single cycle, with the y-axis labeled as Mean strain (μm/m) and the x-axis labeled as Time (s). The graph includes two data series: Strain Gauge 1 (0°) in blue and Strain Gauge 2 (90°) in red. Both strain gauges show an increase in mean strain over time, with Strain Gauge 2 exhibiting a higher mean strain compared to Strain Gauge 1.
4.3. Reflection on results
The strong correlation between simulation outcomes and experimental data confirms the reliability of the FEA model in predicting regions of critical stress and deformation behaviour within Type III hydrogen storage vessels. The identified distribution of principal stresses along the cylinder wall is consistent with fundamental theories of pressurised cylindrical structures, while the experimentally confirmed compression zone at the neck can be attributed to the constrained expansion of the locally thicker material at reduced radius. The agreement between simulated stress states and measured strain responses demonstrates that the simulation can effectively identify structural weak points, thereby informing optimal sensor placement for comprehensive strain monitoring and providing confidence in the model for further investigations. The location of maximum simulated deformation at the lower end of the main cylinder body coincides with the experimentally observed burst failure, indicating an accumulation of deformation originating from the pressure inlet region. This further supports the capability of the combined numerical-experimental approach to capture failure-relevant load paths and deformation mechanisms. Contrasting failure modes revealed by burst and cyclic testing highlight important considerations for monitoring and safety. Burst tests exhibited brittle, instantaneous fracture without detectable precursor signals and without evidence of stable crack growth, which is consistent with burst and fatigue failure mechanisms reported for Type III composite pressure vessels in the literature. In contrast, cyclic testing revealed a pronounced leak-before-break behaviour characterised by progressive crack initiation in the aluminium liner, followed by damage propagation into the surrounding CFRP layers. The early onset of degradation at only 53 % of the ultimate strain level illustrates the strong interdependencies between the metallic liner and composite overwrap and underlines the limitations of conventional lifetime estimation approaches based solely on pressure cycle counting. These findings emphasise the necessity of tailoring monitoring systems towards the early detection of damage indicators such as liner cracking, in order to mitigate failure risks effectively. As intended, the use of strain gauges provides a broader and more representative dataset than pressure-based metrics alone, enabling deeper insight into vessel material behaviour under realistic loading conditions. The validated modelling and experimental framework established in this work forms a robust foundation for refining sensor placement strategies and for advancing smart vessel technologies with enhanced safety and future lifetime prediction capabilities. It also enables the extension of sensor coverage to additional critical zones identified through simulations, allowing more comprehensive in-situ monitoring.
5. Discussion and future research direction
Scaling up laboratory testing for higher volume vessel tests under high-pressure, high-frequency cyclic conditions pose significant challenges due to the limited availability of suitable test rigs and the operational complexity involved. Nevertheless, the strong correlation observed between simulations and laboratory results at the current scale indicates that future large-scale studies could primarily rely on validated simulations to determine optimal sensor placement. Laboratory testing would then primarily serve to validate simulation models and demonstrate the feasibility of data processing approaches for lifetime prediction. This simulation-led approach reduces the need for extensive physical testing, accelerates development and supports the cost-effective scaling of monitoring solutions for various hydrogen storage applications. Building on this combined simulation–experimental framework, ongoing analyses of long-term in-situ sensor data aim to enhance understanding of damage evolution and prognostic capabilities. Future work will explore the development and application of advanced data-driven techniques, including artificial intelligence and machine learning algorithms, to the collected sensor data to improve the prediction of remaining useful life and enable structural health monitoring.
Acknowledgement
Parts of this work are results of the ongoing collaboration and research project SmaCS-PD:IT (Smart Composite Structure Prognostics and Diagnostics, contract number 20Q1956C) funded by the Federal Ministry of Research, Technology and Space as part of the ‘Funding of project-related mobility targeting the topic of green hydrogen with Australia’. The authors would like to thank all involved parties for their funding and support.




 Open access

