


Introduction
The Greater Spotted Eagle Clanga clanga Pallas, 1811, is a large, long-lived raptor predominantly hunting and breeding in wetland habitats. Wetlands are some of the most threatened ecosystems, globally (Gardner and Finlayson Reference Gardner and Finlayson2018), and as charismatic top predators, Greater Spotted Eagles are an umbrella species for wetland conservation and an indicator of wetland quality. In the second half of the 20th century, numbers of the Greater Spotted Eagle declined severely throughout its European range. The largest threats to the species are habitat destruction and disturbance, including drainage of wetlands (Maciorowski et al. Reference Maciorowski, Galanaki, Kominos, Dretakis and Mirski2019) but they are also affected by poisoning, poaching, and electrocution (Maciorowski et al. Reference Maciorowski, Lontkowski and Mizera2014, BirdLife International 2017). Now, there are only a few thousand breeding pairs remaining in the world, and the species is considered ‘Vulnerable’ globally and ‘Endangered’ in Europe, where fewer than 1,000 pairs breed, mostly in Russia and Belarus (BirdLife International 2015, 2017). In the European Union, where only tiny remnant populations exist in Poland and Estonia, the Greater Spotted Eagle is ‘Critically Endangered’ (BirdLife International 2015).
The wintering distribution of this migrant is poorly defined, but is likely restricted by suitable wetlands that provide a sufficient prey resource. Prior to this study, a number of wintering sites have been identified across the Mediterranean coast (Maciorowski et al. Reference Maciorowski, Galanaki, Kominos, Dretakis and Mirski2019), but Greater Spotted Eagles have also been recorded in the Middle East and North-east Africa (Meyburg and Meyburg Reference Meyburg and Meyburg2005, Maciorowski et al. Reference Maciorowski, Lontkowski and Mizera2014, Väli et al. Reference Väli, Mirski, Sellis, Dagys and Maciorowski2018). However, differences in wintering grounds between and within existing populations (migratory connectivity) are little known, hampering efforts to conserve and identify threats to this species outside the breeding grounds. Furthermore, elucidating migratory patterns of Greater Spotted Eagles has been complicated by hybridisation with Lesser Spotted Eagles Clanga pomarina. Hybrid progeny, difficult to identify in the field and accurately identified only by comprehensive genetic analysis (Väli et al. Reference Väli, Dombrovski, Treinys, Bergmanis, Daroczi, Dravecky, Ivanovski, Lontkowski, Maciorowski, Meyburg, Mizera, Zeitz and Ellegren2010a, Reference Väli, Saag, Dombrovski, Meyburg, Maciorowski, Mizera, Treinys and Fagerbergb), take an intermediate migratory route between the two species (Väli et al. Reference Väli, Mirski, Sellis, Dagys and Maciorowski2018). These factors have the potential to confuse the location of wintering grounds identified by sightings in the field and colour ringing studies where genetic identification has not been conducted (Väli et al. Reference Väli, Dombrovski, Mirski, Panuccio, Mellone and Agostini2021).
Migratory connectivity, the extent to which breeding and non-breeding sites are shared between individuals on migration, has a central position in the research and conservation of migratory animals (Webster et al. Reference Webster, Marra, Haig, Bensch and Holmes2002). Migratory birds, in particular long-distance migrants, are suffering steep declines in the face of global change (Sanderson et al. Reference Sanderson, Donald, Pain, Burfield and Van Bommel2006, Both et al. Reference Both, Van Turnhout, Bijlsma, Siepel, Van Strien and Foppen2010). Therefore, it is crucial to know when and where birds migrate, but also when and where in the annual cycle, vital rates shaping dynamics of particular population are being affected (Marra et al. Reference Marra, Cohen, Harrison, Studds, Webster and Choe2019). Studies on migratory connectivity are necessary to channel conservation efforts into regions where the effect will be most influential (Runge et al. Reference Runge, Watson, Butchart, Hanson, Possingham and Fuller2015). Knowledge on connections between breeding and wintering grounds is also an essential basis for range-wide planning of conservation activities, such as compilation of international action plans for threatened species (Martin et al. Reference Martin, Chadès, Arcese, Marra, Possingham and Norris2007, Dunn et al. Reference Dunn, Harrison and Curtice2019) and improving the effectiveness of legal approaches to the conservation of migratory wildlife (Marra et al. Reference Marra, Hunter and Perrault2011).
Here, we present the first systematic study of Greater Spotted Eagle migration. We use GPS tracking data from a substantial proportion of the remaining European breeding population in Estonia, Poland, and Belarus, where we tagged ~50%, ~30% and ~5% of the populations respectively. We explore the division of European Greater Spotted Eagles across their wintering range and identify population- and sex-specific patterns in selection of wintering sites. We investigate: 1) How strong is Greater Spotted Eagle migratory connectivity in a latitudinal and longitudinal perspective; 2) could population-specific timing explain the detected patterns in using the wintering sites; 3) are there differences in timing between intra-European migrants and birds migrating to other continents; 4) are there differences between males and females in timing of migration and choice of wintering sites?
Methods
Tracking of eagles
Twenty-nine adult eagles were equipped with GPS-trackers, including 13 birds (eight males, five females) from Belarus, nine (six males, three females) from Poland and seven (four males, three females) from Estonia (Table S1 in the online supplementary material). Twenty-four birds provided spring and autumn migration data. Spring migration data were missing from five birds (three from Poland, two from Estonia) and from one Estonian female only onset of autumn migration was recorded. Most (11) Belarusian birds were from the southern part of the country, except the two females tagged in western Belarus. As nests of these two birds were located at nearly equal distances to those of Polish and southern Belarusian birds, we omitted the two females from comparisons of populations, hence “Belarus” denotes southern Belarus hereafter.
Birds were trapped during the breeding season near their nests (trapped with a dho-gaza trap or mist-net), hence we are sure that we tagged local breeding birds. In Europe, spotted eagles hybridise frequently (Väli et al. Reference Väli, Dombrovski, Treinys, Bergmanis, Daroczi, Dravecky, Ivanovski, Lontkowski, Maciorowski, Meyburg, Mizera, Zeitz and Ellegren2010a), so we paid special attention to exclusion of hybrids. The species identity of the studied individuals was determined by genetic analysis using a combination of neutral microsatellite and single-nucleotide polymorphism markers (Väli et al. Reference Väli, Dombrovski, Treinys, Bergmanis, Daroczi, Dravecky, Ivanovski, Lontkowski, Maciorowski, Meyburg, Mizera, Zeitz and Ellegren2010a, b). Birds were sexed based on the chromo-helicase-DNA-binding protein (CHD) gene (Fridolfsson and Ellegren Reference Fridolfsson and Ellegren1999). We studied only adult birds as juveniles and immatures can have more diverse migration routes as they learn their migration (Sergio et al. Reference Sergio, Tanferna, De Stephanis, Jiménez, Blas, Tavecchia, Preatoni and Hiraldo2014, Väli et al. Reference Väli, Mirski, Sellis, Dagys and Maciorowski2018). Hence, adults indicate better than young birds the wintering sites suitable for the species and thus important for conservation in the long-term.
Eagles were equipped with a 30–45 g (<2% of the body mass of the birds) solar-powered GPS tag as a backpack using teflon ribbon harness. We used satellite transmitters that registered the location every 2 hours during the daytime (Microwave Telemetry Inc., Northstar Inc.) or GSM transmitters, which could be programmed remotely (Aquila IT, Ecotone, KGK Pro, Ornitela), enabling us to change programs (fixing frequency from 10 minutes to 1 hour, depending on battery condition), according to bird behaviour and location.
Birds were tracked for 1–9 years. In total we tracked 79 (on average 2.7 ± 1.7; mean ± SD) autumn migrations and 50 (1.7 ± 1.7) spring migrations; mean ± SD). We used one wintering site for each bird as individuals broadly used the same wintering site every year. Exceptionally, two birds moved during studied winters from one site to another (90 km and 260 km southwards, respectively). As both sites were used for a long period (usually 1–3 weeks), and one of them was used twice repeatedly in a season, we considered both as wintering ranges and not stopovers. For these two birds, arrival time to the first wintering site and location of the second (southern) wintering site was used in analyses. Also, one bird used an exceptional route on its last study year: it crossed the Black Sea (probably blown there by a strong westerly wind), and instead of reaching its wintering site in southern Turkey, wandered around the eastern coast of the Mediterranean Sea and was probably shot in Lebanon. This site, atypical for the individual, was excluded from the analysis.
Allocation of wintering sites and determination of migration timing
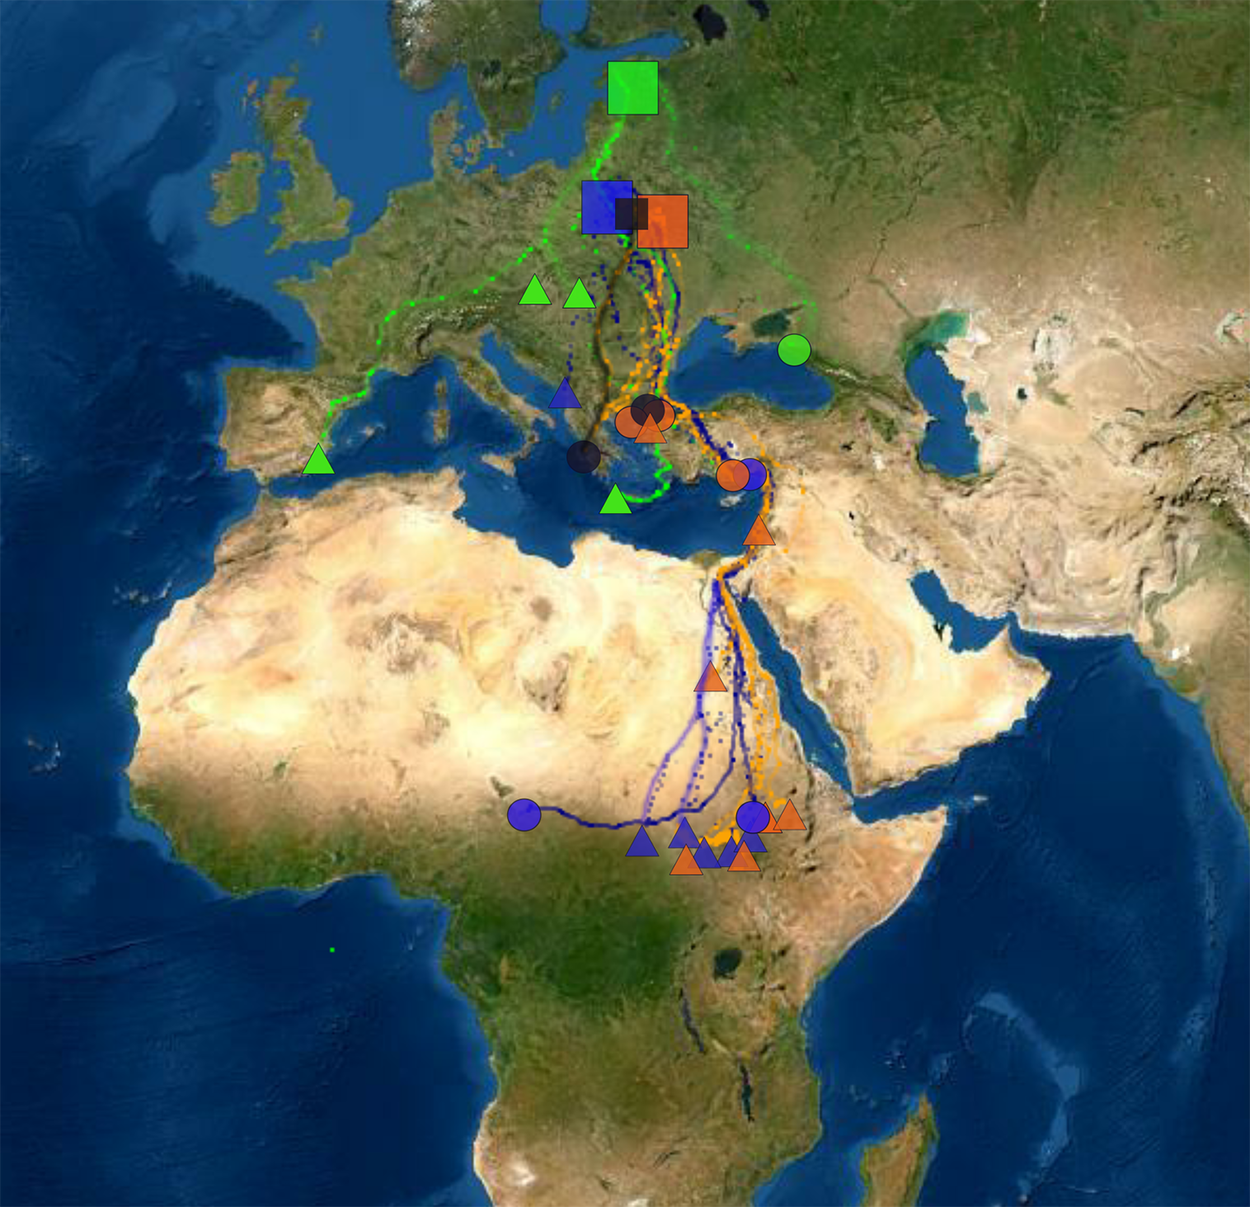
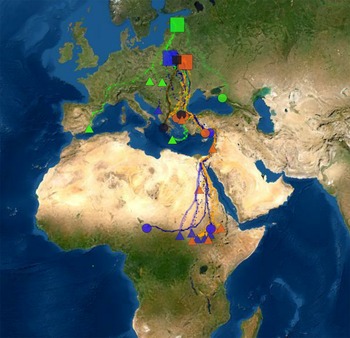
The Greater Spotted Eagle is relatively sedentary in winter and the geometric mean describes the location of its small wintering home range well. Similarly to Väli et al. (Reference Väli, Mirski, Sellis, Dagys and Maciorowski2018), we described the location of wintering site using simply mean latitude and longitude of its wintering home range. We also measured distance (loxodrome) and direction between breeding and wintering sites, but as these variables were strongly correlated with wintering latitude (r = –0.96, P <0.001) and longitude (r = –0.92, P <0.001) respectively, these variables were used only for descriptive purposes. For the same reason, flight distance along the migration route, that was strongly correlated with wintering latitude (r = 0.99, P <0.001) was used only to describe migration strategy and to calculate migration speed. Migration routes did not differ remarkably between years nor seasons. Detailed analysis of migration routes and flight patterns remain beyond the scope of the current paper. For illustrative purposes, one autumn and one spring route per individual is presented in Figure 1.
Locations of studied breeding populations (boxes) and individuals in wintering quarters (circles indicate females and triangles indicate males). Estonian birds are coloured as green, those from Poland as dark blue and from Belarus as orange. Two birds between Polish and Belarusian populations are indicated as black. The map is in Mercator WGS84 projection.
Temporal characteristics of the migration were described separately in autumn and spring by the onset and end dates of migrations, the duration calculated from these dates and the mean speed (duration / flight distance). Greater Spotted Eagles have relatively small home ranges both in breeding and wintering grounds. Therefore, the onset of migration was easy to determine based on a sudden change in the movement pattern of a tagged individual resulting in a long, straight flight in the main migratory direction. An individual was considered to have ended its autumn migration when it stopped this clearly southward (or westward in Central Africa) directed continuous movement (after stopovers, southward migration was continued). Spring migration ended when bird reached its nest site.
Protection status of wintering sites (National Park, Nature Conservation Park, Ramsar site, Special Protected Area [SPA; Birds Directive] Site of Community Importance [SCI; Habitats Directive]) was determined from the online World Database on Protected Areas (Protected Planet 2021).
Data analysis
We analysed differences between population means in wintering latitudes and longitudes using multinomial logistic regression models and applied ordinary logistic regression models to study differences between sexes. No random factors were included in models because all individuals always used the same wintering site. As multinomial models are influenced by small sample size, we relied on making conclusions on non-parametric Kruskal-Wallis tests, followed by Dunn’s tests for post hoc pairwise comparisons (package ‘dunn.test’ v. 1.3.5; Dinno Reference Dinno2017) when we studied differences between populations and on Mann-Whitney-Wilcoxon tests when studying differences between sexes. The homogeneity of variances was evaluated using the Fligner–Killeen test. Due to small sample sizes and heterogeneity of data (Table S1), we used the same tests for studying effects of variables describing timing of migration in the three breeding populations. However, sex-specific differences in timing were analysed using logistic regression models. Sex was the binary response variable, Julian dates of onset and end of migration, duration of migration and migration speed were included as independent fixed factors. Models were ranked according to their Akaike information criteria, corrected for small sample size (AICc), values. Due to overfitting and convergence issues, no random factors were included, and we always used individual mean values in analyses. A similar approach was used in testing for differences between birds wintering in different continents, but the models were rejected due to convergence issues.
We quantified the strength of migratory connectivity using a Mantel test. Statistical significance of the Mantel correlation coefficient (rM) was determined by 9,999 random permutations (package ‘ade4’; Dray and Dufour Reference Dray and Dufour2007). For each breeding population, we also calculated its spread in non‐breeding grounds (population spread, according to Finch et al. Reference Finch, Butler, Franco and Cresswell2017), followed by analysis of variance to test for differences between population means. Similarly, we calculated “population spread” to males and females and evaluated its sex-specific differences using a t-test.
Results
Wintering sites and migratory connectivity
The 28 Greater Spotted Eagles wintered in three continents (Figure 1). Twelve birds stayed in Europe. Ten of them wintered in the Balkan region (seven in Greece, one in Croatia, one in Montenegro and one in Serbia), one in south-western Europe (Spain) and one in the Eastern Pontics (south-western Russia). Thirteen eagles wintered in (mostly sub-Saharan) Africa. Eleven of them stayed in Eastern Sahel (five in Sudan, though one of them moved further to Ethiopia, six in South Sudan), one in north-eastern Africa (Egypt) and one in Central Africa (border between Chad and Cameroon). Three birds stayed in the Middle East, Asia: two of them in the southern coast of Turkey and one in Israel.
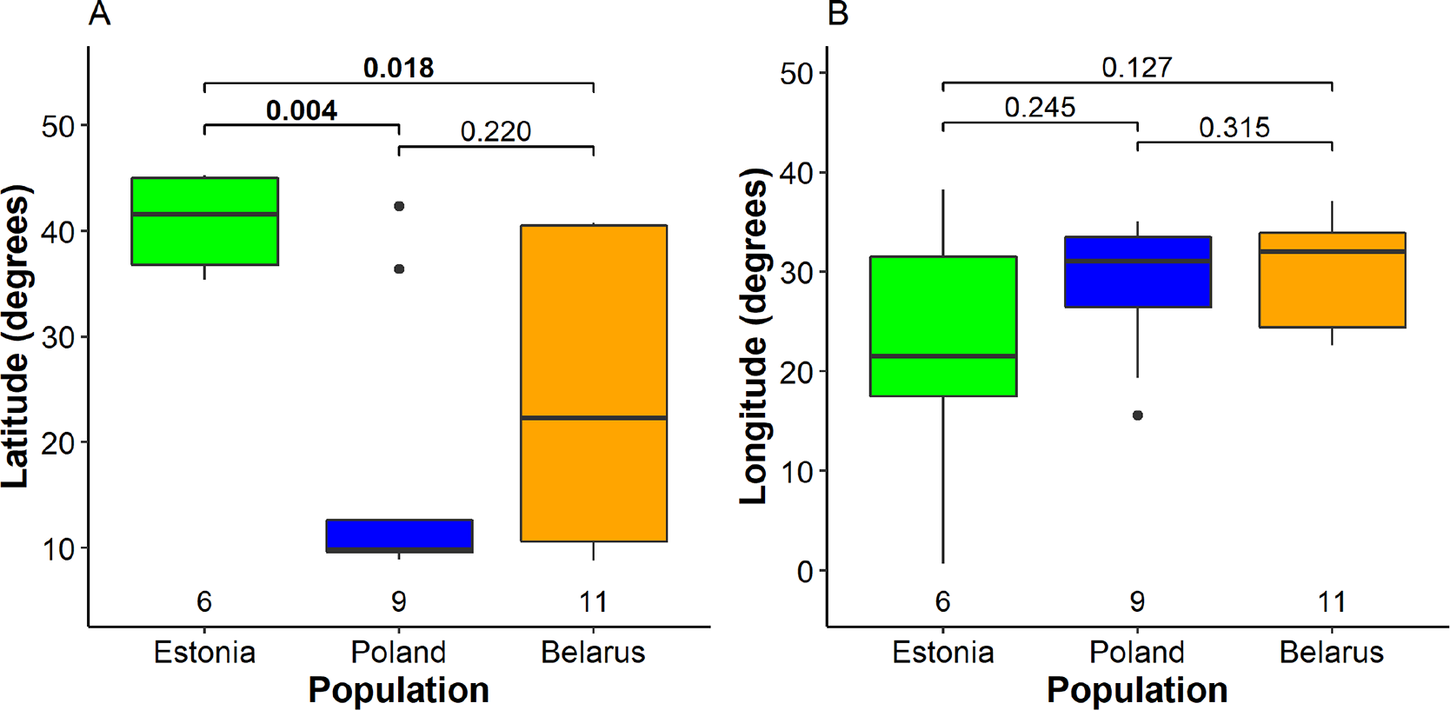
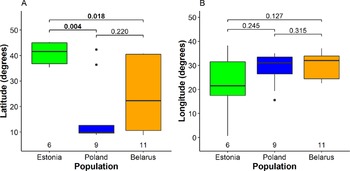
We detected significant differences between mean wintering latitudes used by Greater Spotted Eagles from different breeding populations (Kruskal-Wallis χ2 2 = 7.5, P = 0.024; Fig. 2A, Table S2). The largest difference was detected between Estonian eagles that wintered in Europe (five birds) or the Middle East (one bird) and Polish birds that wintered mainly in Africa (seven) and less in Europe (one) and Middle East (one). Northerly wintering latitudes of Estonian eagles were also significantly different from Belarusian eagles migrating to a wide range of latitudes, distributed in Africa (six), Europe (six), and the Middle East (one). However, the difference between variances among populations was not significant (Fligner-Killeen χ2 2 = 4.0, P = 0.14). Multinomial logistic regression, sensitive to small sample sizes, indicated only a near significant difference between wintering latitudes of Estonian and Polish birds (Table S3). The differences between mean wintering longitudes (Kruskal-Wallis χ2 2 = 1.3, P = 0.52), nor their variances among the three breeding populations were not significant (Fligner-Killeen χ2 2 = 3.9, P = 0.14), although the small Estonian population tended to use broader range of wintering sites in longitudinal perspective (Fig. 2B). The Mantel test indicated that migratory connectivity between individuals was weak, but significantly different from zero (rM = 0.16, P = 0.011). The mean pairwise distance between individuals across wintering range was 1,917.2 ± 1,301.7 SD km and there was no significant difference between population spread of Belarusian (2,011.4 ± 1,338.8 km), Polish eagles (1,831.54 ± 1,360.45) and Estonian eagles (1,707.7 ± 861.2; F2, 98 = 0.34, P = 0.71).
Segregation of wintering individuals from the three studied breeding populations along the latitude (A) and longitude (B). The bold line indicates the median, the box shows quartiles, the whiskers indicate the extreme data points within 1.5× the interquartile range from the quartile boundaries and dots are data points beyond that range. The level of significance of the differences between population means (Dunn’s test) is indicated above the boxes, significant differences are indicated as bold; sample sizes are indicated below the boxes.
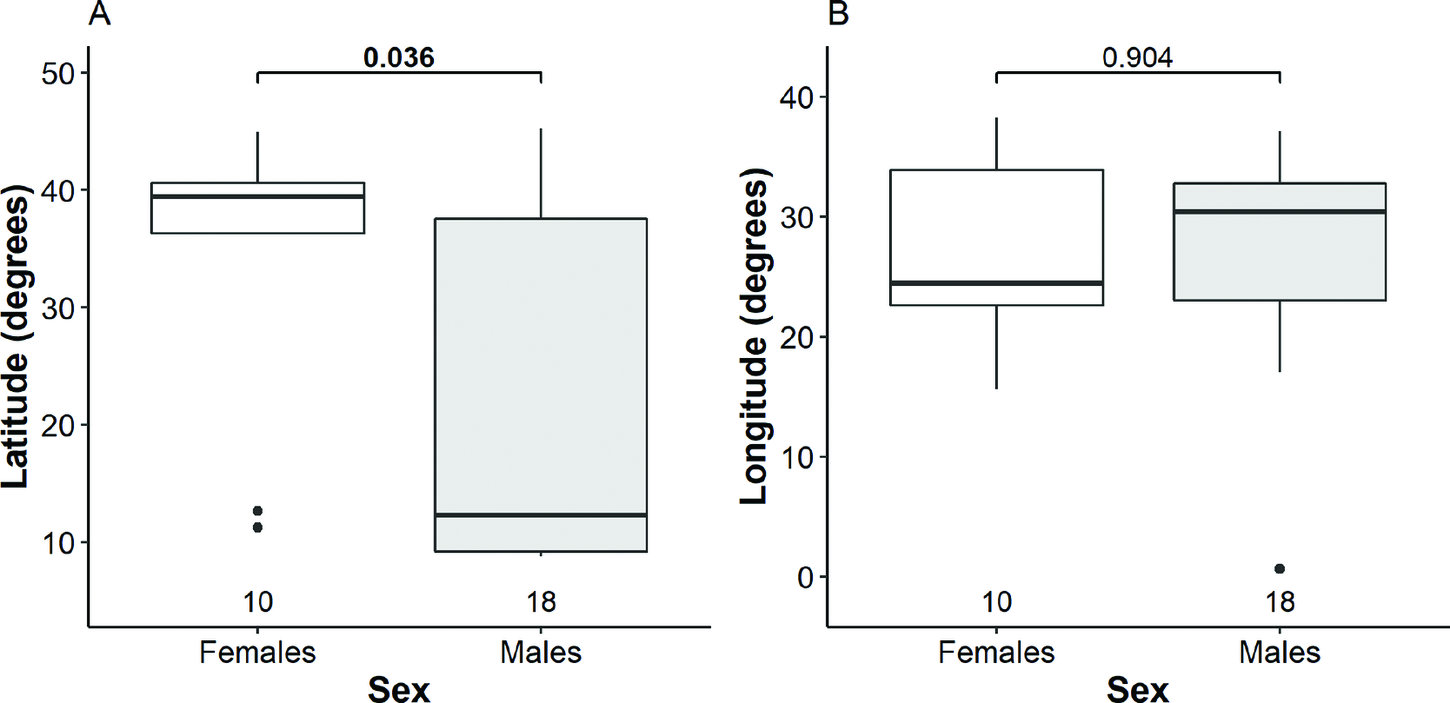
Females tended to make shorter migrations (Table S4) and wintered mainly in Europe (six birds) rather than Africa (two) and the Middle East (two). Males, instead, tended to make longer migrations and their wintering sites were dispersed more in both latitudinal and longitudinal perspective as they wintered in Africa (11 birds), Europe (five) and the Middle East (one). However, this relationship was not seen in Estonian breeding birds, with all individuals wintering more northerly. Migration strategy was most different between Belarusian males and females, with males more likely to winter in Africa than Europe, and on average, migrating 2,483 km further south than females. We detected statistically significant difference between males and females in respect of the mean latitude, but not the mean longitude of wintering sites (Fig. 3, Table S3). Although the variation in latitudinal perspective tended to be larger among males than that among females, the difference was not significant (Fligner-Killeen χ2 2 = 2.3, P = 0.128). The Mantel test indicated that migratory connectivity between males was moderate and significantly different from zero (rM = 0.38, P = 0.003), but no difference was found among females (rM = 0.14, P = 0.23). Migratory spread among males (2,180 ± 1,538 SD km) was significantly larger than that among females (1,697 ± 1,293 km; (t = 2.1, df = 84.1, P = 0.038).
Distribution of wintering females and males along the latitude (A) and longitude (B). The bold line indicates the median, the box shows quartiles, the whiskers indicate the extreme data points within 1.5× the interquartile range from the quartile boundaries and dots are data points beyond that range. The level of significance of the differences between mean values of sexes (Mann-Whitney-Wilcoxon test) are indicated above the boxes, significant difference is indicated as bold; sample sizes are indicated below the boxes.
Timing of migration
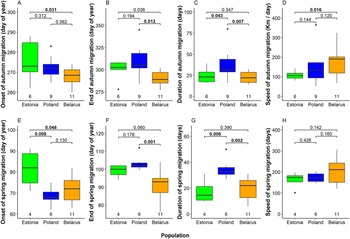
We detected several significant differences between mean timing of migration among eagles from the three breeding populations (Fig. 4, Table S2). In autumn, Belarusian eagles were the earliest migrants departing breeding grounds on 25 September on average. Departure was five days later in Poland and nine days later in Estonia (significantly later than in Belarus; Fig 4A). Belarusian birds were also first to arrive wintering grounds (17 October on average), again remarkably earlier than Estonian (10 days later) and Polish birds (20 days later; Fig 4B). Moreover, also the flight speed of autumn migration was highest among Belarusian birds (176 km / day on average), intermediate among Polish birds (151 ± 61 km / day) and lowest among Estonian birds (111 ± 23 km / day; Fig 4C). Remarkably, autumn migration of Polish eagles lasted 38 days on average (median = 31.5 days), significantly longer than those of Estonian (24 days) and Belarusian birds (23 days; Fig. 4D, Table S2).
Onset date, end date, duration, and speed of migration in autumn (A–D) and in spring (E–G) in the three studied Greater Spotted Eagle breeding populations. The bold line indicates the median, the box shows quartiles, the whiskers indicate the extreme data points within 1.5× the interquartile range from the quartile boundaries and dots are data points beyond that range. The level of significance of the differences between population means are presented above the boxes, significant differences are indicated as bold. Sample sizes are presented below the boxes.

Timing patterns in spring were alike to those in autumn (Fig. 4, Table S2). Estonian birds departed wintering grounds significantly later (22 March) than Belarusian (12 March) and Polish eagles (9 March). Belarusian birds arrived at breeding grounds on average on the 31 March, earlier than Estonian (9 April) and significantly earlier than Polish eagles (13 April). Migration of Polish birds lasted again longer (35 days) than those of Estonian (17 days) and Belarusian eagles (20 days). Flight speed in Spring was similar in all populations, comparable with fast autumn migration of Belarusian birds.
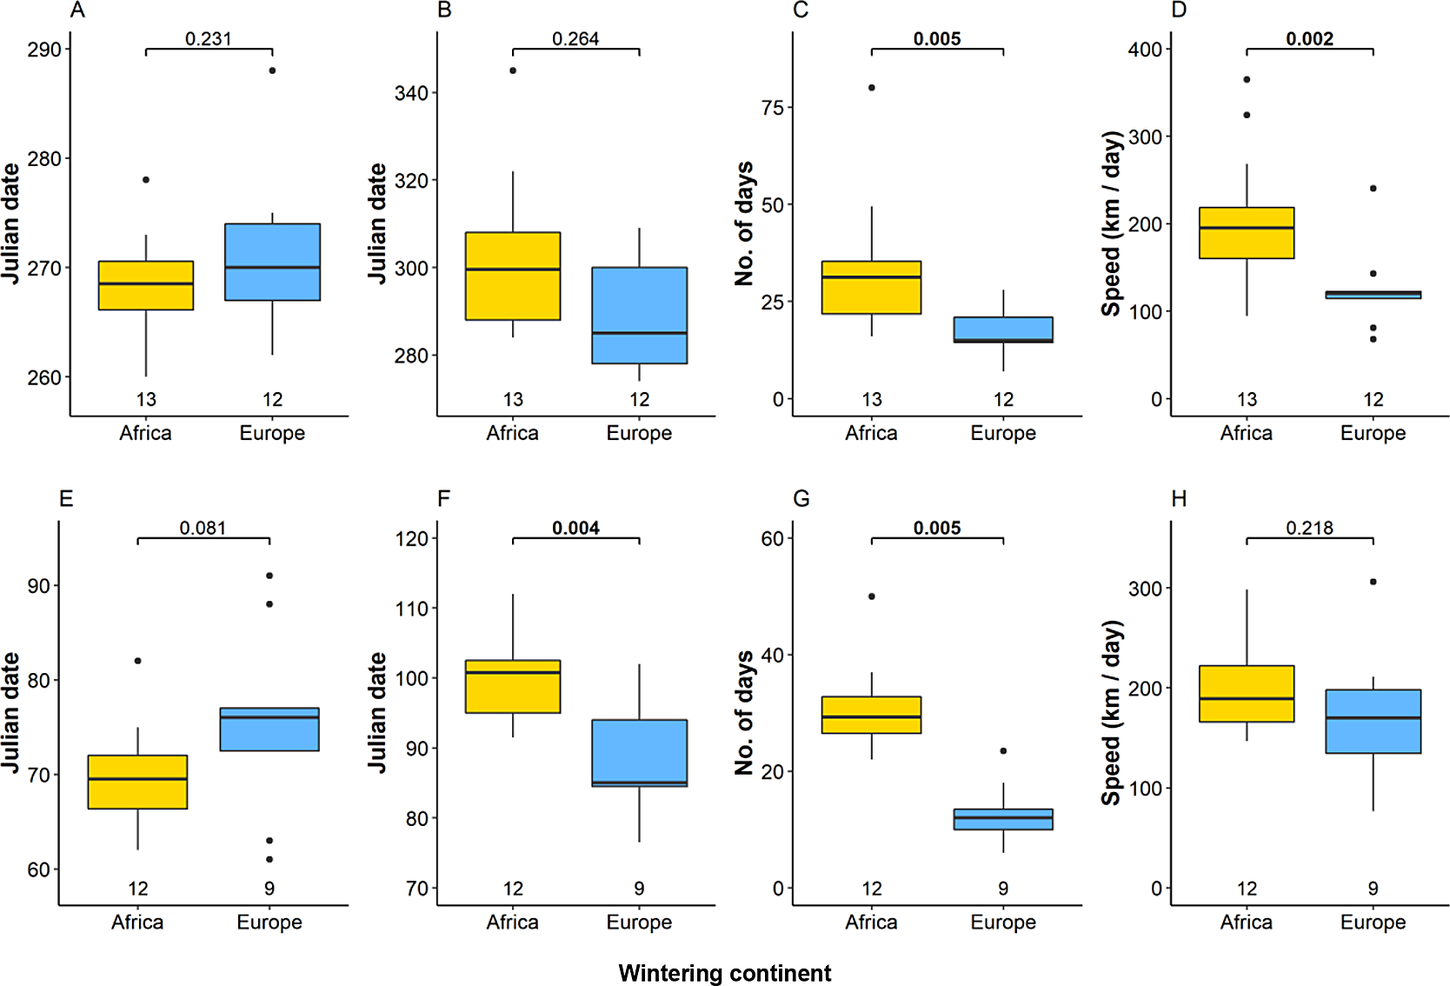
Eagles migrating within European exhibited different migration strategy compared with birds flying to Africa (Fig. 5, Table S4). There was no significant difference between mean departure and arrival dates of Intra-European (30 September and 20 October) and African migrants (26 September and 30 October) in autumn, but migration of birds to Africa lasted significantly longer (34 days vs 20 days). The mean speed of autumn migration was significantly higher among African migrants (200 km / day) than intra-European migrants 114 km / day). In spring, birds wintering in Africa tended to start migration earlier (11 March) than those wintering in Europe (17 March), but arrived significantly later (11 April vs 29 March) due to the longer duration (30 vs 13 days). Flight speed of spring migration from Africa (199 km / day) was higher than that of intra-European migrants (170 km / day), but the difference was not significant. Birds wintering in Asia (the Middle East) mostly exhibited intermediate values to intra-European and European-African migrants (Table S4).
Onset date, end date, duration. and speed of migration in autumn (A–D) and in spring (E–G) of studied Greater Spotted Eagles wintering in Africa and Europe. The bold line indicates the median, the box shows quartiles, the whiskers indicate the extreme data points within 1.5× the interquartile range from the quartile boundaries and dots are data points beyond that range. The level of significance of the differences between population means are presented above the boxes, significant differences are indicated as bold. Sample sizes are presented below the boxes.
Three models describing sex-specific timing differences in autumn were supported with lower AIC values compared with null model (Table S5). Males tended to leave breeding grounds earlier, migrate faster and arrive wintering grounds earlier than females, but none of the included variables was significant (P = 0.06…0.18). No model describing timing in spring outcompeted the null model.
Protected area status of wintering grounds
Nine out of 12 sites for European wintering Greater Spotted Eagles were located in SPAs, or national parks. Out of the three remaining wintering sites, two were SCIs under the Habitats Directive, and only one site (in the Russian Pontic) was under no formal protection. The two wintering sites in Anatolian Turkey were also SPAs. Of the wintering sites located in the Middle East or Africa, only two of 14 were protected (Ramsar status and national parks), both situated in the Dinder National Park in Sudan.
Discussion
Western populations of the Greater Spotted Eagles are under severe threat from extinction, with only a few dozen pairs remaining (BirdLife International 2015). Our dataset represents a significant proportion of the remaining European breeding population of Greater Spotted Eagles and thus our findings have important consequences for present and future conservation programmes for the species.
We show differences in wintering regions between populations and sex of European Greater Spotted Eagles and identify important wintering sites for the species. Overall, there was a large inter-individual latitudinal spread in wintering sites, from Southern Europe to East Africa, especially in the larger Belarusian population. There were differences in wintering region between populations: Estonian birds all wintered across Southern Europe, whereas Polish and Belarusian birds wintered in South-east Europe, the Middle East or Africa. This reminds the chain migration pattern, according to which winter quarters of northerly breeding birds lay to the north of those of southerly breeding birds (Chapman et al. Reference Chapman, Hulthén, Wellenreuther, Hansson, Nilsson, Brönmark, Hansson and Åkesson2014). In Belarusian eagles, males were more likely to winter further south than females, with the majority of males wintering within a narrow belt in Eastern Sahel (South Sudan and Ethiopia) and females in coastal wetlands in South-east Europe (Southern Greece) and Turkey. This relationship is possibly also found in the Polish population, however, our small sample size of females prevented us detecting a difference. The majority of the tracked eagles wintering in Europe and Turkey wintered in protected areas (SPAs or SCIs), highlighting the importance of these areas for this species. However, only two of 12 wintering sites in Africa had protected status, both situated in the same national park.
Eagles from Polish and Belarusian populations departed their breeding grounds at similar times, but Estonian birds migrated later. Individuals with longer migrations (i.e. African winterers) arrived at their wintering grounds later, despite compensating somewhat by an increased migration speed. In spring, African winterers left their wintering grounds earlier and arrived at breeding ground later than intra-European migrants.
Distribution of birds across wintering sites
Nearly half of the studied Greater Spotted Eagles wintered in the large wetlands of Eastern Sahel and adjacent regions. The eagles were mostly distributed along the basins of the White and Blue Nile, but the westernmost wintering site was detected near Lake Chad. This region had previously been identified as important for the Polish Greater Spotted Eagles as nine out of 16 previously tracked birds overwintered there (Maciorowski et al. Reference Maciorowski, Lontkowski and Mizera2014 and references therein). None of the Greater Spotted Eagles in our study wintered south of the equator. However, there are earlier records of Greater Spotted Eagles, including some tagged with satellite transmitters, from southern Africa (mainly Zambia; Meyburg et al. Reference Meyburg, Meyburg, Mizera, Maciorowski and Kowalski1998, Meyburg and Meyburg Reference Meyburg and Meyburg2005, Vallotton Reference Vallotton2011, Maciorowski et al. Reference Maciorowski, Lontkowski and Mizera2014). These individuals may have been hybrids with closely related Lesser Spotted Eagles, which are often hard to discriminate from parental species in the field (Forsman Reference Forsman2016). Southern Africa is a typical wintering site for Lesser Spotted Eagles (BirdLife International 2020) and hybrid birds (Väli et al. Reference Väli, Mirski, Sellis, Dagys and Maciorowski2018, V. Dombrovski unpubl. data),
The other main wintering region was Southern Europe, where 43% of the studied birds wintered. Most European winterers stayed in the Balkan Peninsula (harbouring 36% of birds), comprising largely of Belarusian breeding birds. The wetlands of Greece (saltmarshes, salines and coastal lagoons; Maciorowski et al. Reference Maciorowski, Galanaki, Kominos, Dretakis and Mirski2019) were of utmost importance. A few individuals also wintered in the wetlands of the Western Balkans (e.g. Sava river valley). All the Greek wintering sites were located in SPAs showing the reliance on protected areas for this species in Europe. The reliance on ecologically intact wetlands hints at one of the mechanisms of decline of this species, as the majority of wetlands in Southern Europe have been destroyed or degraded, with over 63% of Greece’s wetlands lost between 1950 and 1985 (European Commission 2007). The small number of wintering locations, with four individuals from two populations wintering in the same site (Axios National Park) may indicate a lack of suitable wintering sites for the species in Southern Europe. Greece is an important wintering site for juvenile birds fledged in Poland (Maciorowski et al. Reference Maciorowski, Lontkowski and Mizera2014), but interestingly none of the adult Polish eagles, we tracked, wintered in Greece, with a similar result for adult eagles found in an earlier study (Meyburg and Meyburg Reference Meyburg and Meyburg2005). This may suggest high mortality of juveniles within the region or that adult birds switch wintering location when they reach maturity.
The Middle East harboured 11% of wintering eagles. Two of the tracked birds stayed in the Göksü river delta in southern Turkey, and one in the Jordan river valley in Israel. In the Arabian Peninsula, coastal freshwater marshes and mangrove swamps provide important wintering habitat for the species (Meadows Reference Meadows2011, Ü. Väli unpubl. data). Greater Spotted Eagles can also use man-made wetlands here; one of our tracked individuals spent two winters at a fish farm in Israel, highlighting a possible source of human/wildlife conflict.
Determinants of spatiotemporal patterns
The Mantel test indicated rather weak migratory connectivity among Greater Spotted Eagle populations. The Mantel correlation coefficient of Greater Spotted Eagles (0.18) was weaker than in other European raptor species, such as Montagu’s Harrier Circus pygargus (0.56; Trierweiler et al. Reference Trierweiler, Klaassen, Drent, Exo, Komdeur, Bairlein and Koks2014) and Lesser Kestrel Falco naumanni (0.58; Sarà et al. Reference Sarà, Bondì and Bermejo2019), whose wintering populations are separated along a longitudinal gradient. In contrast, Greater Spotted Eagle populations exhibited differences in mean wintering latitudes.
The total population spread of Greater Spotted Eagles along their wintering grounds was larger than in most previously studied bird species (Finch et al. Reference Finch, Butler, Franco and Cresswell2017). Large population spread is frequently found in broad-front migrants (Terraube et al. Reference Terraube, Mougeot, Cornulier, Verma, Gavrilov and Arroyo2012, Sarà et al Reference Sarà, Bondì and Bermejo2019). Yet it is somewhat unexpected in a large soaring raptor species whose migration is impeded by the Mediterranean Sea and leaving Europe through the narrow migratory ‘bottleneck’ over the Bosporus strait, funnelling migrants into eastern Africa (Väli et al. Reference Väli, Dombrovski, Mirski, Panuccio, Mellone and Agostini2021). A large longitudinal population spread would be more expected among intra-European migrants that are not funnelled by the sea, but are separated by montane regions instead. Northerly breeding Estonian birds wintered only in Europe and tended to be more spread in longitudinal scale (Fig. 2B), whereas other birds, especially Belarusian eagles, were more spread in latitudinal scale. As a result, we detected no significant difference in population spread between breeding populations.
We noticed different patterns of migration timing among the breeding populations and wintering continents. Belarusian birds arrived at their breeding grounds one or two weeks earlier (spring) and at wintering grounds two or three weeks (autumn) earlier than birds in other populations. Migration speed of Belarusian birds in autumn was higher than the other populations, partly explained by the higher percentage of birds wintering in North Africa as longer-distance migrants partially compensated by increasing their migration speed. Shorter migration length may also explain why Estonian birds on average, migrated later in both spring and autumn. The reasons behind differences in migratory timing are unknown.
Sex-mediated migration patterns
The large population spread is largely due to the split in wintering grounds between Southern Europe and East Africa (and the Middle East). Interestingly, female Greater Spotted Eagles from Polish and Belarussian populations were more likely to winter in southern Europe or Anatolia, while males were more likely to winter further south, in the Eastern Sahel.
Several mechanisms could be considered to explain this pattern. First, northern wintering of females would follow Bergmann’s rule—larger individuals are better adapted to colder conditions (Cristol et al. Reference Cristol, Mitchell and Carbone1999). Furthermore, waterbirds can make up a significant proportion of Greater Spotted Eagle diet in Southern European wetlands (Alivizatos et al. Reference Alivizatos, Papandropoulos and Zogaris2004, Pérez-García et al. Reference Pérez-García, Marco-Tresserras and Orihuela-Torres2020, Alivizatos and Goutner Reference Alivizatos and Goutner2021), including larger species such as the Eurasian Wigeon Mareca penelope. Smaller prey, preferred by males (Newton Reference Newton1979), such as juvenile waterbirds, small mammals, and reptiles, may be more abundant in wintering grounds in Africa than in Europe. These prey items constitute a significant proportion of Greater Spotted Eagle diet during the breeding season (Dombrovski Reference Dombrovski2010). However, to our knowledge, no studies on wintering diet in Africa have been conducted.
Secondly, according to the social dominance hypothesis, larger females may outcompete smaller males for closer wintering sites (Gathreux Reference Gathreux, Bateson and Klopfer1978). Indeed, Greater Spotted Eagles winter in small, restricted habitat patches (Pérez-Garcia et al. Reference Pérez-García, Sellis and Väli2014, Maciorowski et al. Reference Maciorowski, Galanaki, Kominos, Dretakis and Mirski2019), but there are no data on intraspecific competition at wintering sites; instead, several birds are recorded to share roosting and foraging sites in wintering grounds. Thirdly, female Greater Spotted Eagles may be responsible for securing the nesting territory, which may drive shorter migrations and earlier arrival at breeding grounds to reduce intra and inter-specific competition for nest sites (Paprocki et al. Reference Paprocki, Heath and Novak2014). Further research is needed to fully understand the mechanisms behind differences of wintering in female and male Greater Spotted Eagles. One should note that males outnumbered females in our study, and thus the importance of Southern Europe as a wintering range for the Greater Spotted Eagle is probably higher than indicated by the birds tracked in the current study.
This split between wintering grounds of females and males could have impacts on the conservation of the species, because vulnerability of migrants increases with distance travelled (De Pascalis et al. Reference De Pascalis, Panuccio, Bacaro and Monti2020) and most of our tracked females wintered at sites under formal protection, whereas males were not. This could possibly lead to a sex-biased survival if African wetlands were degraded. In contrast, past habitat loss in Europe relative to Africa, may have reduced numbers of females relative to males. Furthermore, protected areas can be insufficiently protected and eagles in some European protected areas are threatened by hunting or dangerous power lines. This is illustrated by two probable cases of shooting Greater Spotted Eagles in or near protected areas in southern Europe (G. Maciorowski and Ü. Väli unpubl. data). Ultimately, an imbalanced sex ratio could increase hybridization rates and thereby increase the extinction risk for the Greater Spotted Eagle.
Conclusions
Our results show that breeding populations of Greater Spotted Eagles differ significantly in migratory strategy and that wintering individuals are spread over large areas. This behaviour could guard against extinction as entire breeding populations are not threatened by habitat deterioration, stochastic effects of weather or climate change in particular wintering sites. On the other hand, environmental or habitat changes can have disproportional effects on a population’s demographic rates under differential migration (Briedis and Bauer Reference Briedis and Bauer2018). We showed that Greater Spotted Eagle individuals characteristically use restricted wintering sites, and such sites or regions may harbour several individuals. We stress that preservation of important wintering sites for this globally ‘Vulnerable’ species should be a conservation priority. The best wintering sites, revealed by the tracking data and supported by observations and re-sightings or recoveries of ringed birds, should be highly prioritised in allocation of efforts for conservation of the species.
Supplementary Materials
To view supplementary material for this article, please visit http://dx.doi.org/10.1017/S0959270921000411.
Acknowledgements
We thank Kordian Bartoszuk, Denis Kitel, Kazimierz Krzywicki, Triin Leetmaa, Riho Männik, Paweł Mirski, Renno Nellis, Ain Nurmla, Jürgen Ruut, Dmitry Shamovich, Alexander Sobolev and all the other people who assisted us in tagging eagles. The GPS-tracking was financially supported by the projects LIFE04NAT/EE/000072 and LIFE08NAT/PL/000511; Estonian Ministry of Foreign Affairs (project’ Knowledge-based conservation of the globally vulnerable Greater Spotted Eagle in Belarus’); Estonian Environmental Investments Fund; Estonian Environmental Board; and Endangered Landscapes Programme. AAB acknowledges support from the Endangered Landscapes Programme, which is managed by the Cambridge Conservation Initiative and is funded by Arcadia, a charitable fund of Peter Baldwin and Lisbet Rausing.


 Open access