
Introduction
Climate change is happening. Scientific consensus tells us that some change is unavoidable (Pielke et al. Reference Pielke, Prins, Rayner and Sarewitz2007), and likely scenarios will induce irreversible detrimental changes such as frequent droughts and sea level rise (Solomon et al. Reference Solomon, Plattner, Knutti and Friedlingstein2009). Plausible changes threaten 15–35 percent of all species with extinction (Thomas et al. Reference Thomas, Cameron, Green, Bakkenes, Beaumont, Collingham, Erasmus, Ferreira de Siqueira, Granger, Hannah, Hughes, Huntley, van Jaarsveld, Midgley, Miles, Ortega-Huera, Peterson, Phillips and Williams2004). Forecasts of climate change are uncertain for many reasons (Moss et al. Reference Moss, Edmonds, Hibbard, Manning, Rose, Van Vuuren, Carter, Emori, Kainuma, Kram, Meehl, Mitchell, Nakicenovic, Riahi, Smith, Stouffer, Thomson, Weyant and Wilbanks2010), and thus the effects of climate change on habitat quality and species’ ranges are also uncertain. How can we best invest the resources we have to protect species diversity and environments that provide many ecosystem services when we do not know where any of the features we seek to protect will be in the future?
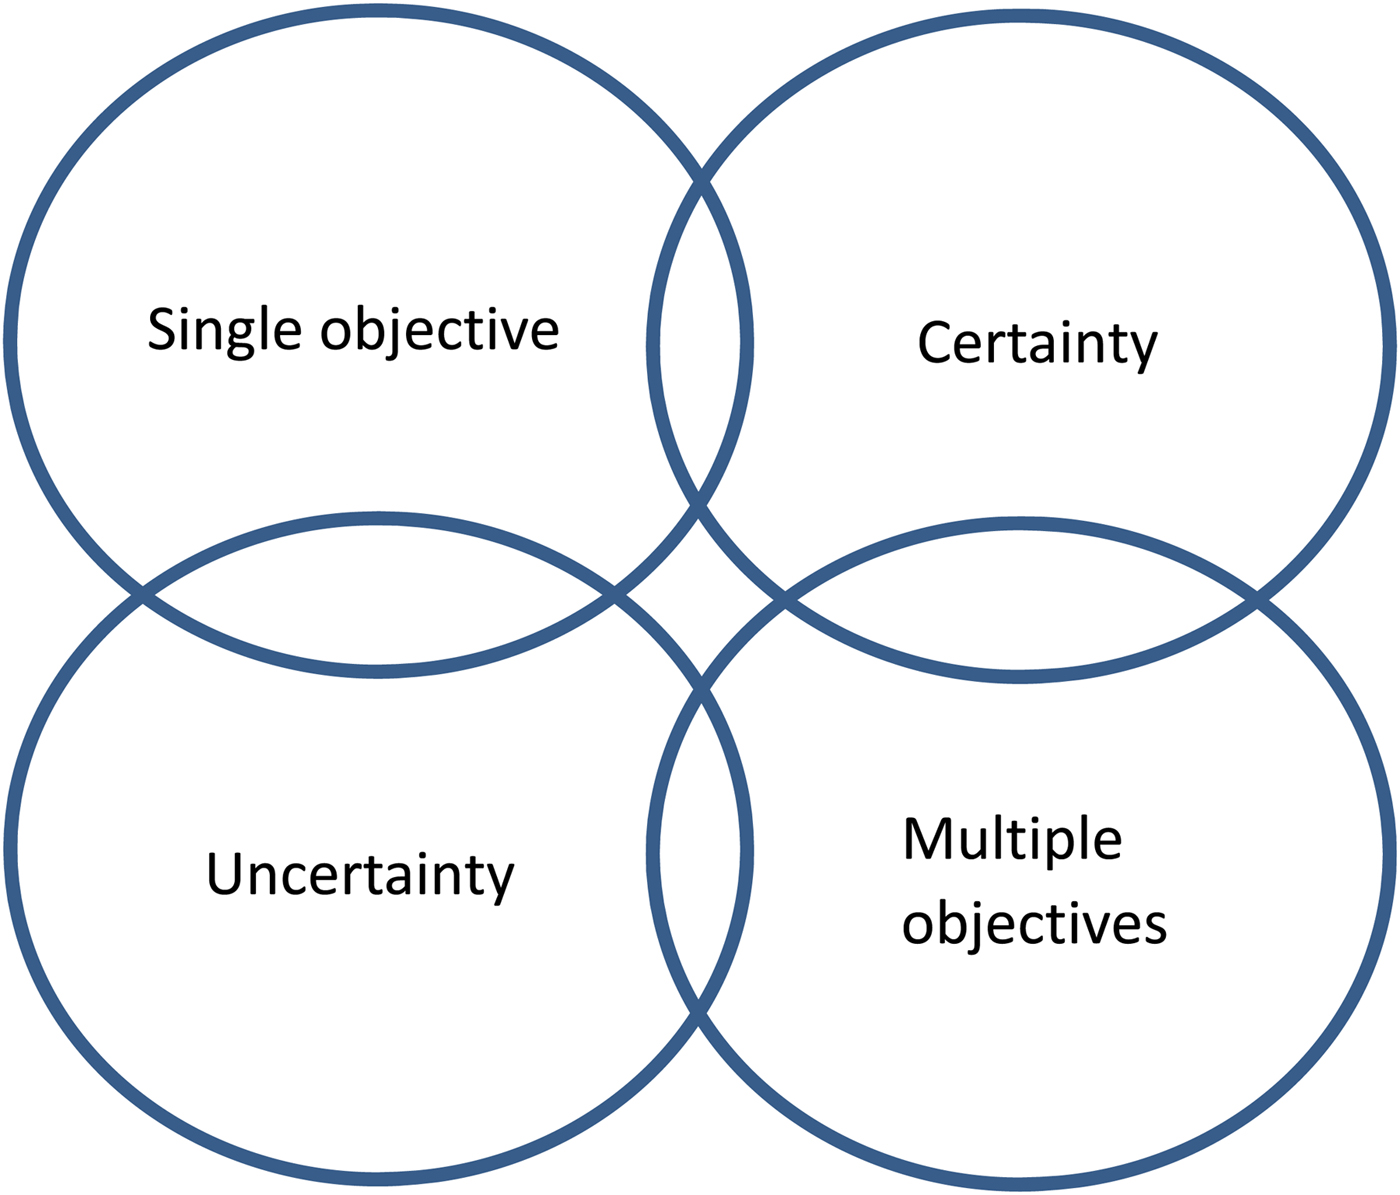
This paper provides an overview of lessons about conservation planning learned from previous research (displayed schematically in Figure 1). Rich bodies of work have provided insights into conservation planning without considering uncertainty, in cases of single and multiple conservation objectives. Some research has begun to inform how to plan conservation networks for a single objective in the face of uncertainty. However, while technical literature in finance has studied algorithms for multiple objective optimization that minimizes uncertainty, little has been done to provide guidance for that endeavor in the world of natural resource conservation.
Research on Conservation Planning and Uncertainty
After we survey research that has already been done on conservation planning, we introduce a new framework for multiple-objective conservation planning under uncertainty. We demonstrate some features of this approach in a stylized example. Finally, we outline a typology of correlations among conservation objectives that can help shape intuition about this complex optimization problem in conservation planning.
Conservation Planning Lessons Learned from Previous Research
Single Objective with Certainty
Research on conservation reserve site selection began with efforts to choose sites to accomplish a single conservation objective. In this early work, uncertainty was implicitly assumed away, and conservation sites were chosen by applying algorithms to current or historic data on ecological and economic features of the landscape.
Several reviews have already been written about this area of research. Newbold and Siikamaki (Reference Newbold, Siikamaki, Halvorsen and Layton2015) give an excellent overview of the actual programs used for single-objective conservation planning and how they have evolved over time, and Boyd, Epanchin-Niell, and Siikamäki (Reference Boyd, Epanchin-Niell and Siikamäki2015) thoroughly review the body of research on return on investment conservation site-selection research. Our purpose here is not to replicate those reviews in detail. Instead, we highlight a few particularly notable pieces of intuition about conservation planning that have emerged from that body of work and provide just a few examples of papers that developed those ideas.
Early research in conservation planning was dominated by biologists and ecologists and showed that optimal conservation frameworks choose lands to protect that had large value of the conservation goal at hand. Myers et al. (Reference Myers, Mittermeier, Mittermeier, Fonseca and Kent2000), for example, demonstrated that conservation networks can do well by protecting “hotspots” with many different species. Researchers such as Kati et al. (Reference Kati, Devillers, Dufrêne, Legakis, Vokou and Lebrun2004) showed how planners could exploit complementarity in the species located on different sites to enhance the total value of the network. The research community struggled with solutions to the problem of executing conservation planning with limited data on species and habitat worldwide, though relying on data of surrogates for total conservation value such as flagship species can be of limited use (Andelman and Fagan Reference Andelman and Fagan2000).
Economists joined this research, making the fundamental point that cost-effective conservation planning must consider the costs of different potential sites in a reserve network as well as the benefits (Naidoo et al. Reference Naidoo, Balmford, Ferraro, Polasky, Ricketts and Rouget2006). For example, Ando et al. (Reference Ando, Camm, Polasky and Solow1998) showed that the cost of a stylized network to protect all the listed endangered species in the country could be 30 percent lower if the algorithm chooses sites to protect the species at minimum total cost rather than with minimum number of sites.
Work continued to add factors that should be considered in order to most cost-effectively conserve resources. It makes sense to prioritize sites that are actually at risk for development, rather than protecting lands that will not be compromised even if left outside of protected area networks (Costello and Polasky Reference Costello and Polasky2004). However, the nature of development threat can change over time, and one must account for the fact that protecting one area today may increase the development threat to areas nearby, as developers are drawn to the amenity value of conservation (Armsworth et al. Reference Armsworth, Daily, Kareiva and Sanchirico2006; Dissanayake and Önal Reference Dissanayake and Önal2011). If the species or ecosystems to be protected are sensitive to fragmentation, techniques can be used to improve the spatial configuration of networks of reserves (Briers Reference Briers2002; Önal and Briers Reference Önal and Briers2005; Lewis and Wu Reference Lewis and Wu2015). Finally, if one seeks to maximize the benefits of conservation to people and not just the continued existence of species in the landscape, reserve site selection should consider proximity of reserves to populations of people who would gain benefit from them, because many elements of the value of conservation diminish with distance (Ando and Shah Reference Ando and Shah2010).
Multiple Objectives with Certainty
Conservation planners often need to make investment decisions that involve multiple species or multiple ecosystem benefits (Pukkala Reference Pukkala1998; Williams et al. Reference Williams, Shoo, Isaac, Hoffmann and Langham2008; Bennett, Peterson, and Gordon Reference Bennett, Peterson and Gordon2009; Nelson et al. Reference Nelson, Mendoza, Regetz, Polasky, Tallis, Cameron, Chan, Daily, Goldstein, Kareiva, Lonsdorf, Naidoo, Ricketts and Shaw2009; Goldstein et al. Reference Goldstein, Caldarone, Duarte, Ennaanay, Hannahs, Mendoza, Polasky, Wolny and Daily2012; Schwenk et al. Reference Schwenk, Donovan, Keeton and Nunery2012; Seppelt, Lautenbach, and Volk Reference Seppelt, Lautenbach and Volk2013; Chadés et al. Reference Chadés, Nicol, van Leeuwen, Walters, Firn, Reeson, Martin and Carwardine2015; Vogler et al. Reference Vogler, Ager, Day, Jennings and Bailey2015). Thus, research on conservation planning moved rapidly into the study of how best to choose investments to make in natural capital, such as protected areas, to promote multiple ecosystem services (Kareiva et al. Reference Kareiva, Tallis, Ricketts, Daily and Polasky2011).
Polasky et al. (Reference Polasky, Nelson, Lonsdorf, Fackler and Starfield2005) show how multiple objective ecosystem-service optimization can usefully be deployed at many different scales. Di Fonzo et al. (Reference Di Fonzo, Possingham, Probert, Bennett, Joseph, Tulloch, O'Connor, Densem and Maloney2016) incorporated multiple characteristics of biodiversity protection in the conservation planner's objective function. Similar approaches exist in landscape planning, including multiobjective forest planning (Mendoza, Bare, and Campbell Reference Mendoza, Bare and Campbell1987; Pukkala Reference Pukkala1998; Uhde et al. Reference Uhde, Hahn, Griess and Knoke2015) and multiobjective land-use planning (Krcmar, van Kooten, and Vertinsky Reference Krcmar, van Kooten and Vertinsky2005). Environmental economists have studied tradeoffs between multiple economic and environmental objectives (Nijkamp Reference Nijkamp1975; Rodríguez et al. Reference Rodríguez, Beard, Bennett, Cumming, Cork, Agard, Dobson and Peterson2006; Mantoglou and Kourakos Reference Mantoglou and Kourakos2007; Kennedy et al. Reference Kennedy, Ford, Singleton, Finney and Agee2008; Maringanti, Chaubey, and Popp Reference Maringanti, Chaubey and Popp2009; White, Halpern, and Kappel Reference White, Halpern and Kappel2012; Gramig et al. Reference Gramig, Reeling, Cibin and Chaubey2013; Lester et al. Reference Lester, Costello, Halpern, Gaines, White and Barth2013; Lahtinen, Hämäläinen, and Liesiö Reference Lahtinen, Hämäläinen and Liesiö2017).
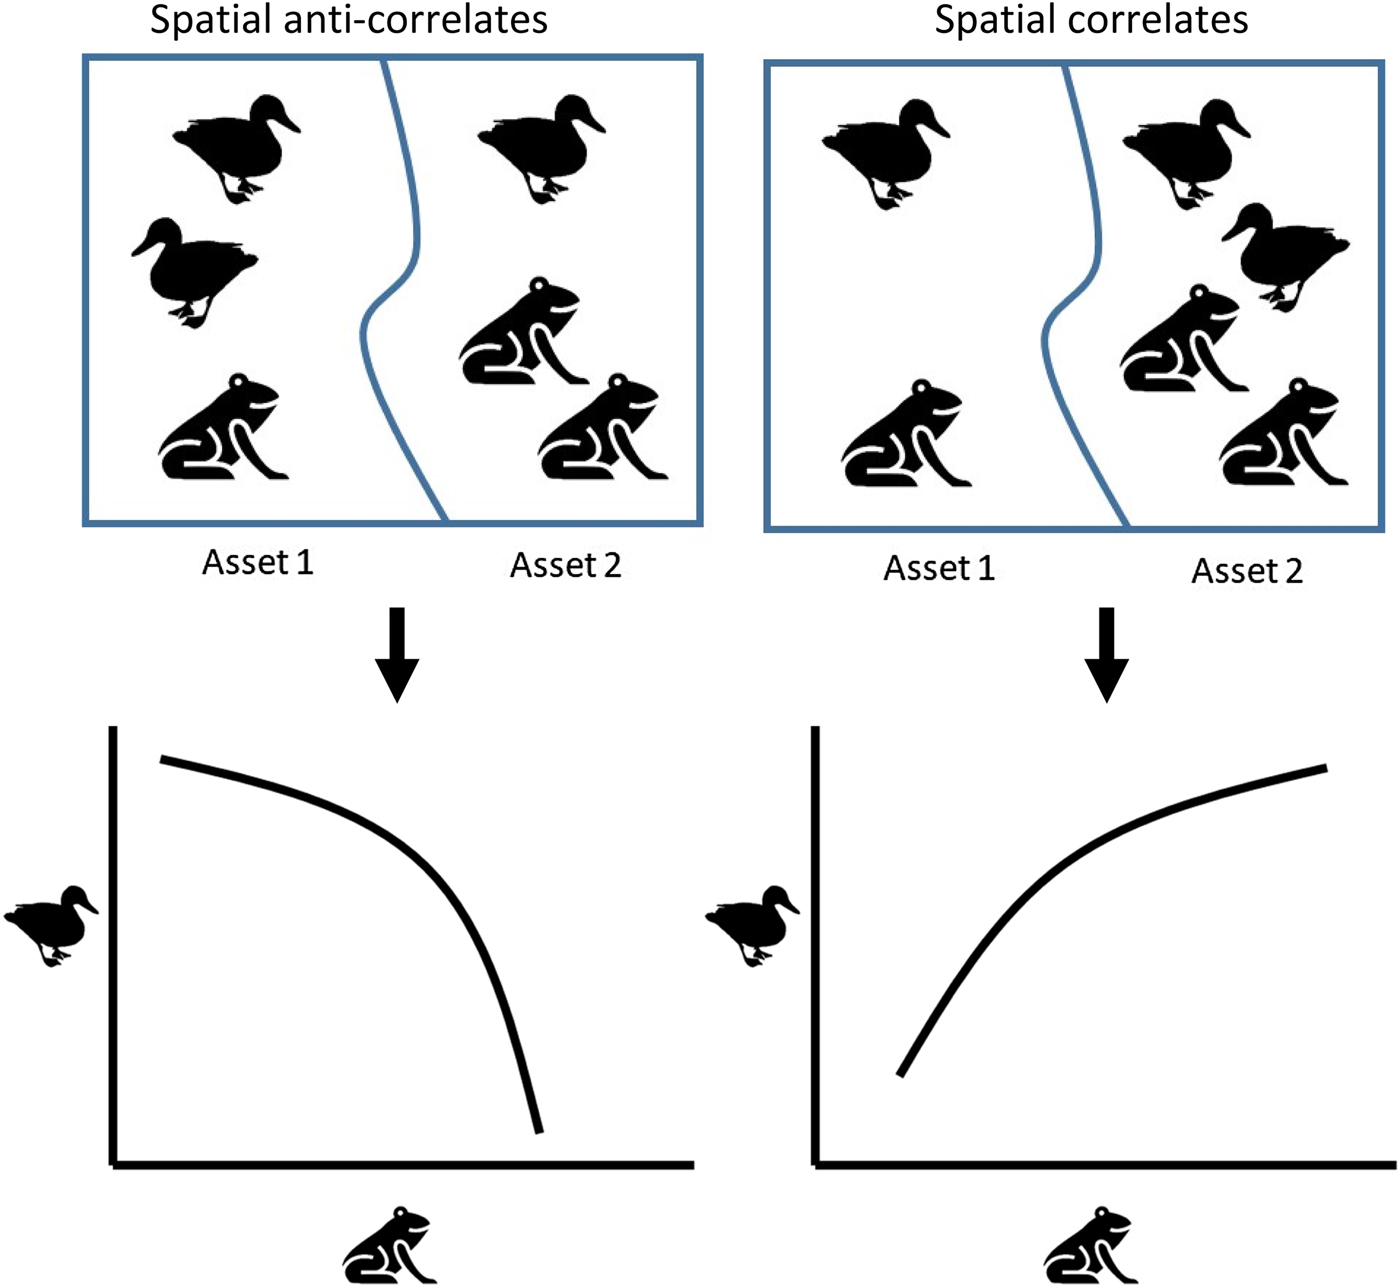
This research has collectively produced some basic intuitive insights. Selection of protected areas (or other environmental investments) can accomplish Pareto efficient combinations of outcomes if, but only if, that selection jointly optimizes all the objectives and successfully exploits complementarities among the objectives. Two objectives can be what we will call “spatial correlates,” such that they tend to co-occur in the landscape, and an action that benefits one will benefit the other. Indeed, the whole concept in conservation biology of using data on surrogate species to plan conservation for a less well-documented species depends on those things being spatial correlates (Caro and O'Doherty Reference Caro and O'Doherty1999). Alternatively, they can be what we call “spatial anticorrelates,” and the conservation planner will face a production possibilities frontier (PPF) over the two objectives with stark tradeoffs between them. For example, lands that are best for carbon sequestration often do not harbor the most biodiversity (Siikamäki and Newbold Reference Siikamäki and Newbold2012), and Lester et al. (Reference Lester, Costello, Halpern, Gaines, White and Barth2013) give a taxonomy for different types of tradeoffs that might exist between ecosystem service in marine settings. The landscape patterns and PPFs for the two cases are illustrated in Figure 2 for hypothetical objectives of birds and frogs.
Multiobjective Spatial Correlation and Production Possibility Frontiers
Recent multidisciplinary work has also produced insight about conservation with multiple objectives and complex human behavior. Protected area selection can yield inefficient combinations of biodiversity and human welfare if human behavioral responses to protected areas are not accounted for in the site selection process (Bode et al. Reference Bode, Tulloch, Mills, Venter and Ando2015). Additionally, optimal multiple-objective plans are difficult to put in place if actual conservation is carried out by multiple organizations that focus on subsets of objectives and do not fully coordinate their actions (Bode et al. Reference Bode, Probert, Turner, Wilson and Venter2011).
Single Objective with Uncertainty
In recent years, climate change went from being an abstract potential threat to a phenomenon that was almost certain to threaten the biodiversity that conservationists were working to protect (Araújo et al. Reference Araújo, Alagador, Cabeza, Nogués-Bravo and Thuiller2011). Scientists started incorporating climate change uncertainty into single-objective conservation planning research, finding methods to reduce uncertainty in the success of the networks of lands we protect (Carvalho et al. Reference Carvalho, Brito, Crespo, Watts and Possingham2011; Dawson et al. Reference Dawson, Jackson, House, Prentice and Mace2011; Schuetz et al. Reference Schuetz, Langham, Soykan, Wilsey, Auer and Sanchez2015; Tulloch et al. Reference Tulloch, Maloney, Joseph, Bennett, Fonzo, Probert, O'Conor, Densem and Possingham2015; Wright et al. Reference Wright, Hijmans, Schwartz and Shaffer2015; Dittrich, Wreford, and Moran Reference Dittrich, Wreford and Moran2016; Jones et al. Reference Jones, Watson, Possingham and Klein2016).
Research by ecologists produced intuitive insights infused with their knowledge of and concern for details about species and ecosystems (Mawdsley, O'Malley, and Ojima Reference Mawdsley, O'Malley and Ojima2009). Some research calls for protection of land that can serve as corridors between where species are and where they are likely to be in a future climate (Williams et al. Reference Williams, Hannah, Andelman, Midgley, Araújo, Hughes, Manne, Martinez-Meyer and Pearson2005; Alagador, Cerdeira, and Araújo Reference Alagador, Cerdeira and Araújo2016). In general, a more connected landscape of natural areas will be more permeable to species that are migrating in response to climate changes (Theobald et al. Reference Theobald, Reed, Fields and Soulé2012). Conservation planners can prioritize climate refugia—places where the climate is not likely to change much, or where the species present will be robust to any changes that occur (Groves et al. Reference Groves, Game, Anderson, Cross, Enquist, Ferdaña, Girvetz, Gondor, Hall, Higgins, Marshall, Popper, Schill and Shafer2012).
Economists tackled spatial conservation planning under climate risk by adapting a portfolio optimization tool from the finance literature (Markowitz Reference Markowitz1952, Reference Markowitz1968), modern portfolio theory (MPT), to analysis of portfolios of conservation land investments (Ando and Mallory Reference Ando and Mallory2012; Convertino and Valverde Reference Convertino and Valverde2013; Mallory and Ando Reference Mallory and Ando2014; Anderson et al. Reference Anderson, Moore, McClure, Dulvy and Cooper2015; Shah and Ando Reference Shah and Ando2015; Ando et al. Reference Ando, Fraterrigo, Guntenspergen, Howlader, Mallory, Olker and Stickley2018a). Spatial conservation portfolio analysis divides a landscape into subregions, among which the planner is choosing to divide total conservation investment. The planner gathers data from ecologists on how well the conservation objective (say, a species population) does in each subregion in a wide range of possible climate scenarios, and uses those data to calculate the expected value of the objective in each subregion, how much that value varies with scenarios (the standard deviation of each subregion), and how outcomes are correlated across different parts of the landscape (the covariances between each pair of subregions.) With that information, the MPT algorithm can choose what fraction of the total conservation investment to put in each of the subregions to minimize total outcome uncertainty for a given level of expected value for the outcome. Details are given in Ando and Mallory (Reference Ando and Mallory2012).
Some general intuition can be gleaned from that set of papers. First, the probabilities of different climate outcomes affect what are the best choices to make for current conservation investments. It is difficult to estimate the likelihood of climate scenarios, but some effort in this area could produce useful tools (Dessai and Hulme Reference Dessai and Hulme2004; Beaumont, Hughes, and Pitman Reference Beaumont, Hughes and Pitman2008). Second, low-cost risk reduction is possible for a wider range of objectives for which one might do conservation planning. Furthermore, the outcomes derived from MPT recommendations can be much better than the results of simple diversification (Ando et al. Reference Ando, Fraterrigo, Guntenspergen, Howlader, Mallory, Olker and Stickley2018a).
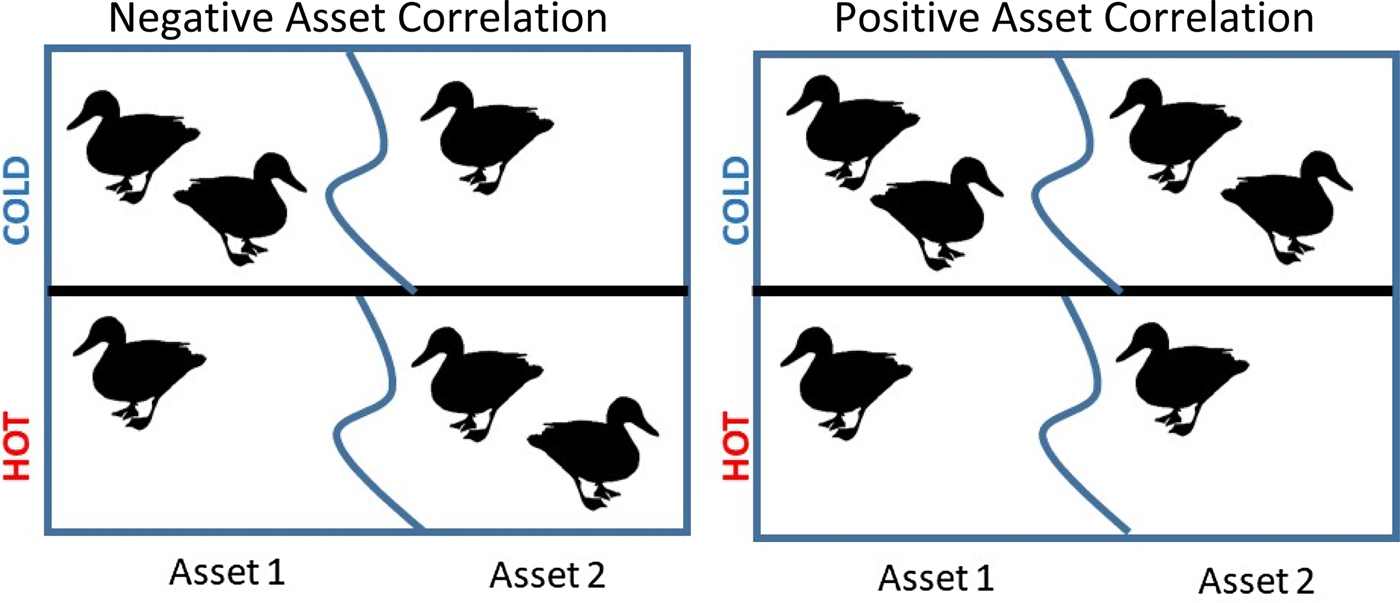
Third, MPT works most effectively in certain types of cases (Ando et al. Reference Ando, Fraterrigo, Guntenspergen, Howlader, Mallory, Olker and Stickley2018a). One factor that facilitates reduction of uncertainty without sacrificing much expected value is if several spatial sub-regions have future outcomes that are negatively correlated with each other. We say that two subregions display negative single-objective asset correlation if outcomes for a given conservation good are negatively correlated in a pair of assets. Figure 3 shows a case on the left that has negative asset correlation, and a case on the right with positive asset correlation. This concept has been a driving analytical and numerical feature of financial portfolio analysis for decades, as investors intuitively and numerically choose combinations of assets such as stocks and bonds that are negatively correlated with each other to diversify risk in overall returns of their portfolio. Conservation planners can use knowledge about such correlations between different parts of a landscape to develop intuition about how to diversify conservation risk.
Single-Objective Asset Correlation
Multiple Objectives with Uncertainty
In finance and engineering, much research has been done on multiple-objective portfolio optimization to reduce uncertainty in outcomes. That research produces no intuition that is helpful for the conservation planning community, but we outline what has been done as a guide for interested readers who might benefit from technical innovations in that research.
Research in finance and engineering on MPT with multiple objectives has used evolutionary algorithms (Coello, Van Veldhuizen, and Lamont Reference Coello, Van Veldhuizen and Lamont2002; Jin and Branke Reference Jin and Branke2005; Ruzika and Wiecek Reference Ruzika and Wiecek2005; Branke et al. Reference Branke, Scheckenbach, Stein, Deb and Schmeck2009; Anagnostopoulos and Mamanis Reference Anagnostopoulos and Mamanis2011; Metaxiotis and Liagkouras Reference Metaxiotis and Liagkouras2012; Lwin, Qu, and Kendall Reference Lwin, Qu and Kendall2014), genetic algorithms (Ulungu and Teghem Reference Ulungu and Teghem1994; Deb Reference Deb2001; Sardou et al. Reference Sardou, Nazari, Ghodsi and Bagherzadeh2015), and lexicographic multiobjective programming (Sherali Reference Sherali1982). Piecewise-hyperbolic and hyperboloidic Pareto spaces were introduced by Steuer, Qi, and Hirschberger (Reference Steuer, Qi and Hirschberger2005, Reference Steuer, Qi, Hirschberger and Trzaskalik2006) to study how to incorporate multiple attributes in a portfolio selection model including dividends, liquidity, turnover, number of securities in the portfolio. Other studies incorporated new dimensions in the mean-variance optimization problem including features such as skewness and kurtosis (Lai Reference Lai1991; Anson, Ho, and Silberstein Reference Anson, Ho and Silberstein2007; Ballestero et al. Reference Ballestero, Günther, Pla-Santamaria and Stummer2007; Jana, Roy, and Mazumder Reference Jana, Roy and Mazumder2007; Aouni Reference Aouni2009; Clemen and Smith Reference Clemen and Smith2009; Anagnostopoulos and Mamanis Reference Anagnostopoulos and Mamanis2010; Usta and Kantar Reference Usta and Kantar2011; Bhattacharyya, Chatterjee and Kar Reference Bhattacharyya, Chatterjee and Kar2013; Utz et al. Reference Utz, Wimmer, Hirschberger and Steuer2014; Kourtis Reference Kourtis2015). Babaei, Sepehri, and Babaei (Reference Babaei, Sepehri and Babaei2015) describes a multiobjective mixed integer programming algorithm to implement portfolio optimization based on information about the dependence structure among the financial returns and presence of fat-tailed return distributions.
A few papers in the conservation planning literature have tackled the problem of systematically diversifying against risk when optimizing conservation investments to produce multiple distinct objectives. Knoke et al. (Reference Knoke, Paul, Hildebrandt, Calvas, Castro, Härtl, Döllerer, Hamer, Windhorst, Wiersma, Curatola Fernández, Obermeier, Adams, Breuer, Mosandl, Beck, Weber, Stimm, Haber, Fürst and Bendix2016) study the problem of multiple forest conservation objective optimization under uncertainty, but their methodological approach assigns fixed weights on the objectives. Cabral et al. (Reference Cabral, Halpern, Costello and Gaines2017) more flexibly model fishery management choices with multiple ecosystem service objectives, but their model only permits uncertainty in one of the objectives. There is much work left to be done in this area of research.
Conservation Planning for Multiple Objectives with Uncertainty
We develop a new approach to multiobjective portfolio optimization, as follows. For expository purposes, we build a conceptual model in which a planner is choosing a network of conservation sites to support two conservation objectives: waterfowl habitat, or “birds” (B), and amphibian habitat, or “frogs” (F). The conservation planner is choosing quantities of lands to protect in each of the subregions of a landscape so that future levels of B and F are high, but the planner does not know what the future climate (and thus future levels of B and F on any given portfolio of lands) will be.
In conservation portfolio theory models, a portfolio defines the fractions (known technically as weights) of the total investment that are put into each of the sub-regions in which the planner could conserve lands. Since the fractions add up to one, there is no explicit budget constraint; the weights in a portfolio dictate how the available budget is divided among the subregions. For a given portfolio of lands, the outcomes of B and F are random variables that are jointly distributed with means μB and μF, standard deviations σB and σF, and covariance σBF.
The conservation planner values both objectives and gains total conservation value V from them according to a function V = V(B, F|α).
We assume that the value V is increasing in both B and F, the two goods are somewhat (though not completely) substitutable, and α is a preference parameter that determines how much B is preferred to F in the objective; α lies between zero and one.
Suppose the decision maker obtains utility U from realized conservation production value V according to an expected utility function that displays risk aversion such that utility diminishes with the variance of V. Then as Markowitz (Reference Markowitz1952) showed, the conservation investor will want to choose weights on the subregions to define a portfolio that minimizes the variance of V for a given level of expected value, or maximizes the expected value of V for a given level of variance.
For a set of technical assumptionsFootnote 1, we can show that the planner will want to choose weights for portfolios of lands that yield high values of μB and μF, low values of σB and σF, and negative values for the covariance between B and F. This is intuitively sensible because the planner seeks a portfolio with high expected value of V, which increases with the expected values of the two goods that contribute to V. Similarly, the planner seeks a portfolio with low variance of V. Clearly the variance of V is lower if the variance of the outcomes of each of its components is low. Less obviously, the variance of V is also lower if the covariance between the outcomes in the portfolio for the two objectives is negative. A conservation portfolio is internally buffered against having high variance in V if when birds do badly at least frogs do well (and vice versa).
To find efficient portfolios of protected lands for multiple objectives, the planner can take the following steps (Ando et al. Reference Ando, Fraterrigo, Guntenspergen, Howlader, Mallory, Olker and Stickley2018b). First, choose preference parameters on the objectives in the conservation value function. Second, calculate values of V for all the sub-regions in all the climate scenarios for which data are available. Third, carry out a standard MPT analysis as in Ando and Mallory (Reference Ando and Mallory2012) to find portfolios that maximize the expected value of V for a given variance. This yields an efficient frontier in terms of V. Fourth, use the weights associated with each of the efficient portfolios on the frontier to calculate the resulting expected values and standard deviations for each of the separate conservation objectives. These can be graphed to view the tradeoffs between uncertainty and expected values embedded in the efficient frontier. Fifth, the first four steps can be repeated for different values of the preference parameters to explore how outcomes for the different goods vary depending on that choice.
We illustrate this method with simulated data. Birds and frogs provide uncertain conservation value in four sub-regions, so that [B, F]′ is an eight by one vector of random variables distributed jointly normal according to  $${[B,\; F]^\prime} \sim\! {N([{\rm \mu }_B,{\rm \mu }_F]^\prime},\; {\rm \Sigma })$$, where [μB, μF]′ is an eight by one vector of means for values of birds and frogs in each region, and Σ is the covariance matrix. We generated 100 draws of B and F, representing 100 possible future climate scenarios. Then we performed the multiobjective portfolio analysis described in the five steps in the preceding paragraph.Footnote 2 In our simulation we set [μB, μF]′ = [12, 4, 20, 5, 3, 30, 1, 12], which reflects a case where on average, subregions that are good for frogs are bad for birds, and vice versa. The resulting jointly optimized multiobjective efficient frontier is shown in a solid line in Figure 4. As expected, the curve is upward sloping, displaying the usual tradeoff between risk and expected return for the aggregate conservation value V.
Efficient Multiobjective Portfolio Frontier

Theory tells us that the planner does well to analyze the objectives together so that choices can be made to account for the value of having negative covariance between the outcomes of the different objectives. How valuable is that coordination? To understand the importance of analyzing both objectives simultaneously in a portfolio analysis, we carry out the following thought experiment. We calculate the weights of the portfolios that would result if we separated MPT analyses for each of the objectives and then allocated α of our investment according to the weights in the efficient portfolios for B and (1−α) of our investment according to the weights in the efficient portfolios for F.
The expected returns and standard deviations for V that result from that strategy are shown in Figure 4 in the separately optimized multiobjective frontier (the dashed line that lies below the solid line), which achieves 13 percent lower expected returns on average than the fully efficient frontier.
Portfolios on the jointly optimized multiobjective efficient frontier for a given value of α have values for the expected returns and standard deviations for each of the separate objectives. By calculating and plotting those values in PPFs, the planner can see the qualitative nature of those tradeoffs and how they change as you alter the value of α.
Panel (a) of Figure 5 shows that among portfolios for a given value of α (such as 0.5, the value used in Figure 4 as well), the expected return on Birds is decreasing with the expected return on Frogs. This is because in the particular simulation example we chose, regions that are good for birds are not good for frogs on average. Points on the jointly optimized multiobjective efficient frontier in Figure 4 that happen to correspond to portfolio weights that favor high average returns in Birds will deliver relatively low returns on Frogs on average. This natural hedge between Bird and Frog returns is fully exploited in the jointly optimized portfolios, allowing the jointly optimized multiobjective efficient frontier in Figure 4 to lie above and to the left of the separately optimized frontier.
Impact of Preference Parameters on Bundles of Goods Achieved
Panel (a) shows that when α = 0.25, and the planner favors Birds in V, this is reflected in the solid line that is relatively high in the Bird dimension and low in the Frog dimension. Similarly, when α = 0.75, the planner favors Frogs in V, and this is reflected in the long-dashed line being high in the Frog dimension and low in the Bird dimension. Panel (b) shows a similar pattern in standard deviations for the two goods; the fully optimized portfolios produce PPFs with relatively low standard deviations for the good that is more highly valued. If a planner is not exactly sure what their implicit value weights are, they could produce multiple PPFs like these for inspection to decide what kinds of tradeoffs between the two conservation goods they would like to accept.
Panel (b) shows that among portfolios for a given value of α, the standard deviation on Birds is increasing as the standard deviation of Frogs increases. This is also an artifact of the particular simulation we did, and could have different features in other simulations or real applications. In this case, it comes about because although the covariance matrix on bird returns and frog returns were generated at random, the outcome turned out to be such that asset variances are correlated for birds and frogs. For example, portfolios that have much of the portfolio allocated to asset 4 will be high variance because for both bird and frog expected returns, this is a high-variance asset. Conversely, in this particular simulation the third asset was a low variance asset for both birds and frogs. This was enough to drive an upward slope in the standard deviation PPF depicted in panel (b).
Intuition on Factors in Covariance Between Multiple Objectives
Scholars of financial portfolio theory have long had an intuitive sense of the value of exploiting negative correlations between assets for a single objective—in that case, monetary returns. That same intuition is relevant to the study of spatial conservation portfolios in the case of a single conservation objective. Three kinds of correlations are important for the study of multiple conservation objective portfolios.
Two of those correlations were important in earlier strains of conservation planning research and have already been discussed in this paper. Spatial correlations between objectives (Figure 2) affect the tradeoffs between objectives for a given climate scenario. Asset correlation for a given objective (Figure 3) affects how well diversification can work to reduce outcome uncertainty with minimal reduction in the expected value of that objective.
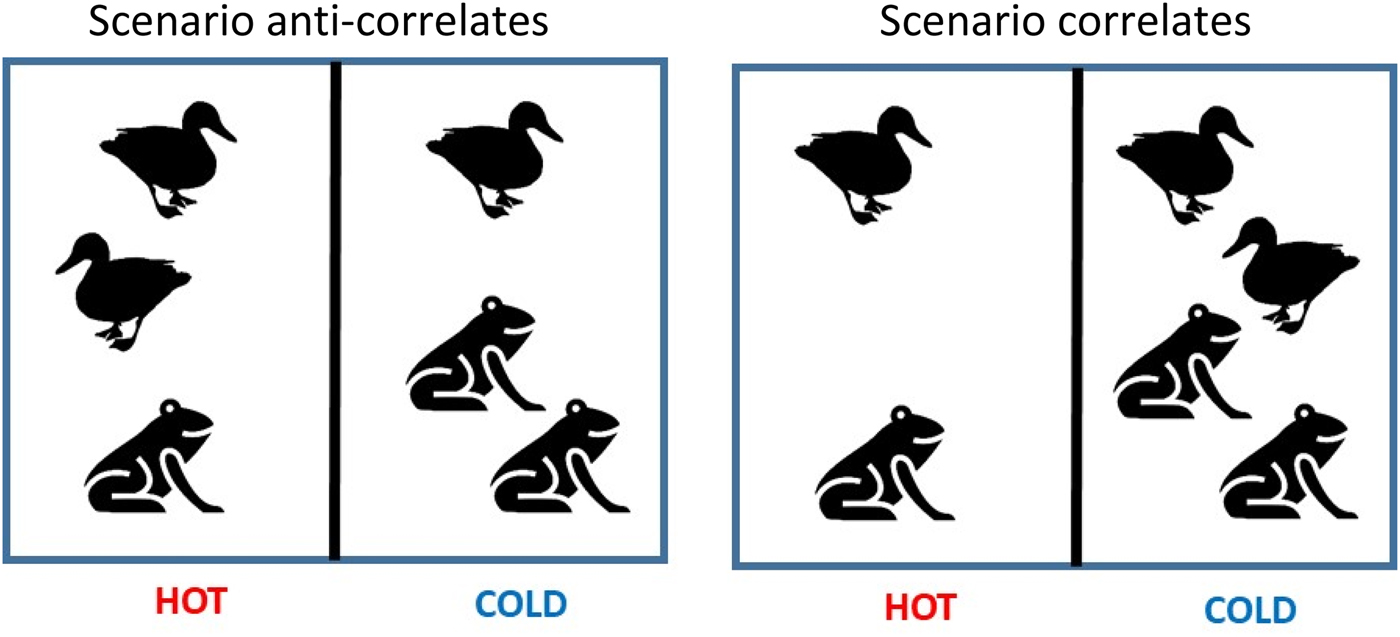
The third type correlation has, to our knowledge, not been extensively discussed in the conservation planning literature; we refer to it as multiobjective scenario correlation. Consider that in a given subregion, some species will do better when climate outcomes are hot, while others may do better when climate outcomes are cold. If outcomes for two goods within a subregion are negatively correlated, as on the left side of Figure 6, we say they are scenario anticorrelates. If outcomes for two good are positively correlated across climate outcomes (in this example, they both like it cold), we say they are scenario correlates. Negative scenario correlation provides a sort of internal buffering—regardless of the climate outcome, at least one of the conservation outcomes that provides value will do well.
Multiobjective Scenario Correlation
Conclusions
Each new wave of research on conservation planning has provided new intuition for strategies for allocating scarce resources across a planning landscape to achieve the greatest benefits possible. As climate change emerges as an inevitable threat to biodiversity and other ecosystem services, researchers develop new tools to try to reduce the uncertainty created by climate change in the outcomes of the networks of protected areas we put in place.
Research on the economics of reducing outcome uncertainty in a single conservation objective has already yielded some key insights. The probabilities attached to different climate outcomes are likely to influence the best places in which to locate conservation reserves. Exploiting information about correlations between subregions of the planning landscape can help the planner to reduce the cost of risk reduction.
In this paper we started the process of developing tools and intuition for portfolio optimization for multiple conservation objectives. We showed it is more efficient to optimize a conservation portfolio for multiple goods jointly; that process allows the planner to exploit information about multiple dimensions of the correlations between goods.
Previous research on multiple-objective optimization under certainty showed that optimal actions depend on the spatial correlation between objectives in the landscape. Previous research on single-objective optimization under uncertainty showed that optimal actions depend on the correlation between sub-regions of the landscape in future outcomes for that objective. This paper identified a third correlation that is important for optimal conservation planning of multiple objectives under uncertainty: scenario correlation between objectives in a given part of the landscape. The conservation planner faces a different kind of problem if the objectives at hand respond similarly rather than differently to climate shocks in subregions of the planning area. Future research would do well to explore qualitative patterns in the nature of multiple-objective portfolio optimization solutions for different correlation typologies.


 Open access