





Introduction
Epinephrine is a frequently used vasoactive in the paediatric cardiac ICU. Reference Loomba and Flores1,Reference Loomba, Patel, Villarreal, Farias and Flores2 It is often utilised as a continuous infusion but can also be used as a bolus dose. Bolus doses of epinephrine were initially utilised during cardiopulmonary resuscitation, although boluses have also started being used in deteriorating patients who are not receiving cardiopulmonary resuscitation. In this setting, the clinical aim is often to avoid cardiorespiratory arrest. Reference Holden, Ramich, Timm, Pauze and Lesar3,Reference Weingart4
When epinephrine is used in the non-arrest setting, it is often used at a lower dose. There are limited data on this non-code dose bolus epinephrine, although its use is largely endorsed by paediatric intensivists. Reference Ross, Hayes, Kleinman, Donnino and Sullivan5 Its use has even been mentioned in the scientific statement regarding cardiopulmonary resuscitation in infants and children with cardiac disease. Reference Marino, Tabbutt and MacLaren6 The limited data suggest that non-code dose bolus epinephrine may significantly raise blood pressure and heart rate in children.
The primary aim of this study was to characterise the change in heart rate, blood pressure, and renal near infrared spectroscopy in the 2 minutes following administration of a non-code dose bolus epinephrine in paediatric cardiac intensive care patients.
Methods
Study design
This was a single-centre, retrospective study using high-fidelity physiologic data collected with the Sickbay platform (Medical Informatics Company, Houston, TX, USA). The primary aim of the study was to quantify the response in heart rate, systolic arterial blood pressure, mean arterial blood pressure, diastolic arterial blood pressure, central venous pressure, near infrared spectroscopy, and arterial saturation in the 120 seconds (2 minutes) following administration of a non-code dose bolus epinephrine in non-cardiorespiratory arrest situations in the cardiac ICU. Secondary aims of the study were to quantify the magnitude and timing of the peak effect of non-code dose bolus epinephrine on these physiologic parameters and to determine if age, weight, or circulatory pattern influenced the magnitude of response.
Institutional review board approval was obtained for this study.
Variables of interest
The following physiologic data were collected from the Sickbay platform with 1 second temporal resolution: heart rate (beats per minute), systolic arterial blood pressure (mmHg), mean arterial blood pressure (mmHg), diastolic arterial blood pressure (mmHg), central venous pressure (mmHg), renal near infrared spectroscopy (%), and arterial saturation (%). The data for heart rate were sourced from telemetry, data for arterial blood pressure from an arterial line, data for central venous pressure from a central venous line, and renal near infrared spectroscopy from the INVOS 5100 (Medtronic, Boston, MA, USA).
Clinical variables collected from the electronic medical record included age (months), weight (kg), and circulatory type at the time of non-code dose bolus epinephrine administration. Principal circulatory types were as follows: fully septated biventricular, left-to-right shunt, limitation to pulmonary blood flow, limitation to systemic blood flow, preoperative transposition, functionally univentricular (multidistributive, Glenn, or Fontan), or ventricular dysfunction. It is possible that some patients were able to be classified in more than one circulatory type, but the principal one was selected based on clinical judgement.
Administration inclusion
Non-code dose bolus epinephrine administrations in the paediatric cardiac ICU from 1 January 2022 to 1 May 2025 were identified. Administrations to patients who did not receive cardiopulmonary resuscitation, code-dose vasoactive administration, sodium bicarbonate, or endotracheal intubation in the two minutes prior to and after were eligible for inclusion. This was done to best isolate the effect of the non-code dose bolus epinephrine. Administrations to patients who received any of these interventions in the period of interest, did not have Sickbay data available, or did not have arterial line data during the administration were excluded.
Statistical analyses
Continuous variables are reported as mean and standard deviation, while categorical variables are reported as absolute count and percent.
Missing data were identified, and median imputation was performed to handle missing values.
Next, the timing of non-code dose bolus epinephrine administration was annotated into the data for each administration. The timestamps in the data were used to determine relative times in seconds for all data points per administration. Thus, relative time was negative for timepoints prior to non-code dose bolus epinephrine administration and positive for timepoints after.
For each administration, the maximal percent peak change in heart rate, mean arterial blood pressure, and renal near infrared spectroscopy was determined from the time series. The relative time at which this occurred was also determined. Baseline values for all variables were calculated using the median values of the variables in the 120 seconds prior to epinephrine administration.
Next, autoregressive integrated moving average with exogenous inputs analyses were performed. Time-series modelling was conducted using autoregressive models to quantify the effect of non-code-dose bolus epinephrine administration on physiologic parameters while adjusting for age, weight, and circulatory type. Separate models were fit for percent change in heart rate, systolic arterial blood pressure, mean arterial blood pressure, diastolic blood pressure, central venous pressure, renal near infrared spectroscopy, arterial saturation, and respiratory rate. For each model, the dependent variable was the binned physiologic time series, and the independent variables were phase (before or after epinephrine), age, weight, circulatory type, and vasoactive inotrope score. The models used an autoregressive lag of 1 second and a moving average lag of 1 second. No difference was applied. Analysis diagnostics were reviewed to ensure that heteroscedasticity was not an issue. Parameters were estimated using maximum likelihood using the SARIMAX implementation in the statsmodels Python library. Model fit was assessed.
Next, unsupervised cluster analysis was performed to identify distinct patterns of physiologic response to non-code dose bolus epinephrine. An unsupervised clustering approach was performed on the time series of percent change in heart rate, mean arterial blood pressure, and renal near infrared spectroscopy from baseline. A dynamic time warping distance matrix was computed across administrations to account for potential phase shifts in the timing of peak responses. Clustering was then performed using agglomerative hierarchical clustering with Ward’s linkage. The optimal number of clusters was determined using silhouette scores. Descriptive characteristics, including age, weight, and circulatory type, were compared across clusters using analysis of variance or Kruskal–Wallis tests, as appropriate.
Dynamic time warping was used to assess similarity in response trajectory. This method quantifies the resemblance between two time series based on the shape of their trajectories. This is advantageous as it allows for nonlinear stretching or compression of the time axis and allows for identification of patients with similar physiologic response patterns even if peaks or nadirs occur at slightly different times. This does mean that the timing of peaks and nadirs in response could be different within clusters, although the overall response shape was the same.
Finally, a regression analysis was conducted to model the percent change in mean arterial blood pressure and the percent change in renal near infrared spectroscopy separately in only those with functionally univentricular multidistributive circulation.
All statistical analyses were conducted using a local Python environment. A p-value of less than 0.05 was considered statistically significant. All use of the word “significant” or “significantly” in this manuscript refers to statistical significance unless explicitly specified to be clinical significance.
Results
Cohort characteristics
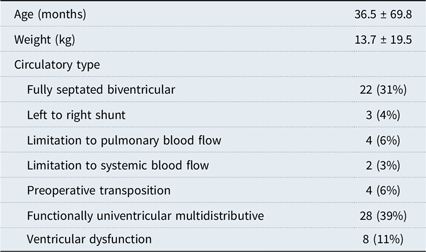
A total of 71 non-code dose bolus epinephrine administrations were included in the final analyses. The average age at non-code dose bolus epinephrine administration was 36.5 months, and the average weight was 13.7 kg. The most frequent circulatory type was functionally univentricular multidistributive circulation in 28 (39%) patients, followed by fully septated biventricular circulation in 22 (31%) patients (Table 1). The dose of epinephrine was 1 mcg/kg for all patients, as this dose is standardised in the cardiac ICU.
Cohort characteristics, administration level data
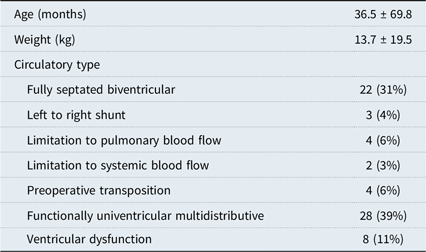
Vasoactive infusions were present at the time of 43 (61%) of the non-code dose bolus epinephrine administrations. The most frequent vasoactive infusions were milrinone in 34 and epinephrine in 23. The average vasoactive inotrope score at the time of administration of non-code dose bolus epinephrine was 7.4.
The proportion of missing data was less than 7% for all variables.
Physiologic effects
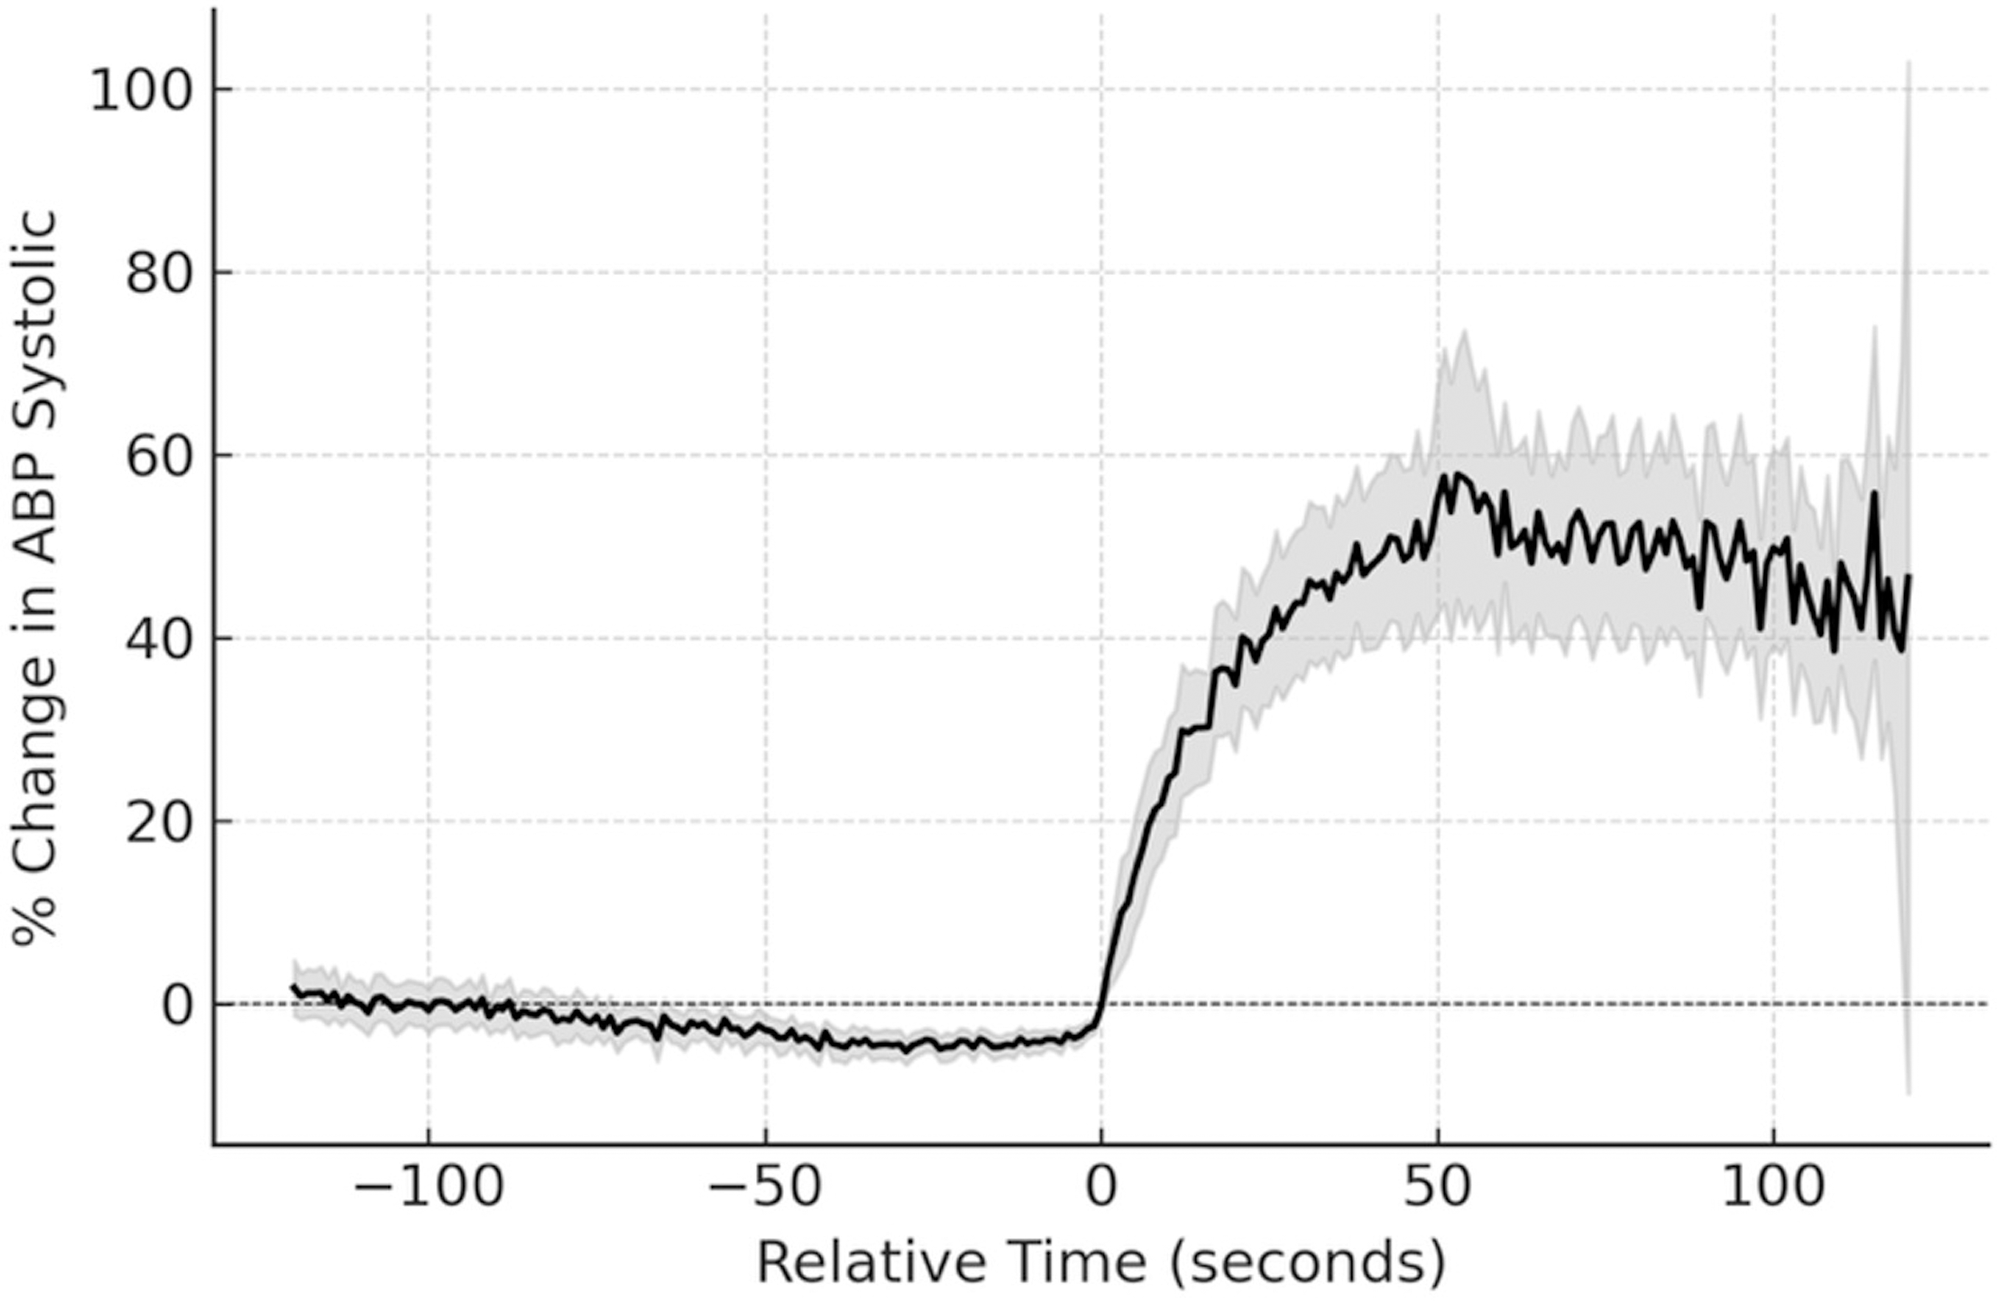
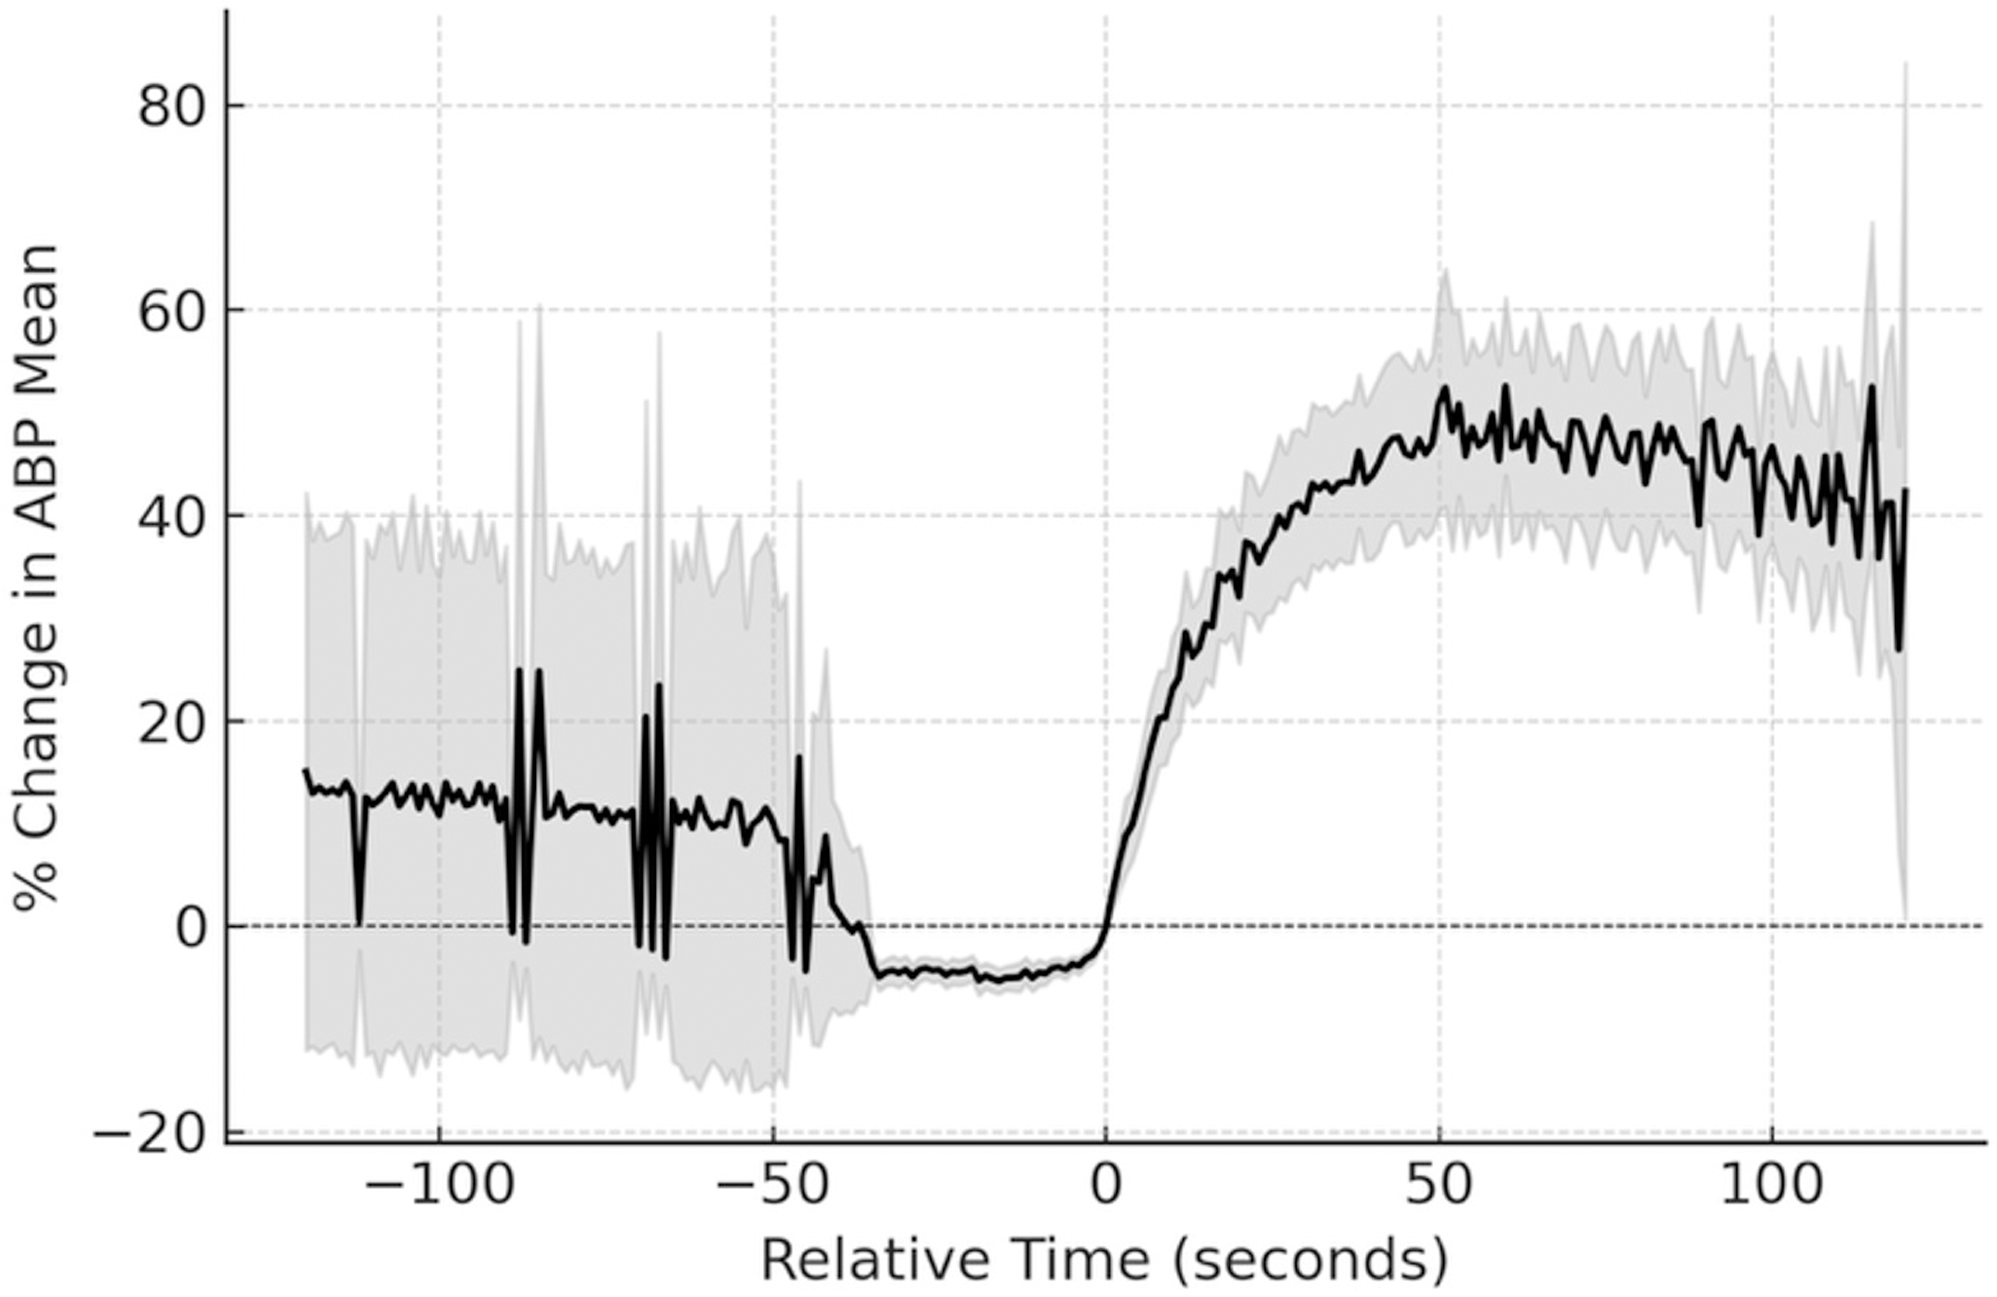
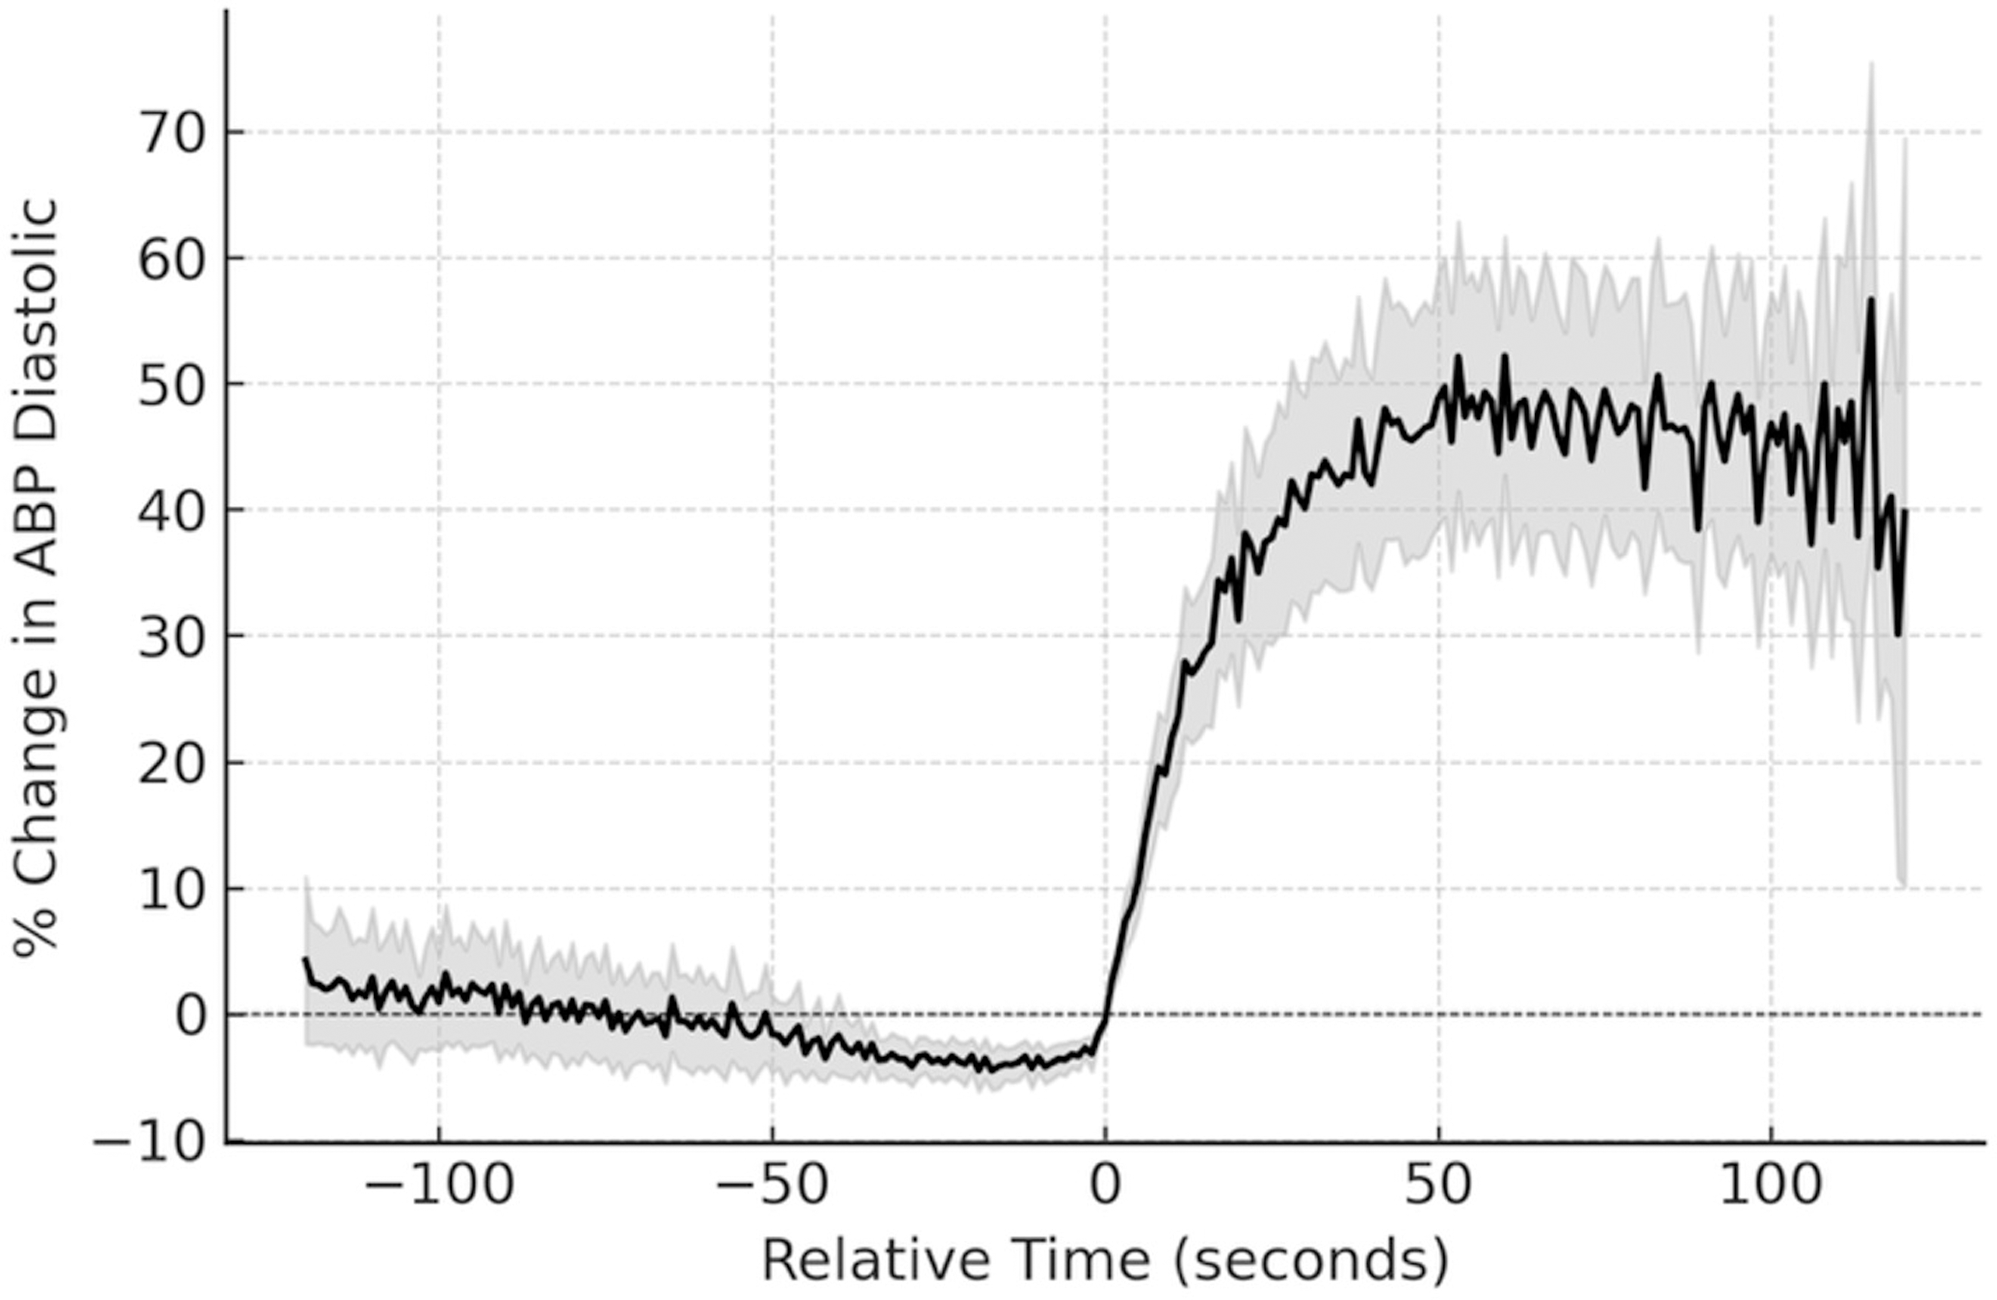
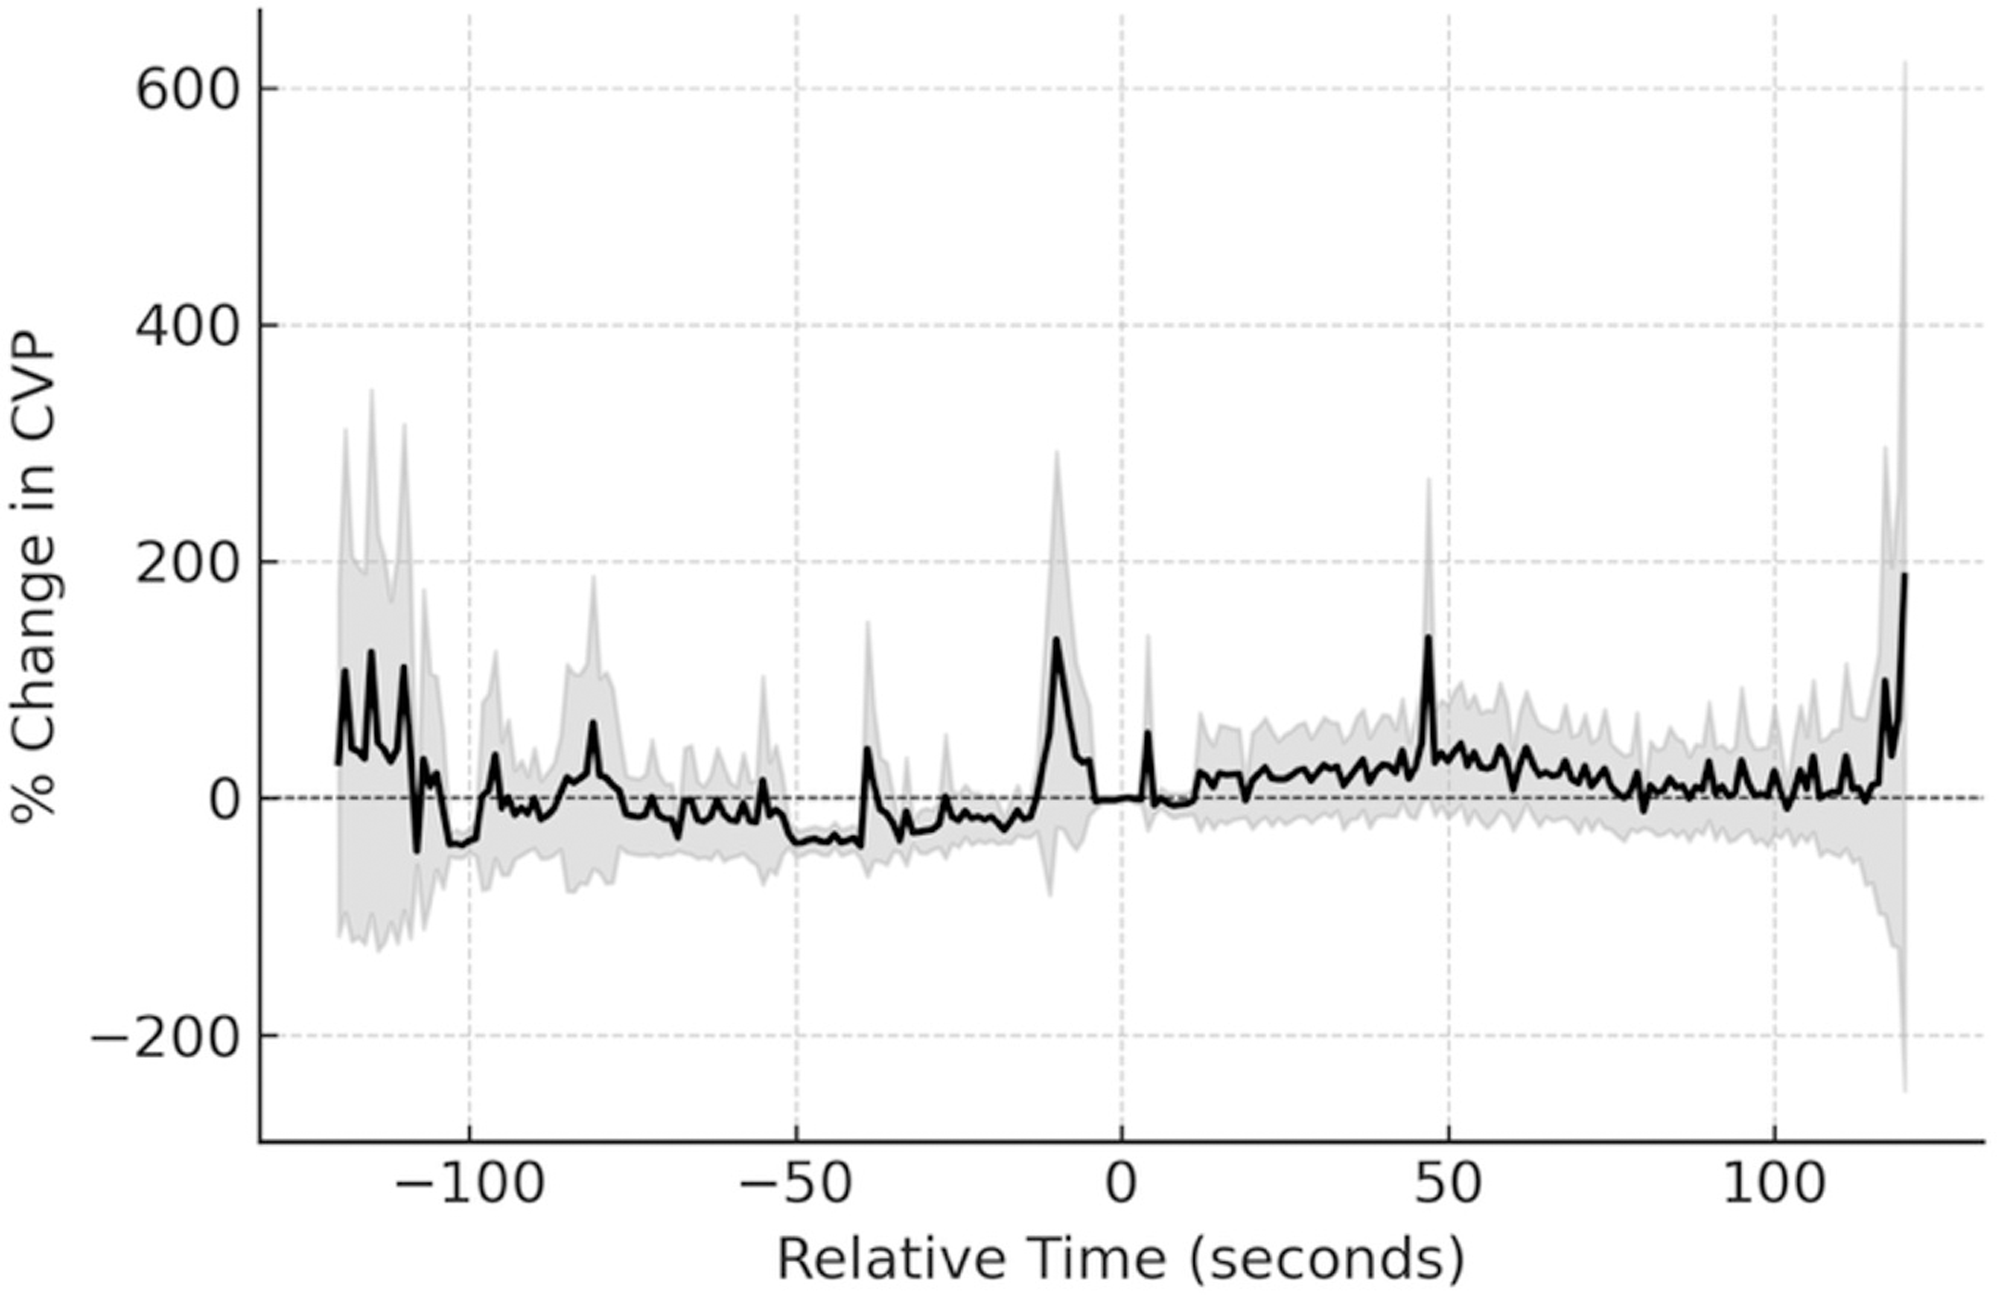
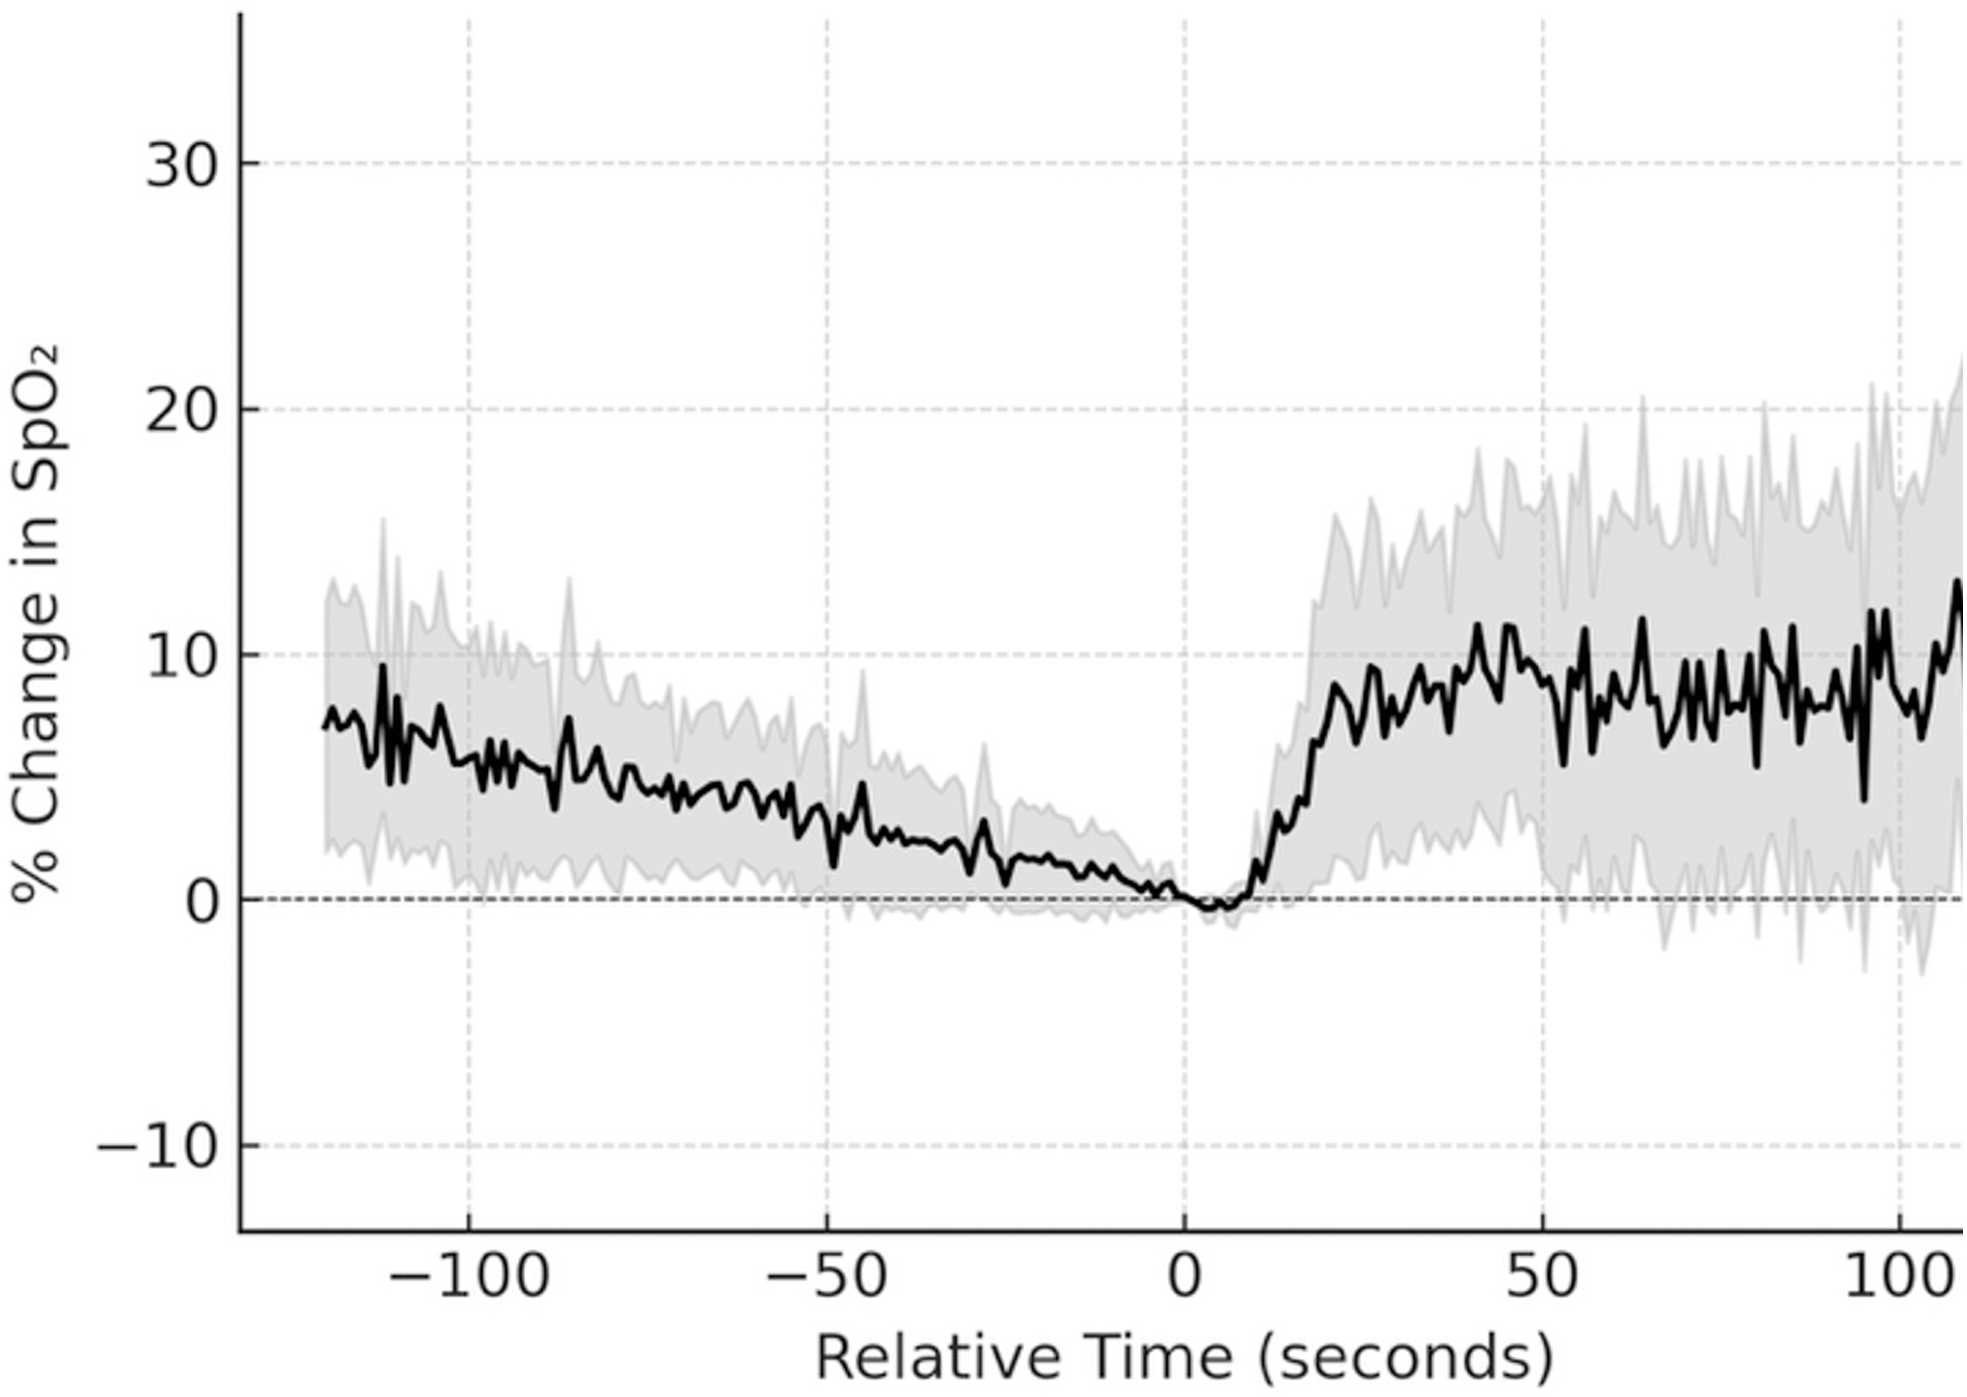
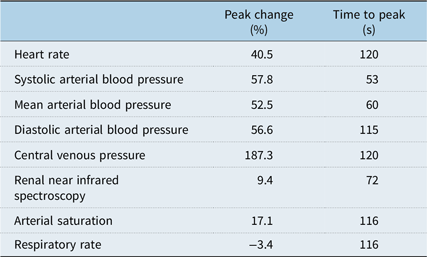
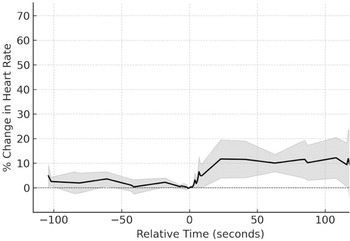
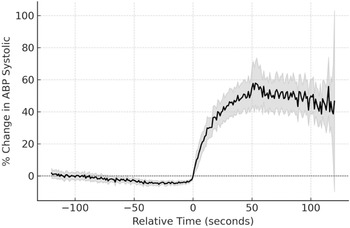
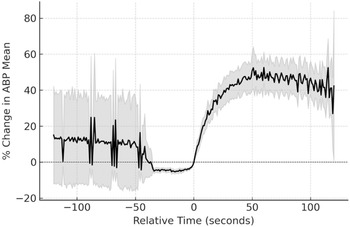
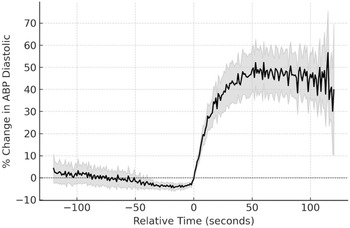
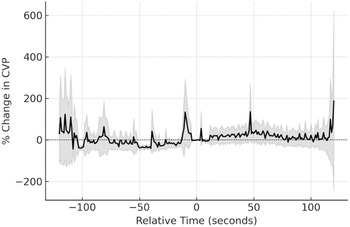
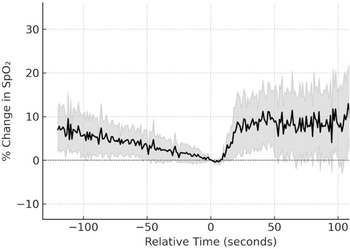
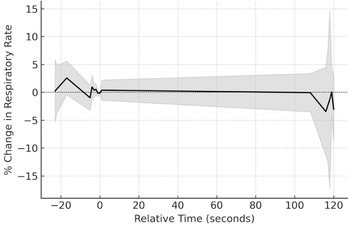
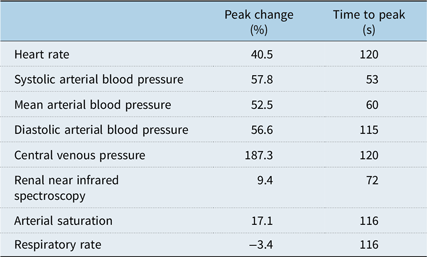
Figures 1 through 8 characterise the percent change in the physiologic variables of interest with relative time. The moment of non-code dose bolus epinephrine administration is time 0. Peak change and time of peak change are characterised for each physiologic variable in Table 2. The greatest percent change was noted in central venous pressure, which demonstrated a peak change of 187.3% at 120 seconds after epinephrine administration. Systolic arterial blood pressure demonstrated the second greatest peak change at 57.8% at 53 seconds. Renal near infrared spectroscopy demonstrated a peak change of 9.4% at 72 seconds.
Percent change in heart rate compared to baseline over time.

Percent change in systolic blood pressure compared to baseline over time.
Percent change in mean blood pressure compared to baseline over time.
Percent change in diastolic blood pressure compared to baseline over time.
Percent change in central venous pressure compared to baseline over time.
Percent change in near infrared spectroscopy compared to baseline over time.

Percent change in arterial oxygen saturation compared to baseline over time.
Percent change in respiratory rate compared to baseline over time.

Percent peak change and time at peak change for each physiologic variable after bolus epinephrine administration
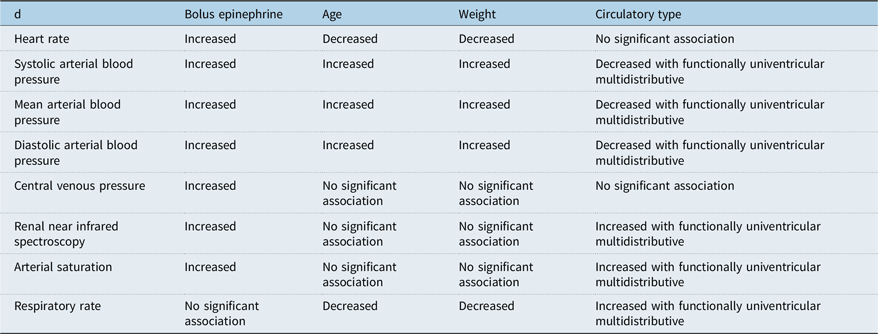
Autoregressive mean integrated average with exogenous variables analyses demonstrated a significant percent increase in all physiologic variables after non-code dose bolus epinephrine, except for respiratory rate, which demonstrated no significant change (Table 3). The effect of age, weight, and circulatory type on the percent change of physiologic variables is also outlined in Table 3. Of note is that functionally univentricular multidistributive circulation tended to be associated with a smaller percent increase in arterial blood pressure, a smaller percent increase in renal near infrared spectroscopy, and a smaller percent increase in respiratory rate.
Results from the autoregressive integrated moving average analyses characterising only significant associations between change in the physiologic variables of interest and the independent variables

Cluster analyses
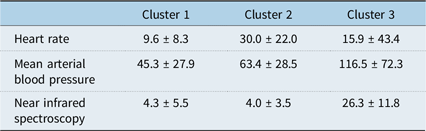
Unsupervised cluster analyses using percent change in heart rate, mean arterial blood pressure, renal near infrared spectroscopy, weight, age, and circulatory type identified three distinct clusters. Model quality was assessed utilising the silhouette score, which was 0.56, identifying strong cluster segregation, indicating that the clusters were statistically significantly different. The percent change in mean arterial blood pressure had the greatest feature importance at 0.29, followed by percent change in renal near infrared spectroscopy with a feature importance of 0.24, and then percent change in heart rate with a feature importance of 0.21. Weight, age, circulatory type, and vasoactive inotrope score all had a feature importance of less than 0.1.
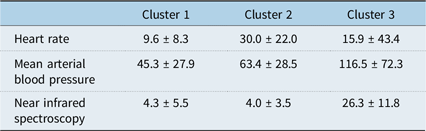
Cluster 1 had a mean age of 11 months and consisted of many patients who had fully septated, biventricular hearts, but also contained some with functionally univentricular multidistributive circulation. Cluster 1 patients demonstrated the lowest percent increase in heart rate and mean arterial blood pressure.
Cluster 2 had a mean age of 147 months and consisted of many patients with ventricular dysfunction. Cluster 2 demonstrated the greatest percent increase in heart rate, the second greatest percent increase in mean arterial blood pressure, and the lowest increase in the renal near infrared spectroscopy.
Cluster 3 had a mean age of 3.5 months and consisted of many patients with functionally univentricular multidistributive circulation and preoperative transposition. Cluster 3 demonstrated the second greatest percent increase in heart rate, the greatest increase in mean arterial blood pressure, and the greatest increase in renal near infrared spectroscopy.
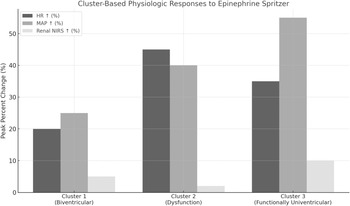
Figure 9 summarises the physiological response across clusters. Table 4 also summarises the physiological response across clusters.
Representative changes across clusters.

Percent change in physiologic variable across clusters
Regression analysis for patients with functionally univentricular multidistributive circulation
Regression analyses were conducted to model peak change in systolic blood pressure and renal near infrared spectroscopy. The regression for peak change in systolic blood pressure demonstrated that the only predictor was baseline arterial blood pressure, with a lower baseline blood pressure being associated with a greater peak increase (beta-coefficient −2.18, p = 0.04). The regression for peak change in renal near infrared spectroscopy demonstrated that the only predictor was weight, with higher weight being associated with lower peak change in renal near infrared spectroscopy (beta-coefficient −3.37, p = 0.04).
Discussion
This study used high-fidelity physiologic data to characterise the effects of non-code dose bolus epinephrine for the first two minutes after administration. To highlight key findings, mean arterial blood pressure increased 52%, heart rate increased 40%, and renal near infrared spectroscopy increased 9% in all patients. Most of these effects peaked in the observed time period. These findings were mediated by epinephrine as demonstrated by ARIMA analyses accounting for age, weight, and circulatory type.
A novel finding of this current study was the distinct physiologic response clusters identified. It should be noted that these cluster findings are simply exploratory, and greater patient numbers in the future would help to confirm these clusters. Cluster 1 consisted mostly of fully septated biventricular circulation, and patients in this cluster demonstrated modest changes in heart rate and mean arterial blood pressure. It appears that this may represent a more stable baseline circulatory physiology. Cluster 2 consisted mostly of those with ventricular dysfunction and demonstrated the lowest increase in near infrared spectroscopy, although there was a marked increase in heart rate and mean arterial blood pressure. This may suggest that in the setting of impaired contractility, epinephrine primarily augments vascular resistance, proportional improvement in stroke volume, and subsequently systemic oxygen delivery. Cluster 3 consisted mostly of functionally univentricular multidistributive circulation and demonstrated the greatest increase in near infrared spectroscopy and a moderate increase in heart rate and mean arterial blood pressure. This seems to highlight the importance of augmenting systemic oxygen delivery by improving contractility in this circulatory physiology. While exploratory, these findings do indicate that these clusters represent significantly different physiologic responses to non-code dose bolus epinephrine.
Findings in patients with functionally univentricular multidistributive circulations were particularly interesting. The autoregressive mean integrated average with exogenous variables demonstrated that those with functionally univentricular hearts tended to have a decreased increase in blood pressure, increased change in renal near infrared spectroscopy, and increased change in arterial saturation. Cluster analyses demonstrated a distinct cluster of primarily functionally univentricular multidistributive circulation patients (although it did not contain all these patients). The children in this cluster had greater increases in heart rate, blood pressure, and near infrared spectroscopy, which means there were some apparent discrepancies in findings between the autoregressive mean integrated average with exogenous variables and cluster analyses. Because of this disagreement, an additional regression analysis was conducted only for patients with functionally univentricular multidistributive circulation. To reconcile these findings, it is important to highlight that the autoregressive mean integrated average with exogenous variables model demonstrates a blunted response in arterial blood pressure in those with functionally univentricular multidistributive circulation, but the clusters demonstrate that, while this is a trend, there are some patients who have a greater response. The subsequent regression of just these particular patients helped identify which patients demonstrated a greater response. Given these data, these different analyses are all complementary.
The findings of this study indicate that non-code-dose bolus epinephrine is associated with improved hemodynamic state. The increase in near infrared spectroscopy indicates improvement in systemic oxygen delivery as observed by an increase in the renal near infrared spectroscopy values. Reference Law, Benscoter and Borasino7–Reference Loomba, Rausa and Sheikholeslami9 This improvement is likely due to an increase in cardiac output, which then yields an increase in oxygen content and delivery in paediatric patients. Reference Loomba10,Reference Loomba and Flores11 The increase in blood pressure is also, in part, mediated by such an increase in cardiac output, although the degree to which it is augmented by flow and resistance is not easily discernible by these data. The mechanism of action of epinephrine is well demonstrated and consists of both alpha- and beta-receptor agonism. The relative proportion of alpha- and beta-agonism appears to be dose-dependent. At the 1 mcg/kg dosing utilised in the current study, epinephrine should have both alpha- and beta-agonism, with beta-agonism expected to be slightly more predominant. Beta-1 agonism at this dose would lead to increased heart rate, contractility, and atrioventricular nodal conduction, while beta-2 agonism at this dose would lead to skeletal muscle vasodilation and some bronchodilation. Reference Nachar, Booth and Friedlich12
The magnitude of change in heart rate and blood pressure noted in this study is similar to findings from previous investigations. Two previous studies used a 5-minute window before and after to observe for effects. Given the sheer amount of data collected for each event, along with the enhanced temporal resolution of the data, the quick effect of non-code dose bolus epinephrine, and the clinical aims for the use of non-code dose bolus epinephrine, it was felt that a 2-minute before-and-after window was reasonable in this study. In comparison to this study, Ross and colleagues demonstrated a 22% increase in mean arterial blood pressure and 5% increase in heart rate at the 5-minute mark. The current study differs from Ross and colleagues as it offers data on additional physiologic variables, such as near infrared spectroscopy. Additionally, although Ross and colleagues sourced data from the Etiometry platform, which generally collects data at 5-second intervals, they utilised simple paired t-tests to compare pre- and post-data using arbitrary time cut-offs. This ignores a bulk of the individual data captured in this fashion, which can provide insight. Thus, the current study is novel in the sense that it utilises advanced statistical methods to include the raw second-to-second data for multiple physiologic parameters. Additionally, the study by Ross and colleagues defined responders and non-responders based on user-selected definitions, while the current study was able to identify naturally occurring clusters statistically. Reference Ross, Asaro, Wypij, Holland, Donnino and Kleinman13,Reference Sorcher, Mehta, Grossestreuer, Kleinman and Ross14 A separate study by Reiter and colleagues with variable dosing demonstrated that there was a markedly lower magnitude of effect with epinephrine doses of under 1 mcg/kg. Reference Reiter, Roth, Wathen, LaVelle and Ridall15
Use of non-code dose bolus epinephrine has been endorsed by many paediatric intensivists, with an overwhelming majority saying they already use or would consider using it. Ross and colleagues conducted a survey of 63 intensivists across 35 institutions, with 94% of those surveyed responding that they would consider using non-code dose bolus epinephrine in deteriorating patients not requiring cardiopulmonary resuscitation. The 6% of those who responded to the survey said that they would not use non-code dose bolus epinephrine, citing a lack of evidence or unfamiliarity as their reasons for not considering its use. Amongst those surveyed who were already utilising non-code dose epinephrine, there was a reported large variation in dosing and vernacular. The reported doses were quite variable, ranging from 0.1 mcg/kg to 10 mcg/kg with the most common dose being 1 mcg/kg among 68% of those who responded. Reference Ross, Hayes, Kleinman, Donnino and Sullivan5 The general endorsement and adoption of non-code dose bolus epinephrine are reflected as a recommendation in the scientific statement regarding cardiopulmonary resuscitation in infants and children with cardiac disease, stating that it is reasonable to utilise such doses in the peri-arrest patient. Reference Marino, Tabbutt and MacLaren6
The present study adds to the limited data available regarding the effects of non-code dose bolus epinephrine in paediatric patients. The data are sourced in high fidelity, allowing for highly powered statistical analyses able to detect even small but significant effects. The exclusion criteria utilised also provide a setting in which the effects can be more or less isolated as a result of the non-code dose bolus epinephrine. While this study has its strengths, it also has its limitations. This is a single-centre study. Due to local practice, we were unable to identify the effect of dose, as a uniform dose is universally utilised, but the uniformity of dosing also serves as a strength. Additionally, this study only looked at the effect in those who did not experience a cardiac arrest within 2 minutes of the administered dose. It is plausible that those who do experience cardiac arrest in this time period may have a different response to non-code dose bolus epinephrine. Despite its limitations, this study provides novel insight into the effects of non-code dose bolus epinephrine, especially illustrating differences in response in patients with functionally univentricular multidistributive circulation.
Conclusion
Non-code dose bolus epinephrine is associated with a significant increase in heart rate, blood pressure, and systemic oxygen delivery. Peak change in each was 40%, 52%, and 9%, respectively, with peaks occurring between 60 seconds and 120 seconds after administration. Cluster analysis using the peak change identified distinct clinical clusters.


 Open access

