

Introduction
Party polarization in Congress continues to trend upward (Lee Reference Lee2016; Mann and Ornstein Reference Mann and Ornstein2016; Poole and Rosenthal Reference Poole and Rosenthal2007; Theriault Reference Theriault2008). To many, the increased party homogeneity and intense ideological fervor marking our contemporary era highlight a deepening political pathology where attributes of past lawmaking sessions such as bipartisanship, negotiation, and statesmanship are now cast aside in a ceaseless effort to exploit institutional norms for partisan gain. With few signs of easing, some lament these brinkmanship governing strategies have not only stalled the legislative process but exacerbated the ability of Democrats and Republicans to compromise across most subjects.
In an effort to better understand this (d)evolution, scholars have analyzed an extensive list of factors including, demographic and electoral transformations (Abramowitz et al. Reference Abramowitz, Alexander and Gunning2006; Hetherington Reference Hetherington2001; Levendusky Reference Levendusky2009), institutional changes within Congress (Rohde Reference Rohde1991; Theriault Reference Theriault2008), social and political distrust (Hetherington and Rudolph Reference Hetherington and Rudolph2015; Mason Reference Mason2018), group loyalty (Barber and Pope Reference Barber and Pope2019), and even empathy (Simas et al. Reference Simas, Clifford and Kirkland2020). Though this scholarship provides valuable insight to help explain the rise in polarization, absent are explanatory factors conventional wisdom would assume cause conflict: disagreements over how to define a fair and just society and whether government can or should meet these ideals. The literature tends to overlook, in short, how substantive disagreements over the government’s role in creating equality are an important motivating factor dividing the parties.
Perhaps no issue better captures this rift and has driven as strong a wedge between the parties as noncontributory welfare. From Temporary Assistance for Needy Families (TANF) to Medicaid and Section-8 housing to food stamps, disagreements over what constitutes a fair society and the subsequent efforts to alleviate poverty highlights a core philosophical divergence in how each side expects government to solve inequality. Most people, at least reasonable individuals, agree equality is important. However, competing conceptions over what constitutes the ideal egalitarian existence underlies not only who citizens elect to office, but how they expect elected officials to act. For instance, often skeptical about attempts to legislate equitable outcomes by redistributing public funds (Epstein Reference Epstein2017; Friedman Reference Friedman2002; Hayek Reference Hayek2007), conservatives support a smaller welfare state where issues related to poverty and class are solved by the free market. In contrast, Democrats often support the government’s authority to level the playing field for the disadvantaged through an expanded welfare state (Cohen Reference Cohen2009; Croly Reference Croly2014; Sandel Reference Sandel1998).
In an effort to better depict this conceptualization and demonstrate the link between welfare policy and party polarization, I analyze this relationship through federal spending on noncontributory welfare programs. Using Clinton et al.’s (Reference Clinton, Jackman and Rivers2004) IDEAL procedure, I recover annual ideal point estimates and calculate polarization scores in the House and Senate between 1947 and 2018 that are comparable with annual spending data. Moreover, because polarization scores in longitudinal applications exhibit trending properties and are often mis-specified in standard regression models, I use vector error correction models (VECMs) for multivariate time series which supply robust short- and long-run estimates (Engle and Granger Reference Engle and Granger1987). Results are suggestive that ideological differences over welfare spending have a significant positive effect on polarization in Congress. This finding not only holds when compared to outlays in other policy areas, but also when controlling for income inequality. Though only one of many explanations to understand the multifaceted phenomenon of party polarization in Congress, the contribution of this study is it shifts attention to policy as a source of partisan conflict.
Existing explanations on party polarization in Congress
Since the first studies analyzing the rise in party polarization in Congress, scholars have focused much of their attention on various exogenous factors to help explain this growing divide. The most common narrative found in the literature centers on how a more partisan electorate has intensified differences between the parties. With voters segregating into homogenous political communities (Bishop Reference Bishop2008; Mason Reference Mason2018; Stonecash et al. Reference Stonecash, Brewer and Mariani2018; Theriault Reference Theriault2008), they now elect likeminded politicians who reflect their core values. As a consequence, with an increasing number of safe congressional districts, this results in a higher demand for partisan bickering (Harbridge and Malhotra Reference Harbridge and Malhotra2011) where policy stances drive affective polarization by signaling partisan identity (Dias and Lelkes Reference Dias and Lelkes2022), and disdain for the opposition is worn as a badge of honor (Mason Reference Mason2018). To meet these changing electoral characteristics, candidates not only seek to develop more partisan presentation styles to help build a political brand and better resemble their constituents (Grimmer Reference Grimmer2013), but also they strive to create a closer ideological fit with their districts (Bernhard and Sulkin Reference Bernhard and Sulkin2018).
Scholars have also advanced other factors to describe the rise in polarization in Congress including, for example, party activists (Layman et al. Reference Layman, Carsey, Green, Herrera and Cooperman2010), interest groups (Crosson et al. Reference Crosson, Furnas and Lorenz2020), and economic conditions (Garand Reference Garand2010; McCarty et al. Reference McCarty, Poole and Rosenthal2016). However, these determinants suggest such causes, while important, may only have a tangential effect given the primary concern influencing lawmakers are constituent interests. As single-minded seekers of reelection, the electoral connection shapes legislator preferences and partisanship. Despite evidence suggesting intraparty polarization exists (Groenendylk et al. Reference Groenendylk, Sances and Zhirkov2020), evidence shows party polarization is best understood as a function of the electorate sorting along partisan lines (Abramowitz et al. Reference Abramowitz, Alexander and Gunning2006; Hetherington Reference Hetherington2001; Levendusky Reference Levendusky2009).
Research highlighting the costs of electoral change lends further support to this theoretical perspective. For instance, where scholars find those elected to Congress in recent decades are more partisan than their predecessors (Thomsen Reference Thomsen2014), others find entire cohorts of freshmen lawmakers contribute to increases in partisanship (Theriault Reference Theriault2013) where members now hold stronger ideological views than even the voters they represent (Bafumi and Herron Reference Bafumi and Herron2010). This change has not only resulted in the election of party leaders who are more extreme than the average member (Heberlig et al. Reference Heberlig, Hetherington and Larson2006), but they are now concerned with protecting and differentiating their party rather than passing legislation (Gelman Reference Gelman2020; Lee Reference Lee2016). In all, compromise and bargaining, once considered a necessary virtue for successful lawmaking in a separation-of-powers system, have given way to an environment where partisans use Congress as a resource to exploit for political gain.
Although the above research provides a useful framework to evaluate the link between polarization and electoral demographics, this paper introduces an alternative account of party polarization that centers on noncontributory welfare spending. Compared to other approaches, the conceptual underpinnings of this paper rest on the assumption that substantive partisan conflict is centered on fundamental philosophical differences over how to define the meaning, purpose, and role of government in its relationship with citizens. Theories which describe the rise in polarization in recent decades, while sufficient and even noteworthy, overlook the possibility the narratives they advance depict a deeper and more significant ideological divide. This is not to suggest these theories lack substantive explanatory value, but that these arguments present a single perspective to explain the recent rise in party polarization. Explanations such as race, ideological sorting of the electorate, regional shifts in partisan support, and others, have their place in this narrative. Attitude toward welfare and its recipients, in contrast, is an alternative approach to describe what many now view as the single most challenging social and political issue of the modern era.
Egalitarianism, welfare, and party polarization
My main argument is much of the partisan conflict found in contemporary politics centers on disagreements over egalitarian ends and the necessary means to achieve these ends. Unlike much of the literature which contends the recent rise in partisanship is evident through the lens of electoral action and reaction, I argue such explanations are not the primary cause driving this change. Rather, polarization is symptomatic of how elites perceive and define a fair or just society and the role government is expected to take to both reinforce and support these views. Though some research follows a similar perspective and suggests factors such as rent seeking (Wood and Jorden Reference Wood and Jordan2017) or humanitarianism (Feldman and Steenbergen Reference Feldman and Steenbergen2001) can explain these changes, egalitarianism furnishes a logical assessment since beliefs about equality, fairness, and justice, both for elites and the public, are shaped by views about society and the political system individuals occupy.
While a complete overview of egalitarianism and its alternative perspectives is not presented here, my goal is to describe one possible viewpoint on why the parties have separated in recent decades. The following synopsis gives a basic theoretical summary on core disagreements regarding poverty, its causes, and arguments to alleviate these issues. This discussion, moreover, is targeted toward disagreements about noncontributory assistance and deservingness and not on programs with broad universal consensus regarding equality such as education, public works, and disability insurance, and so forth.
The three common claims about equality which tend to divide partisans are: (1) all persons have equal moral and legal standing; (2) it is unjust to treat someone as unequal based on irrelevant traits; and (3) when outcomes are unequal in some way, it is just to lessen inequality. While 1 and 2 are related, the focus in this paper centers on 2 and 3. Both parties have, most would accept, competing impressions over what constitutes a proper political system, and this difference can, but not always, focus on these two views: equality of opportunity which is supported by constitutional arrangements (all are equal at a starting point) and sameness of opportunity enforced by law to reverse inequalities the former fails to address (equality of condition). Again, this view does not ignore that inequality may be the result of structural or systemic causes, where poverty is not caused by randomness or misfortune, but because of barriers to opportunities (Kluegel and Smith Reference Kluegel and Smith1986). Rather, the egalitarianism described below is a philosophical perspective about how this topic can be used to explain one reason why the parties have separated in recent decades.
Consider traditional arguments (first principles) separating both understandings on the role of government in society. In a broad sense, those who endorse equality of opportunity view people as equal beings with fundamental rights to life, liberty, and property others should respect (Locke Reference Locke1980). Individuals, despite any intellectual, physical, emotional, economic, and familial (dis)advantages at their start in life, should have an equal opportunity to maximize their natural potential. Barriers which limit talents, desires, needs, opinions, and achievement, limit rights. Efforts to regulate markets and industry (Hayek Reference Hayek2007; Stigler Reference Stigler1971) or redistribute income (Hayek Reference Hayek1960) violate individual rights and often ignore the reality that positive law is not always Pareto efficient.
In contrast, those sympathetic to equality of condition as a desirable social end question the view markets produce fair and just outcomes. The notion that societal shortcomings are best solved through the free market is illusory since fair outcomes are often unachievable when luck or institutional constraints impact success (Rawls Reference Rawls1999). To assume capitalism results in fair outcomes ignores the fact it can accentuate disparities. For example, not only are markets unfair because economic interactions occur under inequitable conditions (Sandel Reference Sandel2013), but they can also lead to asymmetric exchanges where those with economic advantages dominate the poor (Cohen Reference Cohen2009). The only solution to correct or reverse such disparities and level the playing field for the disadvantaged is through strategies such as social and income redistribution (Walzer Reference Walzer1983; Piketty Reference Piketty2014).
Since the American founding, discussions over how to address poverty have centered on classifying the indigent into two categories to justify or deny assistance based on the perceived legitimacy of each claim: the deserving and undeserving poor. Footnote 1 Research shows despite a tradition of philanthropic behavior (Bremner Reference Bremner1988), citizens hold misgivings toward the latter (Gilens Reference Gilens1999; Katz Reference Katz2013; McClosky and Zaller Reference McClosky and Zaller1984) where most view the deserving poor (the aged, orphans, widows, and disabled) have a valid claim for assistance. For instance, where some find differences in opinion about the poor center on principled views of equality (Sniderman and Carmines Reference Sniderman and Carmines1997; Sniderman et al. Reference Sniderman, Carmines, Layman and Carter1996), others find the public holds negative views toward welfare when compared to non-welfare programs (Jacoby Reference Jacoby1994). This opposition seems to center on political views about the role of government, not race (Schneider and Jacoby Reference Schneider and Jacoby2005), as well as the visibility of the delivery mechanism (Ellis and Faricy Reference Ellis and Faricy2020). Furthermore, studies on individual opinion show the affluent (Suhay et al. Reference Suhay, Klasnja and Rivero2021) and educated (Federico Reference Federico2004) also hold negative attitudes toward welfare, where support is often transitory depending on circumstance or need (Margalit Reference Margalit2013). Overall, enough research exists to support the premise that society has competing views over how to view poverty and who should receive assistance. My focus, however, centers on how this understanding provides a useful avenue to explain the dichotomous view on egalitarianism advanced in this paper.
To begin, efforts to assist the impoverished and how these policies exacerbate party polarization should be understood as a recent development. Where contemporary discourse on partisan attitudes toward the poor is sometimes described as a dispute over competing views on government and policy (Grossman and Hopkins Reference Grossman and Hopkins2016), responsibility (Brewer and Stonecash Reference Brewer and Stonecash2015), race (Chudy Reference Chudy2021; Goren Reference Goren2003), class (Lax et al. Reference Lax, Phillips and Zelizer2019), and the economy (Jones Reference Jones2020), it is important to note attitudes toward the poor have altered across time. Support for equality of opportunity versus outcome, in other words, should not be viewed as fixed for either party or society, but views which shift across time. For instance, Democrat support for a strong welfare state is not a position they always adopted, but one, I argue, they have become more receptive to in order to combat Republicans resistance toward welfare.
Before continuing, I first illustrate the concomitant link between noncontributory, means-tested welfare spending, and party polarization in Congress. Compared to other potential welfare metrics such as enrollment data, welfare outlays lend theoretical, methodological, and practical benefits that afford a straightforward test of this argument. Welfare spending is a logical proxy to discern the differing egalitarian perspectives argued in this study. Footnote 2 Moreover, these data are a common statistic used in the literature (Jacoby Reference Jacoby2000; Schneider and Jacoby Reference Schneider and Jacoby2005; Wlezien Reference Wlezien1995) and are amenable to longitudinal analysis. When adjusted for inflation, spending is comparable across vast distances in time. To illustrate, Fig. 1 presents annual outlays for noncontributory welfare policy and polarization scores for both chambers between 1947 and 2018. Besides providing a visual representation, the graph lists notable legislative expansions and contractions in welfare (vertical dashed lines), as well as periods when Democrats controlled the White House (gray shading).
The rise of party polarization and noncontributory welfare spending, 1947–2018. Note: Outlays presented in $ billions.
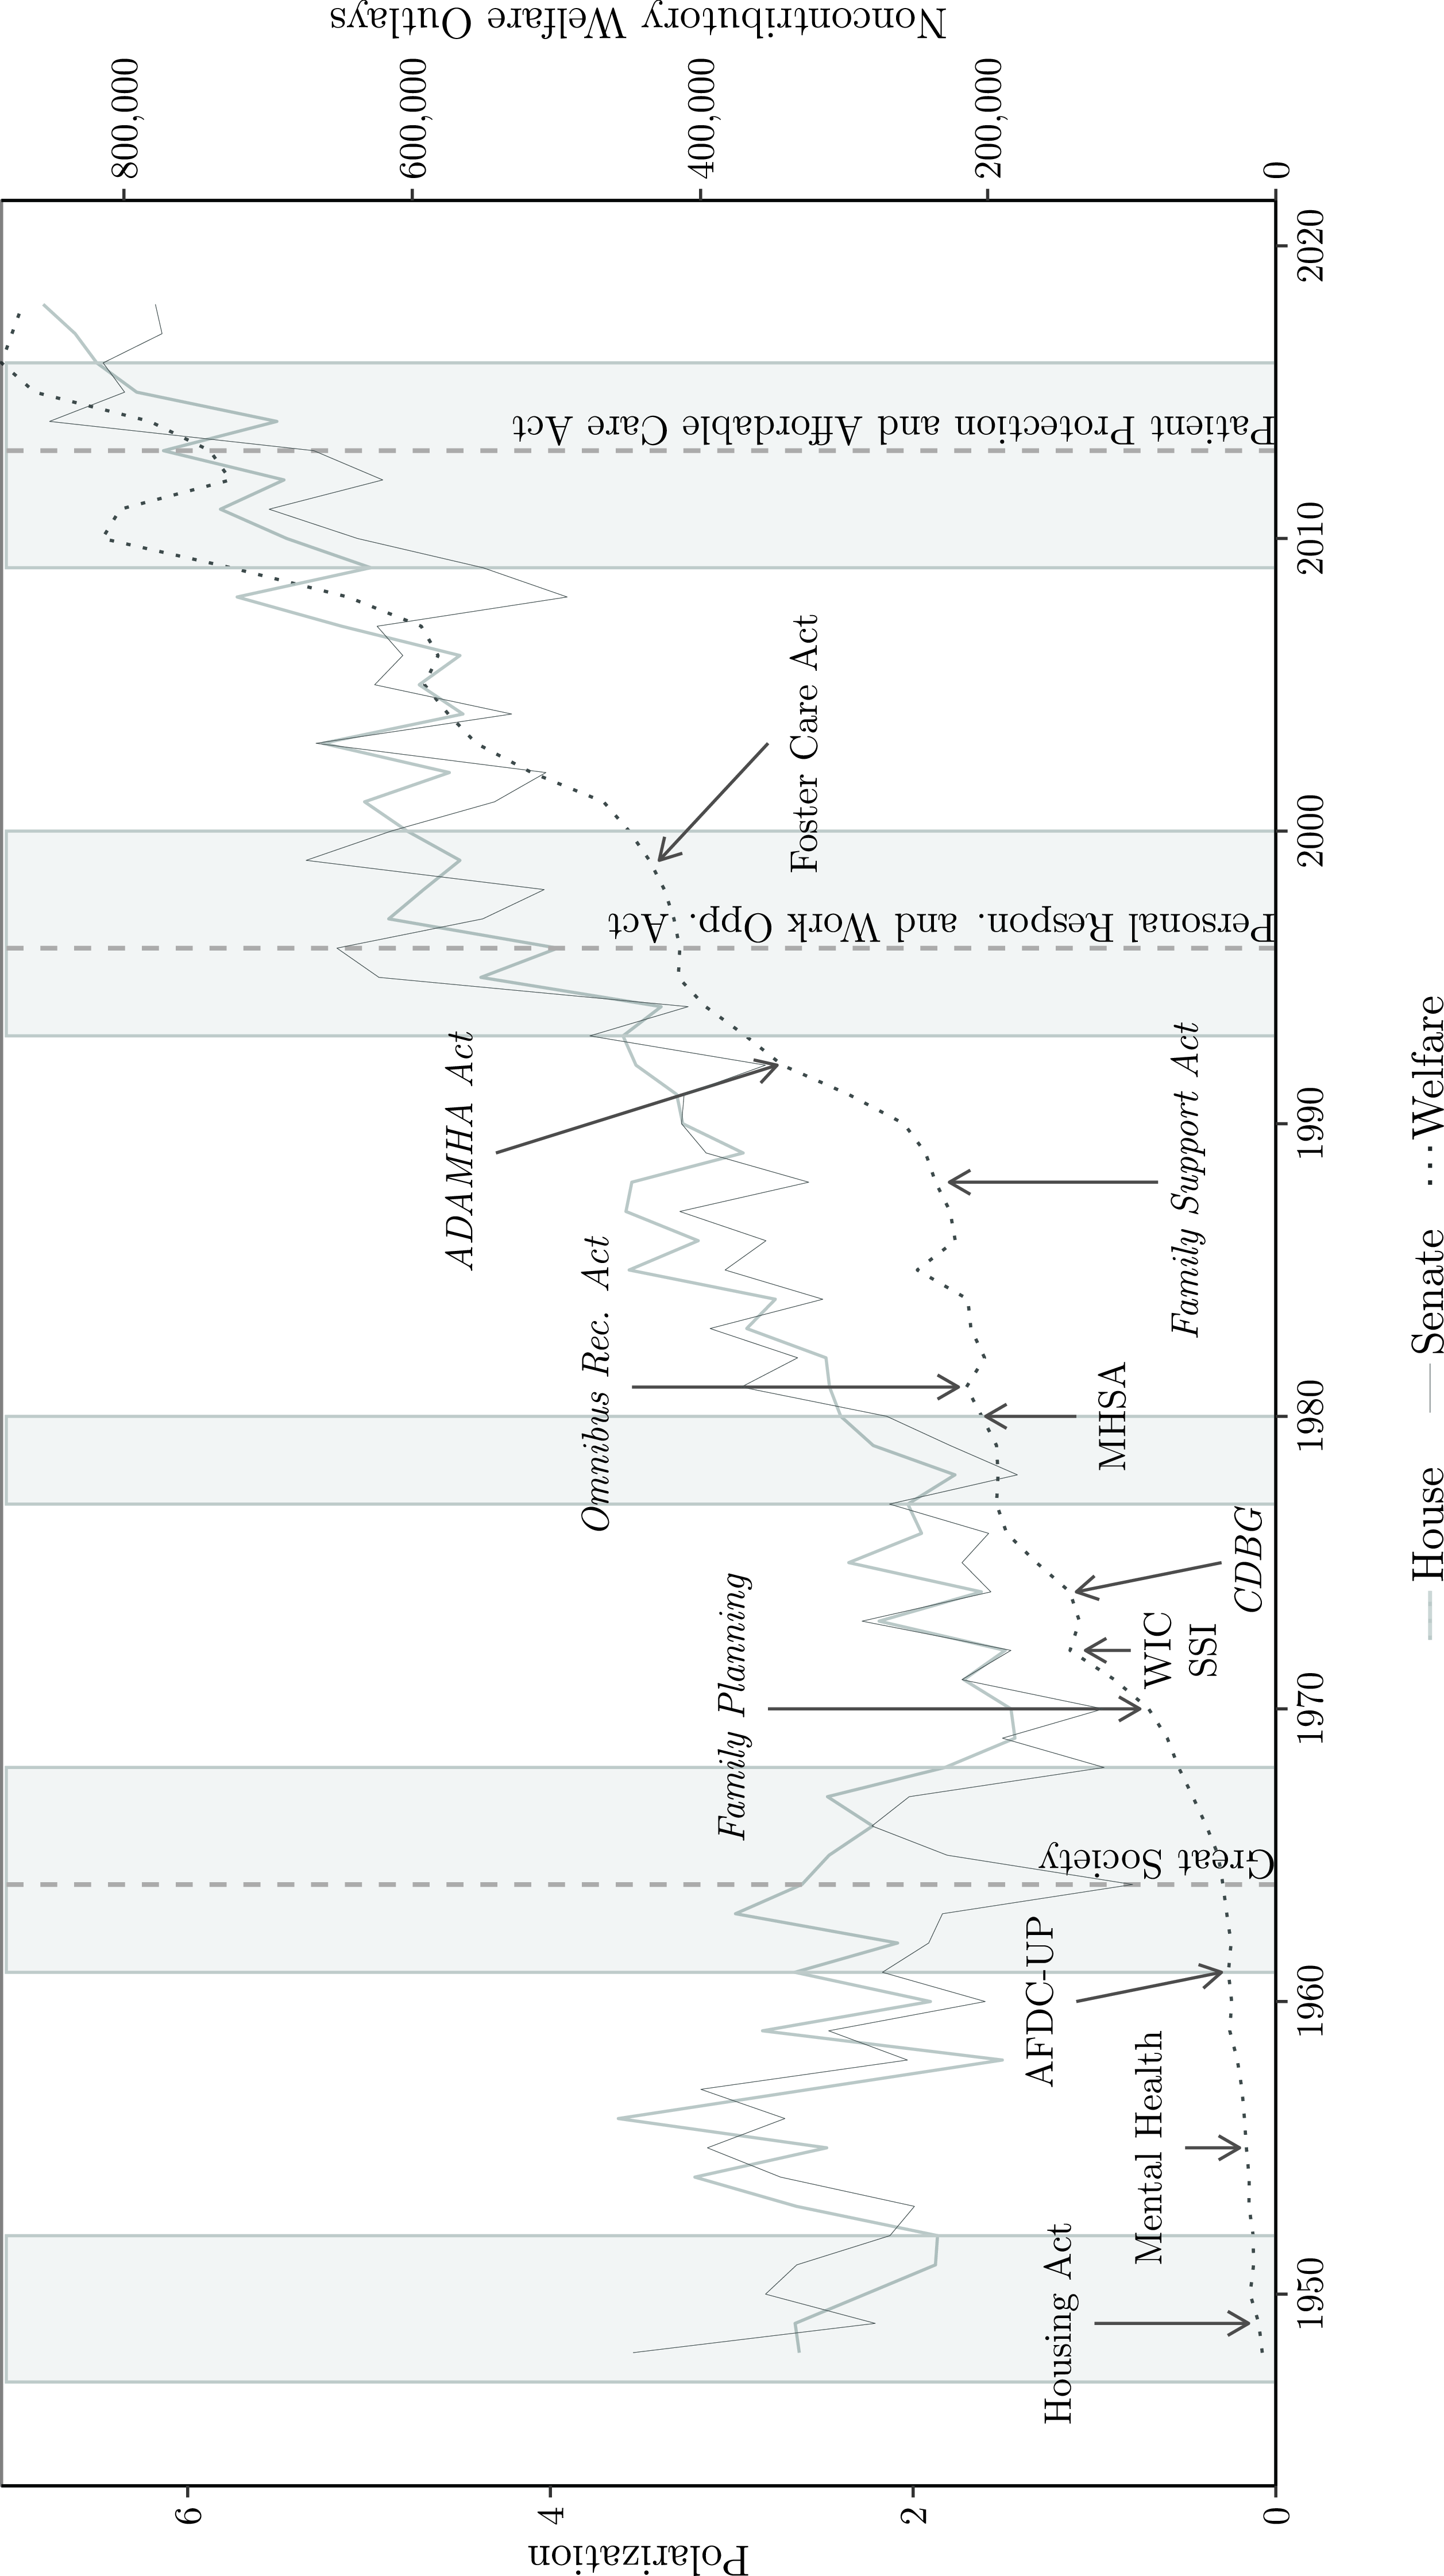
Findings show a clear distinction in how both parties approach welfare and poverty. For instance, in an effort to correct for inequalities resulting from market downturns, many sizable advances in public assistance occur during Democrat Administrations. Laws designed to address economic imbalances include expanding welfare benefits (AFDC-UP), food stamps (SNAP), Medicaid, early child development (Head Start), housing assistance (Housing and Urban Development), as well as extending healthcare to the uninsured under the Affordable Care Act. Outside of the Personal Responsibility and Work Opportunity Reconciliation Act of 1996, which reduced government oversight and instituted restrictions to welfare, these findings reinforce the notion Democrats tend to support policies designed to correct unjust outcomes.
Conservative presidents, despite instances when legislation expanded benefits (Women, Infant, and Children Nutrition Program (WIC) and Supplemental Security Income (SSI)), often support efforts to redirect assistance from government toward alternative delivery mechanisms. Examples include (italics) efforts to reduce reliance on government dependence by promoting job preparation and work (TANF)), building and maintaining family support networks (Family Support Act), devolving welfare responsibility from the federal to state government (Community Development Block Grant of 1974), or in some cases, even reducing federal outlays (Omnibus Reconciliation Act of 1981). Overall, though only a snapshot, the relationship between welfare spending and the rise in polarization seems to center on competing philosophical views on how both sides conceptualize social assistance.
As the graph illustrates, noncontributory welfare spending has expanded in three distinct phases: modest growth from its beginnings through the 1960s; a period of spending increases, sometimes slowed during Republican control of government; and large expansions in response to the Great Recession of 2008. Though each phase experienced dips in spending, these patterns give additional insight to the parallel rise in party polarization and the argument presented here. For instance, during the first phase, partisan differences toward welfare were muted. Bipartisan coalitions often supported such programs since most viewed these benefits as a bureaucratic necessity (Kluegel and Smith Reference Kluegel and Smith1986). Governed by intraparty factions, sometimes with liberal northern Republicans and conservative southern Democrats crossing party lines, party leaders needed bipartisan governing coalitions to enact legislation. It is important to note that during this period, the issues which began to divide the parties in the 1980s were less pronounced. Debates over noncontributory welfare had yet to reach contemporary levels since spending levels were still low—lower noncontributory spending correlated with lower polarization. More pertinent to this study, equality of opportunity was a shared value and bipartisan policy goal.
During the next phase, however, a new political order dedicated to neoliberal policies and smaller government (Gerstle Reference Gerstle2022) coincided with shifts in regional partisan attachments. As a consequence, not only did these bipartisan coalitions begin to collapse (Hetherington Reference Hetherington2001; McCarty et al. Reference McCarty, Poole and Rosenthal2016; Stonecash et al. Reference Stonecash, Brewer and Mariani2018; Theriault Reference Theriault2008) but also partisan attitudes toward the undeserving poor shifted as Republicans became more sorted on this issue (Levendusky Reference Levendusky2009). But the most obvious change occurred in the 21st century as Democrats, motivated by the rising plight of the needy following the financial crisis of 2008, moved further left in their support for equal conditions. No longer asymmetrical, both sides hardened their stances against opposition policy prescriptions (Webster and Abramowitz Reference Webster and Abramowitz2017; Wood and Jorden Reference Wood and Jordan2017). Republicans, while adding a populist fervor to their neoliberal view about the enormous size of the welfare state, met their match in a newer, more progressive generation of Democrats who were as fervent in their quest to expand welfare and equalize the playing field for those ill-treated by the failing Neoliberal Order (Gerstle Reference Gerstle2022). In short, while Democratic pessimism about the fairness of capitalism increased, they became more forgiving of those on the lower end of the income scale as deserving of public assistance. Republicans, more optimistic about markets, were less so (Suhay et al. Reference Suhay, Tenenbaum and Bartola2022).
Borrowing from Levendusky (Reference Levendusky2009), the casual chain linking the expanding welfare state with the rise in party polarization in Congress is explained as a progression which begins with Republican resistance to the expanding welfare state. Following the narrative presented above, this sequence begins during the 1980s. (1) As Republicans polarized and adopted positions opposing the expanding welfare state, (2) Democrats became more supportive of equality of condition as a reaction to worsening market outcomes and threats by Republicans (3) then, on the campaign trail, both sides further articulated their views to supporters and constituents who first accept this clarification, and (4) become more responsive and sorted to these diverging positions. As a consequence, this created a positive feedback loop where these attitudes became reinforced in each subsequent election, magnifying polarization as new, more extreme, members were elected to Congress.
Building on this point, because this process is initiated by Republican resistance toward noncontributory welfare (step 1) (Brewer and Stonecash Reference Brewer and Stonecash2015; Levendusky Reference Levendusky2009), Democrats use equality of condition (step 2) as a practical approach to defend welfare from conservative attack. Competing views over unfair gains for the disadvantaged versus assistance for those ill-served by harsh economic conditions are intensified through this sequence—the latter a reaction to the former. Moreover, efforts to counter symbolic conservatism and the Republican push to shift welfare to the right (steps 3 and 4), amplifies this diverging egalitarianism. Party polarization, in other words, is worsened as welfare spending increases which, in turn, restarts the sequence with the next appropriations cycle.
Expanding this theory, consider that before the 1980s, both sides cooperated and viewed public assistance as programs which provided universal opportunity (Kluegel and Smith Reference Kluegel and Smith1986). During the annual appropriations cycle, both parties cooperated and passed spending bills with little conflict. However, as welfare spending increased in time, Republicans hardened their stance, forcing Democrats to adopt a competing egalitarian perspective. Placed at an inherent disadvantage given the negative attitudes toward welfare (Jacoby Reference Jacoby1994; Schneider and Jacoby Reference Schneider and Jacoby2005; Sniderman and Carmines Reference Sniderman and Carmines1997), as well as poor economic conditions requiring the need for additional, not diminished assistance (Gerstle Reference Gerstle2022), equality of outcome became a strategic policy position to protect these programs. Following this sequence, expectations are as outlays on nondiscretionary welfare increase, this will lead to a concomitant rise in party polarization in Congress. Moreover, because attacks toward welfare are initiated by the right, Republicans will contribute more to polarization than Democrats.
Further demonstrating how welfare spending increases polarization in Congress, I also introduce additional tests and analyze whether differences which define egalitarian principles toward noncontributory welfare translate to other spending categories such as defense, education, basic government operations, and contributory welfare programs. Because scholarship has shown public attitudes are less partisan on non-welfare policy (Dias and Lelkes Reference Dias and Lelkes2022), expectations are that outlays on policy where egalitarian ideals are muted should have a lower likelihood of exerting a negative effect on partisanship. The literature supports this understanding. For example, where research shows public preferences on spending for national security, energy, and transportation are less divisive (Jacoby Reference Jacoby2000; Wlezien Reference Wlezien1995), others demonstrate similar patterns for lawmakers and find voting is complex and multidimensional on nonideological policies (Jochim and Jones Reference Jochim and Jones2013). In short, where the previous hypothesis contends welfare will have a positive effect on polarization, the second states spending on non-welfare related categories will have a weaker short- and long-run impact on party polarization.
Data
The main datasets used to test the two hypotheses are annual statistics on federal outlays and annual roll call data for both chambers between 1947 and 2018. Supplemental Appendix A lists all descriptive statistics.
Federal Spending: All federal spending statistics are collected from White House historical Tables 3.1, 3.2, and 11.3, published by the Office of Management and Budget. This dataset lists discretionary and nondiscretionary spending and separates outlays under broad function and subfunction headings by department, program, and individual transfer payments. All spending data are adjusted for inflation using the Producer Price Index (PPI). Footnote 3 To help test the second hypothesis, spending is classified under five broad rubrics: noncontributory welfare, defense, general government, earmarks, and political spending. Table 1 lists programs classified under each category. As argued above, noncontributory welfare spending comprises all programs where recipients pass a means test to determine eligibility. Spending listed under the Defense and General Government headings, in contrast, pertain to funding for departments and programs viewed as necessary for the maintenance and operation of the government. Earmark spending, however, combines budgetary categories that tend to receive the largest number of earmarks outside of defense. Expectations are these latter three categories should exert a minimal effect on polarization. The final classification, outlays listed as political, is a collection of spending categories to both parties often dedicate significant attention outside of welfare. Though not listed in this table, I also test nondiscretionary, contributory welfare outlays which comprise programs such as Social Security, Medicare, unemployment, and federal retirement spending—social programs that tend to receive wide universal public support.
Federal outlays by spending category
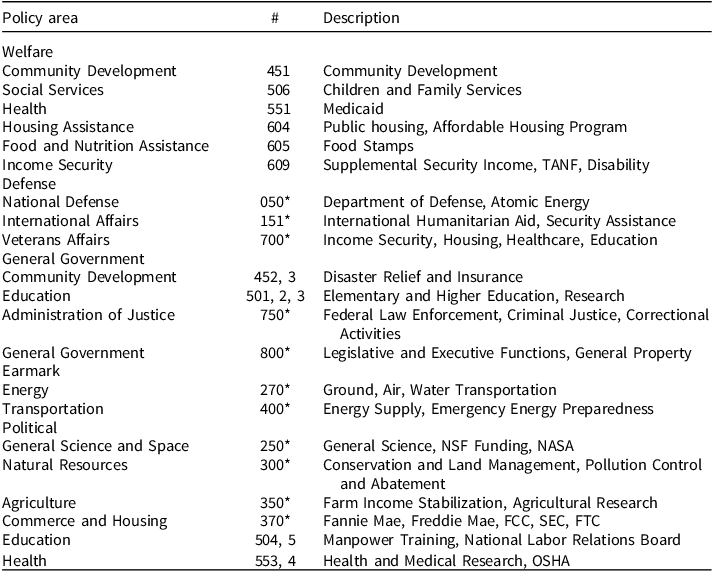
Note: # = OMB function and subfunction labels.
* = Denotes entire function category.
Polarization: To estimate the effect of annual spending on party polarization, fixed ideal point estimation strategies such as DW-Nominate (Poole and Rosenthal Reference Poole and Rosenthal2007) are unsuitable in this application since such scores represent latent preferences across every roll call and are not comparable with annual data. In fixed ideal point approaches, all roll calls are estimated together where each legislator receives a single score for every legislative term they serve. One advantage is that fixed scores are stable across time. Despite this benefit, however, a fixed approach can never discern if individual preferences change between congressional terms as some suggest (Brewer et al. Reference Brewer, Mariani and Stonecash2018; Levendusky Reference Levendusky2009). More importantly, for the purposes of this study, a fixed method cannot generate annual polarization scores. This estimating strategy assumes, in other words, each member has identical latent preferences not only on policy such as defense and welfare, but also that these preferences are fixed from the beginning to the end of their career.
In order to compensate for these shortcomings, I use a floating estimation procedure and recover annual ideal points for both chambers using the Bayesian IDEAL estimator developed by Clinton et al. (Reference Clinton, Jackman and Rivers2004). Footnote 4 This approach provides two benefits. First, a floating ideal point approach gives the user the flexibility to recover scores across any set period. The ability to capture changing preferences in more refined detail is also advantageous since the theoretical impetus for this study centers on the changing egalitarian attitudes of elites which, as some show, evolved from broad bipartisan consensus, and became more partisan when conservatives began to oppose welfare spending, and then further separated as both sides cemented their egalitarian views (Gerstle Reference Gerstle2022). Second, a floating procedure is also suitable in this application since the unit of analysis is annual times series data. Because a fixed method only allows the recovery of biennial ideal points, I lose the ability to capture any possible variability in legislator preferences at the annual level. Moreover, this method also serves a practical purpose since all datasets now align on this same unit of analysis.
Party polarization is calculated using the measure introduced by Jessee and Theriault (Reference Jessee and Theriault2012):
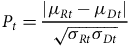 $${P_t} = {{\left| {{\mu _R}_t - {\mu _D}_t} \right|} \over {\sqrt {{\sigma _R}_t{\sigma _D}_t} }}$$
where $\mu $
denotes each party’s median ideology score and
$\mu $
denotes each party’s median ideology score and $\sigma $
is the standard deviation for each party at year
$\sigma $
is the standard deviation for each party at year $t$
.
$t$
.
Method
This study introduces a unique methodological approach to estimate the short- and long-term effect of spending on polarization, and differs from most other analyses. Where polarization scholars understand and test partisan change over long periods of time, few studies incorporate actual time series methods. This is surprising since all polarization scores exhibit persistent long-term movement which can raise serious issues when modeling stochastic processes. For instance, one assumption in linear regression requires variables to be covariance stationary. However, if one or more variables exhibit nonstationary properties where the mean and covariance change over time, this can produce misleading statistical findings (Granger and Newbold Reference Granger and Newbold1974).
Because party polarization and most federal outlays exhibit nonstationary properties, to estimate the effect of spending on polarization I use a VECM (Engle and Granger Reference Engle and Granger1987) which provides robust statistical estimates for trending data when a linear combination of two or more nonstationary series are stationary even though each series exhibits nonstationary properties in isolation. That is, when two or more series cointegrate, the data follows a common long-run path or equilibrium. Estimating this data with standard linear regression or vector autoregressive models would only capture short-run effects, underestimating any long-run equilibrium found in cointegrated data. VECMs are a suitable estimation technique to capture both.
For a formal representation, polarization in the House and Senate is labeled as ${H_t}$
and
${H_t}$
and ${S_t}$
, and each spending indicator is denoted as
${S_t}$
, and each spending indicator is denoted as ${Y_t}$
, at some year
${Y_t}$
, at some year $t$
. Organizing the terms in matrix notation
$t$
. Organizing the terms in matrix notation ${Z_t} = \left[ {{H_t},{S_t},{Y_t}} \right]$
. Following the specification provided by Engle and Granger (Reference Engle and Granger1987), if
${Z_t} = \left[ {{H_t},{S_t},{Y_t}} \right]$
. Following the specification provided by Engle and Granger (Reference Engle and Granger1987), if $\beta $
is a vector of coefficients and
$\beta $
is a vector of coefficients and ${Z_t}$
is a vector of nonstationary variables, then the cointegrating vector
${Z_t}$
is a vector of nonstationary variables, then the cointegrating vector $\beta $
is written as:
$\beta $
is written as:
 $$\beta {Z_t} = {\varepsilon _t}.$$
where, if a linear combination of vectors on the left-hand side of the equation is stationary, then the error term, ${\varepsilon _t}$
, is the deviation from the long-run equilibrium—the equilibrium-error (Johansen Reference Johansen1988).
Footnote 5
Most models tested in this paper cointegrate to rank order one and are estimated between two and five lags depending on specification results.
Footnote 6
${\varepsilon _t}$
, is the deviation from the long-run equilibrium—the equilibrium-error (Johansen Reference Johansen1988).
Footnote 5
Most models tested in this paper cointegrate to rank order one and are estimated between two and five lags depending on specification results.
Footnote 6
Preliminary results
Does noncontributory welfare spending influence party polarization in Congress? Table 2 presents Granger causality tests (Granger Reference Granger1969) for both chambers to help gauge whether the short-run dynamics of each endogenous series is affected by the other indicators in the model or whether each series moves in a similar direction due to chance. For example, variable $y$
is said to Granger-cause variable
$y$
is said to Granger-cause variable $x$
if, given past values of
$x$
if, given past values of $x$
, past values of
$x$
, past values of $y$
are useful for predicting
$y$
are useful for predicting $x$
.
Footnote 7
Results are encouraging and support expectations.
Footnote 8
$x$
.
Footnote 7
Results are encouraging and support expectations.
Footnote 8
Granger causality tests—noncontributory welfare outlays
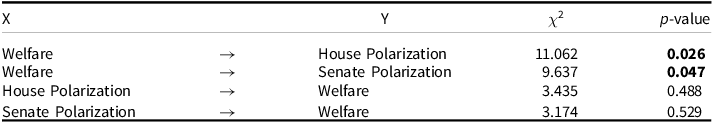
Note: Entries are Granger-causality Wald tests. Bold entries denote statistical significance. ( $p \lt 0.05$
), italics indicate statistical significance (
$p \lt 0.05$
), italics indicate statistical significance ( $p \lt 0.10$
). N = 72. Spending data are noncontributory welfare outlays to individuals (White House Historical Table 11.3).
$p \lt 0.10$
). N = 72. Spending data are noncontributory welfare outlays to individuals (White House Historical Table 11.3).
Findings show the effect of noncontributory welfare spending on polarization reaches conventional levels of statistical significance $(p \lt 0.05)$
in predicting the short-run movement in both chambers. Past values of welfare spending have an immediate impact on predicting the future movement of polarization in the House and Senate, suggesting this effect is not due to chance. In contrast, results do not suggest a reverse effect: polarization fails to exert a short-run influence on welfare spending. That is, findings show this relationship leads one way where the existence of party polarization in Congress does not have an immediate effect on welfare outlays.
$(p \lt 0.05)$
in predicting the short-run movement in both chambers. Past values of welfare spending have an immediate impact on predicting the future movement of polarization in the House and Senate, suggesting this effect is not due to chance. In contrast, results do not suggest a reverse effect: polarization fails to exert a short-run influence on welfare spending. That is, findings show this relationship leads one way where the existence of party polarization in Congress does not have an immediate effect on welfare outlays.
Shifting attention to the long-run effects, Fig. 2 presents the cumulative orthogonal impulse response functions (IRF) with 95% error bands. These tests measure how polarization reacts when noncontributory welfare spending is shocked by one standard deviation over the mean of the series. The x-axis presents the time distance shock, twenty years, and the y-axis denotes the polarization scale. Once again, findings support the hypothesis that welfare spending has a strong effect on party polarization in Congress. Results show a one-standard-deviation shock to welfare spending has a persistent and lasting impact on polarization in both chambers that does not decay over time—a shock at arbitrary time t equates to a constant increase in polarization between 0.2 and 0.3 points. If the federal government expanded current welfare spending levels by $260 billion dollars (one standard deviation of the sample mean), in other words, polarization would increase around 10% in both chambers. The overall additive shock to noncontributory welfare spending leads to increase of over four points in the overall polarization score for both chambers.
Cumulative impulse response functions—noncontributory welfare outlays. Note: Entries are orthogonal impulse response functions with confidence intervals. Lines represent the response of party polarization when spending is shocked by one-standard deviation. The heavy shaded region signifies overlap between both chambers.
Finally, meeting expectations, calculations show Republicans exert a stronger effect on polarization in both chambers. While conservatives account for only 52.6% of the average party polarization in the Senate across the entire time series, they account for 62% in the House. Footnote 9 This is not surprising given scholarship draws similar conclusion at both the mass and elite levels (Brewer and Stonecash Reference Brewer and Stonecash2015; Levendusky Reference Levendusky2009; Grossman and Hopkins Reference Grossman and Hopkins2016; Mann and Ornstein Reference Mann and Ornstein2016; McCarty et al. Reference McCarty, Poole and Rosenthal2016; Suhay et al. Reference Suhay, Tenenbaum and Bartola2022). More important, though, this finding comports with the egalitarian argument that Republicans would drive polarization if they do in fact resist noncontributory welfare programs.
Egalitarianism and welfare spending
Building on the findings in the previous section, I now test the limits of the egalitarian theory by introducing alternative spending categories. If competing conceptions of egalitarianism are an important factor that drives polarization, then philosophical differences over achieving a fair or just society and the subsequent role government is expected to perform in reaching these goals should be less pronounced on issues perceived to have lower substantive weight. To illustrate this distinction, Table 3 presents Granger-causality results for the spending categories listed in Table 1 (Welfare, Defense, General Government, Earmark, and Political) as well as contributory, nondiscretionary social programs (Social Security and Medicare, etc.). Footnote 10
Granger causality tests—specific spending categories
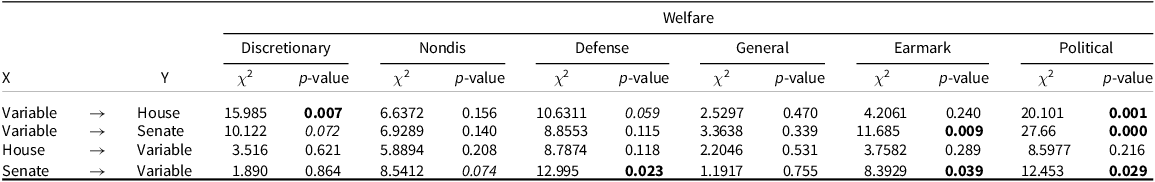
Note: Entries are Granger-causality Wald tests. Bold entries denote statistical significance $ \lt 0.05$ $p \lt 0.10$
. N = 72.
$p \lt 0.10$
. N = 72.
In all, findings for categories besides noncontributory welfare, with notable exceptions for the Political and Earmark categories in the Senate, are underwhelming and give strong support to the second hypothesis. For instance, where welfare reaches conventional levels of statistical significance for the House $(p \lt 0.05)$
and Senate
$(p \lt 0.05)$
and Senate $(p \lt 0.07)$
, suggesting past values of welfare spending are useful in predicting the future short-run movement in polarization, the other outlays fail to exhibit a similar impact. Not only does General Government (education, disaster relief, and general government operations), Defense (international and humanitarian aid, veterans, and national defense), and the Earmark categories (transportation and energy) for the House fail to show a significant effect, but spending for contributory social programs are also insignificant.
$(p \lt 0.07)$
, suggesting past values of welfare spending are useful in predicting the future short-run movement in polarization, the other outlays fail to exhibit a similar impact. Not only does General Government (education, disaster relief, and general government operations), Defense (international and humanitarian aid, veterans, and national defense), and the Earmark categories (transportation and energy) for the House fail to show a significant effect, but spending for contributory social programs are also insignificant.
Perhaps the most contrary finding, Political spending, shows a strong effect on the short-run movement on polarization in both chambers. However, while not unexpected considering the vested interests lawmakers have in these agencies and programs, this finding makes intuitive sense. For example, where bipartisanship is more common on programs listed under the other categories, conservatives and liberals are often at odds over spending priorities on conservation, OSHA, labor, agriculture, and the SEC, to name a few. Programs the parties use to exploit for electoral gain should demonstrate an immediate or instantaneous impact on party polarization. As with noncontributory welfare, the findings suggest short-run dynamics are most intense and tend have an immediate effect on party polarization for those spending categories infused with politics.
While the reader may question whether these findings provide convincing support for the hypotheses advanced in this study, it is important to note these results only show instantaneous relationships. When taken in context alongside the long-run effects, a complete picture emerges. Fig. 3 presents the cumulative IRFs. Footnote 11
Cumulative impulse response functions—specific spending categories. Note: Entries are cumulative orthogonal impulse response functions with confidence intervals. Lines represent the response of party polarization when spending is shocked by one-standard deviation. * = Denotes statistical significance at $95{\rm{\% }}$
level.
$95{\rm{\% }}$
level.

As both graphs show, all categories, including contributory social welfare spending, fail to reach conventional levels of statistical significance in both chambers, and when placed alongside the Granger tests, highlight numerous important points. First, despite the pronounced short-run effect on polarization observed in, for instance, the Political category, this impact fails to translate over the long run. Evidence of an instantaneous effect suggests this impact is short-lived. That is, because polarization is a long-term political phenomenon, the cumulative buildup of partisan animosities suggests a transitory impact. Second, despite these significant short-run effects, the cumulative impacts, though insignificant, are negative or flat in many cases. Though speculative, this does imply these spending categories lack ideological meaning to rouse immediate and long-term political animosities to the same degree as welfare. Finally, results also lend support to similar conclusions found in the literature. Where some find ideology is more pronounced in policy areas such as social welfare than on others (Jochim and Jones Reference Jochim and Jones2013), additional research shows clear differences in elite preferences for spending depending on the partisan intensity of the issue (Jacoby Reference Jacoby2000; Wlezien Reference Wlezien1995). Some policy areas do not excite partisan opposition to the same extent that differences over welfare drives partisanship.
Egalitarianism and roll call voting
While these findings lend ample explanatory leverage to support both hypotheses, it is difficult to determine the extent to which egalitarian ideals shape legislative behavior outside the fact noncontributory welfare spending pushes the parties further apart. Further analysis is needed to show the extent to which disagreements over welfare give an accurate depiction of these theoretical predictions. If, in other words, this theory paints a convincing portrayal of egalitarianism at the policy level, then it is reasonable these views would extend to actual roll call voting. Following the expectations presented above, preferences on noncontributory welfare legislation should be more polarized than on bills in other categories. Using the Comparative Agendas Project, I separate votes for the House of Representatives between the 87th (1961 – 2) and 115th (2017 – 8) Congress by specific policy area and recover unique ideal point estimates. Footnote 12 Rather than overwhelm the reader with an examination of all policies, I present an abridged summary using the classifications from the previous section. The following votes are examined: noncontributory welfare (Welfare), defense (Defense), agriculture (Political), transportation (Earmark), and education (General). I also include civil rights as an additional check.
To gauge the differences between each category, I compare the intensity of polarization between each policy and noncontributory welfare votes. Presented in Table 4, scores represent the percent difference in polarization with welfare as the base comparison. Calculated as $\left( {Po{l_{Wel}}/Po{l_{Other}}} \right){\rm{*}}100$
, scores greater than 100 (bolded) denote welfare legislation is more polarized. As an example, when interpreting the results, the size of the score above or below 100 is the percent difference in party polarization with welfare. Scores at 100 signify parity. A score of 102, as an example, means welfare is 2% more polarized than the alternative policy space.
$\left( {Po{l_{Wel}}/Po{l_{Other}}} \right){\rm{*}}100$
, scores greater than 100 (bolded) denote welfare legislation is more polarized. As an example, when interpreting the results, the size of the score above or below 100 is the percent difference in party polarization with welfare. Scores at 100 signify parity. A score of 102, as an example, means welfare is 2% more polarized than the alternative policy space.
Average party polarization intensity by policy w/ welfare as base measure
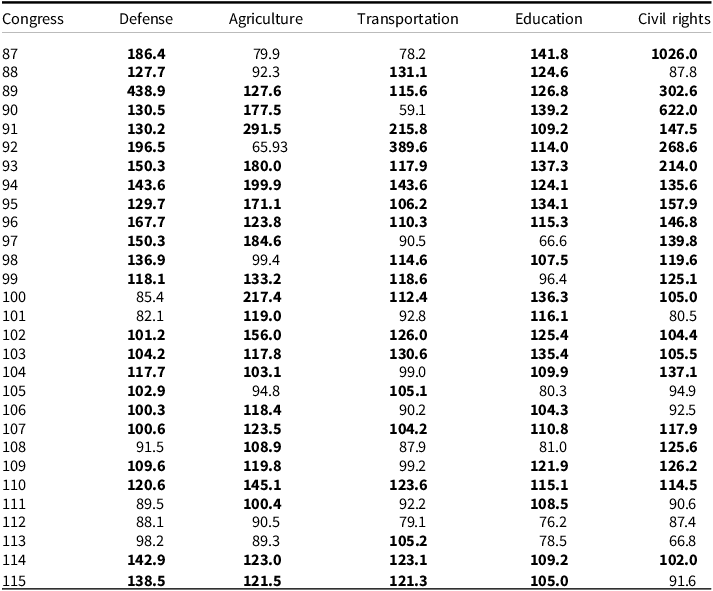
Note: Entries are the percent difference in party polarization between noncontributory welfare roll calls and other policy areas. Calculated as $\left( {Po{l_{Wel}}/Po{l_{Oth}}} \right){\rm{*}}100$
, bold entries denote higher polarization scores for welfare.
$\left( {Po{l_{Wel}}/Po{l_{Oth}}} \right){\rm{*}}100$
, bold entries denote higher polarization scores for welfare.
The following function and subfunction categories define the roll call selections used in the estimating process:
- Noncontributory Welfare = 343 - 4, 506, 603, 1300 - 2, 1304 - 5, 1400 - 1, 1403, 1406, and 1409;
- Defense = 16;
- Agriculture = 4;
- Transportation = 10;
- Education = 6;
- Civil Rights = 200 - 2, 206, 209, 529, and 530.
The findings are strong and convincing. Though only a small sample of possible policies lawmakers dedicate attention to, these findings not only support research that finds elites exhibit different attitudes toward welfare (Wlezien Reference Wlezien1995), but also considerable variability exists in the dimensionality of roll call voting (Jochim and Jones Reference Jochim and Jones2013). Compared to noncontributory welfare, preferences are less extreme than those on other policies. For example, starting with voting on defense, out of the 29 congressional terms analyzed, legislators were less polarized in 23—an average 33.8% increase in polarization over defense. Moreover, the few legislative terms when defense polarization exceeds welfare, the average decrease is only 11%. In these few instances, the parties were more polarized on defense voting when controversies such as the Iran Contra scandal dominated headlines or the parties disagreed over judgments to enter the Iraq and Afghanistan Wars following the terrorist attacks of September 11th.
A similar pattern is also evident on voting for education and agriculture legislation. Although the average increase in party polarization over education is less at 12%, both education and defense follow almost identical patterns: policy consensus during the 1960s and 1970s, followed by a few moments when voting became more contentious. Agriculture, in contrast, while less polarized on average, shows lawmakers were more polarized between the 1960s and 1980s. In addition, agriculture voting shows dramatic oscillations in voting intensity when compared to welfare. For example, where welfare was almost 200% more polarized during the 91st Congress, the trend reverses in the next term when agriculture is 35% more polarized, only to retrench in the opposite direction. In contrast, findings show welfare exhibits similar patterns on transportation where welfare is more polarized in only 19 of the congressional terms analyzed. Moreover, while transportation fails to show a consistent pattern across time, in many of the terms when polarization is higher than welfare, these differences are less than 10%.
For a final analysis, I include roll call voting on civil rights legislation. As the findings show, lawmakers were more polarized on civil rights legislation in only eight instances with most of the uptick in partisan intensity occurring in recent years. Results show since the 1960s, with the sole exception of the 88th Congress and the passage of the Civil Rights Act, welfare is much more of a contentious issue dividing the parties. In addition, despite a notable increase in partisan differences on civil rights over welfare since the 1990s, the average increase in welfare polarization over civil rights is quite high at 77%. While policy fights over civil rights in the House were almost nonexistent as a source of partisan conflict compared to welfare policy decades ago, and despite recent concerns regarding civil rights issues, egalitarian differences about how to deliver a fair and just society seem to center on spending and debates over who pays for and who receives benefits.
Robustness check: income inequality
So far, the focus in this study centers on demonstrating the link between welfare and the rise in party polarization in Congress. However, this evidence is not definitive proof to conclude this relationship exists given the availability of alternative theories. It is possible, in other words, this analysis suffers from omitted variable bias since notable counterarguments are excluded – estimates that could, in theory, influence both party polarization and welfare spending. Perhaps one factor that may give improved insight is income inequality. Two reasons suggest rising inequality may prove a stronger indicator than noncontributory welfare spending.
First, scholarship has shown a strong causal link exists between rising income inequality and party polarization in Congress (Garand Reference Garand2010; McCarty et al. Reference McCarty, Poole and Rosenthal2016). As the income gap widens between the highest and lowest wage earners, the parties move further apart as they seek to protect core constituencies through the legislative process. Second, and building on this view, research also shows both parties have different approaches to address inequality (Donovan and Bowler Reference Donovan and Bowler2022; Faricy Reference Faricy2015; Kelly Reference Kelly2017). Where lawmakers with more constituents in the lower income range (Democrats) support policies to assist the disadvantaged, legislators with constituents in higher tax brackets (Republicans) tend to desire policies which favor their supporters. With this in mind, if economic inequality increases noncontributory welfare spending, then findings should show a stronger effect on party polarization in both the short and long runs.
To test this theoretical proposition, I replicate the model used in the Preliminary Results section and add the GINI coefficient as a fourth variable to gauge the simultaneous effect of both on polarization. Following the welfare spending measure, inequality is lagged one year and all indicators are standardized for direct comparison. Outside of this addition, the model presented here is identical to those analyzed above.
Comporting with the Granger-causality tests presented above, Table 5 shows past values of welfare spending still have an immediate impact on predicting the movement of polarization in both the House and Senate even when controlling for income inequality $(p \lt 0.05)$
. Results also suggest economic inequality has a strong impact on polarization in both chambers, substantiating findings in the literature on the relationship between inequality and partisanship, that the pernicious effect of income disparities reflects divergent attitudes toward policy to correct this issue. Also supportive of this thesis, findings show inequality has an immediate short-run effect on welfare outlays, suggesting as more individuals feel the impact of inequality, welfare payments rise. Economic inequality, as conventional wisdom argues, not only drives polarization in Congress, but also noncontributory welfare outlays, while welfare does not influence inequality.
$(p \lt 0.05)$
. Results also suggest economic inequality has a strong impact on polarization in both chambers, substantiating findings in the literature on the relationship between inequality and partisanship, that the pernicious effect of income disparities reflects divergent attitudes toward policy to correct this issue. Also supportive of this thesis, findings show inequality has an immediate short-run effect on welfare outlays, suggesting as more individuals feel the impact of inequality, welfare payments rise. Economic inequality, as conventional wisdom argues, not only drives polarization in Congress, but also noncontributory welfare outlays, while welfare does not influence inequality.
Granger causality tests—income inequality and noncontributory welfare outlays
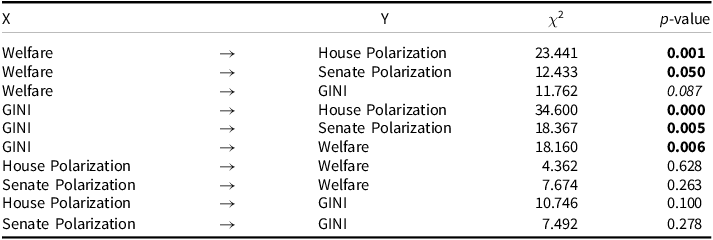
Note: Entries are Granger-causality Wald tests. Bold entries denote statistical significance. ( $p \lt 0.05$
), italics indicate statistical significance (
$p \lt 0.05$
), italics indicate statistical significance ( $p \lt 0.10$
). N = 72. Spending data are noncontributory welfare outlays to individuals (White House Historical Table 11.3).
$p \lt 0.10$
). N = 72. Spending data are noncontributory welfare outlays to individuals (White House Historical Table 11.3).
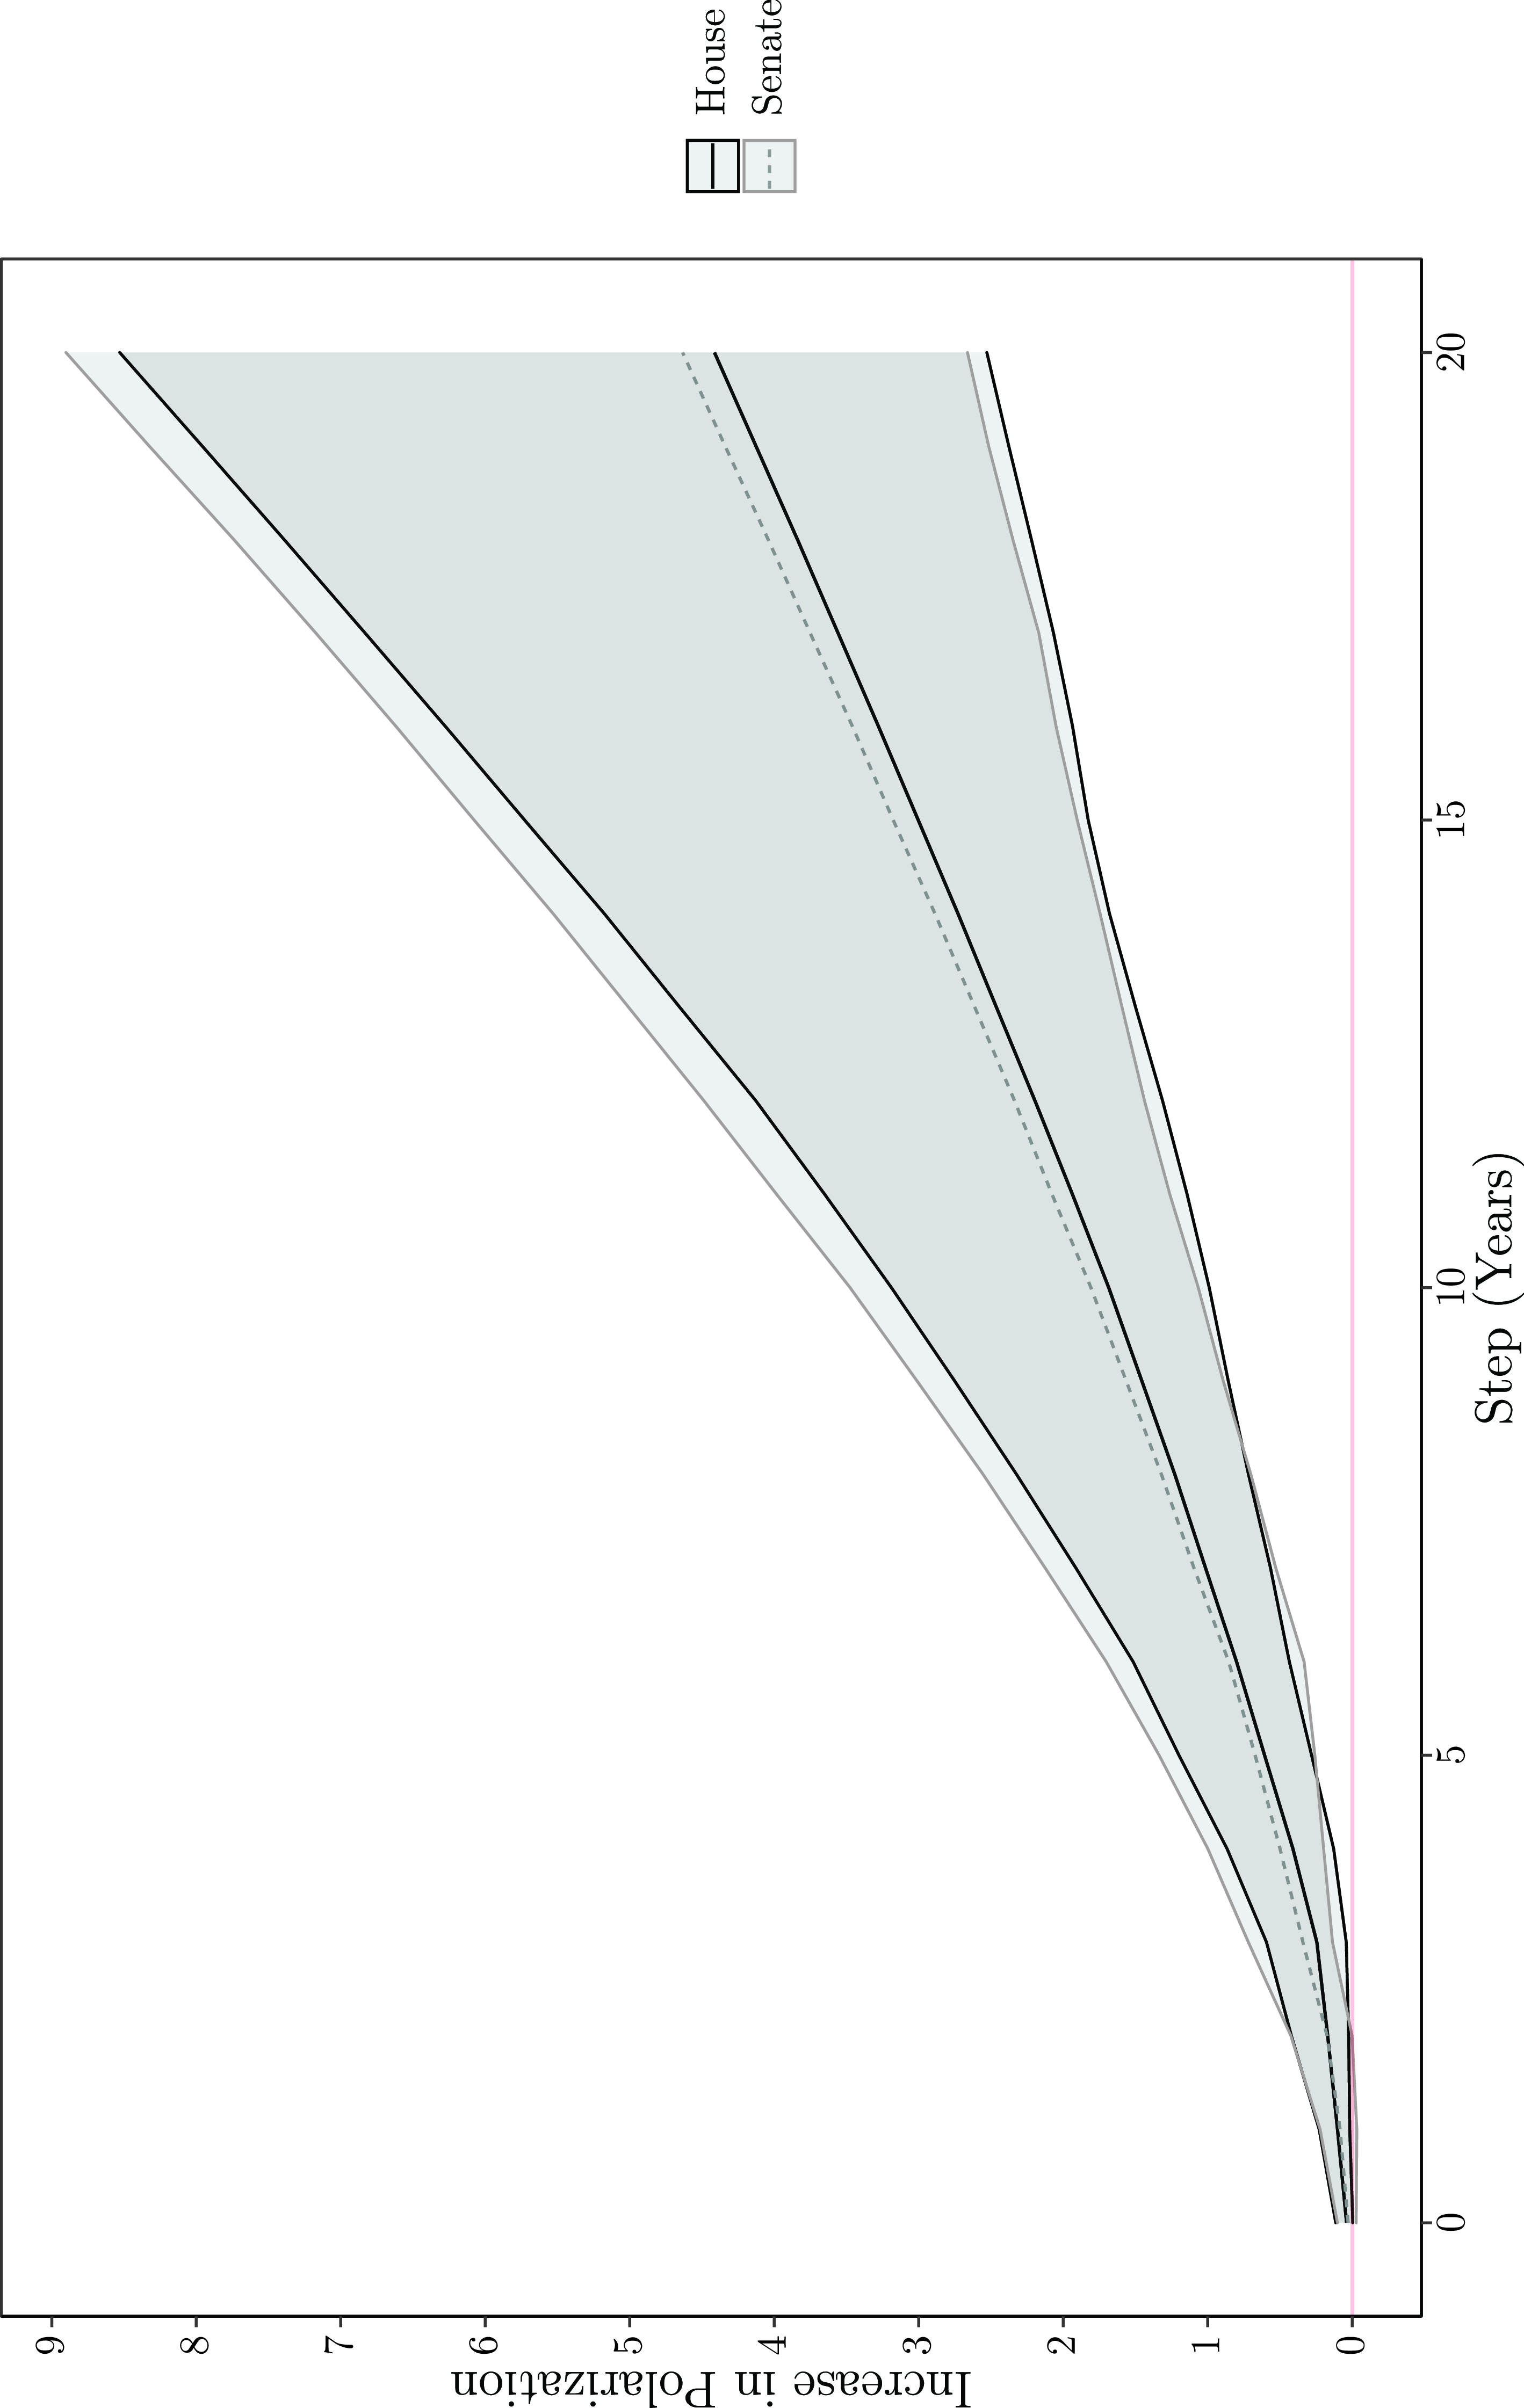
However, despite evidence giving strong support to the inequality thesis, this relationship is less convincing in the long term. Consistent with the findings in previous sections, Fig. 4 displays the cumulative impulse response functions and shows noncontributory welfare spending has a persistent long-run effect on polarization in both chambers even when income inequality is included in the multivariate time series model. In contrast, where inequality exerts a strong short-run impact on partisanship, this effect disappears in the long term. Though this finding may surprise the reader, it is consistent with existing research which also fails to find a direct link between inequality and polarization in Congress (Kelly Reference Kelly2017; Ladewig Reference Ladewig2021).
Cumulative impulse response functions—income inequality and noncontributory welfare outlays. Note: Entries are cumulative orthogonal impulse response functions with confidence intervals. Lines represent the response of polarization when main variable is shocked by one-standard deviation. The heavy shaded region signifies overlap between both chambers.
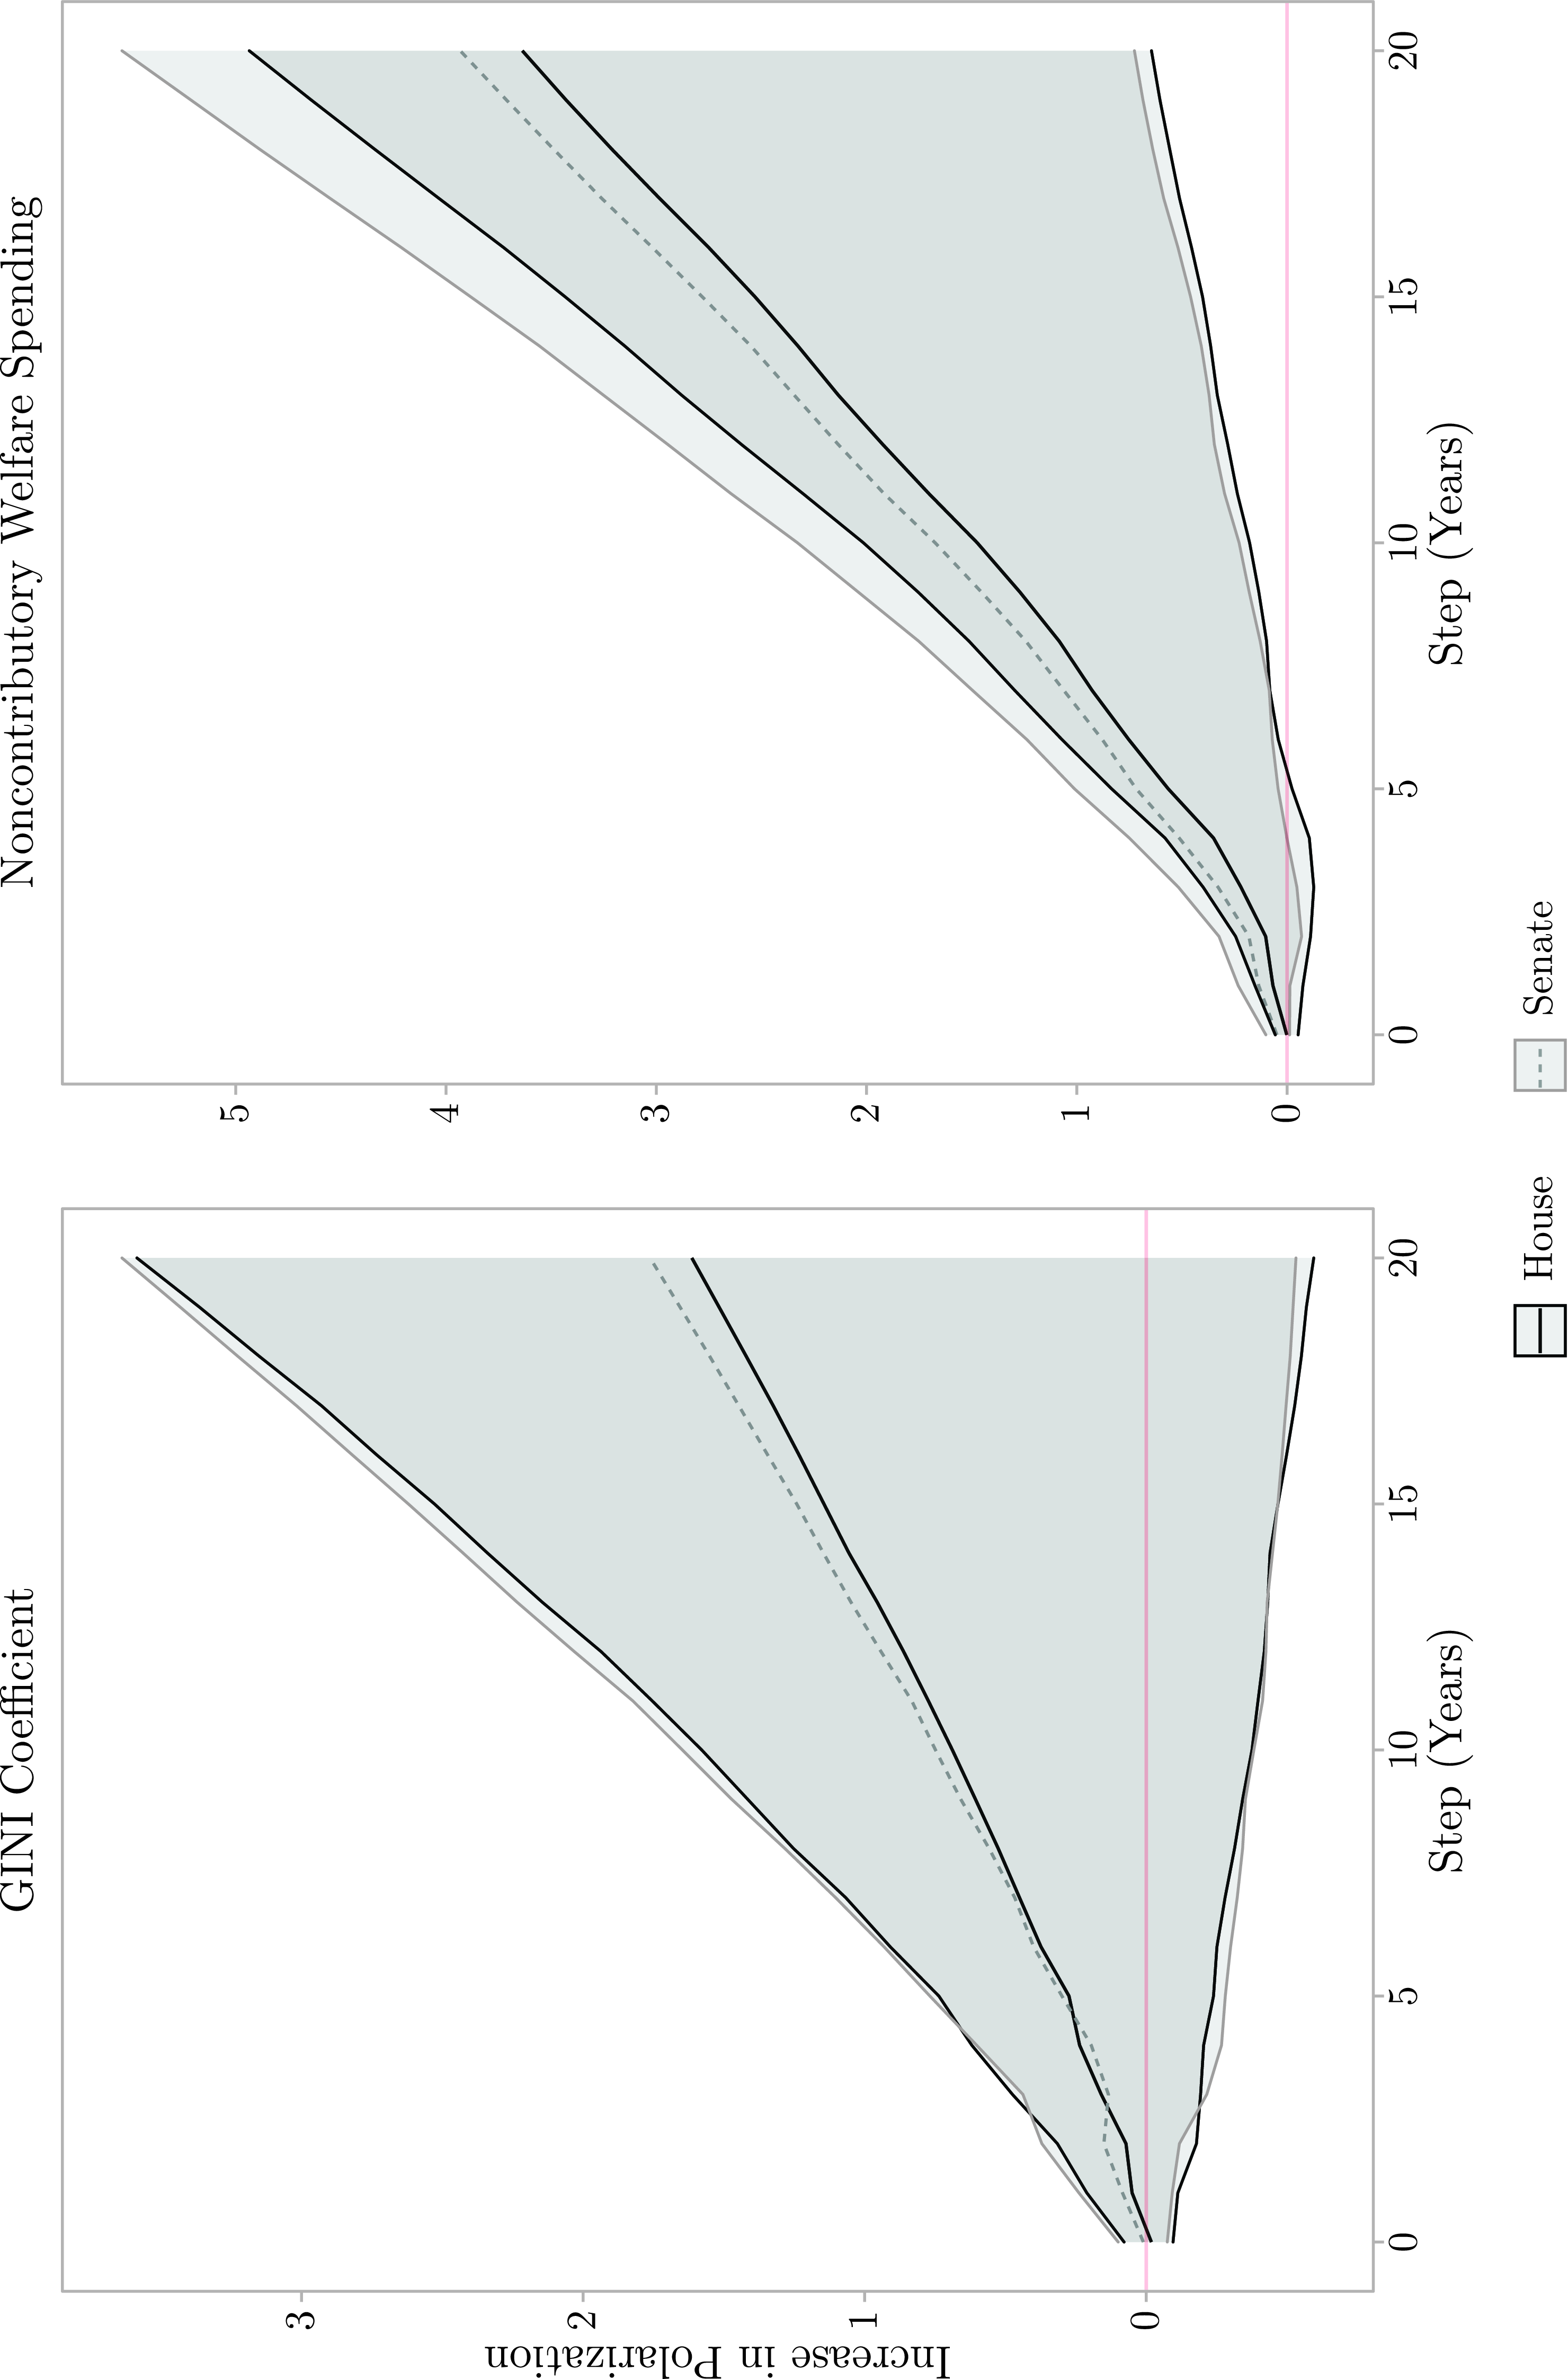
This finding, of course, comports with the argument for why policy outputs may yield higher dividends than social and economic phenomena since actual roll call votes are motivated by both immediate and persistent policy debates that result in floor action. Compared to floor action on income inequality, welfare policies garner annual legislative attention. As a consequence, the underlying philosophical differences that motivate political discourse on welfare may be easier to discern in a multivariate time series model than for issues which receive sporadic legislative attention. This is not to say economic inequality has less explanatory value or the philosophical debates that trigger voter attitudes are different than those for welfare, but rather more work is needed to better discern how these factors interact.
Conclusion
The main contribution of this study is that it places noncontributory welfare into the party polarization debate. While not the only factor to help explain the rise in party polarization in Congress in recent decades, this study presents practical and theoretical justification for why noncontributory welfare is a viable explanatory factor. I argue that because both parties have competing conceptions over the legitimate role of government as a force to create a fair and just society for the underprivileged, as the size of the welfare state has expanded, these diverging philosophical views have driven lawmakers apart.
Using annual noncontributory welfare spending data between 1947 and 2018 as a proxy to represent the growth in the welfare state, evidence lends strong support to this theory. Findings suggest not only does welfare spending contribute to the rise in party polarization in both the short and long runs, but also when compared against alternative spending categories such as defense, general government outlays, and contributory social programs, only noncontributory welfare displays a significant and consistent statistical effect. Lending additional support to the egalitarian theory advanced in this study, findings also suggest Republicans exert a greater effect on party polarization in both chambers.
To demonstrate this effect is not unique to spending, I also recover ideal point estimates for lawmakers by policy area in the House between the 87 $^{{\rm{th}}}$
and 115
$^{{\rm{th}}}$
and 115 $^{{\rm{th}}}$
Congress and show when compared against latent preferences on defense, agriculture, transportation, education, and civil rights, lawmakers are more polarized when voting on noncontributory welfare bills. Finally, I also test the simultaneous effect of income inequality with welfare spending to determine if the models suffer from omitted variable bias. Findings show while income inequality exerts a short-run effect on party polarization in Congress, it fails to have a long-run impact. Even when controlling for inequality, noncontributory welfare still shows a significant effect on polarization. In all, findings suggest competing evaluations over what constitutes a fair and just society, and the best method to achieve these ideals is well expressed in welfare policies.
$^{{\rm{th}}}$
Congress and show when compared against latent preferences on defense, agriculture, transportation, education, and civil rights, lawmakers are more polarized when voting on noncontributory welfare bills. Finally, I also test the simultaneous effect of income inequality with welfare spending to determine if the models suffer from omitted variable bias. Findings show while income inequality exerts a short-run effect on party polarization in Congress, it fails to have a long-run impact. Even when controlling for inequality, noncontributory welfare still shows a significant effect on polarization. In all, findings suggest competing evaluations over what constitutes a fair and just society, and the best method to achieve these ideals is well expressed in welfare policies.
Supplementary material
The supplementary material for this article can be found at https://doi.org/10.1017/S0143814X23000454.
Data availability statement
Replication materials are available in the Journal of Public Policy Dataverse at https://doi.org/10.7910/DVN/UL6CNY.
Acknowledgments
I would like to thank the anonymous reviewers for their thoughtful and helpful suggestions.
Competing interests
The author declares none.


