


Introduction
Major depression is the third leading cause of disease burden worldwide, charactered with limiting psychosocial functions and lowering the quality of life (Malhi and Mann, Reference Malhi and Mann2018). From 1990 to 2017, the number of reported instances of depression grew by 49.86% globally, indicating that depression remains a serious public health concern (Liu et al., Reference Liu, He, Yang, Feng, Zhao and Lyu2020b). As a complex mental disorder, depression is considered to be impacted by genetic, environmental and gene-environment interactions (Otte et al., Reference Otte, Gold, Penninx, Pariante, Etkin, Fava, Mohr and Schatzberg2016), as well as modified by lifestyles (Opie et al., Reference Opie, Itsiopoulos, Parletta, Sanchez-Villegas, Akbaraly, Ruusunen and Jacka2017; Huang et al., Reference Huang, Li, Gan, Wang, Jiang, Cao and Lu2020; Wong et al., Reference Wong, Ho, Shi, Sarris, Chung and Yeung2021)
Aside from the well-known dietary and physical activity factors, several studies have been conducted to examine the impact of sleep in the development of depression, but the results were equivocal. Short sleep duration was associated with depression symptoms in a cross-sectional and prospective manner (Lippman et al., Reference Lippman, Gardener, Rundek, Seixas, Elkind, Sacco, Wright and Ramos2017). One study from rural America supported that short sleep duration was associated with depressive symptoms, whereas another study from rural China supported the notion that both long and short sleep were related with depression (Chang et al., Reference Chang, Salas, Habicht, Pien, Stamatakis and Brownson2012; Mohan et al., Reference Mohan, Xiaofan and Yingxian2017). A meta-analysis of seven prospective studies comprising 25 271 participants for short sleep duration and 23 663 participants for long sleep duration found that both short and long sleep duration were substantially linked with an elevated risk of depression in adults (Zhai et al., Reference Zhai, Zhang and Zhang2015). Meanwhile, recent meta-analyses have revealed a substantial link between insomnia and depression (Li et al., Reference Li, Wu, Gan, Qu and Lu2016). An analysis of data from the Wisconsin Sleep Cohort Study reveals a substantial long-term relationship between increasing subjective excessive daytime sleepiness and depression (Plante et al., Reference Plante, Finn, Hagen, Mignot and Peppard2017). Moreover, several research studies have investigated the joint effect of multiple sleep issues, and revealed that the combined sleep manners were associated with an increased risk of depression (Fernandez-Mendoza et al., Reference Fernandez-Mendoza, Shea, Vgontzas, Calhoun, Liao and Bixler2015; Sun et al., Reference Sun, Zheng, Lv, Guo, Bian, Yang, Chen, Fu, Guo, Liang, Chen, Chen, Li and Yu2018; Jiang et al., Reference Jiang, Li, Mao, Wang, Huo, Liu, Zhang, Tian, Liu, Zhang, Tu, Qian, Liu, Luo, Bie and Wang2020). However, the majority of previous studies focused on the elderly or teenagers, varied in sample size, age group and sleep duration definition. The current study aimed to explore the associations between independent sleep factor, as well as combined sleep behaviours, and the risk of depression in general American adults, ranging from 30 to 79 years, utilising National representative data from the NHANES Study.
Methods
Study subjects
The NHANES is a series of cross-sectional, complex, multi-stage surveys, conducted by the Centers for Disease Control and Prevention CDC. The NHANES survey combines interviews and physical examinations. The interview includes questions on demographics, socioeconomics, diet and health. Medical, dental and physiological measures, as well as laboratory tests conducted by highly qualified medical experts, comprise the examination component.
In this cross-sectional study, we examined publicly accessible data from participants aged 20–79 years with complete and reliable information (demographics, dietary and health-related behaviours, body measurements and disease information) gathered between 2007 and 2014 waves.
Assessment of depressive symptoms
Depression was assessed using the Patient Health Questionnaire (PHQ-9), a nine-item screening instrument that asked questions regarding the frequency of symptoms of depression over the past two weeks. Response categories for the nine-item instrument ‘not at all’, ‘several days’, ‘more than half the days’ and ‘nearly every day’ with points ranging from 0 to 3 (Levis et al., Reference Levis, Benedetti and Thombs2019). A total score ⩾ 10 was considered to be clinically relevant depression (CRD) according to the fourth edition of the Diagnostic and Statistical Manual of Mental Disorders (DSM-IV) (Kroenke et al., Reference Kroenke, Spitzer and Williams2001; Park and Zarate, Reference Park and Zarate2019).
Assessment of sleep factors and definition of a sleep pattern
Sleep duration was self-reported by the question ‘How much sleep do you usually get at night on weekdays or workdays?’ The quantity of time recorded was grouped as short (<7 h per night), normal (7–9 h per night) and long (>9 h per night) (Chaput et al., Reference Chaput, Dutil and Sampasa-Kanyinga2018). The responses to ‘Have you ever told a doctor or other health professional that you have trouble sleeping?’ and ‘Have you/Has SP ever been told by a doctor or other health professional that you have a sleep disorder?’ were used to assess the trouble sleeping and sleep disorders, respectively. The lower and higher risk sleep factors were classified as 1 and 0 for the above-mentioned sleep behaviours to generate overall sleep scores, ranging from 0 to 3. A sleep score of 0 to 1, 2 or 3 indicated a poor, moderate or healthy sleep pattern, accordingly.
Assessment of potential covariates
The sample person demographics questions involved in the study were administered in the home by trained interviewers using the Computer-Assisted Personal Interviewing (CAPI) system, as follows: age in years at the exam (20–29, 30–44, 45–59, 60–79 years), gender (male, female), ethnicity (Mexican American, Other Hispanic, non-Hispanic White, non-Hispanic Black, non-Hispanic Asian, other Race-including Multi-Racial), education level (less than 9th grade, 9–11th grade/includes 12th grade with no diploma, high school graduate/GED or equivalent, some college or AA degree, college graduate or above) and marital status (married, living with partner, widowed, divorced, separated, never married). Smoking status was measured by the question ‘Have you smoked at least 100 cigarettes in your entire life?’ and classified as ‘yes’ or ‘no’ based on the replies. The physical activity questionnaire is based on the Global Physical Activity Questionnaire and includes questions related to daily activities, leisure time activities and sedentary activities. The suggested metabolic equivalent (MET) scores of 8 points for vigorous work-related/leisure-time activity, 4 points for moderate work-related/leisure-time activity and walking or bicycling for transportation are used to compute metabolic equivalent. The sedentary time refers to the duration spent sitting in a typical day excluding sleeping. Body measurements were obtained by qualified health technicians in the Mobile Examination Centre. Body mass index (BMI) was calculated as weight in kilograms divided by height in metres squared, and then rounded to one decimal place. We utilised the total nutrient intakes (DR1TOT) consumed during the 24-h period prior to the interview on the first day to calculate the 13 components of the Healthy Eating Index (HEI) 2015 score (range, 0–100), as detailed in the previous study (Krebs-Smith, Reference Krebs-Smith, Pannucci, Subar, Kirkpatrick, Lerman, Tooze, Wilson and Reedy2018; Liu et al., Reference Liu, Rehm, Onopa and Mozaffarian2020a). Daily alcohol intake was obtained on the first-day dietary recall (DR1TOT), and divided into 0 and >0 gm categories. We computed the comorbidity index based on the 11 self-reported diseases (including: arthritis, congestive heart failure, coronary heart disease, angina pectoris, heart attack, stroke, liver condition, diabetes, solid tumour, leukaemia and lymphoma), as detailed in the online Supplementary Table S1.
Statistical analysis
The baseline characteristics of the study population were presented as percentages according to CRD and sleep pattern status, respectively. Weighted logistic regression models were used to evaluate the relationship between sleep factors (sleep duration, trouble sleeping and sleep disorder) or sleep patterns, and the risk of CRD. Model 1 adjusted for age and gender. Model 2 further adjusted for race, marriage status, education level, smoke status and alcohol intake. Model 3 further included HEI-2015 index, physical activity, sedentary time, BMI and comorbidity index.
The STATA version 14.0 (Stata Corp LP, College Station, TX, USA) was applied for data analysis. R software 3.5.3 was used to create the forest graphs. A p value < 0.05 was regarded as statistically significant.
Results
The baseline characteristics of study population
Characteristics of the participants according to CRD status are presented in Table 1. Of the 17 859 subjects (49.3% males and 50.7% females, mean (SD) age 47.3 [16.5] years), the overall prevalence of CRD was 9.5%, with 6.7% and 12.3% being in males and females, respectively (Table 1).
Characteristics of participants by CRD status

n, sample size; CRD, clinically relevant depression; BMI, body mass index; HEI-2015, Healthy Eating Index-2015; MET, metabolic equivalent.
a Non-White: Mexican American, other Hispanic, non-Hispanic Black, other race-including multi-racial.
b Smoke 100 cigarettes (or other tobacco) in entire life.
Participants with a poor sleep pattern appeared to be middle and older age, had higher comorbidity index and obesity trends, with lower education level, and more likely to be females, living alone, physically inactive and more sedentary time, more likely to be heavy smokers, on poor eating quality (Table 2). The prevalence of CRD rises in tandem with the worsening of sleep patterns (Table 2).
Characteristics of participants by sleep pattern status

n, sample size; BMI, body mass index; HEI-2015, Healthy Eating Index-2015; MET, metabolic equivalent; CRD, clinically relevant depression.
a Non-White: Mexican American, other Hispanic, non-Hispanic Black, other race-including multi-racial.
b Smoke 100 cigarettes (or other tobacco) in entire life.
Association between sleep and risk of CRD
As shown in Fig. 1, in age- and gender-adjusted model (model 1), participants who slept <7 h or >9 h were 1.91 and 4.06 times more likely to have CRD, respectively. Both short (OR: 1.66, 95% CI: 1.39–1.98) and long sleep duration (OR: 2.75, 95% CI: 1.93–3.92) remained significant after adjusting for potential confounding factors (fully adjusted model). Both sleep complaints (including: trouble sleeping and sleep disorder), particularly trouble sleeping (OR: 3.04, 95% CI: 2.59–3.56), was substantially related with CRD as compared to individuals who reported no sleep complaints (fully adjusted model).
Logistic regression analyses of the association between sleep factors and CRD. Adjusted for: Model 1: age, gender; Model 2: model 1, race, marital status, education level, smoke status, alcohol intake; Model 3: model 2, HEI-2015 index, physical activity, sedentary time, BMI, comorbidity index.

The relationship of combined sleep factors (including: sleep duration, trouble sleep and sleep disorder) with depression was shown in Fig. 2. Compared to the healthy sleep pattern, participants with poor sleep pattern were associated with a higher possibility of CRD (OR: 5.98, 95% CI: 4.91–7.29) (model 3).
Logistic regression analyses of the association between sleep patterns and CRD. Adjusted for: Model 1: age, gender; Model 2: model 1, race, marital status, education level, smoke status, alcohol intake; Model 3: model 2, HEI-2015 index, physical activity, sedentary time, BMI, comorbidity index.

The association of sleep patterns with risk of CRD by ages
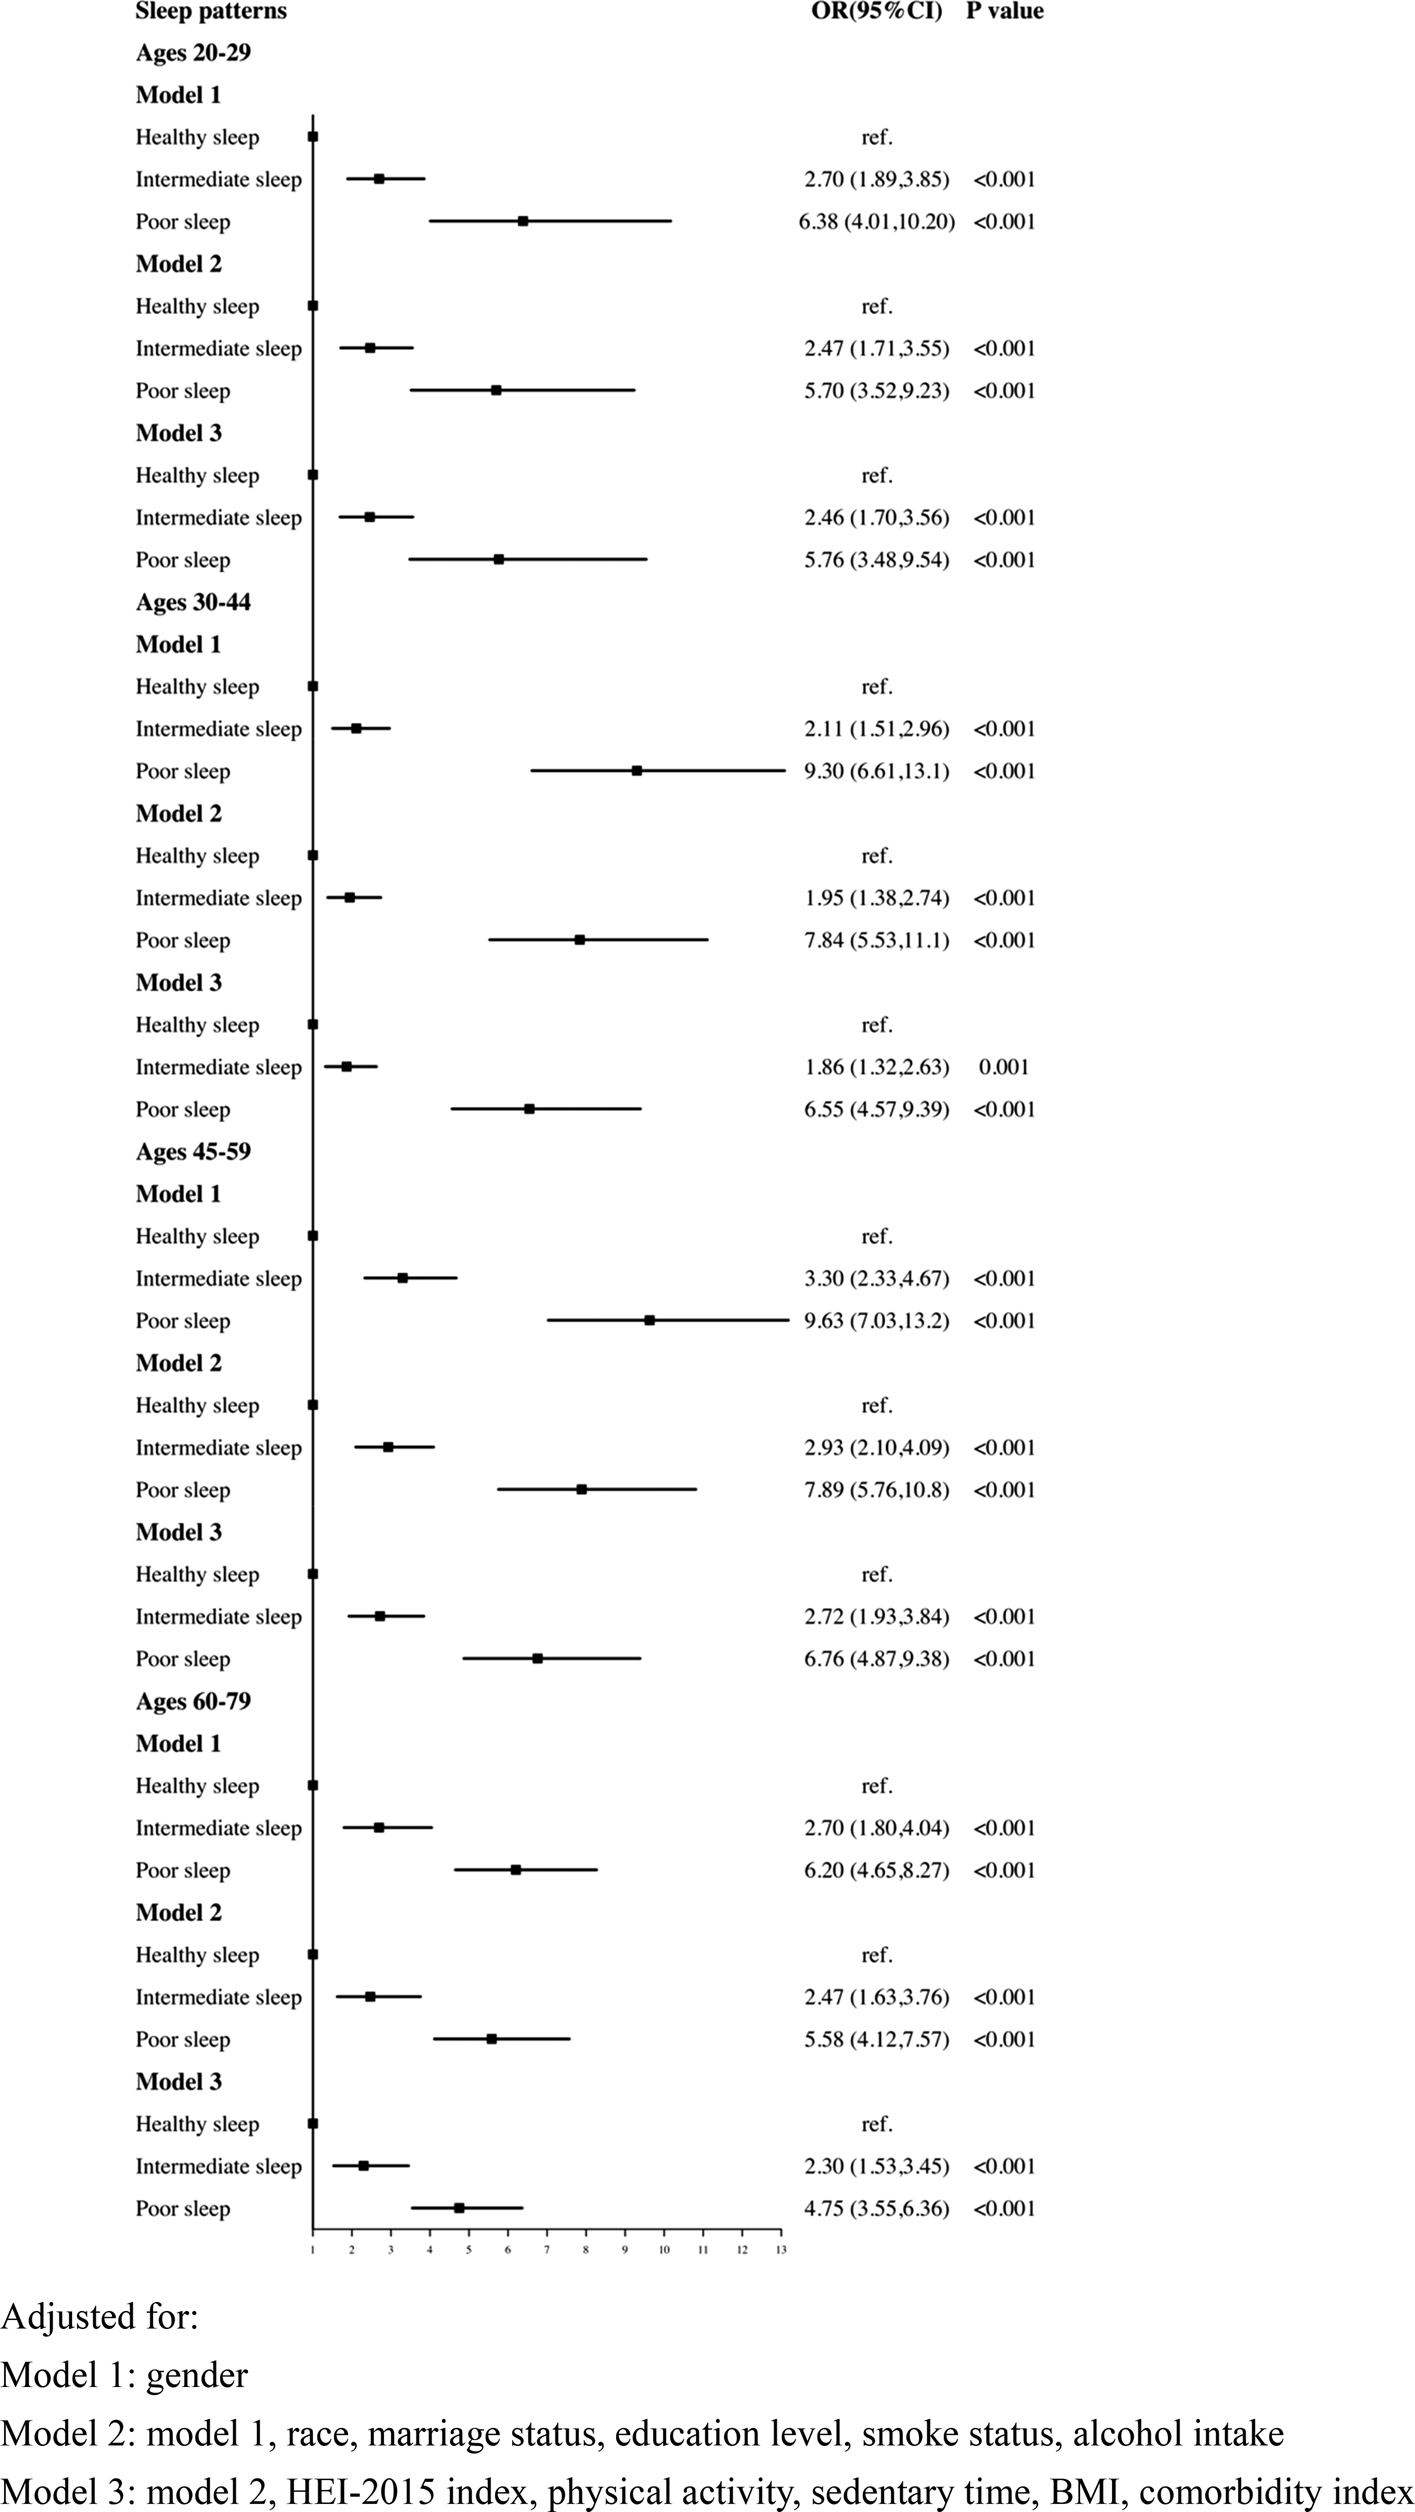
As shown in Fig. 3, after age stratification, the rising tendency of depression linked with poor sleep pattern remained significant across all age groups, notably in the 30–44 and 45–59 age groups.
Logistic regression analyses of the association between sleep patterns and CRD stratified by age. Adjusted for: Model 1: gender; Model 2: model 1, race, marital status, education level, smoke status, alcohol intake; Model 3: model 2, HEI-2015 index, physical activity, sedentary time, BMI, comorbidity index.
Discussion
To the best of our knowledge, this is the first study conducted on the relationship between sleep behaviours and depression in a large national representative study. We observed that both short and long sleep duration, as well as sleep complaints (trouble sleeping and sleep disorder), were shown to be highly related with CRD. Then we measured the combined associations of sleep duration, trouble sleeping and sleep disorders with the risk of CRD, and participants with a poor sleep pattern had a greater risk of getting depression.
Among the 17 859 participants, the total prevalence of CRD was almost twice as common in females (12.3%) than males (6.7%). This was consistent with earlier findings and was most likely related to individual difference susceptibility and environmental factors (Seedat et al., Reference Seedat, Scott, Angermeyer, Berglund, Bromet, Brugha, Demyttenaere, de Girolamo, Haro, Jin, Karam, Kovess-Masfety, Levinson, Medina Mora, Ono, Ormel, Pennell, Posada-Villa, Sampson, Williams and Kessler2009; Kuehner, Reference Kuehner2017).
The quantity and quality of sleep are the basic units of good sleep. A recent meta-analysis of six prospective studies from the United States and one from Japan revealed a U-shaped relationship between sleep duration and depression risk (Zhai et al., Reference Zhai, Zhang and Zhang2015). Another large study, involving over 0.5 million Chinese participants, supported the U-shaped trend as well (Sun et al., Reference Sun, Zheng, Lv, Guo, Bian, Yang, Chen, Fu, Guo, Liang, Chen, Chen, Li and Yu2018). This was consistent with our result that, in the fully adjusted model, both short (OR: 1.66, 95% CI: 1.39–1.98) and long sleep duration (OR: 2.75, 95% CI: 1.93–3.92) were associated with depression. However, two other studies merely supported the longitudinal association between short sleep and depression, possibly due to the varied age ranges included (Jackowska and Poole, Reference Jackowska and Poole2017; Li et al., Reference Li, Wu, Zhai, Wang, Sun and Zhang2017). Aside from sleep quantity, sleep quality is also associated with depression risk (Yang et al., 2019; Hu et al., Reference Hu, Zhu, Kaminga, Zhu, Nie and Xu2020). Longitudinal studies suggested that insomnia symptoms or biomarkers measured by polysomnography enhance the incidence of depression by 2.2- to 5.3-fold (Szklo-Coxe et al., Reference Szklo-Coxe, Young, Peppard, Finn and Benca2010). And the treatment of insomnia in patients with depression has a positive impact on mood (Gebara et al., Reference Gebara, Siripong, DiNapoli, Maree, Germain, Reynolds, Kasckow, Weiss and Karp2018). Sleep disorders, particularly obstructive sleep apnoea (OSA), are more common in the general population. OSA affects 17% of women and 34% of men in the United States, with a similar prevalence in other countries (Gottlieb et al., Reference Gottlieb and Punjabi2020). Aside from the high prevalence of OSA, patients often fail to report sleep problems to clinicians, resulting in underdiagnosis, which is linked to an increased risk of a variety of negative health outcomes (Jonas et al., Reference Jonas, Amick, Feltner, Weber, Arvanitis, Stine, Lux and Harris2017; Gottlieb et al., Reference Gottlieb and Punjabi2020). For example, a systematic review and meta-analysis of observational studies support the idea that obstructive sleep apnoea may raise the risk of depression (Edwards et al., Reference Edwards, Almeida and Ford2020). Furthermore, this study extended on earlier findings by revealing that not only was a single sleep trait associated to depression, but the importance of an overall assessment of sleep factors was emphasised. In all three models, a poor sleep pattern was shown to be associated to the incidence of depression. In accordance with this, a study from rural China has examined sleep behaviours in tandem, indicating that the co-occurrence of sleep duration with objectively sleep complaints is related with the greater risk of depression (Jiang et al., Reference Jiang, Li, Mao, Wang, Huo, Liu, Zhang, Tian, Liu, Zhang, Tu, Qian, Liu, Luo, Bie and Wang2020). Furthermore, there are significant differences in sleep patterns throughout the lifespan (Hertenstein et al., Reference Hertenstein, Gabryelska, Spiegelhalder, Nissen, Johann, Umarova, Riemann, Baglioni and Feige2018). Previous research has shown that depressive symptoms are more common in older adults with sleep disorders than in young (Cho et al., Reference Cho, Lavretsky, Olmstead, Levin, Oxman and Irwin2008; Paudel et al., Reference Paudel, Taylor, Diem, Stone, Ancoli-Israel, Redline and Ensrud2008). A community cohort study of a Chinese population discovered that sleep problems were independently associated with depressive symptoms, particularly among middle-aged and elderly people aged 55–64 (Zhang et al., Reference Zhang, Liu, Liu, Ye, Cui and Wang2021). Similarly, our results supported the association between sleep problems and depression across age groups, particularly the middle-aged population (45–59 years, OR: 6.76, 95% CI: 4.87–9.38).
To date, multiple genome-wide association studies confirmed genetic correlations between sleep duration, insomnia symptoms, excessive daytime sleepiness and depressive symptoms (Hammerschlag et al., Reference Hammerschlag, Stringer, de Leeuw, Sniekers, Taskesen, Watanabe, Blanken, Dekker, Te Lindert, Wassing, Jonsdottir, Thorleifsson, Stefansson, Gislason, Berger, Schormair, Wellmann, Winkelmann, Stefansson, Oexle, Van Someren and Posthuma2017; Lane et al., Reference Lane, Liang, Vlasac, Anderson, Bechtold, Bowden, Emsley, Gill, Little, Luik, Loudon, Scheer, Purcell, Kyle, Lawlor, Zhu, Redline, Ray, Rutter and Saxena2017; Dashti, Reference Dashti, Jones, Wood, Lane, van Hees, Wang, Rhodes, Song, Patel, Anderson, Beaumont, Bechtold, Bowden, Cade, Garaulet, Kyle, Little, Loudon, Luik, Scheer and Saxena2019; Jansen et al., Reference Jansen, Watanabe, Stringer, Skene, Bryois, Hammerschlag, de Leeuw, Benjamins, Munoz-Manchado, Nagel, Savage, Tiemeier, White, Me Research, Tung, Hinds, Vacic, Wang, Sullivan, van der Sluis, Polderman, Smit, Hjerling-Leffler, Van Someren and Posthuma2019; Wang, Reference Wang, Lane, Jones, Dashti, Ollila, Wood, van Hees, Brumpton, Winsvold, Kantojarvi, Palviainen, Cade, Sofer, Song, Patel, Anderson, Bechtold, Bowden, Emsley, Kyle, Little, Loudon, Scheer, Purcell, Richmond, Spiegelhalder, Tyrrell, Zhu, Hublin, Kaprio, Kristiansson, Sulkava, Paunio, Hveem, Nielsen, Willer, Zwart, Strand, Frayling, Ray, Lawlor, Rutter, Weedon, Redline and Saxena2019). A genetically informed twin design revealed that both short (<7 h per night) and long (>9 h per night) sleep enhanced the heritability of depressed symptoms, suggesting that genetic risk for depressive symptoms rises as twins move away from normal sleep duration (7–8.9 h/night) (Watson et al., Reference Watson, Harden, Buchwald, Vitiello, Pack, Strachan and Goldberg2014). The underlying mechanism of the link between sleep and depression was unknown, and there were numerous potential processes that contribute to the development of depression through sleep. Sleep and the immune system research studies have revealed that sleep improves immunological defences and that afferent signals from immune cells induce sleep, and immune activation and cytokines may have a role in depression symptoms in some individuals (Dunn et al., Reference Dunn, Swiergiel and de Beaurepaire2005; Irwin, Reference Irwin2019). Sleep disturbances were independently associated with an increased risk of major depressive disorder, the experimental stimulation of inflammation activates brain regions that control positive and negative effects, and was related with an increase in depressed mood, particularly in women, while antagonism of endogenous inflammation appeared to decrease depressive symptoms (Irwin and Opp, Reference Irwin and Opp2017). In addition, chronic sleep deprivation may cause alterations in neurotransmitter receptor systems and neuroendocrine response, contributing to the symptomatology of mental disorders (Novati et al., Reference Novati, Roman, Cetin, Hagewoud, den Boer, Luiten and Meerlo2008).
Our research was performed using data from a large nationally representative population sample. NHANES's sampling approach ensures that the sample was selected at random and was representative of the whole American population. There were some limitations to the current study. First, as cross-sectional research, we cannot rule out reverse causality due to the nature of the design; Second, the type of sleep disorder is not clearly defined. Finally, all sleep factors were self-reported, which may have recall bias and lack impartiality when compared to sleep monitoring.
Conclusions
Overall, this study emphasises the independent and combined relationship between sleep-related issues and the risk of depression. Further prospective studies should be conducted to investigate causal or bidirectional relationships between sleep complaints and depression risk. Moreover, it is critical to investigate the genetic association and potential mechanism between sleep complaints and depression, for the effective depression prevention and management.
Supplementary material
The supplementary material for this article can be found at https://doi.org/10.1017/S2045796022000452.
Data
The data that support the findings of this study are openly available at https://www.cdc.gov/nchs/nhanes/index.htm, accessed on 15 June 2022.
Author contributions
Concept and design: Li Chunnan; Shang Shaomei; Acquisition, analysis or interpretation of data: Li Chunnan; Drafting of the manuscript: Li Chunnan; Statistical analysis: Li Chunnan; Obtained funding: Liang Wannian and Shang Shaomei; Administrative, technical or material support: Liang Wannian and Shang Shaomei Supervision: Liang Wannian and Shang Shaomei.
Financial support
This work was supported by the Sanming Project of Medicine in Shenzhen (grant number: SZSM202111001) and the National Key R&D Program of China (grant number: 2020YFC2008800).
Conflict of interest
The authors declare that there is no conflict of interest.
Ethical standards
NCHS Research Ethics Review Board (ERB) Approval, NHANES 2007–2008 (Continuation of Protocol #2005-06), NHANES 2009–2010 (Continuation of Protocol #2005-06), NHANES 2011–2012 (Protocol #2011-17), NHANES 2013–2014 (Continuation of Protocol #2011-17).


 Open access