


Introduction
During infectious disease pandemics, such as influenza or Coronavirus Disease 2019 (COVID-19), or bioterrorism events, preventive medical resources—including vaccines or antibiotics—must be rapidly distributed to large populations. In such public health crises, Points of Dispensing (PODs) represent a core operational strategy for delivering medical countermeasures to affected communities within a limited time frame.Reference Alghanmi, Alotaibi, Alshammari, Alhothali, Bamasag and Faisal1 By concentrating staff, supplies, and logistics at designated sites, PODs enable high-throughput service delivery while maintaining basic standards of safety, documentation, and equity.Reference Alghanmi, Alotaibi, Alshammari, Alhothali, Bamasag and Faisal1,Reference Rebmann, Anthony, Loux, Mulroy and Sitzes2
In public health practice, PODs are commonly categorized as open or closed. Open PODs are community-based dispensing sites that provide vaccines or antibiotics directly to the general public in settings such as schools, sports arenas, and convention centers, whereas closed PODs dispense medical countermeasures only to pre-defined groups (eg, employees or institutional residents) using existing organizational infrastructure and access controls.Reference Rebmann, Loux, Swick, Dolgin, Reddick and Wakefield3,Reference Rebmann, Foesrst, Charney, Mazzara and Sandcork4 Drive-through PODs constitute another distinct type, in which clients remain in vehicles and the primary operational challenges involve traffic and queue management rather than internal walk-through stations.Reference Buck, Cowan, Smith, Duncan, Bazemore and Schwind5 Among the various POD formats, open PODs present particular challenges, including difficulty in predicting visitor volume and arrival timing in advance, which can limit continuous and stable operations. This review focused on fixed-site open PODs because they play a central role in community-wide emergency responses, must accommodate heterogeneous and often unpredictable client flows, and feature internal spatial layouts and process flows that are more directly comparable across jurisdictions than those of closed or purely drive-through PODs.
Successful POD performance depends on the interaction among operational workflow, physical layout, and staffing design.Reference Abbey, Aaby and Herrmann6–Reference Froman, Walser, Lauzardo, Graban and Southwick8 Analyses of prior implementations show that optimizing this triad can notably increase the throughput. For example, at a large COVID-19 vaccination center, Smith, et al reported a 60% reduction in the total process time after applying lean methods that integrated tasks and realigned staffing to smooth patient flow.Reference Smith and Smith9 Although numerous POD operations have been documented, comprehensive, systematic classifications of open POD internal spatial layouts and reviews of station-level strategies for improving efficiency are lacking. The spatial arrangement is a foundational design element of PODs and a crucial determinant of efficiency and safety.Reference Buck, Cowan, Smith, Duncan, Bazemore and Schwind5,Reference Abbey, Aaby and Herrmann6 However, public health guidelines for establishing PODs offer only a single fragmentary layout, limiting flexible adaptation to diverse field conditions.
Therefore, a scoping review was conducted of open POD layout types used for vaccine administration and antibiotic distribution during public health emergencies, from the 2001 anthrax response to the present. The objective of this review was to systematically identify and classify open POD layout types and to summarize station-specific strategies reported to enhance operational efficiency and safety. By mapping spatial layouts, process flows, and associated strategies, this review provides a structured framework to support planners in selecting and adapting POD designs. Consequently, this research addresses two primary questions: (1) what are the potential classifications of open POD layouts? and (2) what efficiency enhancement strategies have been identified at each stage of the workflow?
Methods
Search Strategy
This scoping review followed the Preferred Reporting Items for Systematic Reviews and Meta-Analyses extension for Scoping Reviews (PRISMA-ScR) framework (Appendix 1) and involved targeting major public health emergencies that required on-site PODs, specifically the 2001 United States anthrax attacks, the 2009 influenza pandemic, and the COVID-19 pandemic. The search window spanned from October 1, 2001 through July 31, 2025. Database searches were conducted in PubMed (National Center for Biotechnology Information, National Institutes of Health; Bethesda, Maryland USA), Embase (Elsevier; Amsterdam, Netherlands), and Web of Science (Clarivate Analytics; London, United Kingdom) using two concept blocks: (1) large-scale medication distribution (eg, “points of dispensing,” “mass vaccination,” and “mass prophylaxis”); and (2) specific infectious diseases (anthrax, influenza, and COVID-19). The complete strategy is presented in Appendix 2. Grey literature was excluded because of practical constraints (eg, inconsistent indexing and limited retrievability) which may increase the risk of publication bias. No review protocol was prospectively registered.
Literature Selection Process
From the initial pool of 7,241 records, 1,607 duplicates were removed, leaving 5,634 records for screening. The screening proceeded in two stages. First, two reviewers independently screened the titles and abstracts against the pre-specified inclusion criteria. Second, the same reviewers independently assessed the full texts to confirm eligibility, and the reasons for exclusion were recorded. Disagreements at either the screening or full-text review stage were resolved through discussion between two reviewers; when consensus could not be reached, the corresponding author adjudicated the decision.
Criteria for Literature Selection
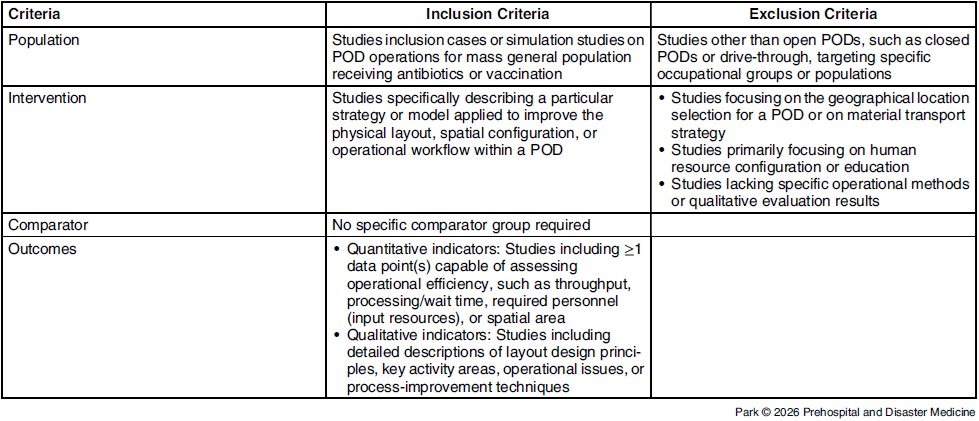
The eligibility criteria for literature selection were defined using the PICO framework (Population, Intervention, Comparator, Outcome) and are summarized in Table 1.
Eligibility Criteria Based on the PICO Framework

Abbreviation: PICO, Population, Intervention, Comparator, Outcome.
For the Population, studies addressing POD operations for mass general populations receiving antibiotics or vaccinations, encompassing both operational case studies and simulation-based research, were included. Studies were excluded if they focused on specific occupational groups or restricted populations, or if they examined dispensing operations other than open PODs.
Regarding the Intervention, eligible studies were required to describe a specific strategy or model aimed at improving the physical layout, spatial configuration, or operational workflow within a POD. Studies primarily concerned with geographic site selection, material transportation strategies, or human resource configuration or training were excluded, as were studies that lacked clearly defined operational methods or qualitative evaluation outcomes.
The PICO Comparator element did not require the presence of a specific comparison group.
For the Outcomes, studies were required to report data that allowed assessment of operational efficiency. This included quantitative indicators, such as throughput, processing or waiting time, required personnel, or spatial area, as well as qualitative indicators, such as descriptions of layout design principles or process-improvement techniques.
Data Extraction and Analysis
The final corpus was stratified into two groups, namely vaccination and antibiotic-distribution PODs. For vaccination PODs, data regarding site characteristics (country, facility type, and area), process features (reservation, reception, screening, administration, observation, and post-vaccination registration), and simulation use were extracted. The operational and efficiency variables included operating hours, staffing, number of stations, stage-specific processing times, staff utilization, total processing time, overall throughput, and vaccinator-normalized throughput (doses per vaccinator per hour). For antibiotic PODs, similar site characteristics and process features (reservation/entry, screening, distribution, and improvement initiatives) were collected, along with the same operational and efficiency indicators. A quantitative meta-analysis was not feasible because many studies omitted crucial measures and used inconsistent time definitions; hence, a narrative synthesis was applied to organize themes and enable comparison.
Results
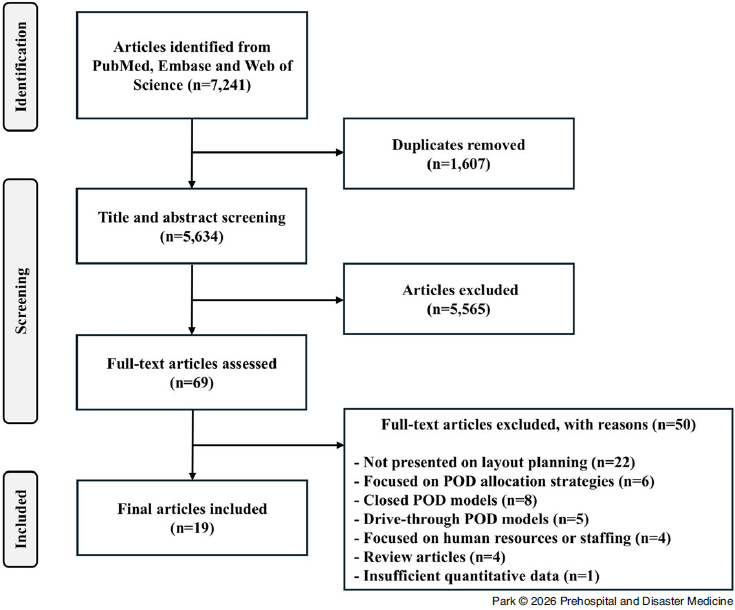
The study selection process is illustrated in Figure 1. Of the 5,634 unique records screened after deduplication, 69 underwent a full-text review, yielding 19 eligible studies. All vaccination PODs were implemented during the COVID-19 pandemic, whereas all antibiotic-distribution PODs were designed for anthrax exposure scenarios. No study had examined hybrid PODs that concurrently provided vaccination and antibiotic distribution. Thirteen studies addressed vaccination POD operations and six addressed antibiotic-distribution POD operations. Given the procedural differences between these POD types, vaccination and antibiotic-distribution POD results are presented separately, with detailed layout types provided for each.
PRISMA Flow Chart Illustrating the Process of Selecting Articles.
Abbreviations: PRISMA-ScR, Preferred Reporting Items for Systematic Reviews and Meta-Analyses extension for Scoping Reviews; POD, point of dispensing.

Classification of Vaccination PODs
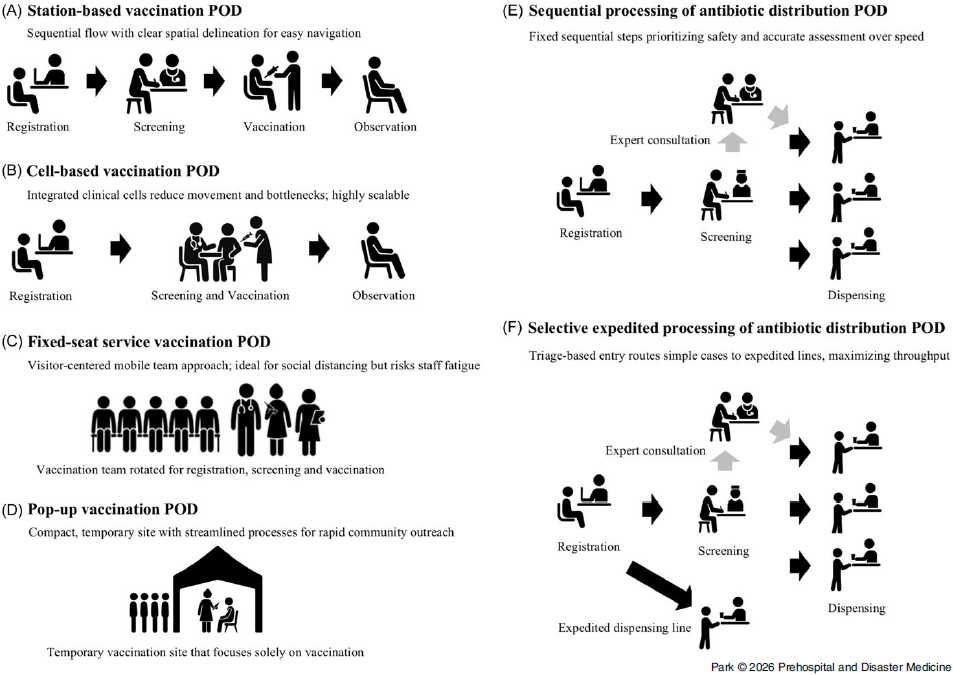
Vaccine-administration POD layout types can be grouped into four types, namely traditional station-based sequential-flow (station-based), cell-based sequential-flow (cell-based), fixed-seat service, and pop-up PODs. An illustration of the classification is shown in Figure 2.
Illustrative Overview of Open POD Layout Types for Vaccination and Antibiotic Distribution: (A) Station-Based Vaccination POD. (B) Cell-Based Vaccination POD. (C) Fixed-Seat Service Vaccination POD. (D) Pop-Up Vaccination POD. (E) Sequential Processing of Antibiotic Distribution POD. (F) Selective Expedited Processing of Antibiotic Distribution POD. Abbreviation: POD, point of dispensing.

Station-based POD is characterized by a sequential progression through discrete stations, including reception, screening, vaccination, post-vaccination observation, and registration.Reference Kitro, Tippong and Sirikul10–Reference Wood, Murch and Moss13 A fundamental principle emphasized in such PODs is clear spatial delineation, which allows staff and visitors to understand the procedural flow easily. Conversely, cell-based POD retains the same overall sequence but involves consolidating multiple functions into integrated clinical cells. Core activities, such as screening and vaccination (usually with registration), occur within a single station, reducing unnecessary movements, shortening queues, and accelerating processing.Reference Smith and Smith9,Reference Signorelli, Odone and Gianfredi14–Reference Wood, Moss and Murch18 Comparative analyses indicated that the cell-based model outperformed the traditional station-based POD in efficiency, waiting time reduction, and spatial utilization. Smith, et alReference Smith and Smith9 demonstrated that a large-scale COVID-19 vaccination center using a cell-based POD reduced the processing time (excluding post-vaccination observations) from 1,020 seconds to 400 seconds, achieving a 60.8% reduction.Reference Smith and Smith9 This improvement was attributed to fewer bottlenecks, enhanced collaboration among multidisciplinary staff, and the elimination of redundant tasks, such as repeated identity checks. Additionally, the cell-based design offered modularity, allowing each cell to operate as an independent unit, which could be scaled up or down according to the visitor volume, improving staff utilization.
The fixed-seat service POD differs fundamentally from sequential-flow types. Rather than requiring visitors to move between stations, individuals remain seated in assigned chairs while a mobile vaccination team, typically comprising a physician, two nurses, and administrative personnel, rotates among them to deliver all the necessary services.Reference Hsiao, Huang and Huang19 Hsiao, et alReference Hsiao, Huang and Huang19 described an implementation in Taiwan’s Expo Dome where 18 parallel blocks each contained 84 seats, arranged in 3×28 rows with one-meter spacing for social distancing. Each team vaccinated 80-150 people per hour, with an average visitor stay of 25 minutes. In this model, the critical factor was the speed at which vaccination teams circulated, rather than visitor flow. This approach is visitor-centered, accommodating those with mobility limitations while naturally maintaining social distancing. However, continuous team movement can cause staff fatigue.
Pop-up POD is a small-scale, temporary vaccination site that focuses solely on vaccination while streamlining ancillary processes. Its compact design allows for rapid setup and relocation, making it suitable for communities where large-scale PODs are impractical.Reference Lawson, Clark and Geraghty20 The pop-up POD model, developed in the United States during the COVID-19 response, contrasted with the Federal Emergency Management Agency (FEMA; Washington, DC USA) standards, which required at least 43 staff members for 230m2 and 17.3 minutes per vaccination. Conversely, the pop-up POD involved only 15 staff members at 210m2 and achieved a two-minute vaccination time. Over 12 hours, a single site could vaccinate 720 individuals, far surpassing FEMA’s target of 250. This efficiency was achieved through several strategies, including integrating check-in with health screening, positioning syringe preparation assistants adjacent to vaccinators, decoupling vaccination registration from clinical tasks, and handling paperwork independently of visitor flow during and, when needed, after operating hours. Additional measures included deploying prepared supply kits at each station rather than relying on a central pharmacy.
Improvement Strategies for Each Step of the Vaccine-Administration POD Process
The process enhancement results are presented in Table 2. The unexpected influx of many visitors can cause bottlenecks throughout the process, leading to increased waiting times and difficulties in social distancing.Reference Smith and Smith9,Reference Jerbi and Masmoudi12,Reference Wood, Murch and Moss13,Reference Calegari, Bisesti and Pazzaglia16–Reference Wood, Moss and Murch18 Therefore, most studies controlled visitor numbers and flow rates through an appointment system. However, evidence supporting optimal appointment scheduling volumes during operating hours is lacking. To address this, Wood, et alReference Wood, Moss and Murch18 used discrete-event simulations to calculate the optimal number of appointments based on the POD actual processing capacity. Their analysis revealed that the initial plan targeting 1,560 people per day caused severe bottlenecks during the vaccination phase, with queues growing continuously, rendering the actual operation unfeasible. Based on the simulation results, they recommended capping daily appointments at 1,247 and limiting vaccination staff members to six.
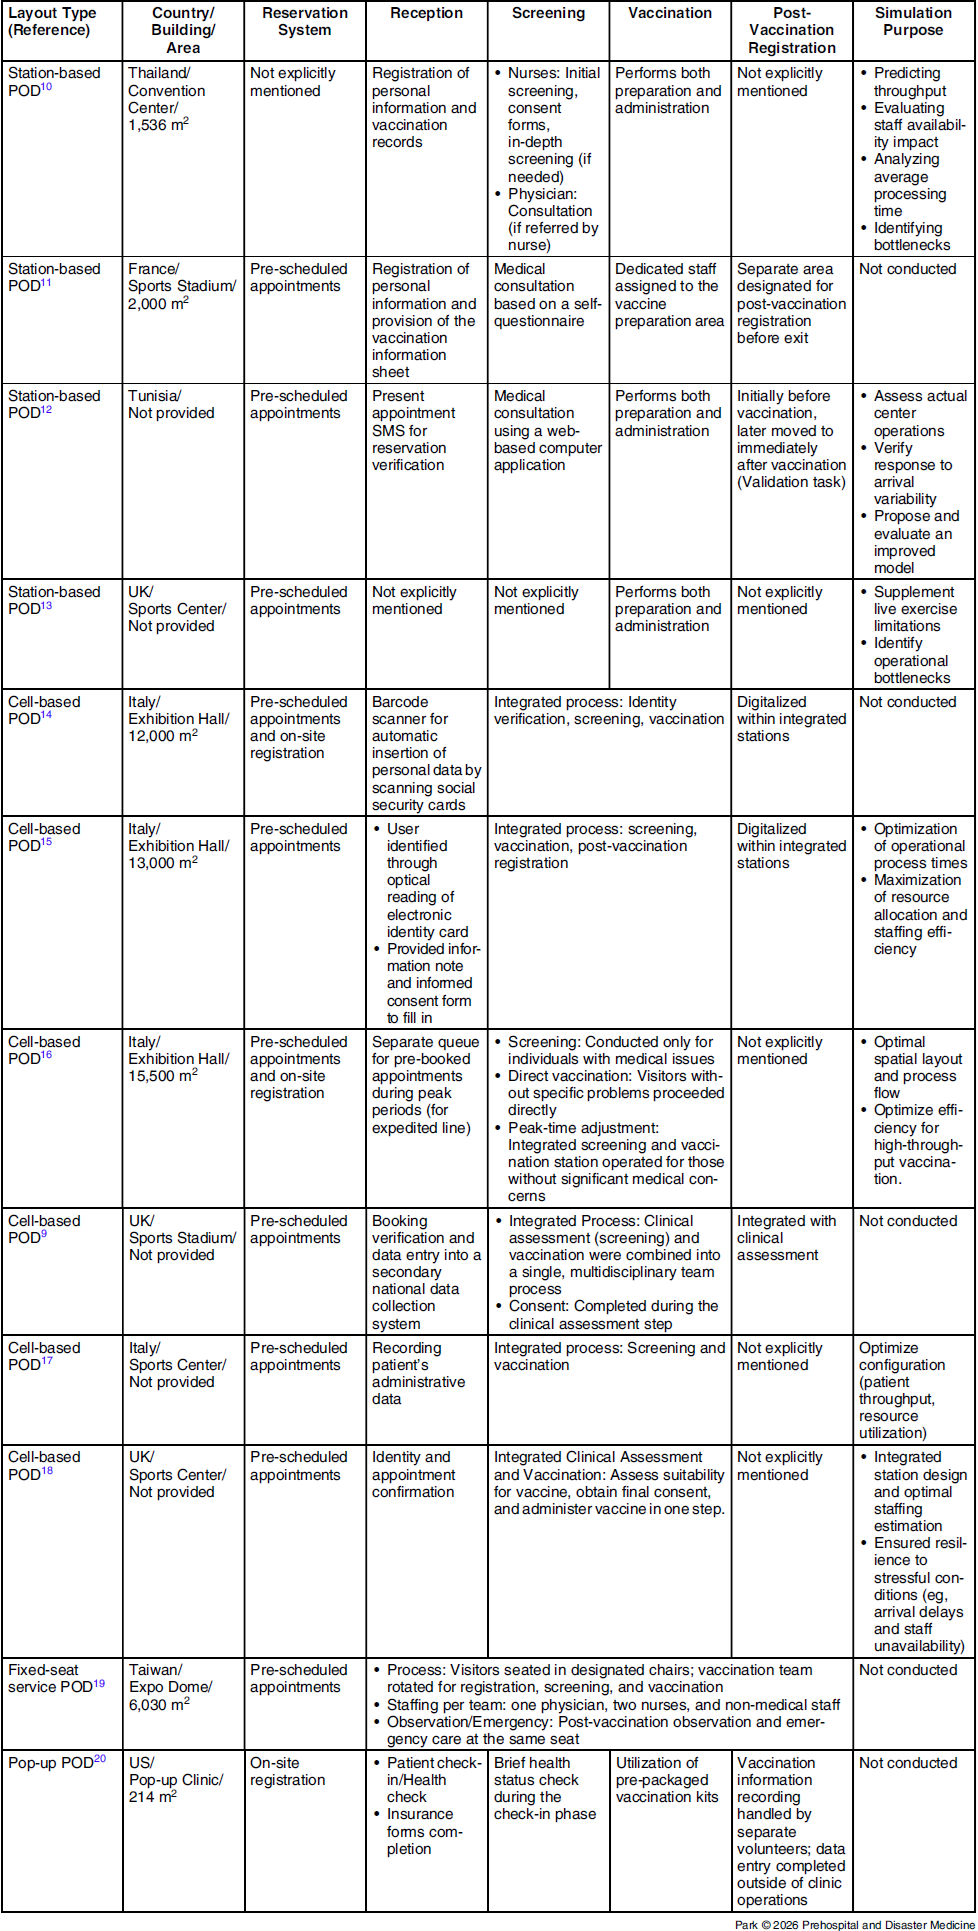
Layout Types and Actual Operational Features of Vaccination Points of Dispensing (PODs)

Abbreviation: POD, point of dispensing.
Screening, a pre-vaccination medical assessment used to determine eligibility, typically takes one-to-ten minutes.Reference Smith and Smith9,Reference Kitro, Tippong and Sirikul10,Reference Jerbi and Masmoudi12–Reference Signorelli, Odone and Gianfredi14,Reference Sala, D’Urso and Giardini17,Reference Wood, Moss and Murch18 Two approaches are reported: (1) visitor self-assessment forms that are verified by staff, primarily used as an operational triage to route only those requiring medical consultation;Reference Le Bagousse-Bernard, Dussart and Pin11 and (2) clinician-led interviews in which health care personnel ask and record responses and make the eligibility decision directly.Reference Smith and Smith9,Reference Kitro, Tippong and Sirikul10,Reference Jerbi and Masmoudi12,Reference Signorelli, Odone and Gianfredi14–Reference Wood, Moss and Murch18 Using a self-questionnaire to triage patients, those not requiring medical consultation reached vaccination in a mean period of 12 minutes versus 16 minutes with consultation, with a four-minute reduction in the no-consultation group. Multi-stage pathways that required specialist review increased complexity and were associated with longer screening times (mean 12.2 minutes).Reference Kitro, Tippong and Sirikul10 In contrast, a single-step, clinician-led screening, supported by digital intake, demonstrated notably higher efficiency. Jerbi, et alReference Jerbi and Masmoudi12 reported sub-one-minute screening times using a web-based questionnaire reviewed by the clinician. Overall, the evidence indicated that a one-pass clinician-led screening, which is optionally front-loaded with digital tools, was the most time-efficient approach.
Vaccination, the core step of vaccine POD, follows immediately after screening and typically takes two-to-three minutes per recipient.Reference Kitro, Tippong and Sirikul10,Reference Jerbi and Masmoudi12,Reference Wood, Murch and Moss13,Reference Sala, D’Urso and Giardini17,Reference Lawson, Clark and Geraghty20 Beyond the injection, this stage usually includes syringe preparation and brief post-vaccination counseling. To shorten the cycle time at the vaccination station, sites have implemented the following strategies: (1) seating two recipients per table to enable parallel preparation and rapid turnover; and (2) assigning vaccination assistants to handle dilution and syringe preparation, allowing vaccinators to focus solely on injections.Reference Kitro, Tippong and Sirikul10,Reference Jerbi and Masmoudi12,Reference Lawson, Clark and Geraghty20 Some types centralized dilution and syringe preparation in a dedicated area, such as a pharmacy-based prep room, supplying ready-to-use doses to each station and further reducing workload at the stations.Reference Le Bagousse-Bernard, Dussart and Pin11,Reference Signorelli, Odone and Gianfredi14,Reference Wood, Moss and Murch18
Resources and Efficiency Metrics Used in Vaccine POD Operations
Although each study reported the resources used in vaccination operations, such as facility area, daily operating hours, total staff involved, and the total number of vaccinations administered per day, many studies have not clearly presented efficiency metrics, such as staff utilization rate, throughput per hour, throughput per vaccination staff per hour, and total time spent within the facility, limiting the ability to perform comparative analysis. Among the studies that reported efficiency metrics, the highest throughput per vaccination staff per hour was 31.6 for the station-based POD, 27.5 for cell-based POD, 26.7 for fixed-seat service, and 30.0 for pop-up POD types.Reference Jerbi and Masmoudi12,Reference Oliani, Savoia and Gallo15,Reference Hsiao, Huang and Huang19,Reference Lawson, Clark and Geraghty20 This indicates that vaccination staff members on average processed approximately one person every two minutes, which was close to the maximum efficiency, given that actual clinical vaccination typically takes approximately one-to-two minutes per person. Based on these results, it could be inferred that similar vaccination efficiency levels could be achieved regardless of the POD layout types. A thorough evaluation should incorporate additional metrics, including staff utilization and operational efficiency, in relation to the spatial dimensions of the facility. However, most studies lack basic operational information.
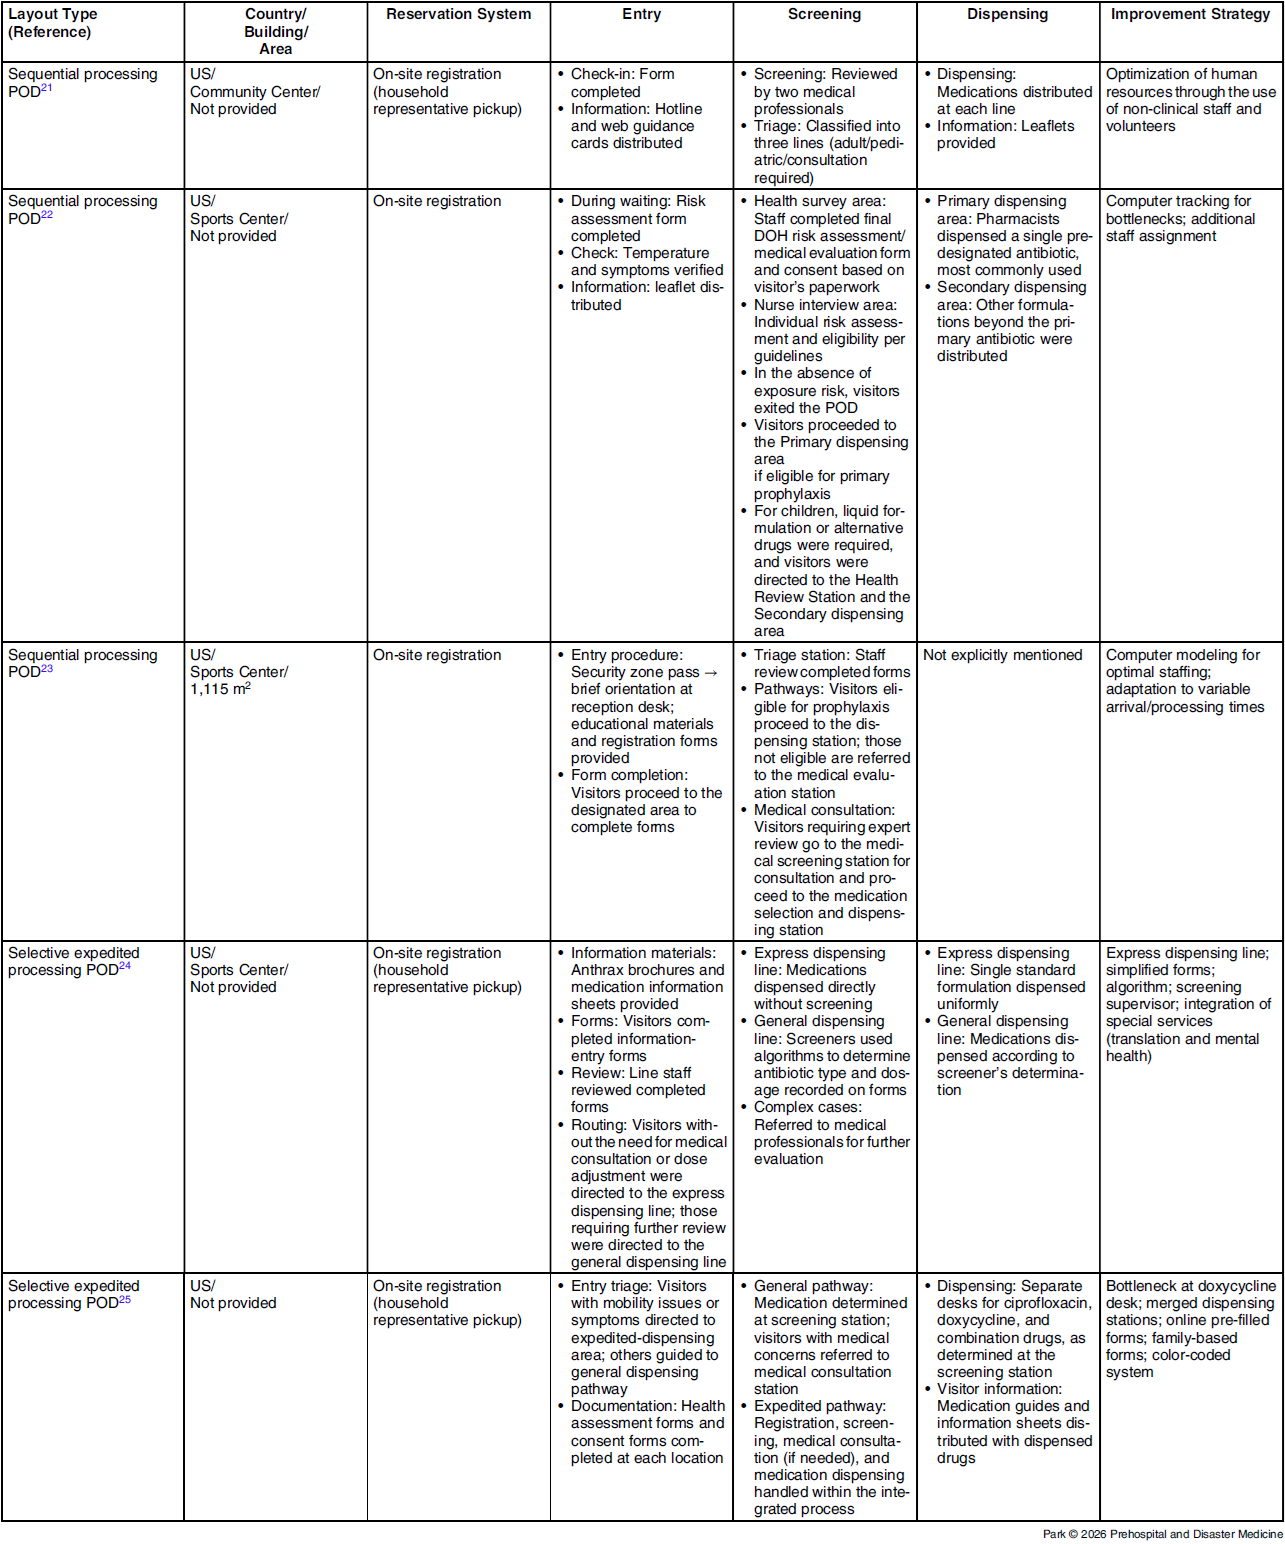
Classification of Antibiotic-Distribution PODs
In contrast to vaccination PODs, where medical interventions are conducted, antibiotic-distribution PODs primarily involve dispensing pre-determined antibiotic dosages, which reduces the need for medical personnel in the dispensing area. Furthermore, a post-vaccination observation zone is not required. The operational flow of an antibiotic-distribution POD comprises initial orientation, triage with health status assessment, detailed screening and medication determination, and medication dispensing.
The POD layout types reported in previous studies share broadly similar structures that can be categorized into two primary types, distinguished by whether a branched, expedited-dispensing stream is created at the entrance. In the sequential-processing POD, visitors proceed through a fixed series of steps after entry and are routed to a designated station for additional review when specific conditions are identified (eg, allergies, comorbidities, symptom onset, or the need for dose adjustment).Reference Stergachis, Wetmore and Pennylegion21–Reference Spitzer, Hupert and Duckart23 This model prioritizes accurate assessments and safety over speed. In the selective expedited-processing POD, simple cases are screened at the entrance, and eligible visitors are diverted to an expedited-dispensing line to improve the overall throughput.Reference Agócs, Fitzgerald and Alles24,Reference Kilianski, O’Rourke and Carlson25 Agocs, et alReference Agócs, Fitzgerald and Alles24 directed visitors not requiring consultation or dose adjustment to an expedited line and reduced the median processing time to three minutes, compared with eight minutes on the general line. Conversely, Kilianski, et alReference Kilianski, O’Rourke and Carlson25 sent visitors with mobility issues or symptoms to an expedited line and observed an average processing time of 3.24 minutes, which was shorter than the five-to-twelve minutes observed for the general route. An illustration of the classification is shown in Figure 2.
Improvement Strategies for Antibiotic-Distribution POD Processes
Strategies for improving the efficiency of each step in the antibiotic-distribution POD are summarized in Table 3. In contrast to vaccination PODs, studies on antibiotic distribution involved using an on-site registration process. To reduce the number of visitors and alleviate congestion, some PODs implemented a model in which the household head collected antibiotics on behalf of all family members.Reference Stergachis, Wetmore and Pennylegion21,Reference Agócs, Fitzgerald and Alles24,Reference Kilianski, O’Rourke and Carlson25 However, this approach had several limitations. First, the household head may not have fully understood the medication instructions for all family members. Second, the accuracy and completeness of the information relayed by household representatives may be compromised. Third, requiring each family member to complete self-screening questionnaires and consent forms can be time-consuming. However, most studies suggest that a family distribution model centered on the household head, if properly supplemented, would be more effective in speed and congestion management.
Layout Types and Actual Operational Features of Antibiotic-Distribution Points of Dispensing (PODs)

Abbreviation: POD, point of dispensing.
At all PODs, visitors completed a standardized self-questionnaire in a designated area or while queuing, which was universally used as the basis for screening to determine the medication to dispense. Screening approaches are categorized into two types, namely a single-step approach (in which the medication decision is made in one pass) and a two-step approach (which escalates to expert consultation when additional judgment is needed). Previous studies did not report the specific screening times for single-step approaches. In two-step approaches, Spitzer, et alReference Spitzer, Hupert and Duckart23 reported screening times of 10.2-19.8 seconds and 31.2 seconds for the first and second screening, respectively.
The dispensing area is operationally critical in antibiotic-distribution PODs. In practice, the distribution is commonly organized into separate streams. Stergachis, et alReference Stergachis, Wetmore and Pennylegion21 routed visitors to color-coded lines after screening, as follows: green for standard adult doses, blue for pediatric suspensions, and orange for participants requiring dose adjustments owing to contraindications or comorbidities. Similarly, Doyle-Moss, et alReference Doyle-Moss22 separated dispensing by assigning a primary area to pre-assigned standard antibiotics and a secondary area to nonstandard agents and suspensions. The principal advantage of this separation is improved accuracy and more rapid handoffs at each dispensing station. However, demand imbalances across streams can create line-specific bottlenecks that reduce the overall throughput.Reference Kilianski, O’Rourke and Carlson25
Resources and Efficiency Metrics for Antibiotic-Distribution POD Operations
Similar to those of the vaccine-distribution POD studies, many efficiency metrics have not been reported in some cases, limiting direct comparisons between studies. Overall, the average time visitors spent from entry to exit ranged from six-to-ten minutes, and the total dispensing volume was approximately 250-1,000 units/hour. Notably, Agocs, et alReference Agócs, Fitzgerald and Alles24 documented the highest throughput, dispensing to 1,060 individuals/hour, with 106 units/distributor/hour, in a selective expedited-processing POD using a household-head-centered family distribution model. They reported that simple paperwork minimization and a rule-based algorithmic screening workflow substantially amplified overall efficiency.Reference Agócs, Fitzgerald and Alles24
Discussion
This study involved reviewing past cases of open POD operations to classify POD layout types and to explore approaches for improving efficiency at each workstation. Vaccination PODs can be broadly categorized into traditional station-based PODs; cell-based PODs, which integrate several stations into a single function; fixed-seat service PODs, in which medical staff move as a team to deliver services while visitors remain seated; and pop-up PODs, which focus solely on vaccination while streamlining and simplifying other procedures. Conversely, antibiotic-distribution PODs include sequential-processing PODs, where visitors go through all steps sequentially but are directed to separate branching stations under certain conditions, and selective expedited-processing PODs, which involve early sorting of visitors meeting specific criteria at the entry stage for faster processing. Various improvement strategies aimed at enhancing the efficiency of workstations have been proposed.
Evaluating the effectiveness of various layout types and workstation-level improvements should be based on comparable efficiency metrics; however, standardized indicators have not been established. Previous reviews have reported measures such as total throughput, hourly throughput, vaccinations/dispenses per staff member, total time spent in the facility, and waiting time.Reference Shakory, Eissa and Kiran26–Reference Jerbi29 These metrics, however, are highly context dependent and influenced by factors such as POD area, staffing levels, and operating hours. Therefore, consolidating and standardizing efficiency indicators—clearly defining core measures and, where appropriate, specifying context-adjusted variants—are crucial to enable valid comparisons across POD designs and settings.
The workforce utilization rate is a crucial metric for monitoring POD operations. It is defined as the amount of time personnel are assigned to a specific workstation that provides a service divided by the total operating time of that station. A low utilization rate indicates considerable idle time for the staff, suggesting that the preceding flow is not smooth. Conversely, if the rate is excessively high, staff fatigue increases, which can affect service quality. According to queuing theory, as workforce utilization approaches 1.0, the waiting time and queue lengths increase exponentially.Reference Little30 Notably, when utilization exceeds 0.8, an inflection point occurs, where even a small increase causes a sharp deterioration in the queue performance. These criteria can serve as useful indicators to determine the appropriate number of personnel at each stage. In a real-world example, Wood, et alReference Wood, Murch and Moss13 planned for six vaccination staff assuming a 12-hour daily operation; however, the simulation results showed a workforce utilization rate of 1.0 at the vaccination station. To address this, the research team adjusted visitor arrival rates and expanded the pre-vaccination waiting area.Reference Wood, Murch and Moss13
Simulation is the foundation of POD design and management, as it allows the consequences of layout configurations, staffing, and policy decisions to be evaluated before implementation. By incorporating realistic arrival patterns (including surges and time-of-day peaks), service-time variability, and resource constraints, simulation supports what-if analysis, identifies bottlenecks, and quantifies tradeoffs among throughput, total time spent in facilities, and workforce utilization. It enables planners to size teams, position stations, test queue configurations, and stress-test contingency plans (eg, supply delays or staff no-shows). Additionally, it can help set appointment ceilings consistent with the available workforce capacity. A simulation by Wood, et al showed that the initially planned 1,560 daily appointments were unsustainable, justifying a reduction in scheduled visitors; furthermore, the simulation indicated that downsizing registration and clinical-evaluation staff to one-sixth of the original level did not compromise performance, highlighting the potential for targeted reallocation to preserve throughput.Reference Wood, Moss and Murch18 In practice, combining simulation with a simple design of experiments or experimental optimization helps identify robust layout configurations and staffing policies that remain effective under realistic variability.
The findings of this review should be interpreted in light of limitations inherent in the underlying evidence base. Overall, the literature is characterized by substantial methodological heterogeneity, with most included studies consisting of observational case descriptions or simulation-based evaluations that frequently relied on non-standardized outcome definitions. As a result, data on throughput, waiting time, or client length-of-stay were often incomplete, derived from small samples, or not directly comparable across studies. Only a limited number of investigations prospectively compared alternative open POD layout types under similar conditions. Reporting of contextual factors—such as vaccine or antibiotic supply, characteristics of the target population, and availability of staff or volunteers—was heterogeneous and frequently sparse. These limitations constrain the strength of inferences regarding the superiority of specific layout types or efficiency strategies and suggest that the layouts and approaches summarized in this review should be regarded as context-dependent options rather than definitive best practices.
Limitations
This study had some limitations. First, most included studies were observational or simulation-based and heterogeneous in design, which may limit the generalizability of the findings. Second, if the POD operation plan focuses solely on efficiency, the operational staff may become overloaded, causing critical errors such as medication dispensing mistakes. Efficiency usually involves safety tradeoffs. Thus, further consideration is needed regarding POD safe operations. Finally, there are concerns regarding the appropriateness of the terminology used in this study. Although various detailed workflows were conceptually structured and integrated into a unified classification, the chosen terms may not fully capture the underlying concepts, warranting further discussion.
Conclusions
This study reviewed previous studies published from 2001 onward, classifying open POD layouts types into vaccination and antibiotic-distribution PODs. Additionally, efficiency improvement strategies were summarized for each process. The classifications of POD layout types and efficiency improvement strategies presented in this study offer practical evidence for practitioners designing and operating PODs during future public health emergencies, serving as a framework for developing more effective and standardized POD operation guidelines.
Conflicts of interest/funding
This research was conducted without the support of any funding sources. The author declares no conflicts of interest related to this study.
Supplementary Materials
To view supplementary material for this article, please visit https://doi.org/10.1017/S1049023X26108838
Author Contributions
Conceptualization: Yubin Seo.
Data Curation: Yubin Seo.
Investigation: Jin Ju Park.
Writing – Original Draft: Jin Ju Park.
Writing – Review & Editing: Jin Ju Park, Sun Hee Na, Hyejin Park, Jacob Lee.
Visualization: Yubin Seo.
Use of AI Technology
AI assistance (ChatGPT; OpenAI: San Francisco, California USA) was used for illustration only.


 Open access